
Abstract
Based on a field expedition to the Dalangtan (DLT) saline playa located in a hyperarid region (Qaidam Basin) on the Tibet Plateau and follow-up investigations, we report the mineralogy and geochemistry of the salt layers in two vertical stratigraphic cross sections in the DLT playa. Na-, Ca-, Mg-, KCaMg-sulfates; Na-, K-, KMg-chlorides; mixed (K, Mg)-chloride–sulfate; and chlorate and perchlorate were identified in the collected samples. This mineral assemblage represents the last-stage precipitation products from Na-K-Mg-Ca-Cl-SO4 brine and the oxychlorine formation from photochemistry reaction similar to other hyperarid regions on Earth. The spatial distributions of these salts in both stratigraphic cross sections suggest very limited brine volumes during the precipitation episodes in the Holocene era. More importantly, sulfates and chlorides with a high degree of hydrations were found preserved within the subsurface salt-rich layers of DLT saline playa, where the environmental conditions at the surface are controlled by the hyperaridity in the Qaidam Basin on the Tibet Plateau. Our findings suggest a very different temperature and relative humidity environment maintained by the hydrous salts in a subsurface salty layer, where the climatic conditions at surface have very little or no influence. This observation bears some similarities with four observations on Mars, which implies not only a large humidity reservoir in midlatitude and equatorial regions on Mars but also habitability potential that warrants further investigation.
1. Introduction
A
In 2008, our team initiated a study of a saline playa, Dalangtan (DLT), and its surroundings in a hyperarid region (Qaidam Basin) on the Tibet Plateau in China, as a potential analog to salt deposits on Mars (Kong et al., 2009, 2010; Mayer et al., 2009; Sobron et al., 2009; Wang and Zheng, 2009, 2014; Zheng et al., 2009). This article belongs to a series of three reports published in this volume and describes the salt mineralogy and geochemistry in subsurface samples collected from two vertical stratigraphic cross sections in the DLT saline playa.
We hypothesize that, in extremely dry regions, the hydrous salts in subsurface salty layers could retain high degrees of hydration. Such subsurface salty layers would provide a quasiclosed system with relative high relative humidity (RH) levels for long periods. This hypothesis was built on a well-constrained thermal model (Mellon et al., 2004, 2008, 2009) of a two-layer regolith with large differences in the thermal inertia (TI). The model predicts that a subsurface layer composed of high TI material would have T-RH profiles that are very different from those of a surface layer featuring low TI compounds. This investigation of the hydration degree of subsurface hydrous salts in a hyperarid region (DLT in the Qaidam Basin) could validate this hypothesis.
1.1. DLT saline playas on Tibet Plateau
The Qinghai-Tibet (QT, or simply Tibet) Plateau in southwest China is the world's highest and largest plateau, stretching ∼1000 km north to south and about ∼2500 km east to west. It has been called “the third pole” of Earth, with an average elevation exceeding 4500 m above sea level (14,800 ft asl) (Fig. 1). Five massive east to west spreading mountain chains were formed by intercontinental convergence and N-S compression during the Eocene period (Lao and Liu, 1996; Chen et al., 2002; Yin et al., 2008). The Himalayan Mountain chain has the highest average elevation, ∼6100 m. The Qaidam Basin (in which DLT occurs), near the northwest edge of the Tibet Plateau (Fig. 1), has the lowest average elevation, ∼3000 m.
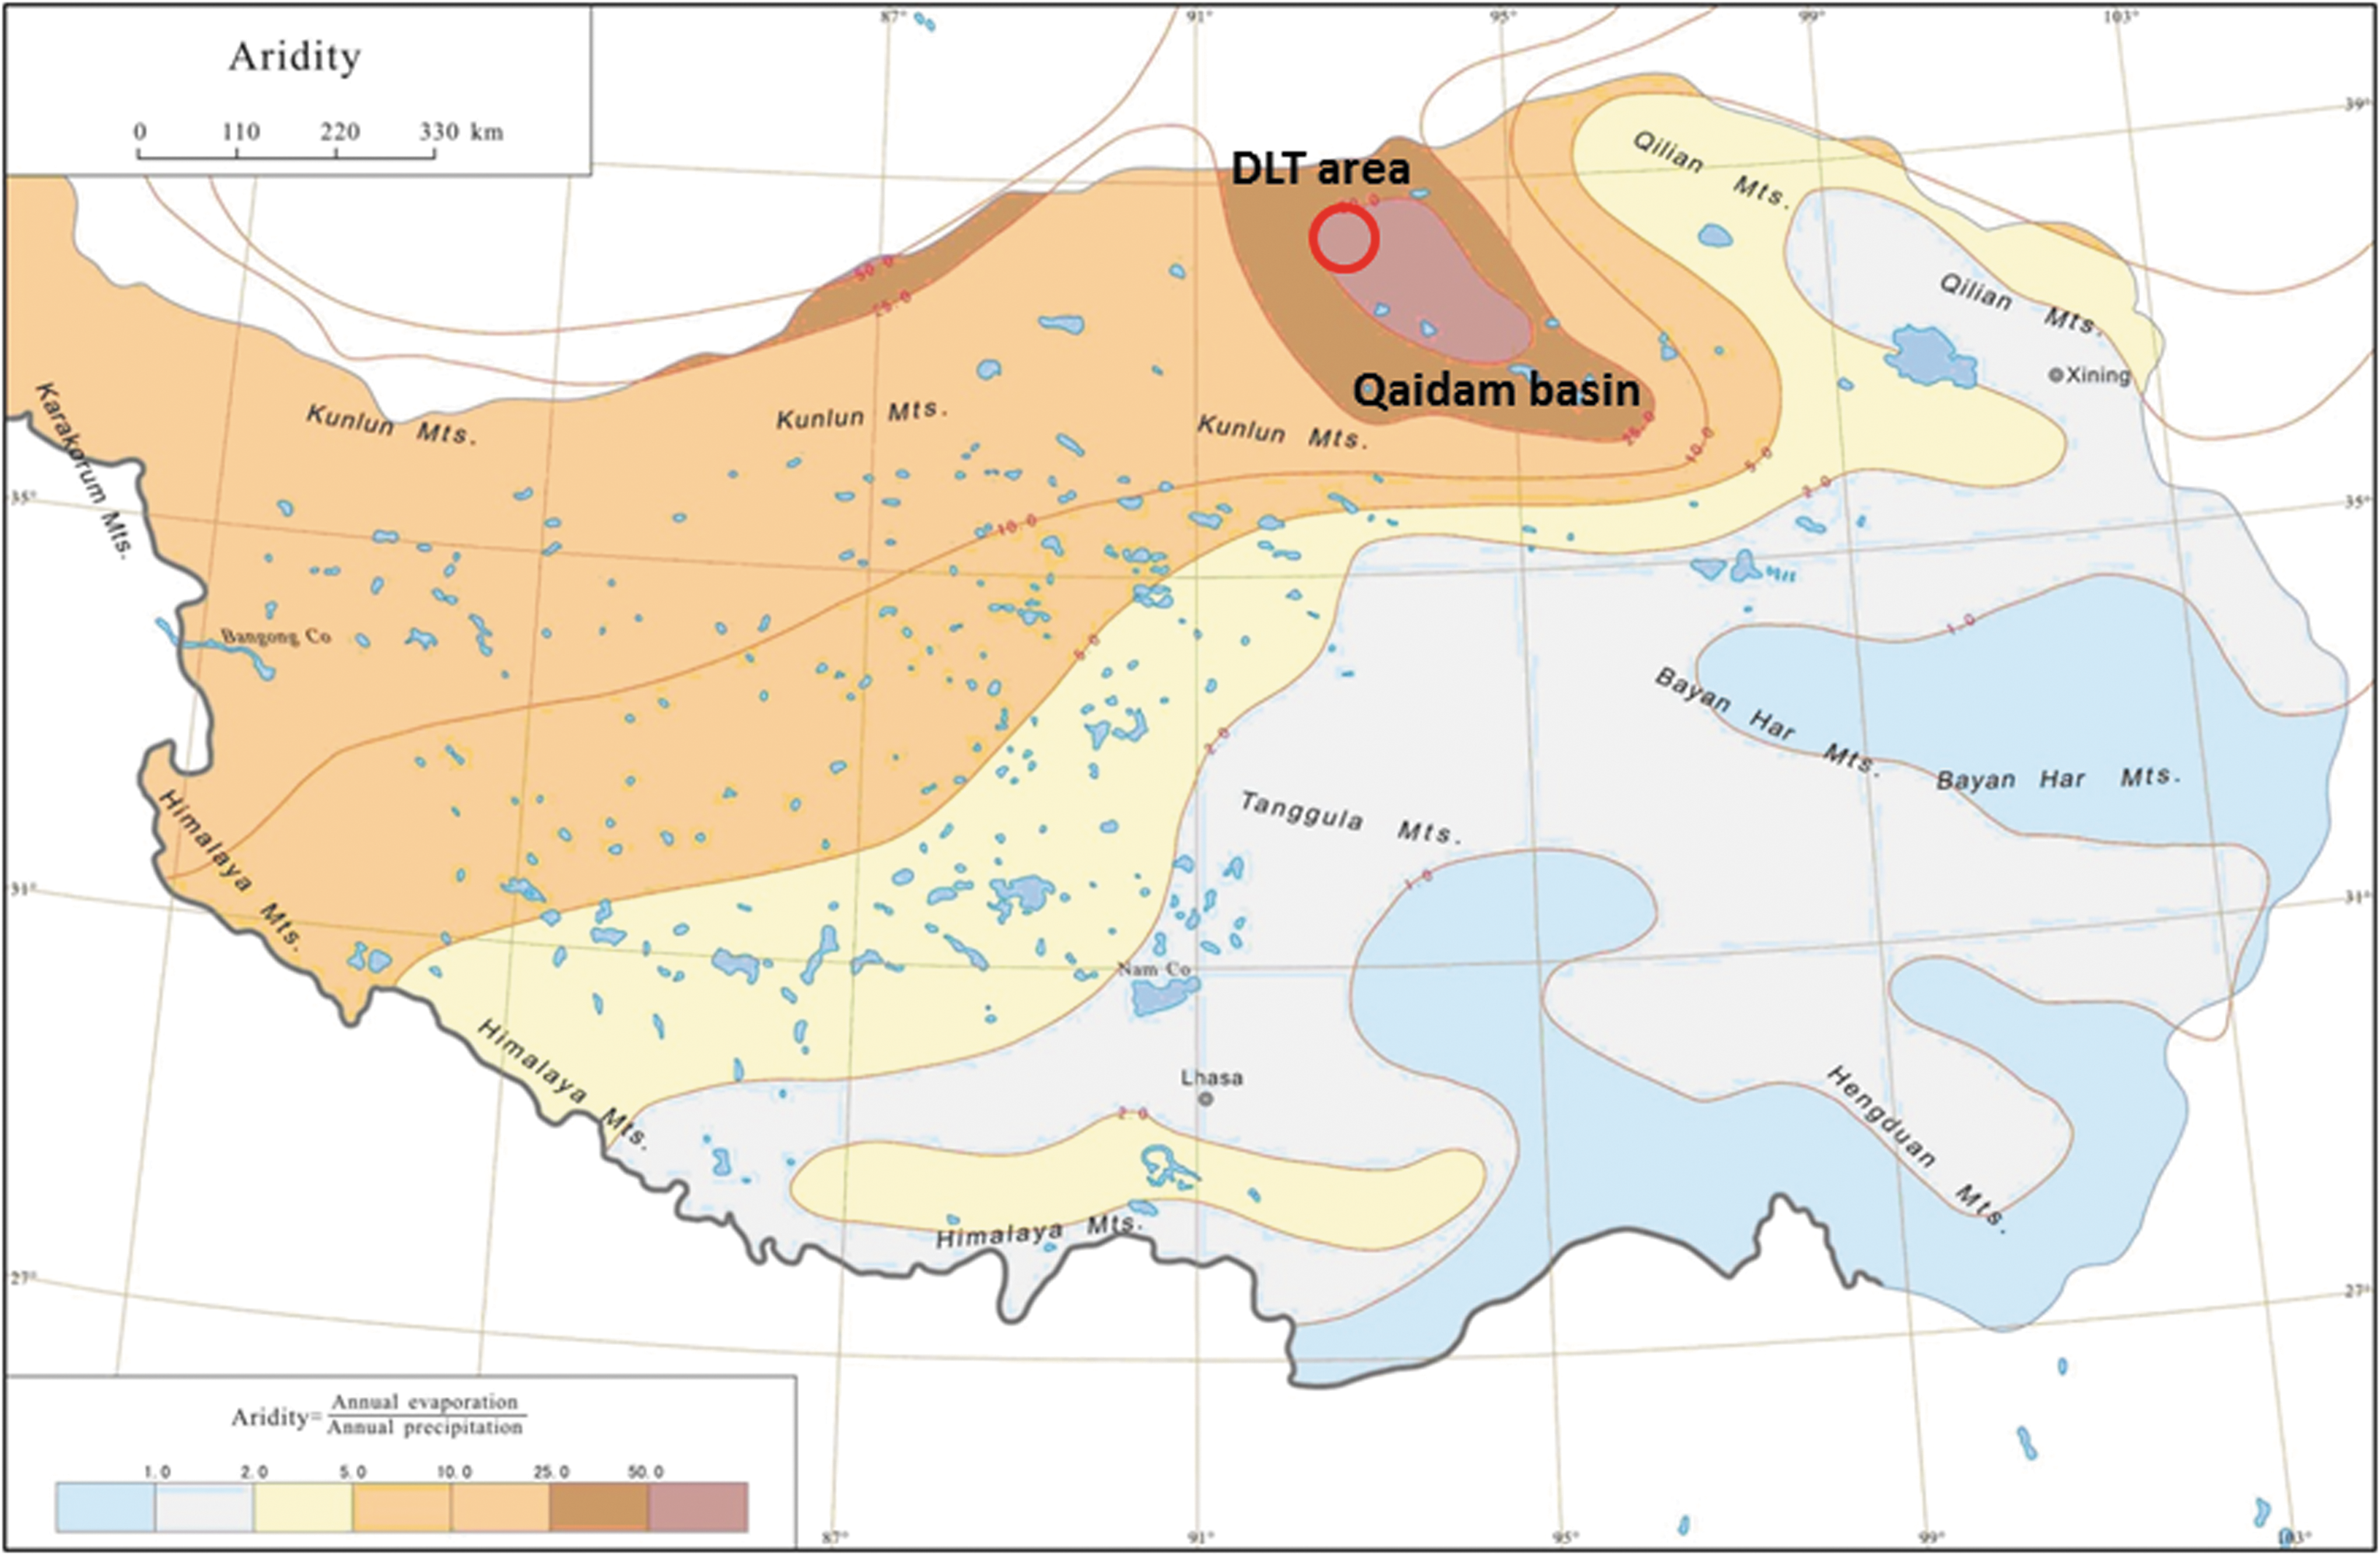
Aridity map of Tibet Plateau, China. Due to the blockage of humid air from the Indian Ocean by the five east to west oriented massive mountain chains, especially the Himalaya mountain chain with the highest average elevation, ∼6100 meters, the regional aridity on Tibet Plateau increases from east to west. Qaidam Basin (dark brown color) has the highest aridity. Dalangtan (DLT) area (red colored circle) is the driest spot, where the measured aridity index (AI = annual precipitation/annual evaporation) at discrete locations reaches 0.04–0.008. The blue colored small patches in this map are lakes, with salinity increasing gradually from south to north.
As a result of the continuous uplift of the Tibet plateau, atmospheric circulation over the area underwent repeated vertical and horizontal differential changes that induced regional climatic variations. Particularly, the Himalayan Mountain chain largely blocks the pathway of humid air from the Indian Ocean monsoon (Wang, 2006) toward the northwest edge of Tibet Plateau. As a consequence, the Qaidam Basin (N36–39°, E88–100°) has the highest aridity on the Tibet Plateau (Fig. 1, where the Aridity is defined as the reciprocal of the internationally defined aridity index, AI = annual precipitation/annual evaporation). The Qaidam Basin is a hyperarid region by international climate classification, where the average AI is 0.02 (Kong et al., 2018, this issue), with AI values of 0.008–0.04 recorded at discreet locations (Zheng and Xiang, 1989).
The monsoon blockage by the Himalayas controls the rainfall and evaporation rates of regional lakes on the Tibet Plateau (Fig. 1; Huang et al., 1993; Zheng, 1997) and produces variations in the salinity of lake waters and the nature of sedimentary lake deposits. The salinity variation is evidenced by a segregation of fresh water lakes in the south, brackish water lakes in the central region, and saline lakes and saline playas in the northwest areas of the QT Plateau, particularly in Qaidam Basin (Zheng, 1997; Xiao et al., 2017). Among the saline playas in the region (Kong et al., 2018, this volume), the DLT saline playa (38°32′56.85″N, 91°24′28.03″E) occurs in the driest region (Fig. 1) of the Qaidam Basin. The DLT area (38°0′–38°40′N, 91°10′–92°10′E) spans ∼250 × 160 km and is filled with anticlines and depressions generated by tectonic activity (Fig. 2a). The DLT saline playa occurs in a depression (dark region in Fig. 2b). The DLT saline playa has the most ancient deposit (Eocene–Oligocene) in the Qaidam Basin (Zheng, 1997). A deep drill ZK 312 (Wei et al., 1989) at the DLT playa found the salt deposits of Pleistocene age at 440 m depth containing epsomite, bloedite and polyhalite (Wang et al., 1993) with Holocene salt deposits filling the top layer of ∼12.9 m. Mg-sulfates, the predominant mineral phases found in the evaporative salt deposits in the DLT playa salts, mark the latest stage of the evaporation sequence from K-Na-Ca-Mg-Fe-C-B-S-Cl-bearing brines.

Quick-bird satellite images
In addition, other environmental conditions at the DLT, controlled by the high elevation of the Tibet Plateau (low annual average temperature [T], very large diurnal and seasonal T variations, and a high level of ultraviolet [UV] radiation (Kong et al., 2018, this volume), further constrain the formation, phase transition, and kinetics of phase transitions of hydrous salts.
A key advantage of studying surface and subsurface salts in the DLT area is that these salt deposits can be (1) characterized in detail via terrestrial orbital remote sensing, in situ sensing in the field, and laboratory detailed analyses (Sobron et al., 2018, this volume), (2) understood in the context of local and regional environmental conditions (Kong et al., 2018, this volume), and (3) correlated with the established presence of halophiles (Kong et al., 2010) and microbial lipids (Cheng et al., 2017).
1.2. Field expedition to DLT
Through a collaboration agreement between the Department of Earth and Planetary Sciences at Washington University in St. Louis and the Key Laboratory of Saline Lake Environments and Resources at Chinese Academy of Geological Sciences (CAGS), we organized a joint field expedition to three sites (including the DLT area) in Qaidam Basin in the fall of 2008.
The 2008 field expedition to the DLT area included the exploration of the DLT playa itself and a nearby anticlinal structure, Xiaoliangshan (XLS, 38°29′29.72″N, 91°22′53.11″E), that shows multiple layers of light-tone deposits (i.e., bathtub rings, Fig. 2b, also Anglés and Li, 2017a, 2017b). During the expedition, we collected GPS information (Table 1) and made geomorphologic observations at each sampling site. Local day/night temperature (T) and RH were recorded to determine the short-term environmental conditions (Table 2). Surface and subsurface samples were collected from six sites in DLT area (Fig. 2b): four sites (01, 03, 04, and 05) within the DLT playa; two sites (02 and 06) at or near the XLS anticline. At sites 01, 03, and 04, we collected subsurface salt samples from two vertical stratigraphic cross sections. At site 02, we collected surface and subsurface samples along a linear traverse of ∼3 km from the center to the edge across the XLS anticline (Fig. 2b), and we made in situ NIR spectroscopic measurements at each sampling location.
DLT, Dalangtan; XLS, Xiaoliangshan.
This article reports the analysis of subsurface samples collected from two vertical stratigraphic cross sections (sites 01, 03, and 04) at the DLT playa, with an emphasis on mineralogy and geochemistry. A 32-year (1980–2011) meteorological record supplied by a weather station near the DLT area and a 2-year (2011–2012) T and RH record at the XLS anticline site provided further environmental constraints. We report these in the first article of this series (Kong et al., 2018, this volume). In the third article of this series (Sobron et al., 2018, this volume), we report a multiscale mineralogy and geochemistry study of surface salts in the XLS anticline (site 02).
2. Subsurface Sample Collected at DLT Playa and Analysis Methods
2.1. Salt sample collection and preservation for laboratory analyses
We collected 31 subsurface salt samples from two vertical stratigraphic cross sections (sites 01, 03, and 04; Fig. 2b) in the DLT playa. The first set is composed of eight samples from the subsurface, layered materials exposed on the wall of a 5.77-m-deep trench at site 01, originally made for mining purposes (Fig. 3a and Supplementary Fig. S1a; Supplementary Data are available at
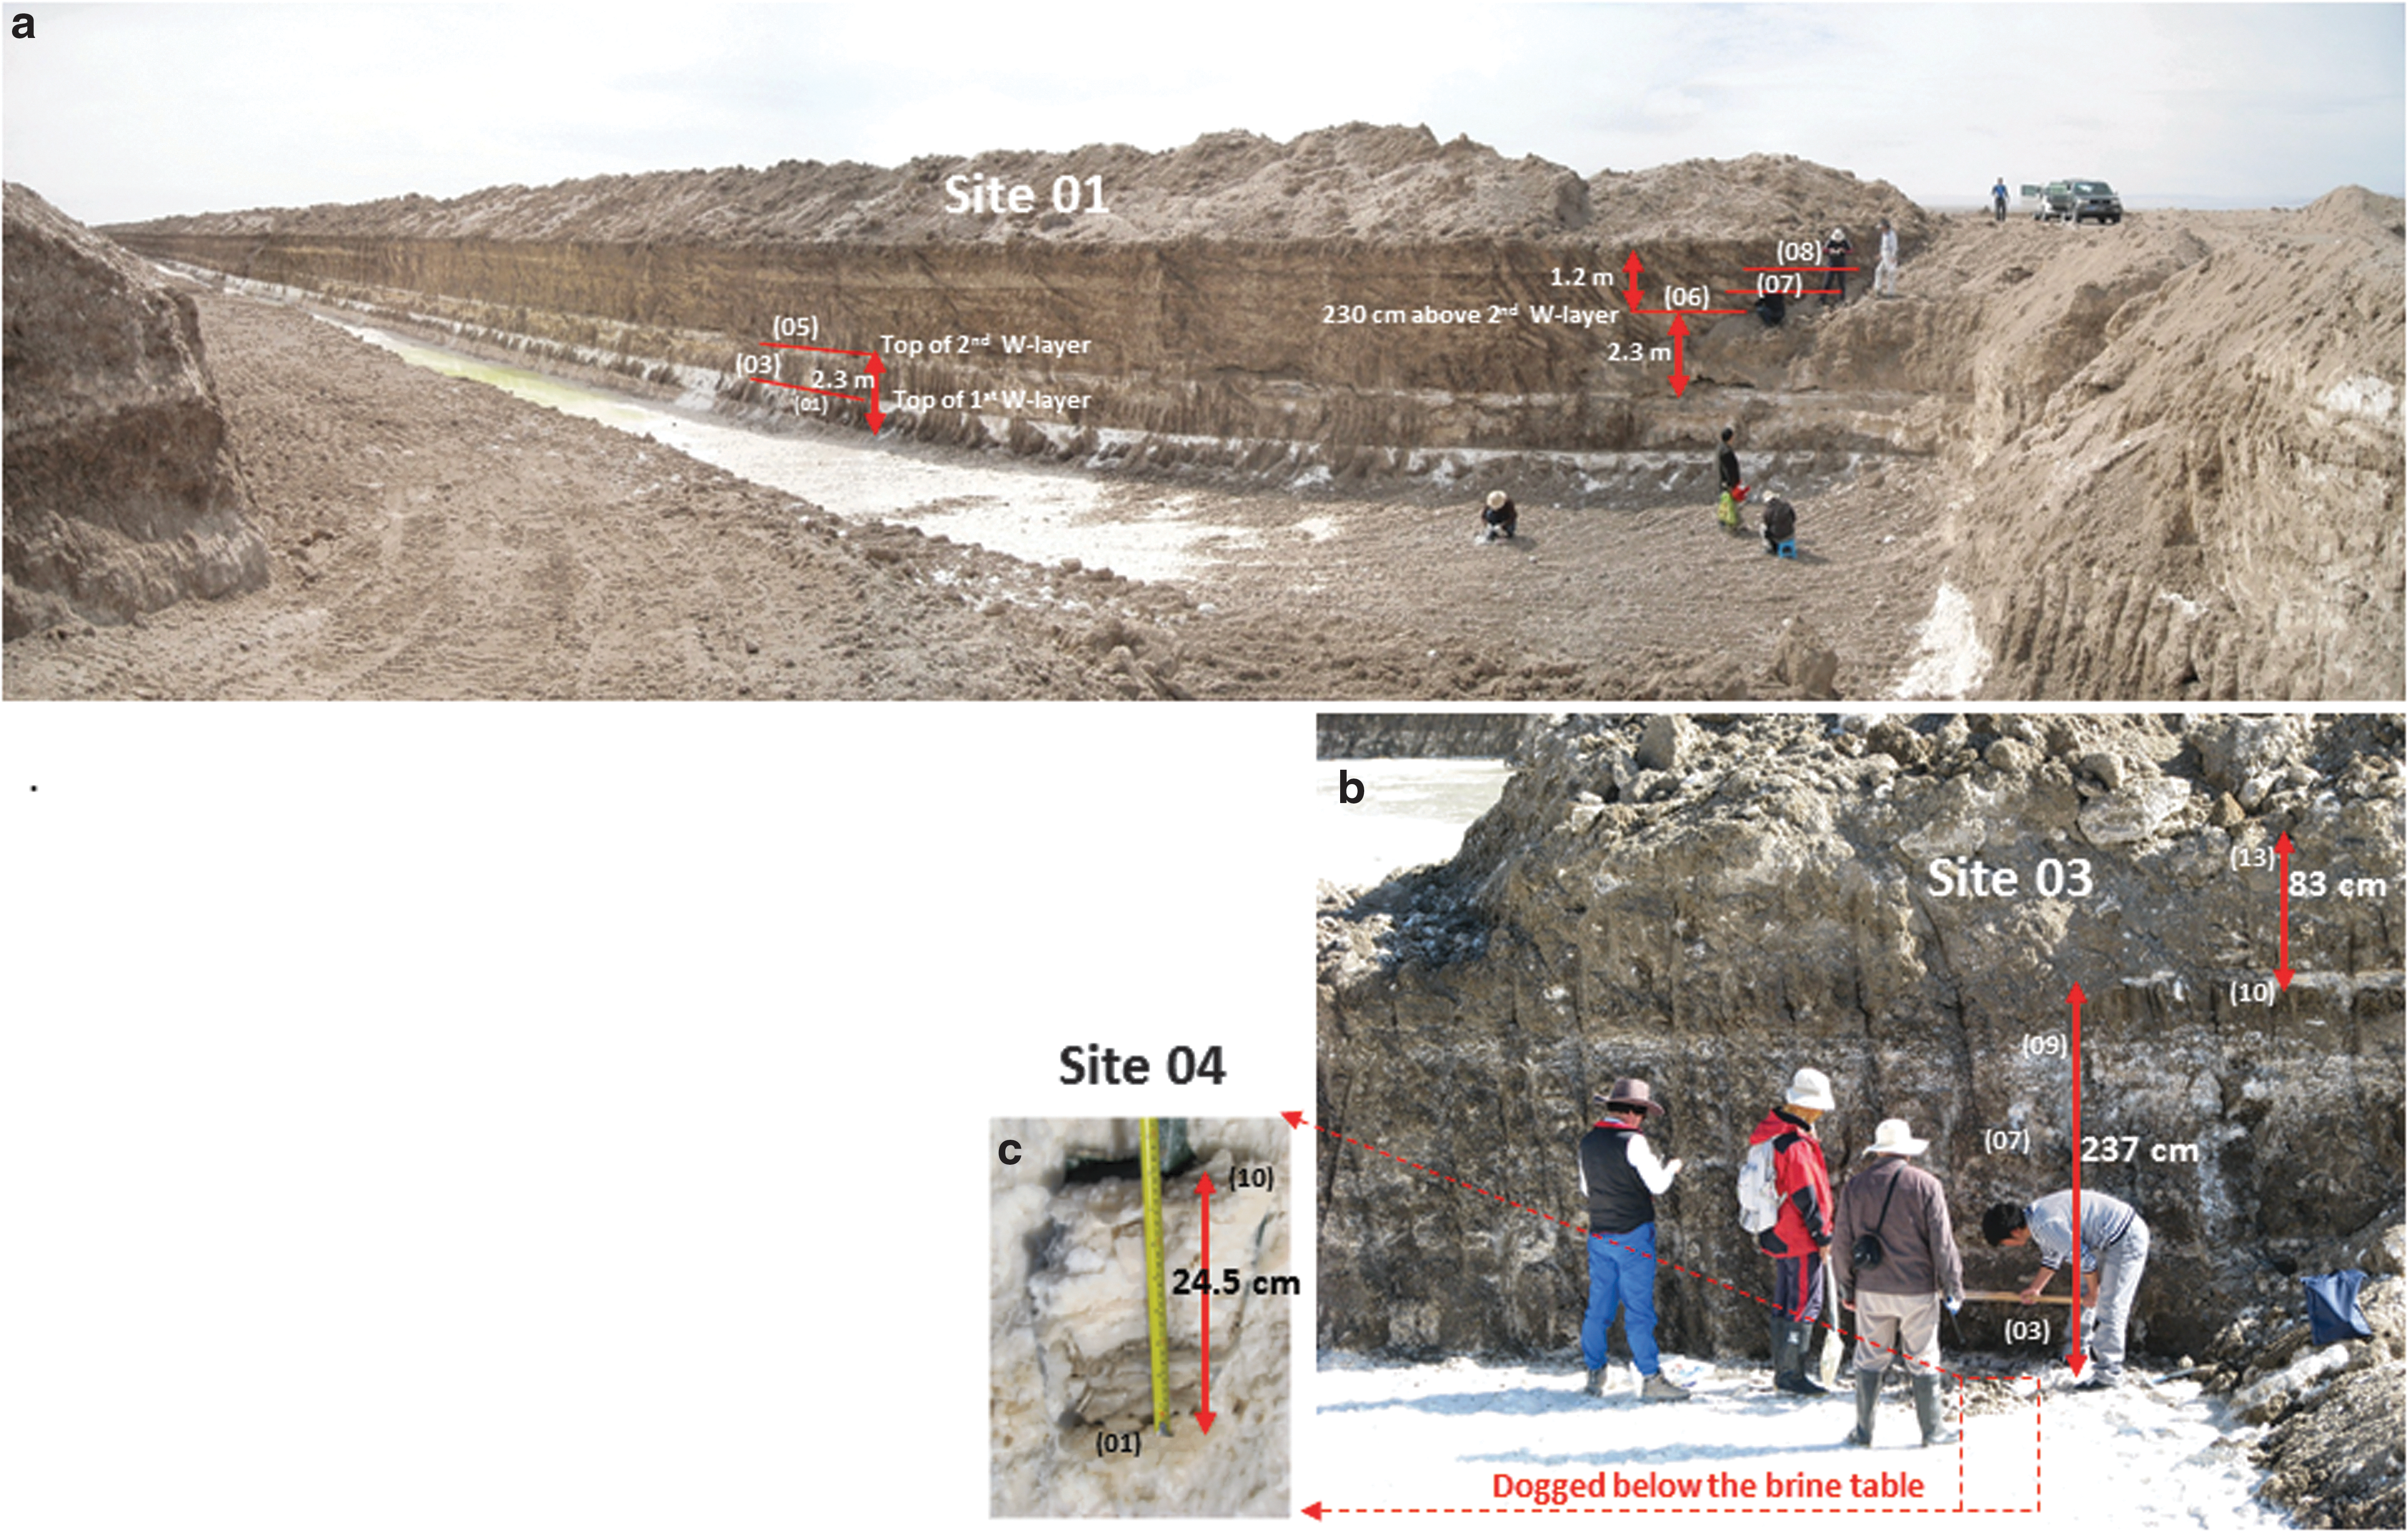
Photos of two vertical cross sections exposed by local mining activities, from which the subsurface samples were collected.
Sample collection started at the bottom of trench (or wall) and continued upward, toward the original (pre-mining) surface layer. The materials dumped on the top of original surface by mining activity (can be seen in Fig. 3a, b) were not sampled. The samples were collected from the salt layers showing visual color changes or morphology differences. We removed 20–30 cm of wall material at each sampling spot to access fresh salt samples, that is, we discarded surface materials whose hydration state may have been altered by interaction with hyperarid air or mine operations.
We sealed the collected samples in double layers of plastic bags immediately after collection. The sample bags from each DLT site (01, 03, and 04) were sealed into another large plastic bag (a third layer of air-tight enclosure) before shipping to the United States. Transportation of these samples took about 15 (for site 01 samples) −10 (for site 03 and 04 samples) days, at ambient temperature. On arrival at Washington University in St. Louis, the samples were placed in a freezer at −10°C for storage.
2.2. Laser Raman spectroscopic analyses
Laser Raman spectroscopy (LRS) measurements were made on all samples to determine the mineralogy of major, minor, and trace salt, and to detect reduced carbon.
Two types of LRS measurements were made on each sample. Immediately after opening a sample bag, we first took 5–10 LRS point-check from individual salt grains that show color or morphologic differences (Fig. 4a, b). Those spectra were collected with the best focusing of the excitation laser beam, used long acquisition time, and at least 10 coadded spectrum. The purpose of this type of LRS measurements was to obtain the Raman spectra with a good signal to noise ratio, to achieve a definitive salt mineralogical characterization. The second type of LRS measurement was a linear scan of 100–300 spots spaced at equal intervals along a line of 1–2 cm length on powdered samples, made by gently grinding representative grains (in color and morphology) with a mortar and pestle. The sample powder was spread on a glass slide with a pressed flat top surface. The LRS line scan was done with a less-than-perfect laser focusing condition due to the surface roughness of powdered sample (Fig. 4c). This >100 spot LRS line scan enhances the probability of finding minor and trace mineral species in the examined sample (which is a mixture of salts), to obtain a first-order estimation of mineral modes in each sample.

Photos of a sample (e.g., DL-03-01-07) from which two types of Laser Raman Spectroscopic (LRS) analysis were made.
A HoloLab5000 Raman microprobe spectrometer system (Kaiser Optical Systems, Inc., KOSI) was used for LRS measurements. This Raman system utilizes a 532 nm laser line for excitation and a transmissive holographic grating spectrometer to cover the Raman Stokes shift range of ∼100–4300 cm−1. The spectrometer has a spectral resolution of 4–5 cm−1. The 532 nm laser radiation is sent through a single-mode optical fiber into a probe head attached to the optical microscope of the HoloLab5000 system. A microscope objective (20 × , NA 0.4, 12 mm working distance) condenses the laser beam to ∼6 μm diameter at focus and collects the back-scattered Raman photons from the sample. The Raman photons are sent to the spectrograph through a multimode optical fiber (100 μm in diameter) without the use of a depolarizer. The power of the laser beam at the sample was ∼9–10 mW.
The calibration of spectrometer wavelength and overall spectral response of this Raman system were made by using a neon emission spectral calibration lamp and a NIST secondary standard white light. The zero Raman-shift frequency of the excitation laser was calibrated daily, before acquiring any sample spectra, by measuring the Raman peak position of single crystal silicon (520.7 cm−1). These calibrations ensured measurement errors on Raman peak positions to be less than ±1 cm−1.
2.3. X-ray diffraction analyses
The grounded sample powder was sealed immediately after the Raman measurement and then used for the X-ray diffraction (XRD) analysis. The purpose of the XRD analysis was to identify anhydrous chlorides (e.g., NaCl and KCl), which are not Raman active. The XRD analyses were made with a Rigaku Geigerflex D–MAX/A diffractometer using CuKα radiation (35 kV, 35 mA) and Bragg–Brentano focusing geometry with a 1° incident aperture slit, a 0.8° detector slit, and a scintillation counter as the detector. We used a 2θ range of 5–55°, a 2θ step size of 0.04°, and a 1 s dwell time per step in these measurements. The data were collected and reduced with the Jade™ software (version 3.1; Materials Data, Inc., Livermore, CA).
2.4. Brine chemistry
Two brine samples collected at the DLT playa sites 01, 03, and 04 were analyzed. Major, minor, and trace chemistry was obtained by inductively coupled plasma atomic emission spectroscopy (ICP-AES) and ICP-mass spectroscopy (MS) at the National Research Center for Geoanalysis at CAGS. The results are shown in Table 3.
2.5. Analysis for oxychlorine species
Two samples from site 03 were selected for the analysis of oxychlorine species. One is a sample (DL-03-01-13) collected from the original premining surface layer, and the second sample (DL-03-01-12) was from a subsurface layer about 37 cm below the premining surface layer. About 2.75 g of each solid sample (unheated) was dissolved in 15 g of ultrapure water (18.2 mΩ; EasyPure). The supernatant was filtered through a 0.2 μm membrane and analyzed for anion concentrations.
Major anions (Cl− and SO4 2−) were analyzed by ion chromatography (IC) following the EPA method 300.0. Oxychlorine species, ClO4 − and ClO3 −, were separately measured by a sequential IC-MS/MS method. ClO4 − and ClO3 − abundances were quantified by a Dionex LC20 IC system consisting of GP50 pump, CD25 conductivity detector, AS40 automated sampler and Dionex IonPac AS16 (250 × 2 mm) analytical column. The IC system was coupled with an Applied Biosystems-MDS SCIEX API 2000™ triple quadrupole mass spectrometer equipped with a Turbo-IonSprayTM source. A hydroxide (NaOH) eluant at 0.3 mL/min was followed by 90% acetonitrile (0.3 mL/min) as a postcolumn solvent. To overcome matrix effects, all samples were spiked with Cl18O3 (produced in house) or Cl18O4 (Dionex) internal standards. The results are listed in Table 4.
The detection limit of ClO3 − and ClO4 − in the solids is 1.4 μg/kg.
DL, detection limit.
3. Results
About 20 salt minerals were found in the collected samples. They can be classified into four categories: chloride, sulfate, chloride–sulfate, and carbonate. Within both chloride and sulfate groups, there are single-cation salts and multication salts. Within each single-cation sulfate subgroup, there are sulfate hydrates with different hydration degrees. The mineralogy of these salts indicates a brine system rich in K, Na, Mg, Ca, Cl, SO4, mixed with local silicates, carbonates, and oxides. In addition, reduced carbon was detected in a few layers.
The identification of most salt minerals was made on the basis of LRS and XRD data analyses. For our purposes, these two techniques are complementary from three standpoints. First, anhydrous NaCl and KCl generate the characteristic XRD pattern but their vibrational modes are not Raman active. Second, the 100–300-spot LRS line analysis spots increase the probability of encountering minor and trace mineral species in complex salt mixtures. Third, a tightly focused laser beam (6 μm in diameter) further increases LRS sensitivity to minor and trace minerals, because at some spots, these phases become the major contributors to the LRS spectra. This is not possible in bulk XRD analysis, where major minerals typically dominate the diffraction pattern of the sample and limit the detectability of minor and trace minerals.
3.1. Halite and sylvite
Chlorides are one of the two major types of salts found in all collected samples. XRD analyses indicate that halite NaCl exists in the subsurface samples collected from all stratigraphic layers in two vertical cross sections. Sylvite KCl was also identified in some subsurface samples. No quantitative information on mineral proportions of both was extracted from these XRD analyses of bulk samples.
3.2. Chloride hydrate and chloride–sulfate
In addition to NaCl and KCl, carnallite KMgCl3·6H2O and kainite KCl MgSO4·3H2O were found in large quantities in many of the examined samples.
Similar to other chloride hydrates (Wang et al., 2013b), the Raman spectral pattern of carnallite KMgCl3·6H2O (Fig. 5, top spectrum) is contributed mainly by the vibrations from the structural H2O, which is coordinated with Mg cation to form octahedral Mg(H2O)6 in the structure (Schlemper et al., 1985). The most characteristic Raman peaks are at 3430 and 3250 cm−1 (Fig. 5a). The highly regular crystallographic sites for H2O in carnallite structure generate a relatively narrow peak width for 3430 cm−1 peak, which has been used in this study to distinguish carnallite from other hydrous salts in mixtures. Except in a few cases, the weak LRS peaks of carnallite at 1643, 656, 201 cm−1 are rarely observed in the natural salt samples. Based on a set of laboratory dehydration/rehydration experiments on chloride hydrates (Wang et al., 2013b), carnallite demonstrated a stability against dehydration at 50°C and RH = 6–11%, higher than those of FeCl2·4H2O and AlCl3·6H2O, and similar to those of CaCl2·2H2O and MgCl2·6H2O. Our study indicated that the detected carnallite is the original precipitation from the natural brine at DLT.

Laser Raman spectra of carnallite KMgCl3·6H2O and kainite KCl·MgSO4·3H2O.
The strongest Raman peak of kainite KCl·MgSO4·3H2O is a doublet at 1040 and 1023 cm−1 (Fig. 5b, bottom two spectra). These peaks are generated by SO4 tetrahedra occurring at two sets of crystallographic nonequivalent sites (Robinson et al., 1972). Furthermore, structural H2O coordinates with Mg cations and forms two types of octahedra, Mg(H2O)4O2 and Mg(H2O)2O4. These contribute to the H2O vibration peaks around 3400 and 1640 cm−1. Two spectra of kainite with exactly the same peak positions for the fundamental modes of SO4 (Fig. 5b, bottom two spectra) show different H2O peaks (Fig. 5a). This spectral variation reflects a difference in crystallographic site of H2O molecules. The dehydration of kainite in air was found to start at T > 80°C during a laboratory heating experiment, monitored by XRD (Bish and Scanlan, 2006). This study suggests that the kainite we found in the DLT samples directly precipitates from brine.
3.3. Sulfates with different degrees of hydration
We present a full set of laser Raman spectra of hydrous/anhydrous Mg-sulfates, Ca-sulfates, and Na-sulfates in Figures 6 –8. The characteristic Raman peaks and Raman spectral patterns are the basis of our identification of hydrous sulfates in the DLT field samples.
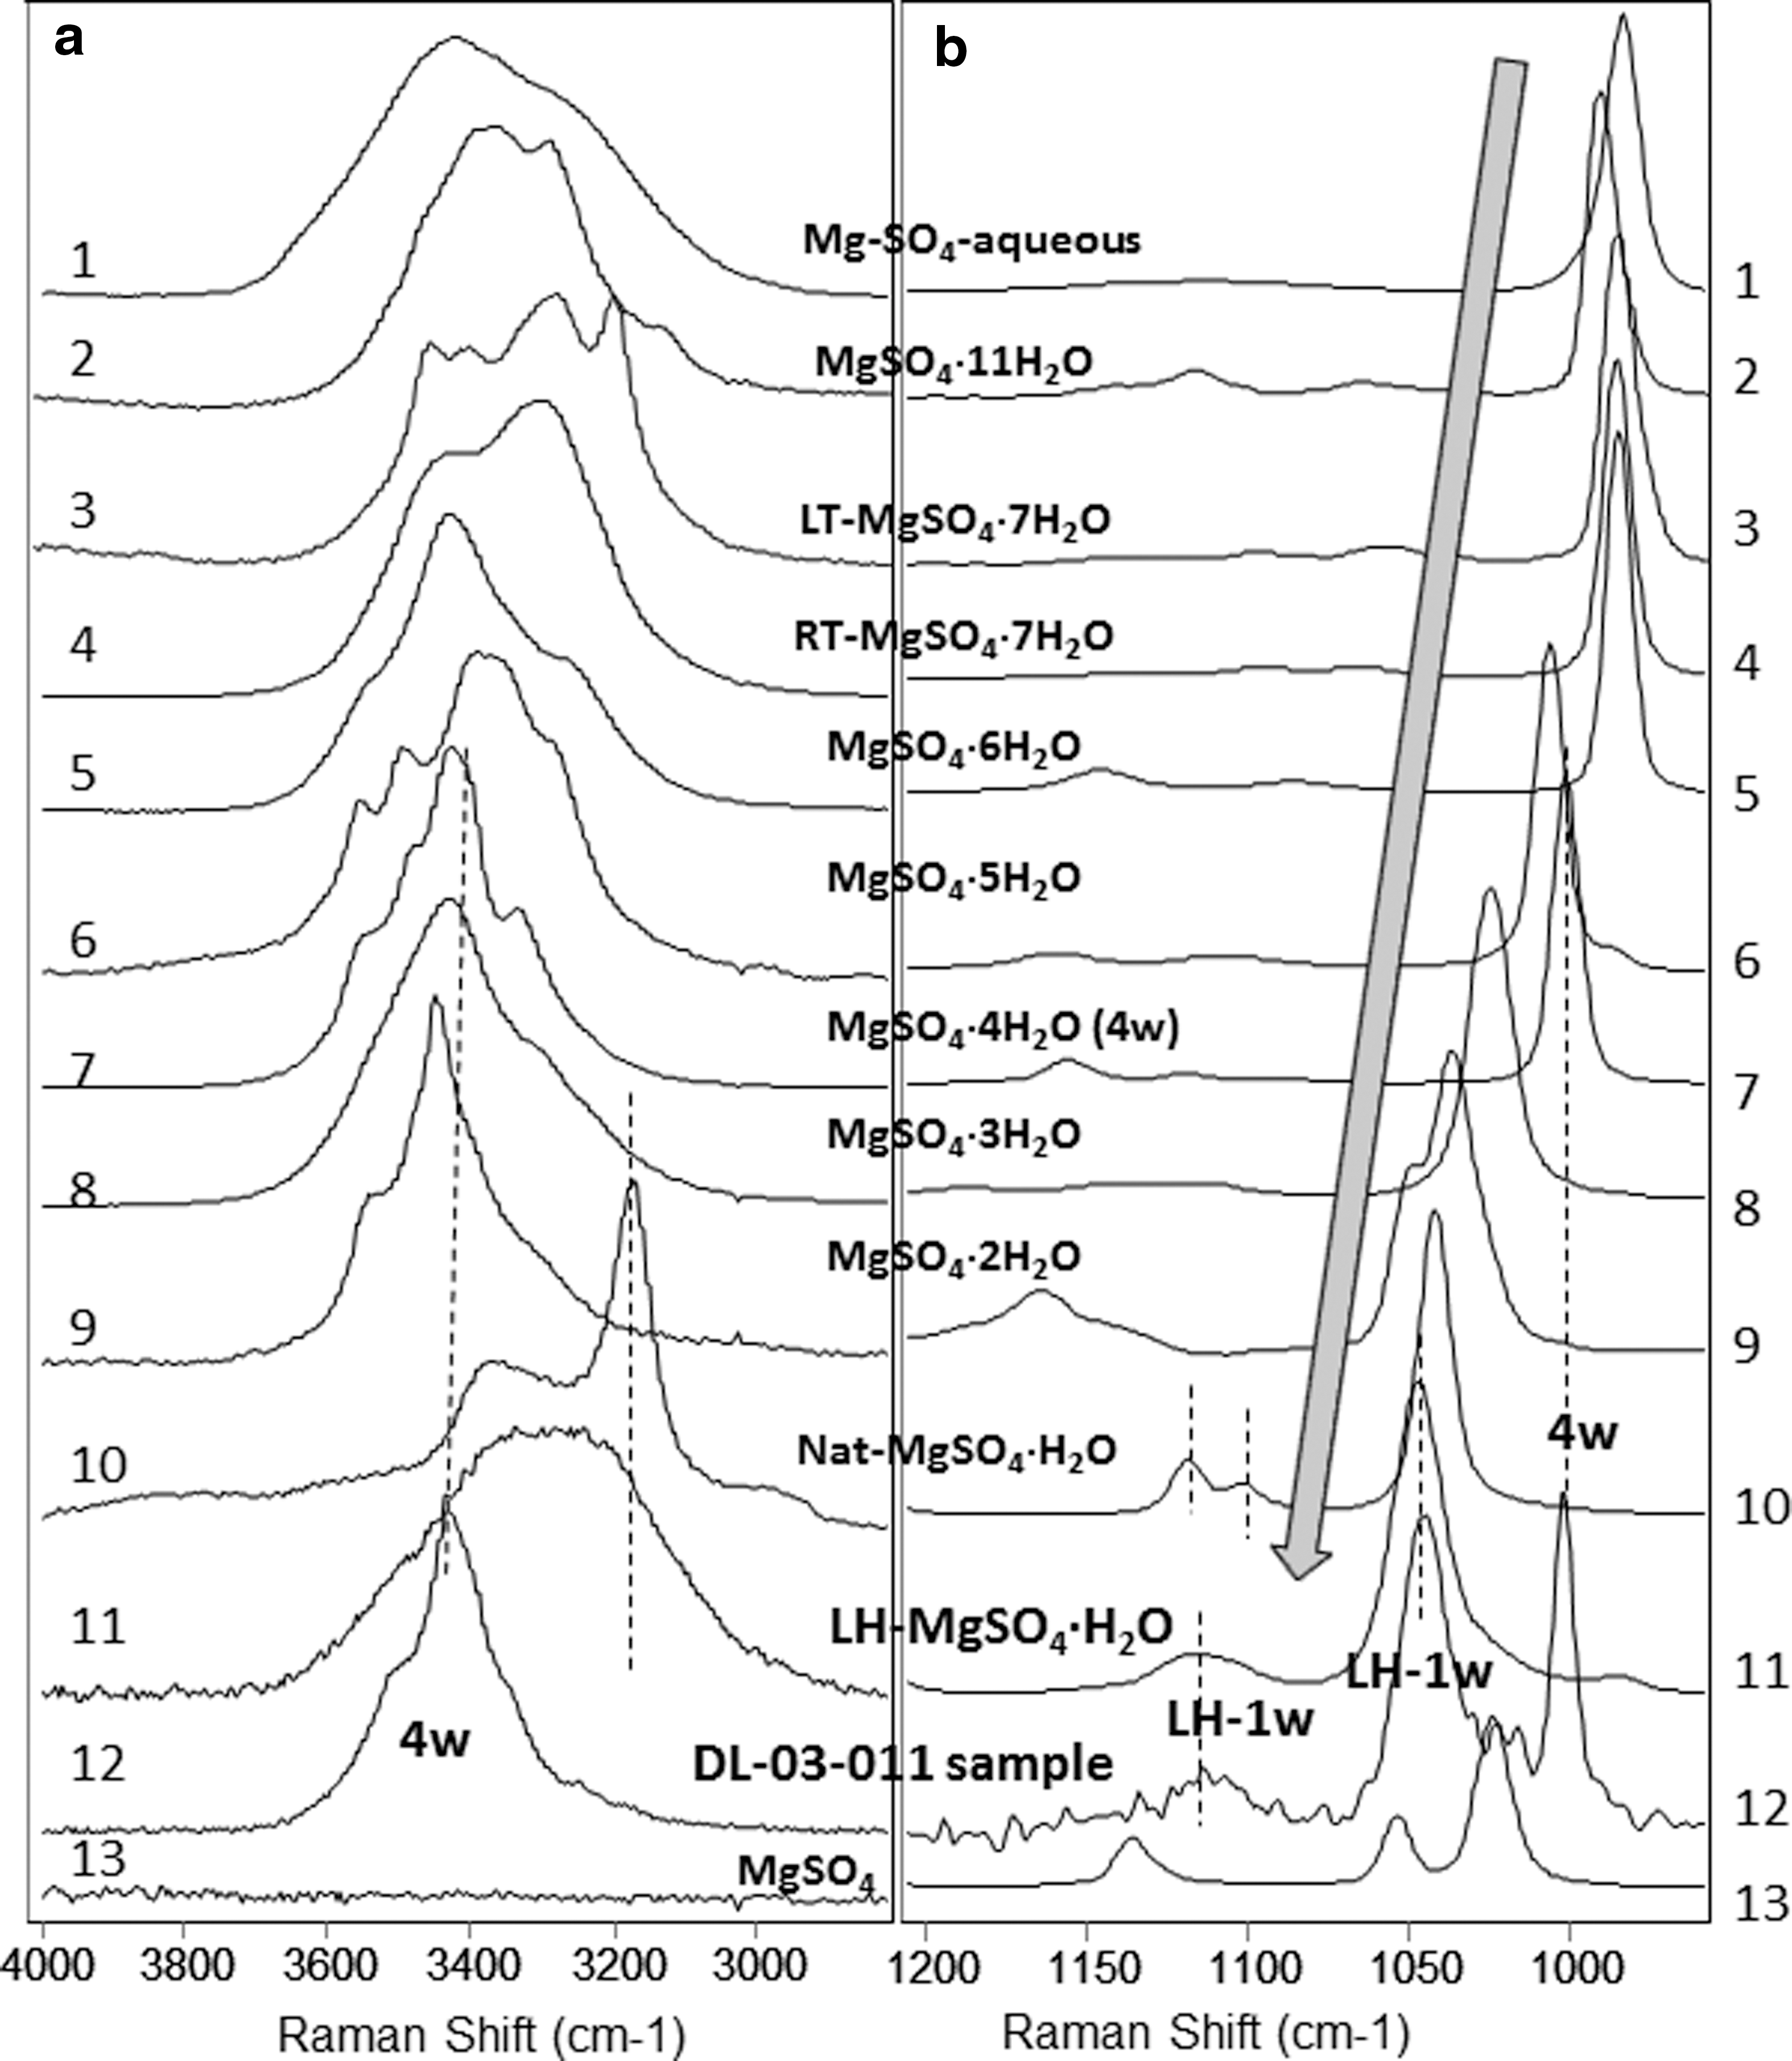
Laser Raman spectra of Mg-sulfates, with ten different degrees of hydration and two sets of polymorphous, compared with an exposed DLT salt sample DL-03-011 (spectrum 12).

Laser Raman spectra of Ca-sulfates with three different degrees of hydration and four structural forms.
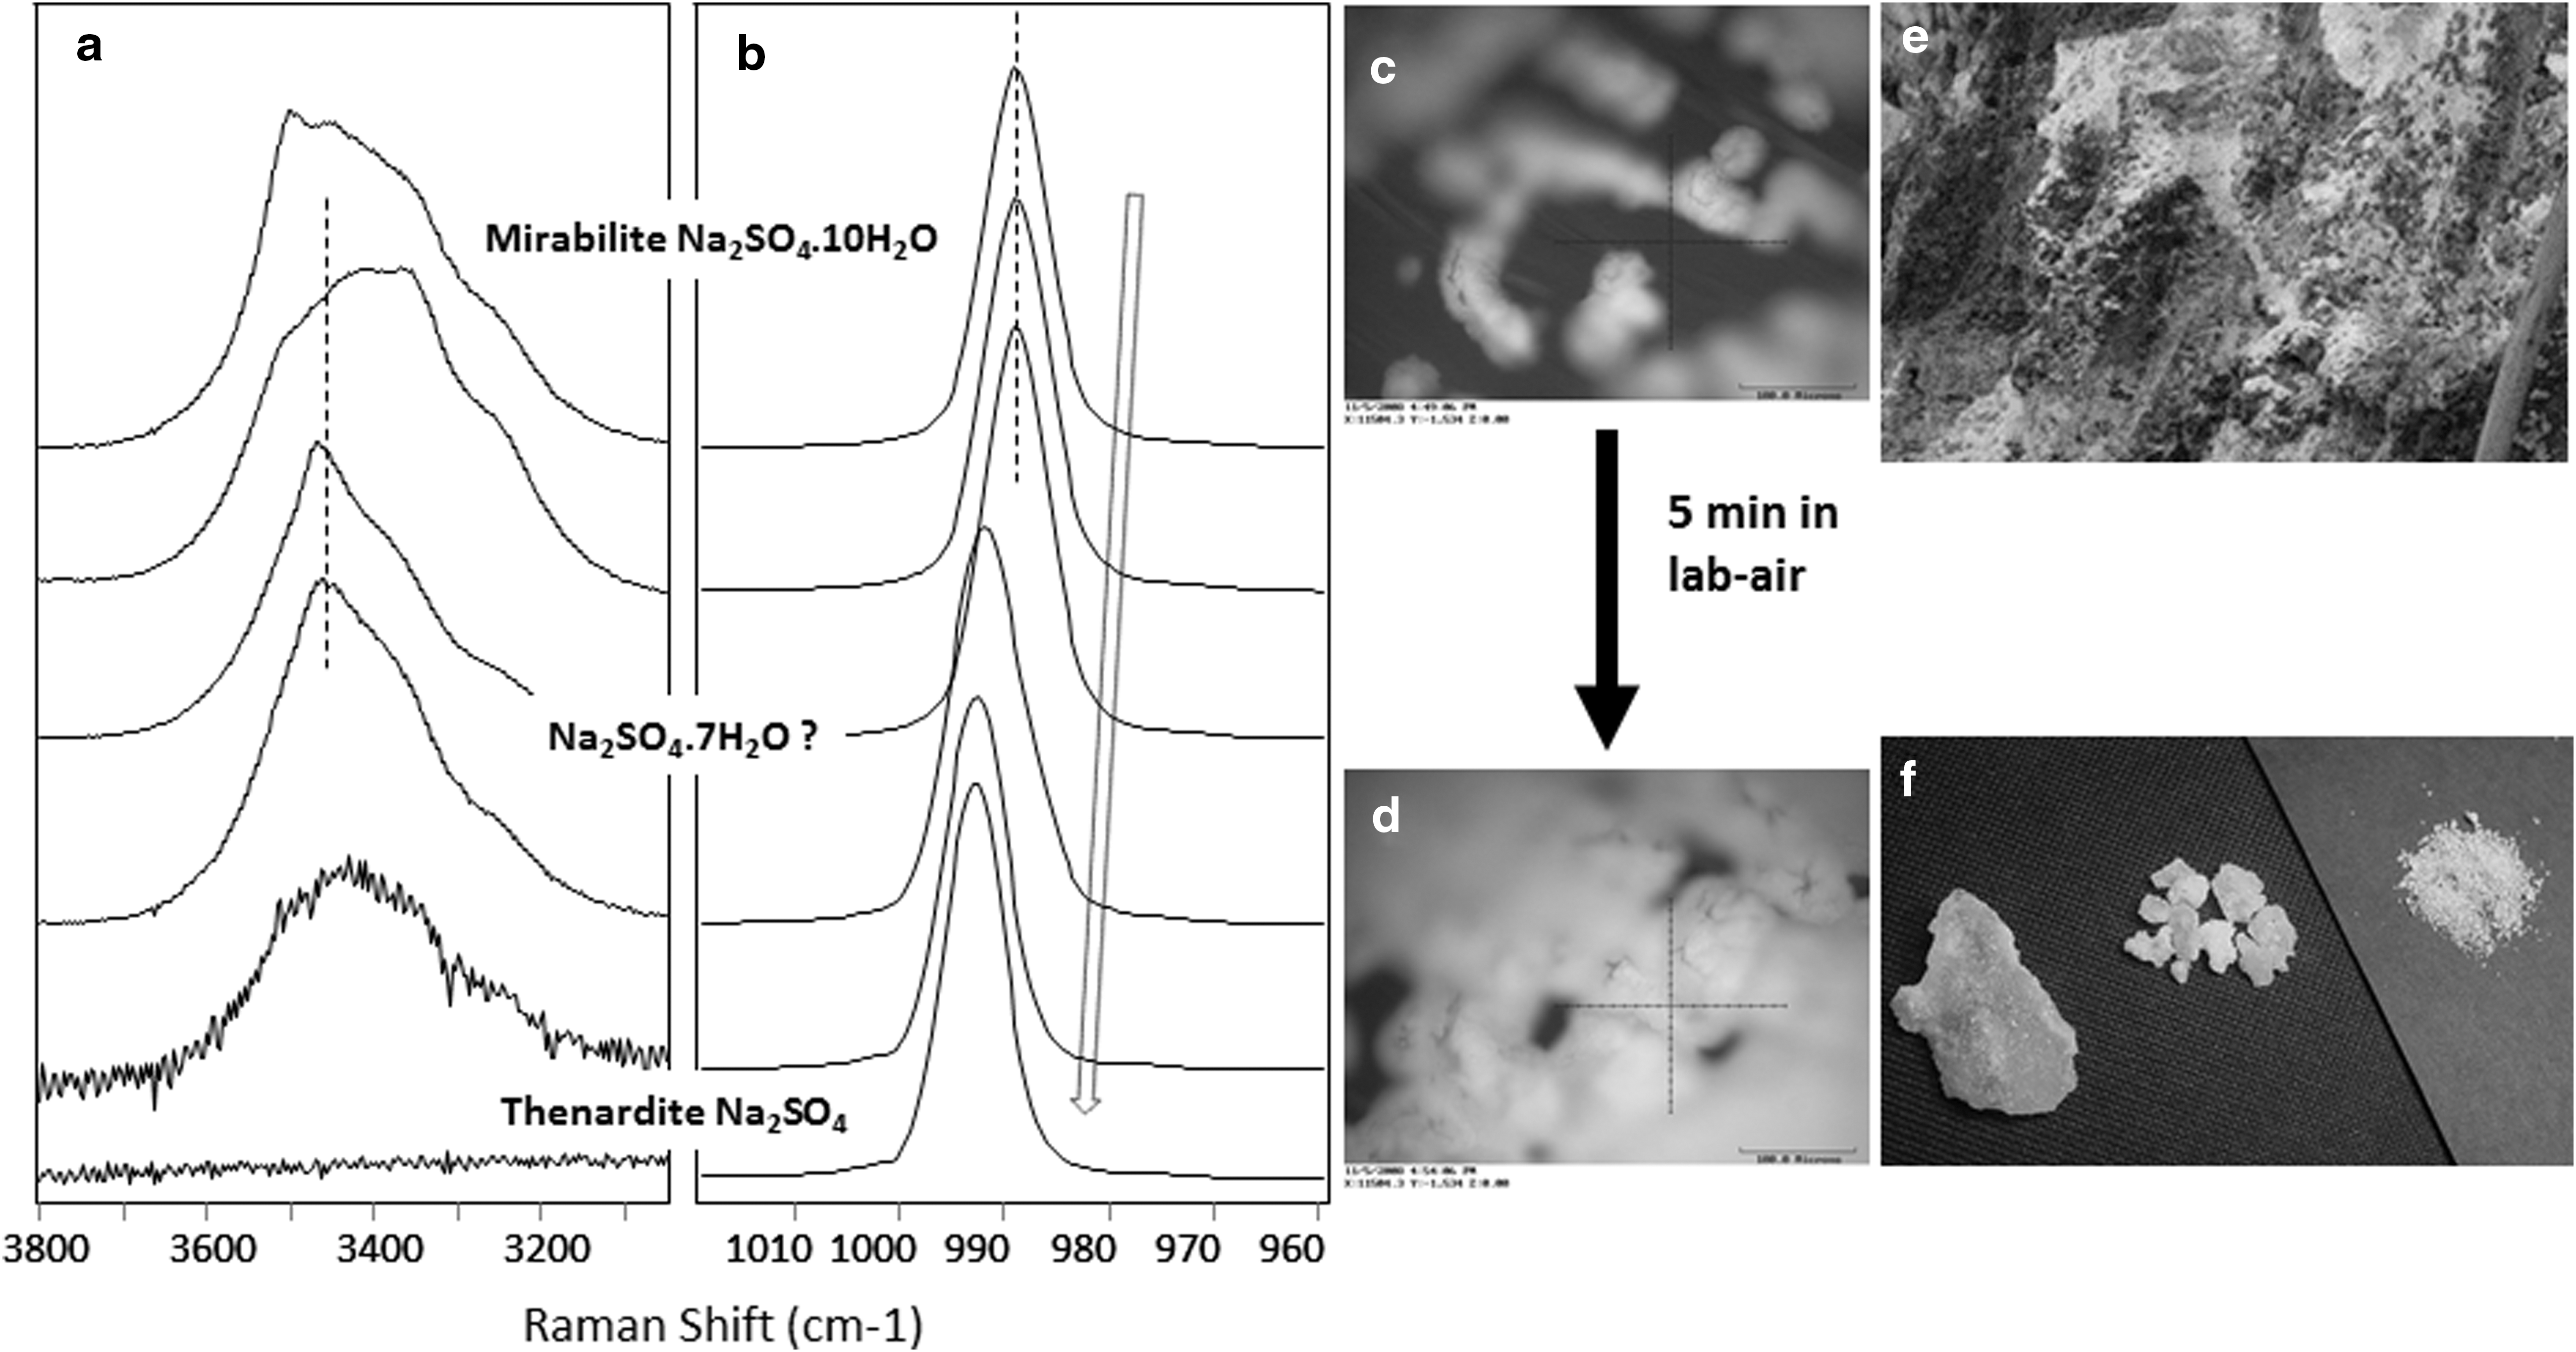
Laser Raman spectra taken during the dehydration of a mirabilite Na2SO4·10H2O grain. It converted completely to thenardite Na2SO4 under laboratory ambient RH-T condition in a few minutes. A clear arrow indicates the general trend of ν1 Raman peak shifts to higher wave numbers with the decrease of hydration degree;
First, a trend of spectral peak shift can be seen in all three sets of spectra (Fig. 6 –8). The peak position of the ν1 vibration of the sulfate ion shifts to higher wave number as the hydration degree decreases. The ν1 peak of Mg-sulfates shifts from 990 to 1052 cm−1 when meridianiite MgSO4·11H2O gradually loses structural water to form anhydrous MgSO4 (Fig. 6). The ν1 peak of Ca-sulfates shifts from 1008 to 1026 cm−1 when gypsum (CaSO4·2H2O) converts to bassanite (CaSO4·1/2H2O), then to anhydrite (β-CaSO4) or γ-CaSO4 anhydrite (Fig. 7). The ν1 peak of Na-sulfates shifts from 989 to 992.5 cm−1 when mirabilite Na2SO4·10H2O dehydrates, in ambient laboratory conditions, to form thenardite Na2SO4.
The ν1 Raman peak position downshifting following the decreased water content in sulfates is a common phenomenon, also seen in the Raman spectra of hydrous Fe2+-, Fe3+-, and some Al3+-sulfates (Chio et al., 2007; Ling and Wang, 2010; Wang and Zhou, 2014). We did not observe those sulfates in our DLT field samples.
3.3.1. Hydration degrees of Mg-sulfates in studied samples
Hydrous Mg-sulfates are the most common and abundant sulfates in our DLT subsurface samples. Among the Mg-sulfates of ten different hydration degrees and two polymorphous for monohydrate and two for septahydrate (Fig. 6), epsomite MgSO4·7H2O, hexahydrite MgSO4·6H2O, pentahydrite MgSO4·5H2O, starkeyite MgSO4·4H2O were identified in the collected DLT subsurface samples. Considering the hyperarid climatic condition in the DLT area, the finding of highly hydrated Mg-sulfates (epsomite and hexahydrite) in subsurface samples is extremely important, which is discussed in Section 4.
Raman peaks of a monohydrated Mg-sulfate were observed in the spectra from a few spots on sample DL-03-11, collected from a layer near the top of vertical section at site 03 (Fig. 6, spectra a12 and b12). The peak positions in this Raman spectrum imply that the salt sample is a mixture of carnallite, starkeyite, and monohydrated Mg-sulfate MgSO4·H2O. Monohydrated Mg-sulfate has two polymorphs (Wang et al., 2009) with different Raman spectra (Fig. 6, spectra 10 and 11). Natural kieserite (Nat-MgSO4·H2O in Fig. 6, spectrum 10) has a triplet peak in the 3500–2500 cm−1 spectral region, a doublet peak in the 1150–1050 cm−1 region, and a ν1 peak around 1041 cm−1 (marked by dotted lines). The polymorph LH-MgSO4·H2O (Fig. 6, spectrum 11) has single, broad peaks in both ranges and an upshifted ν1 peak at 1046 cm−1. By comparison, the monohydrated Mg-sulfate in the sample DL-03-11 (Fig. 6, spectrum 12) has the major Raman spectral profile of LH-MgSO4·H2O, not natural kieserite. We discuss the formation pathway of this phase in Section 4.
3.3.2. Ca-sulfates with different degrees of hydration
There are large amounts of gypsum CaSO4·2H2O crystals at the surface in DLT area, some larger than 10 cm (Fig. 7c), and in nearby areas. The widespread, regional occurrence of large gypsum crystal suggests that regional Ca-sulfates were likely precipitated at relatively low temperature.
Two types of Ca-sulfates, gypsum and bassanite CaSO4·1/2 H2O, were observed, although sparsely (Tables 5 and 6) in the subsurface samples collected from the stratigraphic layers on two vertical cross sections at DLT playa.

Carnallite = KMgCl3·6H2O, kainite = KCl·MgSO4·3H2O, polyhalite = K2Ca2Mg(SO4)4·2H2O, hexahydrite = MgSO4·6H2O, pentahydrite = MgSO4·5H2O, bloedite = Na2Mg(SO4)2·4H2O, gypsum = CaSO4·2H2O, bassanite = CaSO4·1/2H2O, dolomite = CaMg(CO3)2, quartz, feldspar, anatase, and rutile were identified.
The numbers in columns #5 to #14 are the numbers of LRS spectra, among the total LRS spot checks on that layer sample (column #3), where the Raman peaks of the listed mineral in the column were identified.
LRS, Laser Raman spectroscopy; XRD, X-ray diffraction.
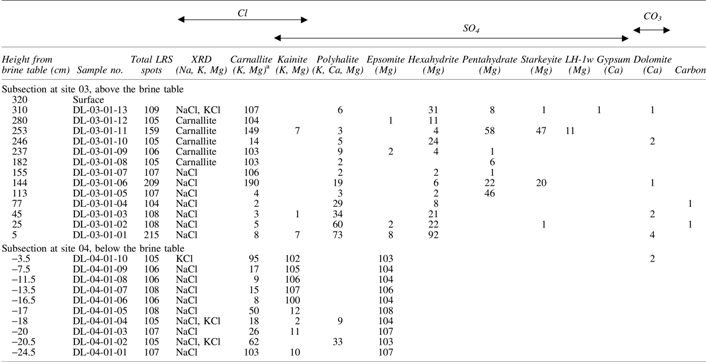
Carnallite = KMgCl3·6H2O, kainite = KCl·MgSO4·3H2O, polyhalite = K2Ca2Mg(SO4)4.2H2O, epsomite = MgSO4·7H2O, hexahydrite = MgSO4·6H2O, pentahydrite = MgSO4·5H2O, starkeyite = MgSO4·4H2O, LH-1w = MgSO4·H2O [monohydrate formed at low humidity, characterized by Wang et al. (2009)], gypsum = CaSO4·2H2O, bassanite = CaSO4·1/2H2O, dolomite = CaMg(CO3)2, quartz, feldspar, anatase, and rutile were identified.
The numbers in columns #5 to #14 are the numbers of LRS spectra, among the total LRS spot checks on that layer sample (column #3), where the Raman peaks of the listed mineral in the column were identified.
It is important to notice that in many surface samples (e.g., DL-02-03-01b in XLS; Fig. 7d), Ca-sulfate with three hydration degrees and four structural forms, gypsum, bassanite, anhydrate β-CaSO4, and anhydrate γ-CaSO4, coexists. We discuss this observation in Section 4.
3.3.3. Na-sulfates with different degrees of hydration
Na-sulfates were found in two forms in the DLT samples: mirabilite Na2SO4·10H2O and thenardite Na2SO4. Previous studies (Doehne, 1994; Hamilton and Menzies, 2009) report that mirabilite precipitates directly from low-temperature brine, while thenardite can precipitate directly from brine at T > 32.4°C.
During our field work, we observed the rapid dehydration of subsurface mirabilite, from transparent mirabilite crystals to white powdery thenardite, immediately after exposure to surface air. In the laboratory, the phase transition from mirabilite to thenardite completes in minutes and can be monitored via changes in the Raman spectra and by the appearance of white fine powder (thenardite) on the surface of clear crystal grain of mirabilite (Fig. 8c, d). Septahydrate Na2SO4·7H2O may have formed in the process, as evidenced by changes in the H2O peak shape (Fig. 8a) and a slight shift (1.7 cm−1) of the ν1 sulfate peak (Fig. 8b). Note that thenardite would be stable up to 185°C. Septahydrate is a metastable phase (Hamilton and Menzies, 2009).
Based on the morphology of thenardite observed in field, we can constrain the paleoenvironmental temperature at the time the precipitation of Na-sulfates is underway. At most sites on the DLT playa and the XLS anticline, powdery thenardite was observed at the surface, likely formed by dehydration of mirabilite (Fig. 8e). At one location (DL-02-14) on the XLS anticline, crystalline thenardite mineral grains in the millimeter to centimeter size range (Fig. 8f) were found within the subsurface, apparently formed by direct precipitation from brine at local T > 32.4°C in the past. In the vertical cross sections (sites 01, 03, and 04) where subsurface samples were collected, only powdery thenardite was found, suggesting the original form of Na-sulfate in these subsurface layers in DLT playa was mirabilite, precipitated directly from brine at T < 32.4°C.
3.4. Multication sulfates
Polyhalite K2Ca2Mg(SO4)4·2H2O is the most common multication sulfate found in the collected subsurface samples from DLT playa (Tables 5 and 6; Fig. 9). Another two sulfates, bloedite Na2Mg(SO4)2·4H2O and glauberite Na2CaSO4, were occasionally observed (Fig. 9).

Raman spectra of polyhalite K2Ca2Mg(SO4)4·2H2O, bloedite Na2Mg(SO4)2·4H2O, and glauberite Na2Mg(SO4)2.
Although each of these three sulfates has more than two types of cations in their structures, the effects of multiple cations in the structural distortion (and the Raman spectral features) are quite different. The structural distortion caused by multiple cations could affect the site symmetry occupied by SO4 tetrahedra, and the symmetry of the SO4 tetrahedra themselves. This effect causes the changes in Raman peaks. Specifically, in polyhalite, three types of cation (K, Ca, Mg) induce two groups of SO4 tetrahedra with nonequivalent crystallographic symmetry. As a result, the slight difference in ν1 vibrational mode of two types of SO4 produces a Raman doublet at 1017 and 990 cm−1 (Fig. 9b, top spectrum) of polyhalite. In contrast, the two types of cation in bloedite (Na, Mg) and glauberite (Na, Ca) structure do not affect the site symmetry and the structural symmetry of SO4 tetrahedra significantly, thus SO4 units in each of these two structures remain equivalent. This situation generates single ν1 Raman peak, 992 cm−1 for bloedite and 1001 cm−1 for glauberite (Fig. 9b, bottom two spectra). The Raman spectral features in 4000–2500 cm−1 spectral region (Fig. 9a) reflect the presence/absence of structural H2O in these salts: anhydrous glauberite has no Raman peak, and hydrous bloedite and polyhalite have distinctive Raman peaks.
The dehydration of polyhalite and bloedite has been studied by Bish and Scanlan (2006). Their XRD investigation did not find structural changes when polyhalite is heated to 430°C, although they report a slight weight loss (monitored via TGA) of 5.6% at 285°C. On the contrary, dehydration of bloedite starts at 110°C, and anhydrous bloedite forms at 160°C. This study suggests that within the RH-T range measured in the DLT region (Kong et al., 2018, this volume), these two hydrous salts should retain their structural H2O. Therefore, these two sulfates, which we found in subsurface layers, are likely products of direct precipitation from brines.
3.5. Detection of reduced carbon
Peaks associated with reduced carbon were observed in the Raman spectra of samples from the second vertical cross section at sites 03 and 04 (top two spectra of Fig. 10, also shown are Raman spectra of quartz SiO2, rutile TiO2, and anatase TiO2 found as minor phases). The variation in relative band areas of the reduced carbon G- and D-bands between the two spectra (Fig. 10) suggests a difference in the structural ordering (Pasteris and Wopenka, 1991) of the reduced carbon at these two spots. These spectra were obtained from two Raman line scans on two samples collected at the DL-03-01-02 and DL-03-01-03 layers (Table 6), at about 2.75 and 2.95 m below the original pre-mining surface in the vertical cross section at site 03 (Fig. 3b).
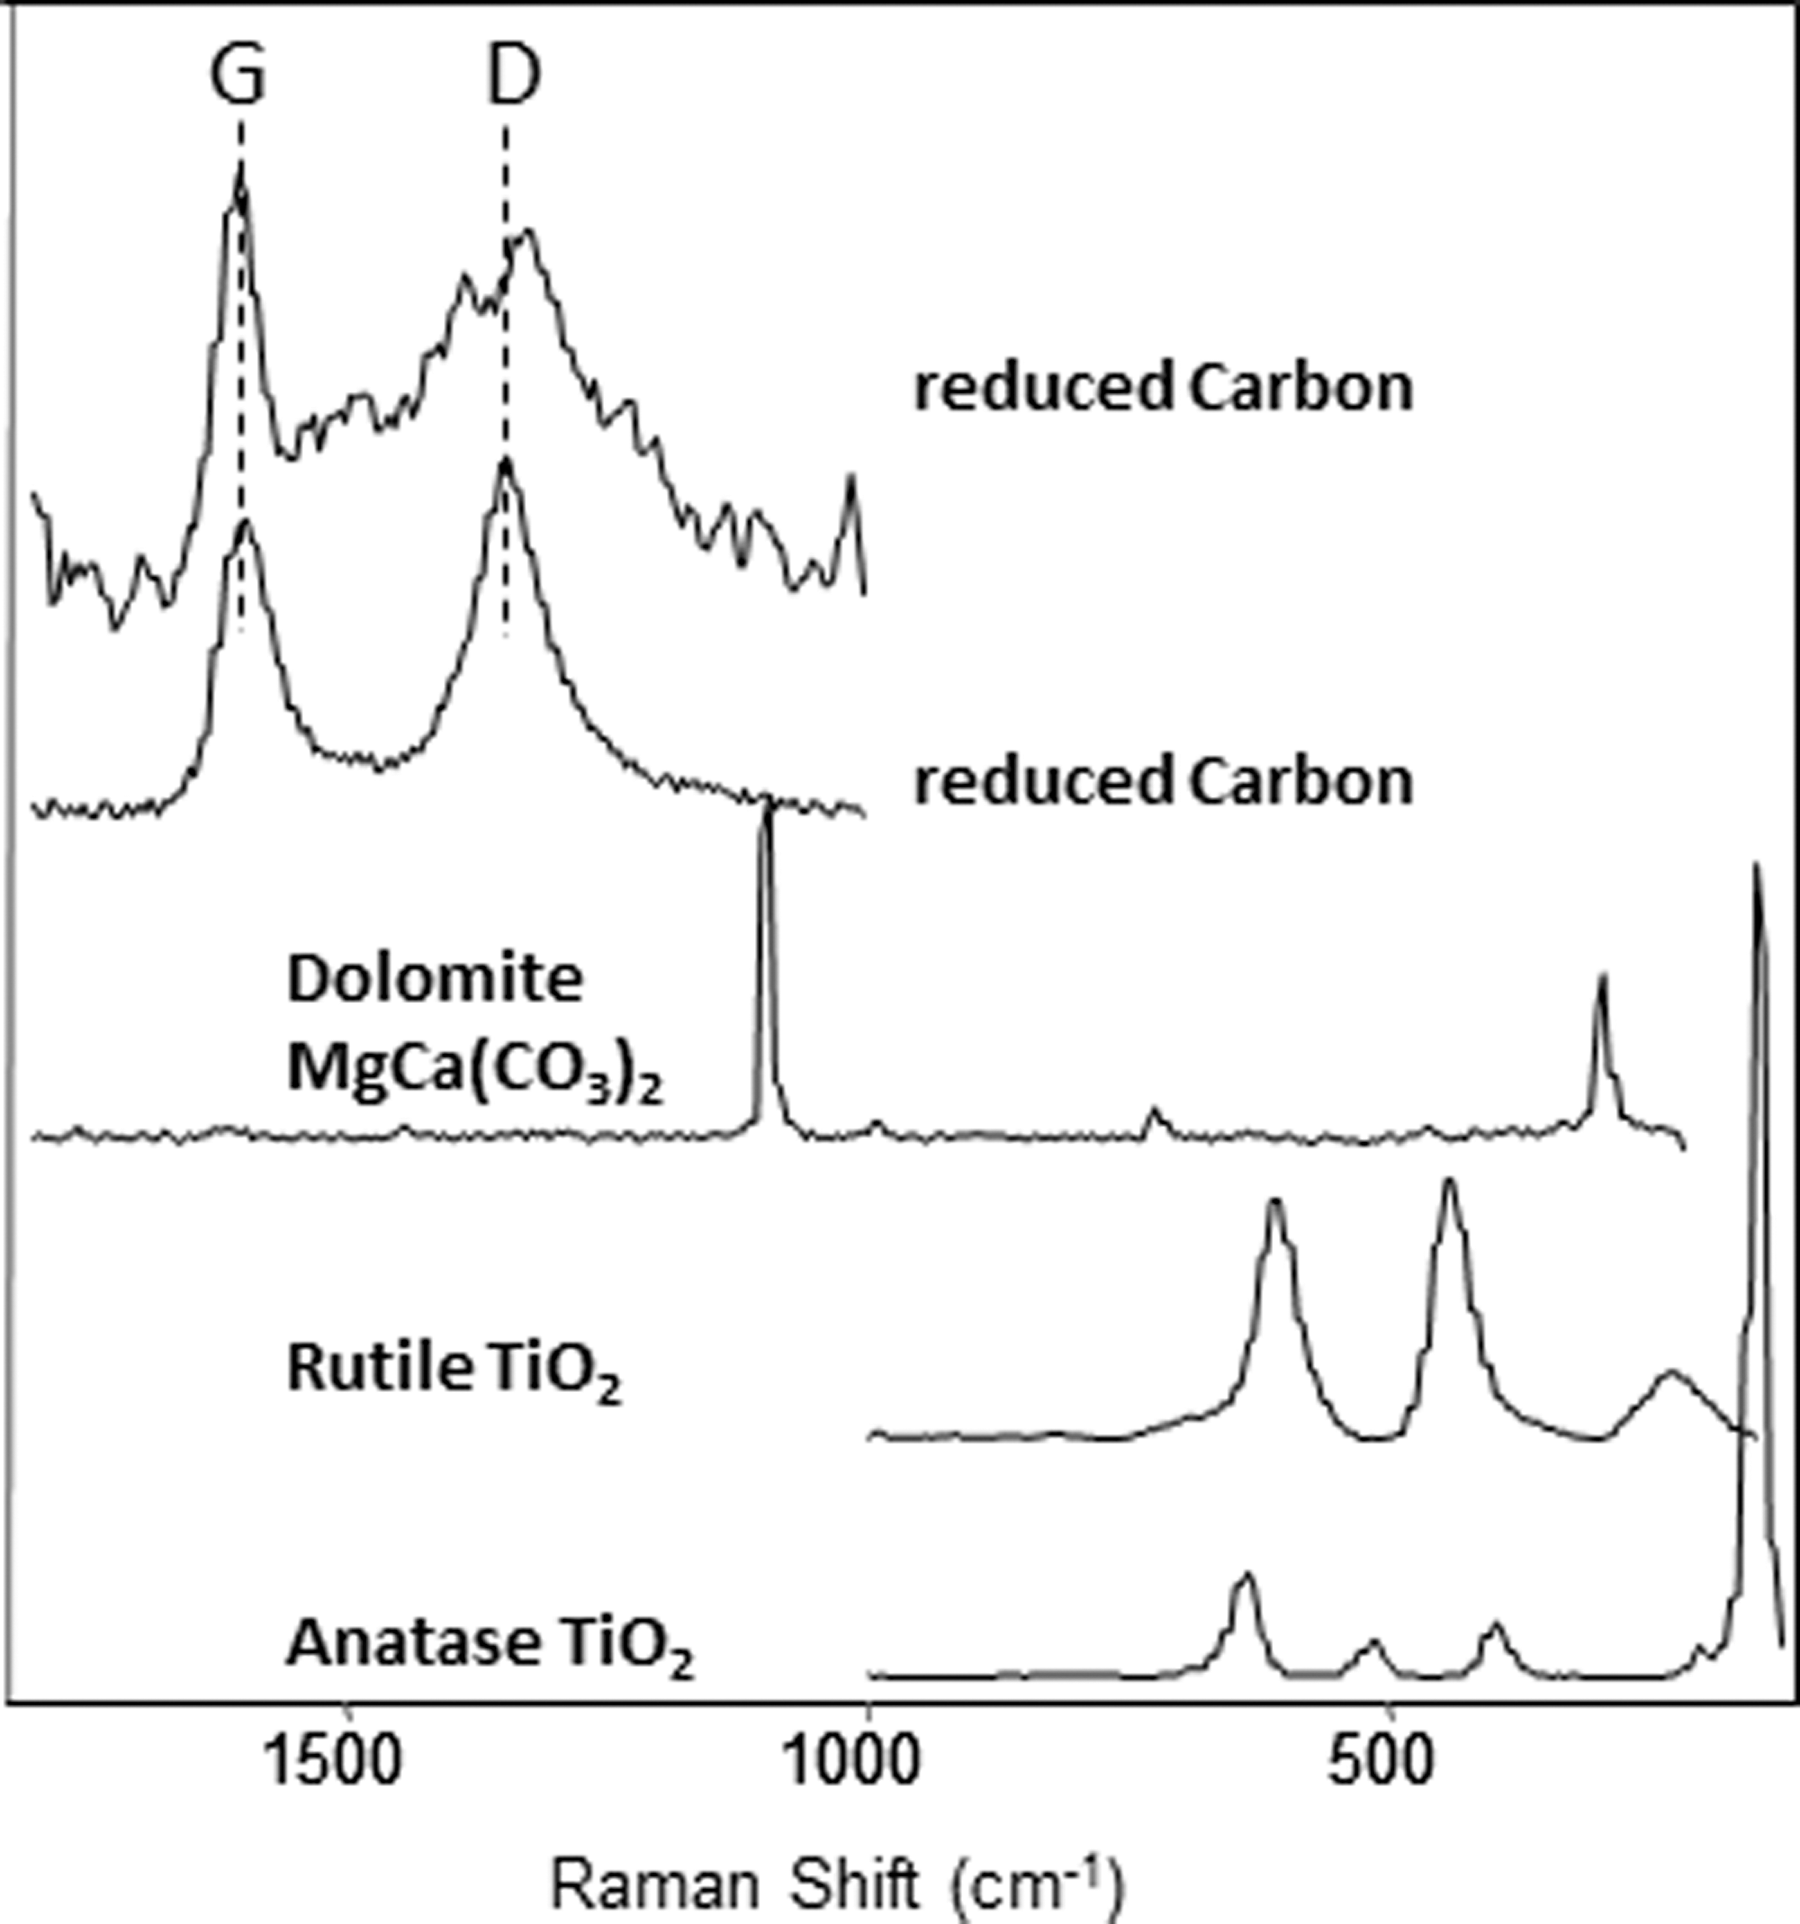
Raman spectra of reduced carbon. The different G/D band area ratios indicate the difference in structural ordering of two carbon molecules. Dolomite MgCa(CO3)2, two polymorphous of TiO2 (rutile and anatase) are detected in analyzed DLT samples, as well as other silicates, for example, K-, Na-, Ca-feldspars and quartz.
4. Discussion
4.1. Highly hydrated Mg-sulfates in the subsurface of a hyperarid region
The salt deposits at the DLT area were accumulated between the Pliocene and Holocene era (Kong et al., 2018, this volume). A deep drill, ZK 312 (Wei et al., 1989), at the DLT playa revealed that the top <12.9 m salt deposit formed in Holocene (i.e., ∼ 10 K years).
Epsomite MgSO4·7H2O and hexahydrate MgSO4·6H2O were identified in the subsurface samples at DLT sites 01, 03, and 04 (Tables 5 and 6). The shallowest depths where we found them were 40 and 10 cm, respectively.
Studies of the thermodynamic and kinetic properties of hydrous Mg-sulfates indicate that the following salts would directly precipitate from Mg-SO4-H2O brine: hexahydrite MgSO4·6H2O at T ≤ 69°C; epsomite MgSO4·7H2O at T ≤ 48°C (Chou and Seal, 2003); and meridianiite (MgSO4·11H2O) at T ≤ 2°C (Peterson and Wang, 2006; Peterson et al., 2007; Supplementary Fig. S2). Within a T range of 50°C to −10°C and low RH, highly hydrated Mg-sulfates would dehydrate very fast (Wang et al., 2006a, 2009, 2011). For example, epsomite dehydrates to hexahydrite in less than 1 h at 50°C in 6–65% RH and at 21°C in 7–11% RH, or in less than 107 h at 5°C in 7–11% RH. Hexahydrite dehydrates to starkeyite MgSO4·4H2O in 7 h to 90 days in similar T-RH range (table 2 of Wang et al., 2009).
The atmospheric RH values during our DLT field expedition were in the range of 8–36% (Table 2). The long-term (32 years) meteorological records at DLT area show a monthly average atmospheric RH of 20–40% and monthly average T of −12°C to 17°C (Kong et al., 2018, this volume). Mg-sulfates with high hydration degree, epsomite and hexahydrite, are not stable in this T-RH range, that is, they dehydrate readily when exposed to the surface in DLT area.
The finding of epsomite and hexahydrite in subsurface salt layers of a hyperarid region (AI ∼0.02; Kong et al., 2018, this volume) is important. It implies a very different T-RH environment maintained by the hydrous salts in subsurface layer, where the climatic conditions at the surface have very-little-to-no influence.
This observation is consistent with the thermal model developed and validated by Mellon et al. (2004, 2008, 2009): when a layer of high TI materials is buried under a layer of low TI materials (surface soil), any variation in atmospheric temperature would be buffered by the surface soil (low TI) and, as a consequence, has very-little-to-no influence on the temperature profile at the buried, high TI layer. This model indicates that during a diurnal T cycle on Mars, the high TI subsurface layer can maintain lower Tmax, higher RH, and smaller ΔT and ΔRH relative to the surface (fig. 1 of Mellon et al., 2004).
Mellon's original model (2004) utilizes the TI values of Mars ordinary surface soil (TI = 250 J m−2K−1 s−1/2) and water ice-cemented soil (TI = 2290 J m−2 K−1 s−1/2), validated by the observation of ground ice at the Phoenix landing site (Mellon et al., 2009). This model was extrapolated to a subsurface salt layer buried by surface soil (Wang et al., 2013a), because the TI values of many salts are in the same order of magnitude with that of water ice-cemented soil (e.g., TI of CaSO4·2H2O = 2218 J m−2 K−1 s−1/2, TI of NaCl = 3326 J m−2 K−1 s−1/2; Mellon et al., 2008). This implies that, within a subsurface salt-rich layer, the T and RH would be controlled by the salts themselves, with almost no influence from the atmosphere, that is, a subsurface salt-rich layer is a quasiclosed system.
What is the RH value maintained by a hydrous salt in an enclosure? Theoretically, this question can be answered by looking at its stability field in the T-RH space (Supplementary Fig. S2), and given in literature data (Greenspan, 1977). It is well known that the saturated aqueous solution of a given salt can keep a fixed RH value at a stable T in a closed system, that is, RHbuffer(T). This RHbuffer(T) value is consistent with the deliquescence boundaries defined by stability field experiments (Supplementary Fig. S2; Chou and Seal, 2003; Wang et al., 2006a, 2009, 2011, 2012). For a hydrous salt in the form of dry solid grains, the stability field would theoretically constrain RH values (e.g., 95–40% RH at 278 K for MgSO4·7H2O; Supplementary Fig. S2).
In practice, we use the following experiments to determine the range of RH values that can be sustained by dry grains of hydrous salts in an enclosure. We selected 15 hydrous salts (6 sulfates, 6 chlorides, and 3 perchlorates), and placed each of them, as dry grains, into a bottle of 4 cm diameter and 10 cm height, half-filled with the salt and sealed. We inserted the sensor head of a TRH10 data logger into each sealed bottle. Then we placed the 15 bottles at 4 different temperatures: 238.7 ± 0.1 K, 258.2 ± 0.5 K, 272.2 ± 0.3 K, and 294 ± 1 K. RH, and T values were recorded every 5 min over 2–3 days at each temperature for each salt. We used 80–90% of the recorded 500–900 data points after a system reached its equilibrium to generate average RH values (Supplementary Table S1). The same type of direct RH measurement was one of the four methods used by Greenspan (1977) in determining RHbuffer(T), while using oversaturated salt-H2O solution.
We found that, overall, the measured average RH value sustained by the dry grains of a hydrous salt in the sealed bottle is very close to its RHbuffer (T) value (Greenspan, 1977), that is, near the high end of RH range defined by its stability field (e.g., near 95% RH for MgSO4·7H2O). In addition, we found a general trend in RH values among different salts of the same cation. M-sulfates (M = Mg or Fe or Ca, etc.) maintain higher RH than M-perchlorates and M-chlorides. For example, MgSO4·7H2O, Mg(ClO4)2·6H2O, and MgCl2·6H2O maintain RH of ∼95%, ∼49%, and ∼38%, respectively. Similar trends are observed for Fe-, Ca-, Al-, and NaK-salts (Supplementary Table S1).
Taken together, our experimental measurements and Mellon's model demonstrate that a subsurface layer rich in hydrous salts in a hyperarid region is a quasiclosed system, whose T and RH are buffered by the salts themselves, with very-little-to-no influence from the atmosphere. The identification of Mg-sulfate with high hydration degree (6–7 H2O/mol) in DLT subsurface salt layers in Qaidam Basin validates this concept.
4.2. Monohydrated Mg-sulfate LH-1w and its formation pathway at DLT
Monohydrated Mg-sulfate (identified as LH-1w) was found at a few spots in the DLT samples. How does it form?
Two polymorphs of MgSO4·H2O were found by two independent studies (Chipera and Vaniman, 2007; Wang et al., 2009). They were designated as LH-1w (MgSO4·H2O formed at low humidity levels, ≤33% RH) and MH-1w (MgSO4·H2O formed at mid-humidity levels, ≥51% RH in laboratory, and natural kieserite). While these two polymorphs have slightly different XRD patterns (Chipera and Vaniman, 2007; Fig. 13 of Wang et al., 2009), they do have highly distinct Raman and mid-IR spectra (figs. 14 and 15 of Wang et al., 2009). Gravimetric measurements before and after baking at 400°C confirmed that both polymorphs have one structural H2O per MgSO4 formula unit.
More importantly, the two polymorphs LH-1w and MH-1w form through different paths. LH-1w has been observed as the dehydration product of MgSO4·xH2O (x = 11–4) (Chipera and Vaniman, 2007; Wang et al., 2009). MH-1w, with an XRD pattern similar to that of natural kieserite (e.g., from Lehrte, Germany), only formed at mid- to high-RH conditions, either directly precipitated from aqueous brines of Mg-SO4-H2O at high T > 95°C, consistent with hydrothermal processes, or converted slowly from LH-1w at mid-RH (51%) and higher T (50°C) in the laboratory (Wang et al., 2009).
The Raman spectrum of the DLT-03-01-11a sample revealed the existence of LH-1w (Fig. 6, spectrum b12, coexisting with starkeyite and carnallite), indicating that it is a dehydration product, not a brine precipitate. Nevertheless, at T ≤ 50°C the dehydration of MgSO4·xH2O (x = 11–6) would normally stop at starkeyite MgSO4·4H2O, because the low T cannot provide enough activation energy to overcome the metastability of substructural unit, that is, the ring made by two SO4 and two MgO2(OH2)4 in starkeyite (Wang et al., 2006a). Experiments have shown this metastability can be overcome under two circumstances: (1) when primary hydrous Mg-sulfates coexist with other catalytic species (Ca, Fe-sulfates, Fe-oxides/hydroxides, chlorides); (2) when amorphous Mg-sulfates formed as an intermediate stage of dehydration (Wang et al., 2009). In the DLT playa, mining activity likely produces amorphous Mg-sulfates, particularly during trench digging, when subsurface epsomite crystals are exposed suddenly to hyperarid conditions at DLT surface (e.g., Vaniman et al., 2004; Wang et al., 2009). The subsequent dehydration of amorphous Mg-sulfates at the DLT surface could generate LH-1w. We suggest the following formation pathway for LH-1w detected in DLT sample: MgSO4·7H2O → amorphous MgSO4·xH2O → LH-MgSO4·H2O.
Our proposed pathway contradicts a previous interpretation made by Kong et al. (2014). They claimed that “direct dehydration of hexahydrite by strong wind and sunlight is the origin of observed monohydrated MgSO4·H2O.” The T-RH ranges reported for Kong's observations (fig. 5 of Kong et al., 2014) are within the range of the above experiments (Chipera and Vaniman, 2007; Wang et al. 2009), where the direct dehydration of hexahydrite to LH-1w would not occur. Kong's conclusion was based on the nondetection of amorphous Mg-sulfates in the field, which we believe is due to the low sensitivity of a portable commercial Raman system they used in the field. The Raman signal strength of amorphous phase is usually two orders of magnitude weaker than that of the crystalline phase of same chemistry (White, 1974). The nondetection of amorphous Mg-sulfates by a portable field Raman system does not support their conclusion. Due to the importance of monohydrated Mg-sulfates on Mars, the formation in the DLT samples has to be understood based on well-established laboratory studies, to avoid future confusion.
4.3. Coexistence of Ca-sulfate with different hydration degrees
Because of the high relevance of Ca-sulfates to Mars mineralogy, the stability and dehydration of hydrous Ca-sulfates have been extensively studied (e.g., Vaniman and Chipera, 2006; Robertson and Bish, 2013; Vaniman et al., 2013; Vaniman et al., 2017). Gypsum is the most stable phase at low temperatures (T < 97°C) and anhydrite β-CaSO4 at high temperatures (T > 97°C). Bassanite is metastable at all temperatures, and γ-CaSO4 (soluble anhydrite) is unstable under ambient conditions (Bezou et al., 1995; Prasad et al., 2001; Chio et al., 2004; Robertson and Bish, 2013; Wei et al., 2015).
The ubiquitous presence of large gypsum crystals throughout the DLT area (Fig. 7c) can be readily interpreted as the result of direct gypsum precipitation from Ca-SO4-rich brine at relatively low T. However, the coexistence of Ca-sulfates with different hydration degrees in some collected DLT surface samples (Fig. 7d) does not have a straightforward explanation. The triple point of gypsum–bassanite–anhydrite is 235 MPa and 80.5°C (Mirwald, 2008), and this does not occur in DLT area (Kong et al., 2018, this volume).
Even more interestingly, γ-anhydrite was found in several of the DLT samples. This phase is also widespread in the Atacama Desert. Wei et al. (2015) reported up to w/w 20% of γ-anhydrite in some samples. γ-anhydrite is an extremely unstable CaSO4 phase, which can be generated from gypsum at T > 105°C in the laboratory, but would readily convert to bassanite in a few minutes (Chio et al., 2004; Robertson and Bish, 2013; Wei et al., 2015). Furthermore, despite its instability, γ-anhydrite was found to be the second most abundant Ca-sulfate in the vein system of the martian meteorite MIL03346, with bassanite being the most abundant phase, while no β-anhydrite was found (Ling and Wang, 2015).
Taken together, these observations underscore a knowledge gap between our understanding of the thermodynamics of Ca-sulfates and their occurrence in nature, especially in hyperarid environments, such as the DLT, the Atacama Desert, and Mars. As a side note, we observed natural yellowish fluorescence (stimulated by 532 nm laser beam irradiation; Fig. 7e) from the same sample (DL-02-03-01b; Fig. 7d) that shows abnormal coexistence of gypsum, bassanite, β-anhydrite, and γ-CaSO4. Generation of fluorescence may involve complex processes. The abnormal coexistence of four Ca-sulfates and the abnormal stability of γ-CaSO4 in the samples from hyperarid regions warrant further investigation.
4.4. Salts in the stratigraphic layers of site 01
The vertical stratigraphic section at site 01 spans 5.77 m, on the wall of a deep and long trench (Fig. 3a). There are two light-toned layers in the lower section of the trench wall and a less obvious light-toned layer near the top. Our selection of eight sampling sites was based on these visual observations. Their approximate locations are marked in Figure 3a. The height of the upper edge of each layer relative to the brine table is listed in Table 5.
It is important to note that the salt deposits from the Pleistocene era were found at ∼440 m depth below the premining surface layer at DLT playa, while the top to 12.9-m is Holocene salt deposits (Wei et al., 1989). The stratigraphic layers that we sampled at site 01 (5.77 m) and sites 03 and 04 (3.45 m) reflect only the recent salt depositions. Consequently, we only discuss variations and trends in mineralogy and chemistry in young salts consistent with the limited depth where we collected samples (Tables 5 and 6).
A sample from each sampling site (representing a layer) is typically a mix of minerals. The relative proportions of major, minor, and trace minerals were extracted from 104–305 spots analyzed along LRS line scan (column #3 of Table 5) on each of eight collected samples. The numbers listed in a row (corresponding to a sample no., DL-01-01-0x) represent the number of LRS spectra where the Raman peak of a mineral was identified. In other words, these numbers correspond to the relative proportions of salt minerals in a sample (Haskin et al., 1997), except NaCl and KCl (Table 5). The abundances of NaCl and KCl were not determined because they are Raman inactive.
For example, in sample DL-01-01-01 (site 01, 212 Raman spectra recorded), carnallite appeared in 26 spectra, a 12% occurrence rate, and hexahydrite appears in 106 (50% rate). Raman spectra that show no peaks were assigned to NaCl, because NaCl was identified by XRD in all samples (Table 5). In sum, we conclude that NaCl, carnallite, and Mg-sulfate are the major salts in DL-01-01-01.
Using data from LRS line scans (Table 5), we identified carnallite + hexahydrite as the major minerals in DL-01-01-01 and DL-01-01-02, thenardite (mirabilite) in DL-01-01-03, NaCl in DL-01-01-04, hexahydrite + pentahydrate + thenardite (mirabilite) in DL-01-01-05, hexahydrite + pentahydrate in DL-01-01-06, and polyhalite in DL-01-01-07 and DL-01-01-08.
The change in major salt mineralogy, from bottom to top of the trench wall at site 01, tracks Cl to SO4 substitution, and a trend of cation change from K-Mg to Na-Mg to K-Ca-Mg in sulfates. For example, none of the 105 LRS spectra recorded on sample DL-01-01-04 reveals hydrous chlorides or sulfates, and NaCl is the only major mineral in this layer, as determined by XRD. This distinct mineralogical layering and the visually obvious three light-toned layers on 5.77–m-tall stratigraphic section imply episodic precipitations in the recent past at this site. The chemistry of the coexisting brine at site 01, rich in Na, Mg, Ca, K (Table 3), confirms this notion.
Considering the diverse brine chemistry in the Qaidam Basin, Liu et al. (2003) developed a general salt precipitation sequence using the Pitzer model (Pitzer 1973a, 1973b). Polyhalite, while ubiquitous in the region, was not predicted from that model, probably due to the lack of available solubility data of polyhalite in the Pitzer database used. A recent study (Wollmann, 2010) revealed that the solubility of polyhalite at 25°C is lower than epsomite, but higher than that of gypsum, leonite K2Mg(SO4)2·6H2O, and syngenite K2Ca(SO4)2·H2O. Since solubility is the controlling factor for salt deposition during each episode, the order of precipitation of major salts at DLT should be (based solely on solubility): gypsum, polyhalite, epsomite, kainite, and carnallite.
In addition to geochemical considerations, we need to take into account brine permeability. We can use our salt distribution results to constrain permeability in the two vertical cross sections we studied. On one hand, carnallite KMgCl3·6H2O (with the highest solubility) occurs in all layers (except layer 04, DL-01-01-04), which suggests low volumes of brine and very limited percolation depth during each precipitation episode across the 5.77 m section. If brines would have been abundant, such brines would have redissolved previously formed carnallite (from lower layers), and reprecipitated it later in a more locally concentrated manner. On the other hand, there is Mg-sulfate enrichment in some layers (DL-01-01-01, -02, -05, -06), which again suggests that these salts precipitated episodically from small volumes of brines, with very limited percolation depth.
4.5. Salts in the stratigraphic layers of sites 03 and 04
We can see from Figure 3b that there are two distinct light-toned layers in the vertical cross section at site 03: a very thick layer from the brine table to about 2 m height (DL-03-01 to 09), and a thin layer of ∼10 cm at about 240 cm height (near DL-03-10 & 11). In the sample from site 04 (Fig. 3c), there are two distinct dark-toned layers, ∼1 cm thick, near the bottom of “shoveled section,” and a less dark-toned layer in the upper portion of section. The height of the top edge of each layer in this vertical cross section relative to the brine table is listed in Table 6. Mineral phase identifications are shown in Table 6, including the relative proportions of major, minor, and trace salts, as extracted from 104 to 215 spots of LRS line scans on each of the 23 collected samples.
Mg-sulfates (MgSO4·xH2O, x = 7, 6, 5, 4, 1) and carnallite (KMgCl3·6H2O) were found in all 23 layers at this site. This finding is consistent with the chemistry of the coexisting brine collected at the bottom of the vertical section, which shows higher Cl, K, and Mg concentrations, but lower SO4, Na, and Ca abundances (Table 3) than the brine collected at site 01.
There is a gradient of Cl-bearing minerals along the vertical cross section of site 03: carnallite KMgCl3·6H2O and Mg-sulfates dominate the top 1.76 m of cross section (DL-03-13 to 06), and polyhalite K2Ca2Mg(SO4)4·2H2O and Mg-sulfates dominate the lower 1.44 m of that section (DL-03-05 to 01) at site 03. Since K and Mg are present in all the layers, the change in mineralogy appear to be driven by Cl− depletion and slight Ca enrichment of the brine that formed the lower portion of the vertical section at site 03.
Within the 24.5 cm vertical cross section (site 04) below the brine table, the layers in the upper part (16.5 cm, DL-04-09 to 06) are dominated by kainite KCl·MgSO4·3H2O and Mg-sulfates; the layers in the lower part (8 cm, DL-04-05 to 01) are dominated by carnallite KMgCl3·6H2O and Mg-sulfates. Like in site 03, K and Mg are present across all layers in site 04, and the mineralogy here seems to track a sudden increase of Cl− in the chemistry of the brine that generated the lower portion of the section. Note that KCl was found in the lower portion of this subsection.
Comparing samples collected at sites 03 and 04, we observe a change in mineral assemblage (sulfates to chlorides) at the level of brine table (Table 6). Mg-sulfates and polyhalite K2Ca2Mg(SO4)4·2H2O are abundant in the layer above brine level (DL-03-01); Cl-rich carnallite KMgCl3·6H2O, kainite KCl·MgSO4·3H2O, and Mg-sulfates dominate in the layer below the brine level (DL-04-10).
Again, carnallite and epsomite/hexahydrite were identified in all layers throughout the vertical sections at sites 03 and 04, suggesting small volumes of brines with very limited percolation depth in each precipitation episode.
4.6. Comparison of stratigraphic layers at site 01 and those at sites 03 and 04
Overall, the stratigraphic layers at both sites have similar salt mineral assemblages that originate from Na, K, Mg, Ca, SO4, and Cl-bearing brines. In addition to NaCl, ubiquitous at both sites, the dominant salt in site 01 is Mg-sulfate with minor polyhalite K2Ca2Mg(SO4)4·2H2O. The dominant salts in sites 03 and 04 are Mg-sulfate and carnallite KMgCl3·6H2O, with minor amounts of kainite and polyhalite.
Chemical variations across sites are as follows: there are higher Cl− and lower Na and Ca levels at sites 03 and 04 relative to site 01, consistent with the chemistry of coexisting brines (Table 3). The distance between site 01 and sites 03 and 04 is about 3.4 km; both sites are at similar elevations (2704–2705 m; Table 1). The large difference in mineral assemblages of site 01 (5.77-m) and sites 03 and 04 (3.70-m) shows no direct correlation, confirming again the very limited volumes of brines during the episodic precipitations in the latest formation era (Holocene) of the DLT salt playa.
4.7. Other factors
The Tibet Plateau reached its present form in the Neogene (Lao and Liu, 1996), with the highest elevation in the south (Himalayan Mountain chain) and the lowest elevation in the north (Qaidam Basin). This overall shape, which blocks the monsoon from the Indian Ocean completely, has a profound climatic effect on the DLT area in the Qaidam Basin.
Rainfall events are extremely rare in the DLT area (Kong et al., 2018, this volume); the total annual precipitation averaged over 32 years (1980–2011) is 51 mm, with an average annual total evaporation of 2590 mm. The AI of DLT area is about 0.02 (monthly variation is 0.01–0.05; figs. 9 and 10 of Kong et al., 2018, this volume), which ranks DLT a hyperarid region by international climate classification. Based on this climatological pattern, the disturbance to DLT subsurface salt layers by rainfall is negligible. Note during the summer months, when precipitation might occur, the evaporation is maximum, ∼440 mm (fig. 10, Kong et al., 2018, this volume).
We note that DLT saline playa is the lowest spot in the ∼160 × 250 km DLT area (Table 1) surrounded in the north and west by mountain chains. It is a location where brine (and associated salts) from the higher lands in the region accumulates underground. Brine upwelling has not been documented (Kong et al., 2018, this volume) and the two stratigraphic vertical cross sections (5.77 and 3.70 m) that we sampled during the 2008 field campaign were not disturbed by mining activities.
5. Implications for Martian Subsurface Salts
As reported in Section 4, Na-, Ca-, Mg-, KCaMg-sulfates, Na-, K-, KMg-chlorides, mixed (K, Mg)-chloride–sulfate, and chlorate and perchlorate were found in the DLT playa. This mineral assemblage represents the last-stage precipitation products (sulfates and chlorides) from Na-K-Mg-Ca-Cl-SO4 brine, and the oxychlorine formation from photochemistry reaction, similar to other hyperarid regions on Earth. Overall, the DLT salt mineral assemblages bear a good similarity with the three major types of salts found on Mars: sulfate, chloride, and perchlorate.
Hydrous sulfates with known or unknown hydration degrees, Mg-, Ca-, and Fe-sulfates, have been found at the surface on Mars, in large quantities and widely distributed, by orbital remote sensing (Arvidson et al., 2005; Gendrin et al., 2005; Langevin et al., 2005; Bibring et al., 2006; Murchie et al., 2009; Roach et al., 2009, 2010; Wray et al., 2009, 2010, 2011; Lichtenberg et al., 2010; Ackiss and Wray, 2014). Hydrous Mg-, Ca-, and Fe-sulfates have been found during landed missions (Klingelhöfer et al., 2004; Clark et al., 2005; Yen et al., 2008; Renno et al., 2009; McLennan et al., 2013; Wang et al., 2006b). Putative chloride deposits have been observed in wide regions of the Southern Hemisphere (Osterloo et al., 2008, 2010). Perchlorate (ClO4 −) has been detected at the Phoenix landing site (Hecht et al., 2009) and at Gale Crater (Glavin et al., 2013; Leshin et al., 2013). The existence of oxychlorine salts was implied at Viking sites (Navarro-González et al., 2010), and at four recurring slope lineae (RSL) sites via CRISM remote sensing observations (Ojha et al., 2015).
There are three main differences between the salt assemblages we observed at DLT and those on Mars. The first is very rare detection (to date) of coexisting sulfates and chlorides on Mars (Vaniman et al., 2013). Although chlorine has been detected in every sample during all landed missions on Mars, only the present MSL mission has an in situ mineralogy tool, CheMin (XRD), to analyze drill cutting samples. At the time this article was submitted, MSL had not reached most sulfate-rich layers on Gale Crater (Milliken et al., 2010), and thus, the XRD-based detection of coexistence of sulfates with chlorides is limited, so far (Bish et al., 2013; Varniman et al., 2013, 2017). The second is the lack of detection of Fe-bearing salts at DLT, which is a product of the Fe-poor geochemistry character of DLT area and the surrounding mountains. The third is the ClO4/Cl ratio in DLT samples (Table 4). These values are similar to those in other terrestrial hyperarid regions (10−3 to 10−4 in Atacama Desert and in the ultraxerous zone in the Antarctica Dry Valleys, Grossling and Erickson, 1971; Kounaves et al., 2010b; Jackson et al., 2015), but very much lower than that found on Mars (∼4.4; Hecht et al., 2009; Kounaves et al., 2010a, 2014). Mars oxychlorine enrichment is not fully understood yet. Several groups are investigating the other formation mechanisms for oxychlorine that might operate on Mars, but not on Earth (Catling et al., 2010; Smith et al., 2014; Carrer and Kounaves, 2015; Wilson et al., 2016; Wang et al., 2017a,b, 2018).
Among all the findings of our DLT salt investigation, one stands out as the most relevant and significant for understanding Mars salt deposits. Salts with high degrees of hydration, for example, MgSO4·xH2O (x = 6,7), are stable and abundant in the subsurface of a hyperarid region (Qaidam Basin) for long periods of time (in Holocene salt deposits, up to thousands of years). This result implies that the salt-rich subsurface environment preserves a T-RH environment different than that on the surface, an environment generated by the salts themselves, where surface climatic conditions have very-little-to-no influence.
The identifications of these salts at DLT support our hypothesis (Section 1) and the thermal model of Mellon et al. (2004, 2008), as discussed in detail in Section 4.1. Notice Mellon's model applies to general cases when there is a large TI difference between top and subsurface layers, for example, ground H2O ice and subsurface salt layer on Mars. In this sense, Mellon's model is validated [in addition to Mellon's own observation at Phoenix site, Mellon et al. (2009)] by four observations on Mars that suggest very different environments within the martian subsurface.
(1) The disappearance of white-colored ejecta from a few impact craters at high latitudes between consecutive orbital observations (Byrne et al., 2009), which implies the stable existence of H2O-ice-enriched materials in subsurface; (2) the RSL during warm seasons on equator-facing slopes mainly in the Southern Hemisphere and equatorial region (McEwen et al., 2011, 2013), suggesting a temperature-dependent fluid generation in subsurface (Wang et al., 2017a,b); (3) the disappearance of light-toned clusters at the bottom of trenches made by Phoenix lander (Stoker et al., 2010), consistent with an H2O-ice-enriched subsurface layer; and (4) the color change of ferric sulfate-enriched regolith excavated from 10 cm depth by the Spirit rover after exposure to Mars surface (Johnson et al., 2007; Wang et al., 2008; Wang and Ling, 2011), supporting the stable existence of copiapite-type Fe-sulfates (e.g., Fe4.67(SO4)6(OH)2·20H2O) with high hydration degree in the subsurface of the equatorial region on Mars.
Taken together, these observations on Mars and our observation at DLT suggest that in a two-layer regolith, the subsurface high TI layer, such as H2O-ice enriched or hydrous salt enriched, is stably maintaining its H2O content, regardless the extra dry surface atmosphere. Therefore, subsurface hydrous salts can maintain a near-surface H2O reservoir that is larger than we would normally anticipate in hyperarid environment.
6. Available Liquid H2O at Relative High T
An immediate question is the availability of liquid water or brine, especially in a suitable temperature range, for the potential habitability in such environment.
As our experiments revealed (Supplementary Table S1), if sulfates, chlorates, and perchlorates do coexist in the subsurface on Mars (e.g., Mount Sharp at Gale Crater, Milliken et al., 2010), as they do in the subsurface at DLT, then hydrous sulfates can keep a relatively high RH level, which could facilitate the deliquescence of other salts at relatively high (>0°C preferred) temperature. For example, epsomite can keep an RH range near 95% (Supplementary Table S1), where the deliquescence of some chloride hydrates (e.g., MgCl2·6H2O or CaCl2.4H2O, reported at DLT and Antarctica) would be thermodynamically allowed. In addition, the rate of deliquescence of a chloride hydrate increases quickly with the rise of environmental temperature (e.g., average deliquescence rate increases 10 times with 10°C of T increase; Wang et al., 2017a,b).
There is a major temperature difference between this brine generation model and those previously studied, that is, from the mixed hydrous salts or from pure salt. Brine would form at relatively high temperature (the higher the T, the faster the deliquescence) in salt mixtures, while the deliquescence of pure salt layer, which is buffered by its own RH, only occurs at temperature below the eutectic Te [<0°C for sulfates, <−40°C for chlorides, and <−70°C for perchlorate (Möhlmann 2011a, 2011b; Möhlmann and Thomsen, 2011; Toner et al., 2014)].
An environment with high enough T and a limited amount of salt-H2O liquid might be a suitable environment for some form of life, such as the halophiles (Kong et al., 2010) and bacterial/archaeal lipids found in subsurface salts of DLT area (Cheng et al., 2017). Whether this type of environment would be habitable on Mars depends on many more factors that are different from Earth, for example, a salt precipitation sequence on Mars, water activity, free radicals generated by UV, and other processes, all of which need further investigation.
Footnotes
Acknowledgments
The authors express their sincere appreciation to the McDonnell Center for Space Science at Washington University in St. Louis (WUSTL) for its generous financial support for their field expedition to Qaidam Basin on Tibet Plateau in 2008, and its continuous financial support for laboratory sample analysis and article writing. They also thank the invaluable help provided by the scientists from the Key Laboratory of Saline Lake Environments and Resources, Institute of Mineral Resources, CAGS, the two SUV drivers from Gelmu geologic exploration team, and the geologists from local mining companies. They appreciate the comments made by two reviewers and the associate editor of Astrobiology that helped improve this article significantly.
Author Disclosure Statement
No competing financial interests exist.
Abbreviations Used
Associate Editor: Christopher McKay
References
Supplementary Material
Please find the following supplemental material available below.
For Open Access articles published under a Creative Commons License, all supplemental material carries the same license as the article it is associated with.
For non-Open Access articles published, all supplemental material carries a non-exclusive license, and permission requests for re-use of supplemental material or any part of supplemental material shall be sent directly to the copyright owner as specified in the copyright notice associated with the article.