
Abstract
The presence of perchlorate on Mars suggests a possible energy source for sustaining microbial life. Perchlorate-reducing microbes have been isolated from perchlorate-contaminated soils and sediments on the Earth, but to date, never from an environment that is naturally enriched in perchlorate. The arid Pilot Valley paleolake basin in Utah is a Mars analog environment whose sediments are naturally enriched with up to ∼6.5 μg kg−1 perchlorate oxyanions. Here, we present results of field and laboratory studies indicating that perchlorate-reducing microorganisms co-occur with this potential electron acceptor. Biogeochemical data suggest ongoing perchlorate reduction; phylogenetic data indicate the presence of diverse microbial communities; and laboratory enrichments using Pilot Valley sediments show that resident microbes can reduce perchlorate. This is the first article of the co-existence of perchlorate-reducing microbes in an environment where perchlorate occurs naturally, arguing for Pilot Valley's utility as an analog for studying biogeochemical processes that may have occurred, and may yet still be occurring, in ancient martian lacustrine sediments.
1. Introduction
Perchlorate (ClO4
−),
With a redox potential on par with oxygen (+1.287 V), perchlorate is a powerful oxidant that can serve as an electron acceptor in microbial metabolism. Microbial perchlorate reduction was first reported more than 90 years ago (Aslander, 1928); since then, more than 40 isolates of perchlorate-reducing microorganisms (PRM) have been described in the literature (Bardiya and Bae, 2011; Youngblut et al., 2016b). PRM have been isolated from a variety of environments, including gold mine drainage sites, contaminated and pristine groundwater sites, wastewater sludge, natural swamps, and from deep sea sediments (Waller and Cox, 2004). In addition to their wide ecological distribution, PRM are phylogenetically diverse, with representatives in both the bacterial and archaeal domains (Liebensteiner et al., 2013, 2016; Nerenberg, 2013; Oren et al., 2014; Barnum et al., 2018).
Surprisingly little evidence exists documenting the occurrence of PRM in settings where naturally occurring perchlorate (NOP) is abundant. Further, no studies document PRM actively metabolizing NOP in a Mars analog environment (Kounaves et al., 2010; Liebensteiner et al., 2016; Youngblut et al., 2016b). Evidence for the co-existence of PRM and NOP, and for the active metabolism of NOP by PRM in a Mars analog environment together would lay the basis for a terrestrial model to investigate possible perchlorate-driven ecosystems on Mars. Further, such a finding could help shed light on the evolutionary history of microbial perchlorate reduction. Here, we present evidence that PRM co-exist with NOP and are likely actively metabolizing this high-energy anion in the Pilot Valley basin of the Great Salt Lake Desert; we offer this work as the foundation for both studying the evolutionary ecology of perchlorate reduction on the Earth and evaluating perchlorate-driven microbial ecosystems that may have existed in ancient paleolake basins on Mars.
2. Field Site Description and Study Motivation
The Pilot Valley basin has been studied as a geochemical and mineralogical Mars analog environment due to the presence of aqueous minerals similar to those found in multiple martian paleolake basins (Lynch et al., 2015; Lynch, 2015). The basin can also serve as a sedimentological analog to martian paleolake environments as it contains the full sequences of 28 lake cycles going back more than 800,000 years (Eardley et al., 1973; Rey, 2012). Pilot Valley is a closed basin paleolake that consists of hypersaline fluvial and lacustrine deposits. It hosts a shallow brine aquifer that encompasses the upper 6 m of basin fill and is maintained through subsurface groundwater flow by mountain-front recharge from the adjacent Silver Island Mountain Range. Pilot Valley also contains extensive microbial mats and putative microbially induced sedimentary structures (MISS) (Lines, 1979; Carling et al., 2012; Lynch et al., 2015).
Sediment and brine aquifer fluid samples were collected from the Pilot Valley basin for geochemical analysis, along a defined study transect (Fig. 1A, B), as part of an ongoing geobiological investigation of this system (Lynch et al., 2015, 2016; Lynch, 2015). Analysis of sediment perchlorate anions (Table 1, Supplementary Table S1; Supplementary Data are available online at
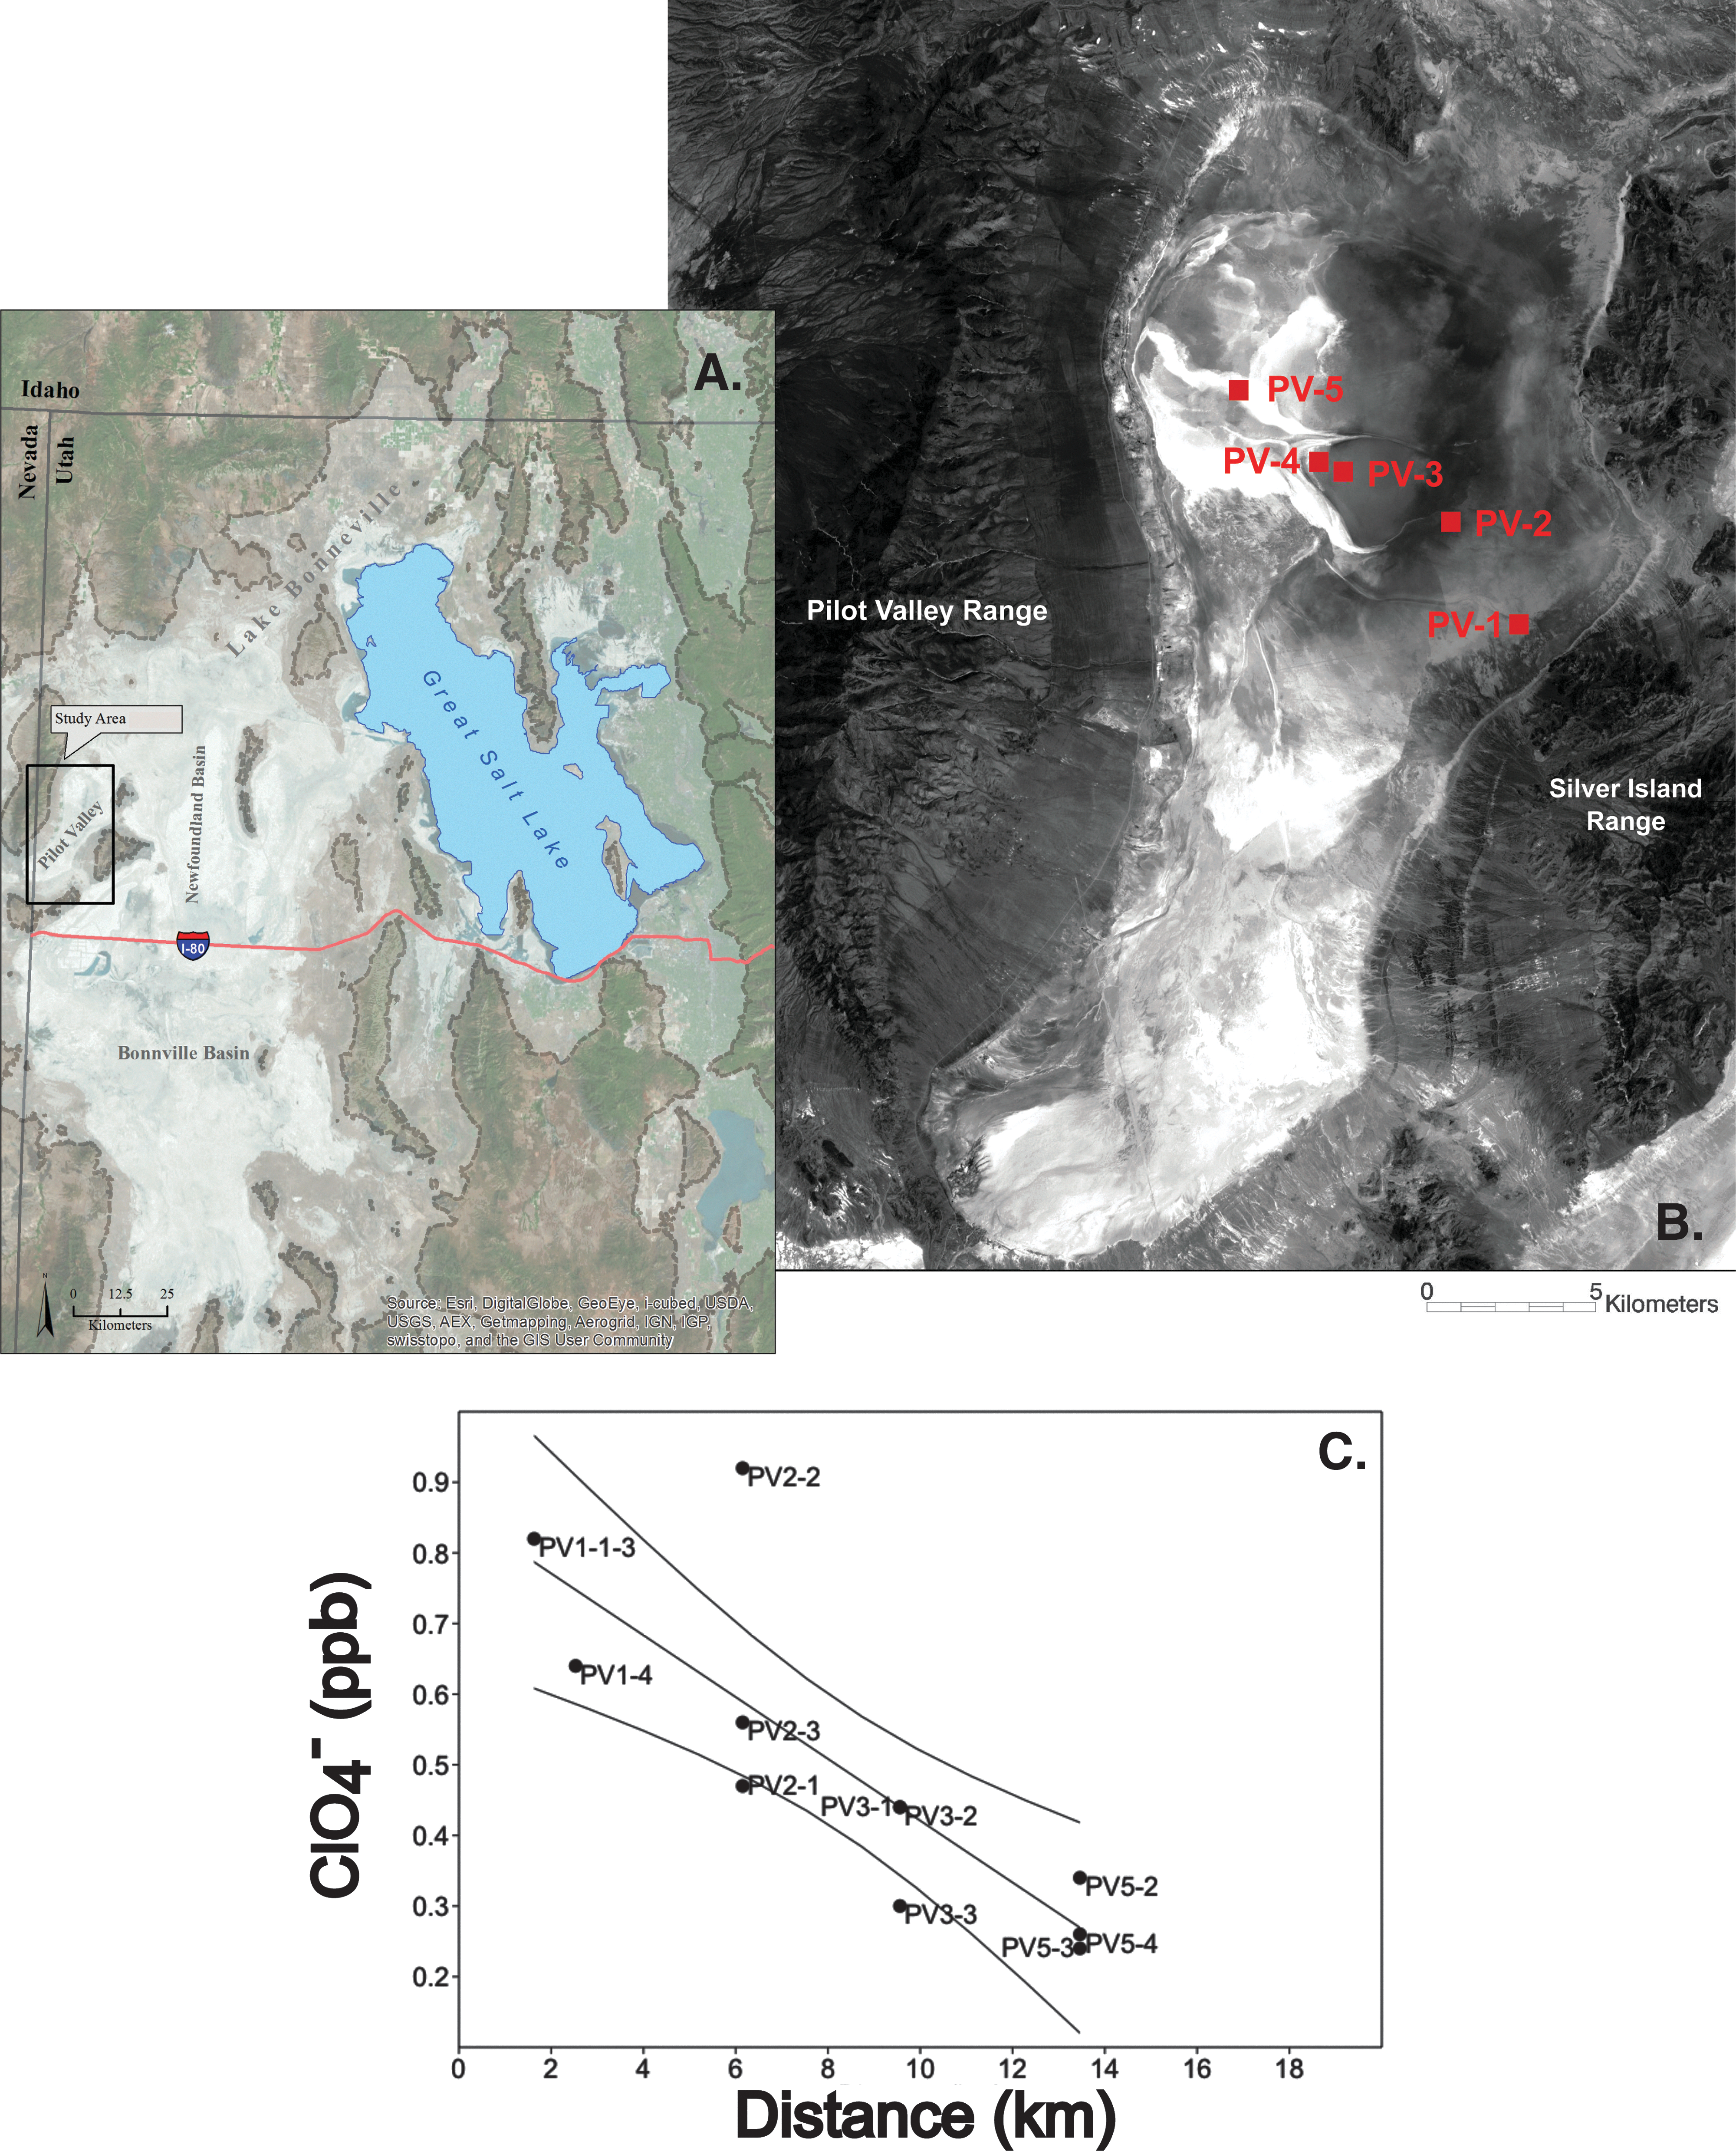
Field site and plot of perchlorate measurements.
Pilot Valley Average Sediment Oxyanions
Data obtained from previous studies (Lynch et al., 2015).
SD = standard deviation.
3. Materials and Methods
3.1. Field sampling and enrichment cultures using Pilot Valley sediments
The four samples (Salt Lake Desert [SLD] 113, SLD 114, SLD 115, and SLD 124) used for all of the experiments in this study were taken from putative MISS structures discovered at site PV4 (Fig. 1B). Site PV4 has the greatest concentration and diversity of MISS features, suggesting that it might exhibit a higher concentration of biomass relative to sites lacking these structures. The samples exhibited two different morphologies: roll-up mats (Fig. 2A) and laminated leveling structures (Fig. 2B–D), as described by Noffke (2010). On collection, samples were placed in vacuum-sealed bags and stored at 4°C before incubation in medium designed to enrich for PRM in a near-native environment.

Pilot Valley field samples for enrichments obtained at site PV4.
To test for biotic perchlorate reduction and to select for PRM microbes, sediments were incubated in a minimal enrichment medium prepared in accordance with Coates and Jackson (2009). The enrichment medium was amended with 18 mM acetate as a carbon source and 8 mM (∼1000 ppm) sodium perchlorate as an electron acceptor (preparation of medium is detailed in Supplementary Materials and Methods). The first microcosm experiment (EXP 1) was set up in quadruplicate. Cross-sectioned subsamples were removed from each field sample in 20 g quantities for the roll-up mats, which had limited sample mass, and 40 g quantities for all other field samples. Sub-samples were added to 120-mL serum vials containing 100 mL of the enrichment medium described earlier. To create anoxic conditions, serum vials were sparged for ∼10 min with an 80:20 gas mixture, respectively, of N2 (g) and CO2(g) . Microcosms were subject to light versus dark treatments, as shown in Table 2, to account for the possible effect of cyanobacteria and anaerobic phototrophs known to exist within the microbial community of Pilot Valley sediments (Lynch, 2015). Blanks lacking inocula were prepared and incubated along with the sample replicates for each experiment as a means to detect contamination from the laboratory environment. Serum vials were incubated at room temperature (∼25°C) for 371 days; measurements were made at four time points: 0, 25, 97, and 371 days.
Samples & Treatments
All C and K replicates were subjected to light treatment. All others were subjected to dark treatment.
SLD, Salt Lake Desert.
To account for the possibility of perchlorate toxicity and to ensure that perchlorate utilization could be detected, a second microcosm experiment (EXP 2) was initiated with a lower perchlorate concentration of 0.8 mM (∼100 ppm). EXP 2 was set up in triplicate: Cross-sectioned subsamples were removed from each field sample in 6 g quantities and added to 120-mL serum vials with 60 mL of medium to create a slurry having a 10:1 medium:substrate ratio. Microcosms in EXP 2 were subject to the same control blanks, headspace gas conditions (80:20 N2:CO2), and light/dark treatment as EXP 1. The EXP 2 experiment ran for 285 days, with measurements taken at time-zero and at the end-point.
At each time point in EXP 1 and EXP 2, ∼20 mL of fluid was removed for geochemical analysis and 1–2 mL of fluid/sediment mix was removed for DNA analysis. For EXP 1, 20 mL of fresh perchlorate medium was added to each microcosm (blanks included) as a matrix spike at time point #1 (day 25). Geochemical samples from EXP 1 and EXP 2 were 0.2 micron filtered and stored at 4°C; samples for DNA analysis were stored at −80°C.
3.2. DNA extraction and quantification
Bulk DNA was extracted with the DNeasy PowerSoil DNA Isolation Kit (Catalog #12888-100; formerly MoBio Laboratories). DNA was extracted from each microcosm sample in triplicate, following the manufacturer's protocol with two modifications. First, at the final step of the DNeasy protocol, only one spin filter per microcosm sample was used to concentrate the DNA from all the extraction replicates. Second, the concentrated DNA was subjected to a clean-up protocol, provided by MoBio Laboratories (and now available as Qiagen's DNeasy Powerclean Pro Cleanup Kit–Catalog #12997-50), to remove additional humic substances from pooled DNA. DNA was quantified with a Life Science Qubit 2.0 fluorometer.
3.3. DNA sequencing and analysis
The six sediment samples that exhibited the highest DNA concentrations (SLD 115A, SLD 115C, SLD 124A-D) were used for genomic analyses. This sample set will henceforth be referred to as the “Seq-six” sample set. DNA from each sample in this set from day 95 of EXP 1 was prepared for 16S rRNA amplicon sequencing via the Illumina MySeq platform. DNA was amplified in triplicate by using a Roche Light Cycler 480 II (Roche Life Sciences) using a 515F forward primer (5′-GTGYCAGCMGCCGCGGTAA-3′) and a 12 bp golay-adapted 806R reverse primer (5′-XXXXXXXXXXXXCCGGACTACHVGGGTWTCTAAT-3′) (Jasper et al., 2014); these provide coverage of variable regions 4 and 5 in the 16S rRNA gene. Samples were amplified in 25 μL reactions, each of which contained, per reaction: Phusion Master Mix (New England BioLabs, Inc.), 3% final volume dimethyl sulfoxide, 0.4× final concentration SYBR Green, and 200 nM of each primer. The Light Cycler program for amplification was 94°C for 3 min; ∼30 cycles: 94°C for 45 s, 50°C for 10 s, and 72°C for 90 s, which was terminated once all samples had been amplified (∼27 cycles). Amplification replicates for each sample were pooled, purified, and normalized by using the Agencourt AMPure XP system. The final samples were quantified with a Life Sciences Qubit 2.0 Fluorometer.
Amplicons were sequenced on the Illumina MiSeq platform with the NEBNext Ultra DNA Library Prep Kit and a MiSeq Reagent Kits v2 2 × 250 500 cycle kit. The resulting sequences were processed in Quantitative Insights into Microbial Ecology (QIIME) 1.8 (Caporaso et al., 2010b) starting with the joined_paired_ends.py script to stitch together the paired reads with minimum 100 bp overlap. Stitched sequences were then oriented and parsed of barcodes by using the extract_barcodes.py script. Sequences and barcodes were demultiplexed by using the split_libraries_fastq.py script with the default parameters with the exception of the --barcode_type 12 to suppress error correction of barcodes. Operational taxonomic units (OTUs) were picked de novo by using Uclust with default parameters. Chimeras were filtered out with ChimeraSlayer and the Greengenes 13_8 aligned reference database. Representative sequences were aligned with PyNAST (Caporaso et al., 2010a) and the Greengenes 13_8 aligned reference database. Taxonomy was assigned with Uclust and the Greengenes 13_8 97% similarity taxonomy reference database. Beta diversity analysis and principal coordinate analysis were also conducted with QIIME. Statistical analysis was carried out by using paleontological statistics (PAST) (Hammer et al., 2001). Illumina sequence data are available via the European Nucleotide Archive (ENA) database: accession number PRJEB11780.
3.4. Quantitative polymerase chain reaction
Quantitative polymerase chain reaction (PCR) analyses of the chlorite dismutase (cld) gene and the perchlorate reductase (pcrA) gene were performed on DNA samples extracted on day 371 from the same microcosms described earlier as “Seq-six” with a LightCycler 480 II instrument (Roche Life Sciences). Quantitative polymerase chain reaction (qPCR) standards for cld and pcrA were generated from the genome of a known perchlorate reducer, Dechloromonas agitata (Achenbach et al., 2001). The cld gene was amplified by using the primer set UCD-238F/UCD-646R (UCD-238F 5′-TYGAVAARCAYAAGGAHAAVGT-3′ and UCD-646R 5′-GAGTGGTAVARYTTVCGYTT-3′) (Bender et al., 2004). The pcrA gene was amplified by using the primer set pcrA320F/pcrA598R (pcraA320F 5′-GCGCCCACCACTACATGTAYGGNCC-3′ and pcrA598R 5′-GGTGGTCGCCGTACCARTCRAA-3′) (Nozawa-Inoue et al., 2008). The qPCR formulation for both gene sets contained, per 20 μL reaction: 10 μL Perfecta SYBR Green Supermix (Quanta Biosciences), 6 μL nuclease-free water, 1 μL each of forward and reverse primer (10 μM each), and 2 μL template DNA. The thermocycler programs for both primer sets were as described by De Long et al. (2010).
3.5. Perchlorate and chloride analysis
Perchlorate (ClO4 −) was measured by sequential ion chromatography-mass spectroscopy/mass spectroscopy. The anion was quantified by a Dionex LC 20 ion chromatography system consisting of GP50 pump, CD25 conductivity detector, AS40 automated sampler, and Dionex IonPac AS16 (250 × 2 mm) analytical column. The IC system is coupled with an Applied Biosystems–MDS SCIEX API 2000TM triple quadrupole mass spectrometer equipped with a Turbo-IonSpray™ source. A hydroxide (NaOH) eluent at 0.3 mL min−1 was followed by 90% acetonitrile (0.3 mL min−1) that served as a postcolumn solvent. To overcome matrix effects, all samples were spiked with Cl18O4 − or Cl18O3 − internal standard. Samples were analyzed in batches of eight, including an analytical duplicate and spike. Samples with elevated Cl (>10,000 mg/L) or SO4 (>1000 mg/L) were either diluted before analysis or, in some cases, precleaned by using On-Guard™ II Ag or Ba cartridges (Dionex). Statistical analysis of perchlorate results was conducted by using the statistical tools in KaleidaGraph (Synergy Software) and PAST (Hammer et al., 2001). Chloride and other anions were measured by standard ion chromatography; these methods are reported in the Supplementary Materials and Methods.
4. Results
4.1. Microcosms inoculated with Pilot Valley sediments reduce perchlorate
Figures 3 and 4 show the results of EXP 1 and EXP 2, respectively. In both experiments, sediment-containing microcosms reduced perchlorate whereas blank (no sediment) controls did not (EXP 1: one-way analysis of variance p < 0.0001; EXP 2 paired t test p < 0.001). No significant differences were detected between light-incubated and dark-incubated microcosms.
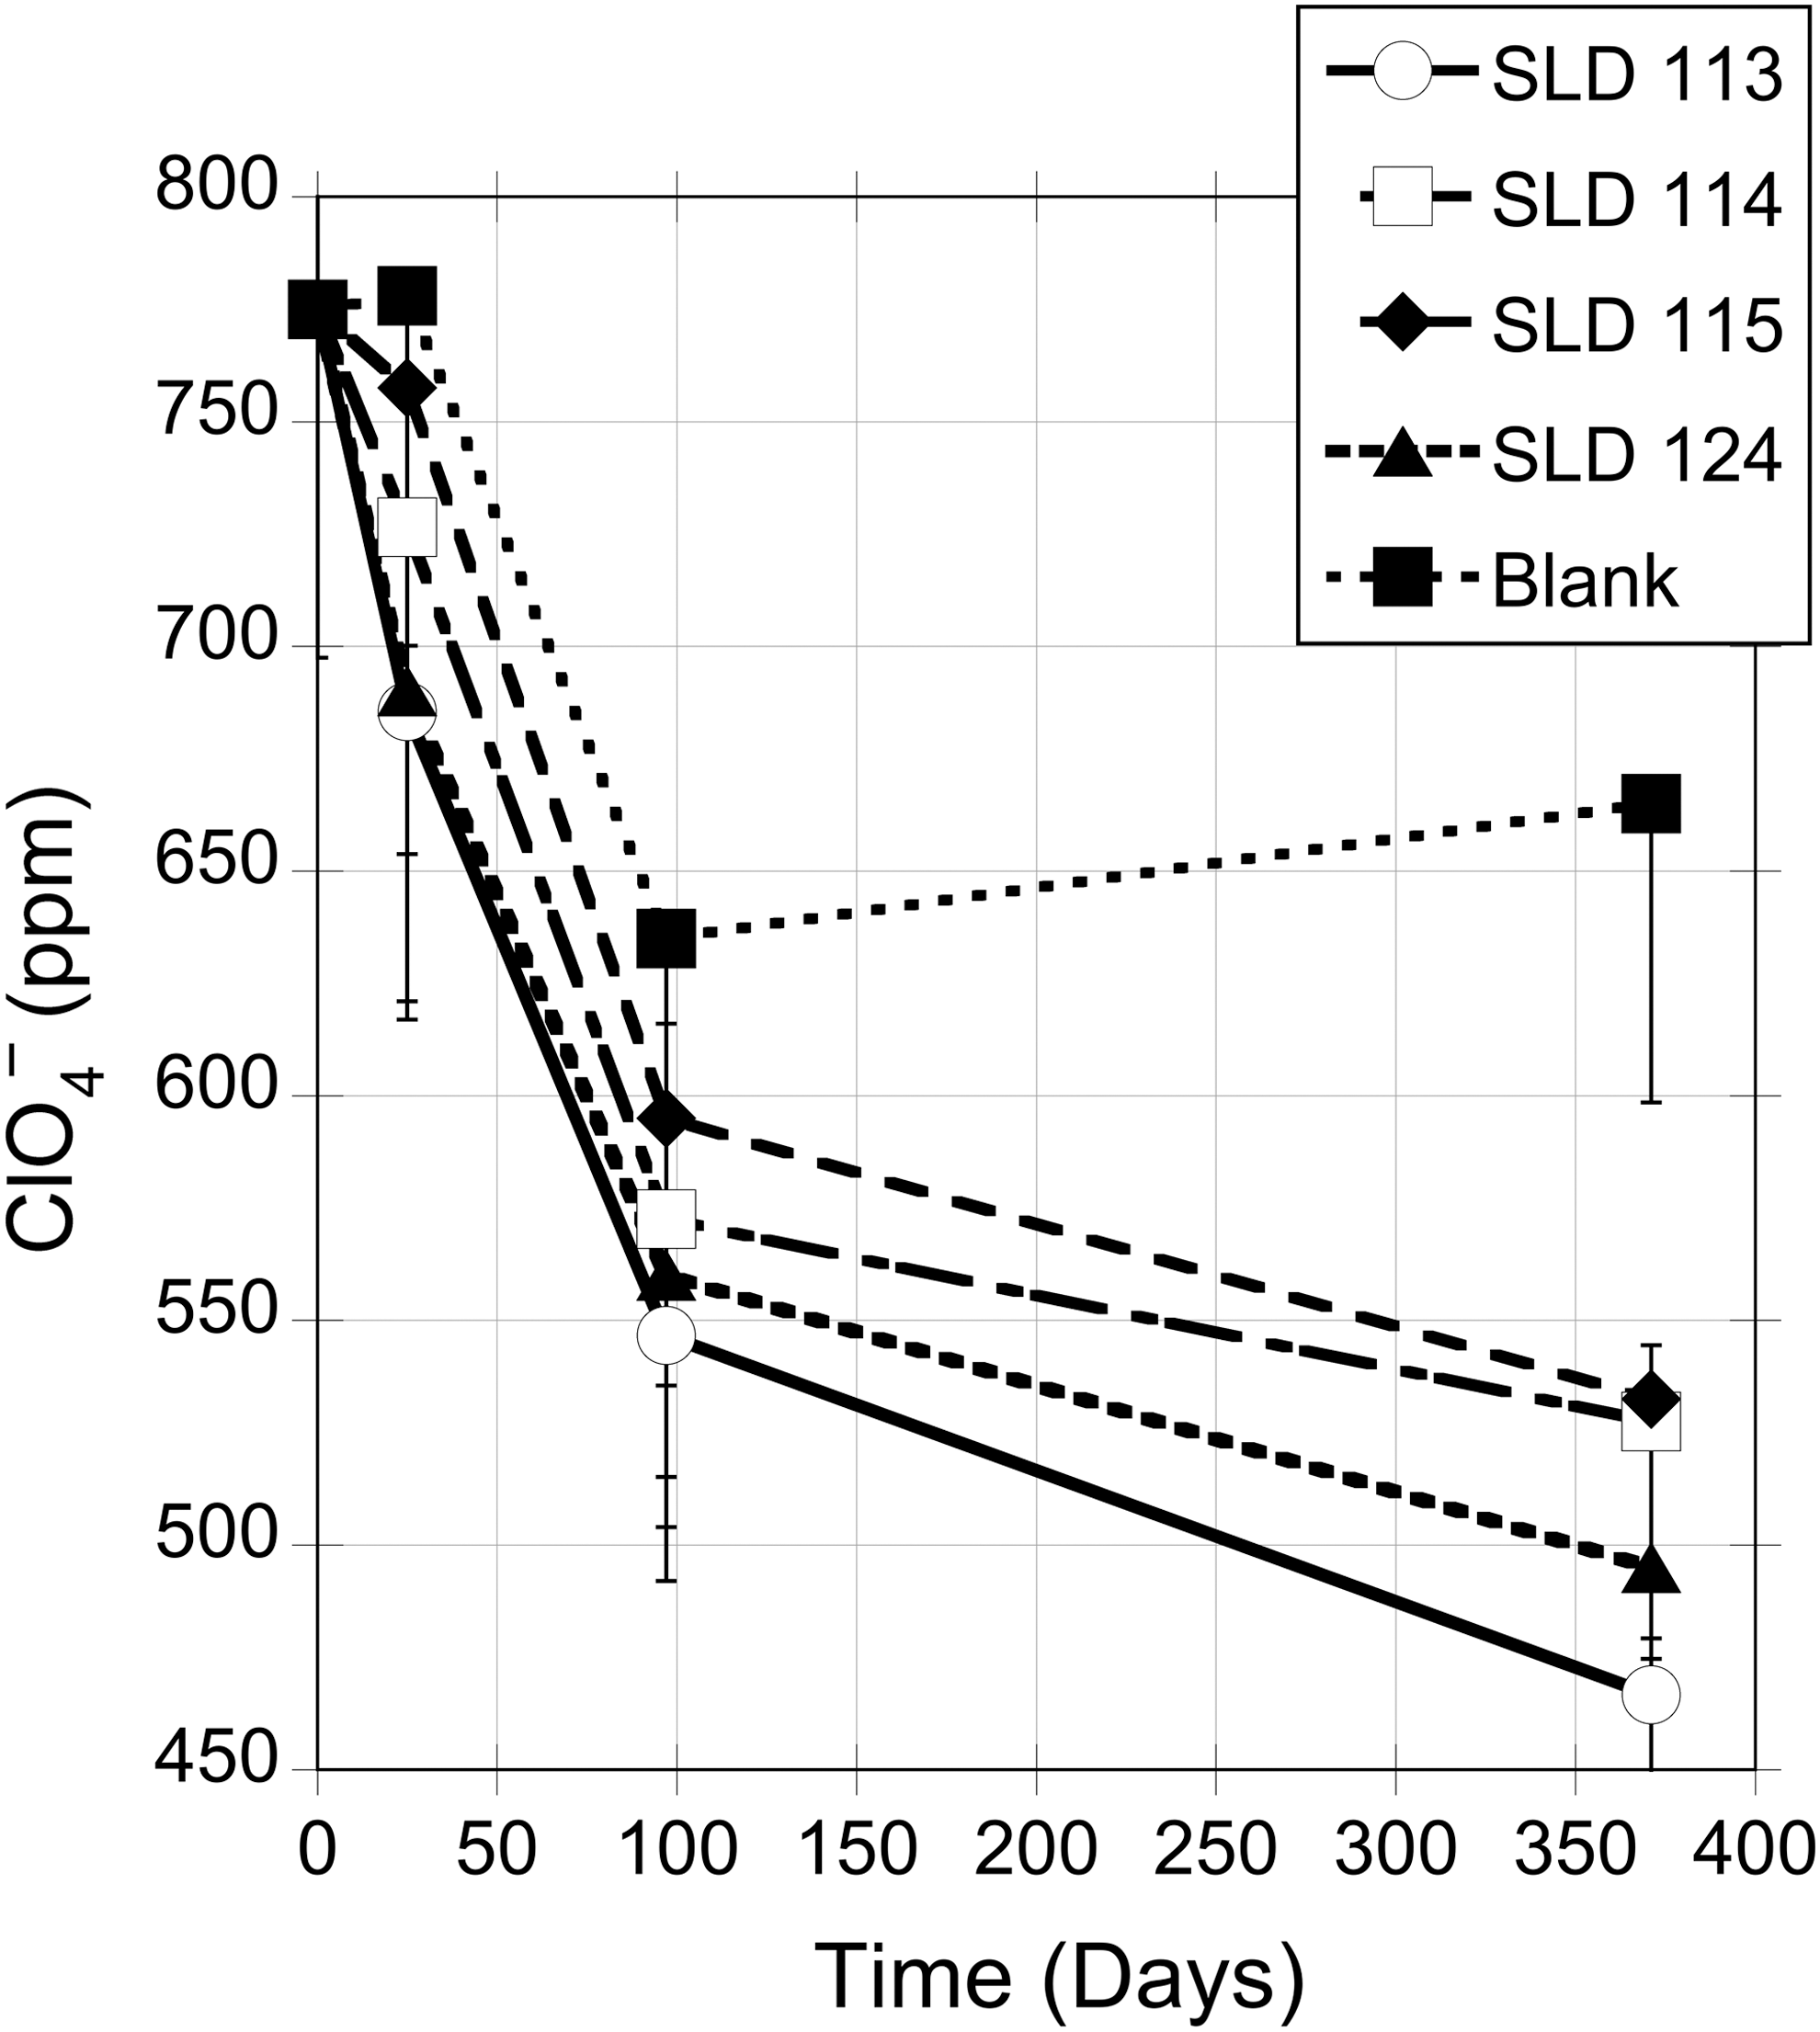
EXP 1 Perchlorate utilization: 1000 ppm (8 mM) sodium perchlorate starting concentration. Plot shows average perchlorate concentration of all samples. The error bars represent the standard instrument measurement error of 10% of measured value. Enrichment samples were retrieved from site PV4.

EXP 2 Perchlorate utilization: 100 ppm (0.8 mM) sodium perchlorate starting concentration. Plot shows average perchlorate concentration of the first four samples. The last sample, “Sample Blank-Cl,” is the chloride concentration (in ppm) of the experimental sample blanks. The error bars represent the standard deviation. Enrichment samples were retrieved from site PV4.
In EXP 1, the decrease in perchlorate among blank controls between day 25 and 97 is statistically significant (student paired t test p < 0.0001), suggesting the possibility of microbial contamination. To rule out this possibility, chloride concentrations were measured in all blanks at all time points (Table 3 and Fig. 4), reasoning that if blanks had been contaminated with PRM, reduction products would favor increased Cl− concentrations in the blanks. Unfortunately, very high Cl− concentrations (3–4 wt.%) in Pilot Valley sediments made evaluating Cl− problematic (Supplementary Table S1). Still, in EXP 1, chloride concentration in blanks varied little across all time points (Table 3), as was also the case in EXP 2 (Fig. 4). We, therefore, conclude that our blanks were not compromised. We also conclude that in EXP 1 the precipitous early decline in perchlorate concentration is due to a lack of perchlorate amendment on day 25. Hence, instead of producing a matrix spike, perchlorate was diluted across all samples and blanks. This conclusion is supported by the fact that each sample (blanks included) showed a steep drop with a similar slope between day 25 and 97. After day 97, slopes vary through the end of the experiment: The blank slope becomes positive, whereas all sample slopes are negative.
Chloride Measurements of Sample Blanks
Blank 1 and Blank 2 are samples from two independent batches of media prepared for the microcosms during initial setup.
4.2. Phylogenetic analysis reveals the existence of PRM-containing taxa in Pilot Valley sediments
Having determined that Pilot Valley basin sediments have the capacity to reduce perchlorate, we undertook an analysis of their microbial community structure with the aim of discovering whether or not taxonomic groups known to harbor PRM were present. We subjected DNA samples extracted from the Seq-six sample set to phylogenetic analysis. After processing and quality control, this procedure yielded 305,337 16S rRNA sequences (Table 4), which were clustered into 836 OTUs. Firmicutes and Bacteroidetes emerged from these analyses as the two most abundantly represented phyla, followed by Proteobacteria (Fig. 5).
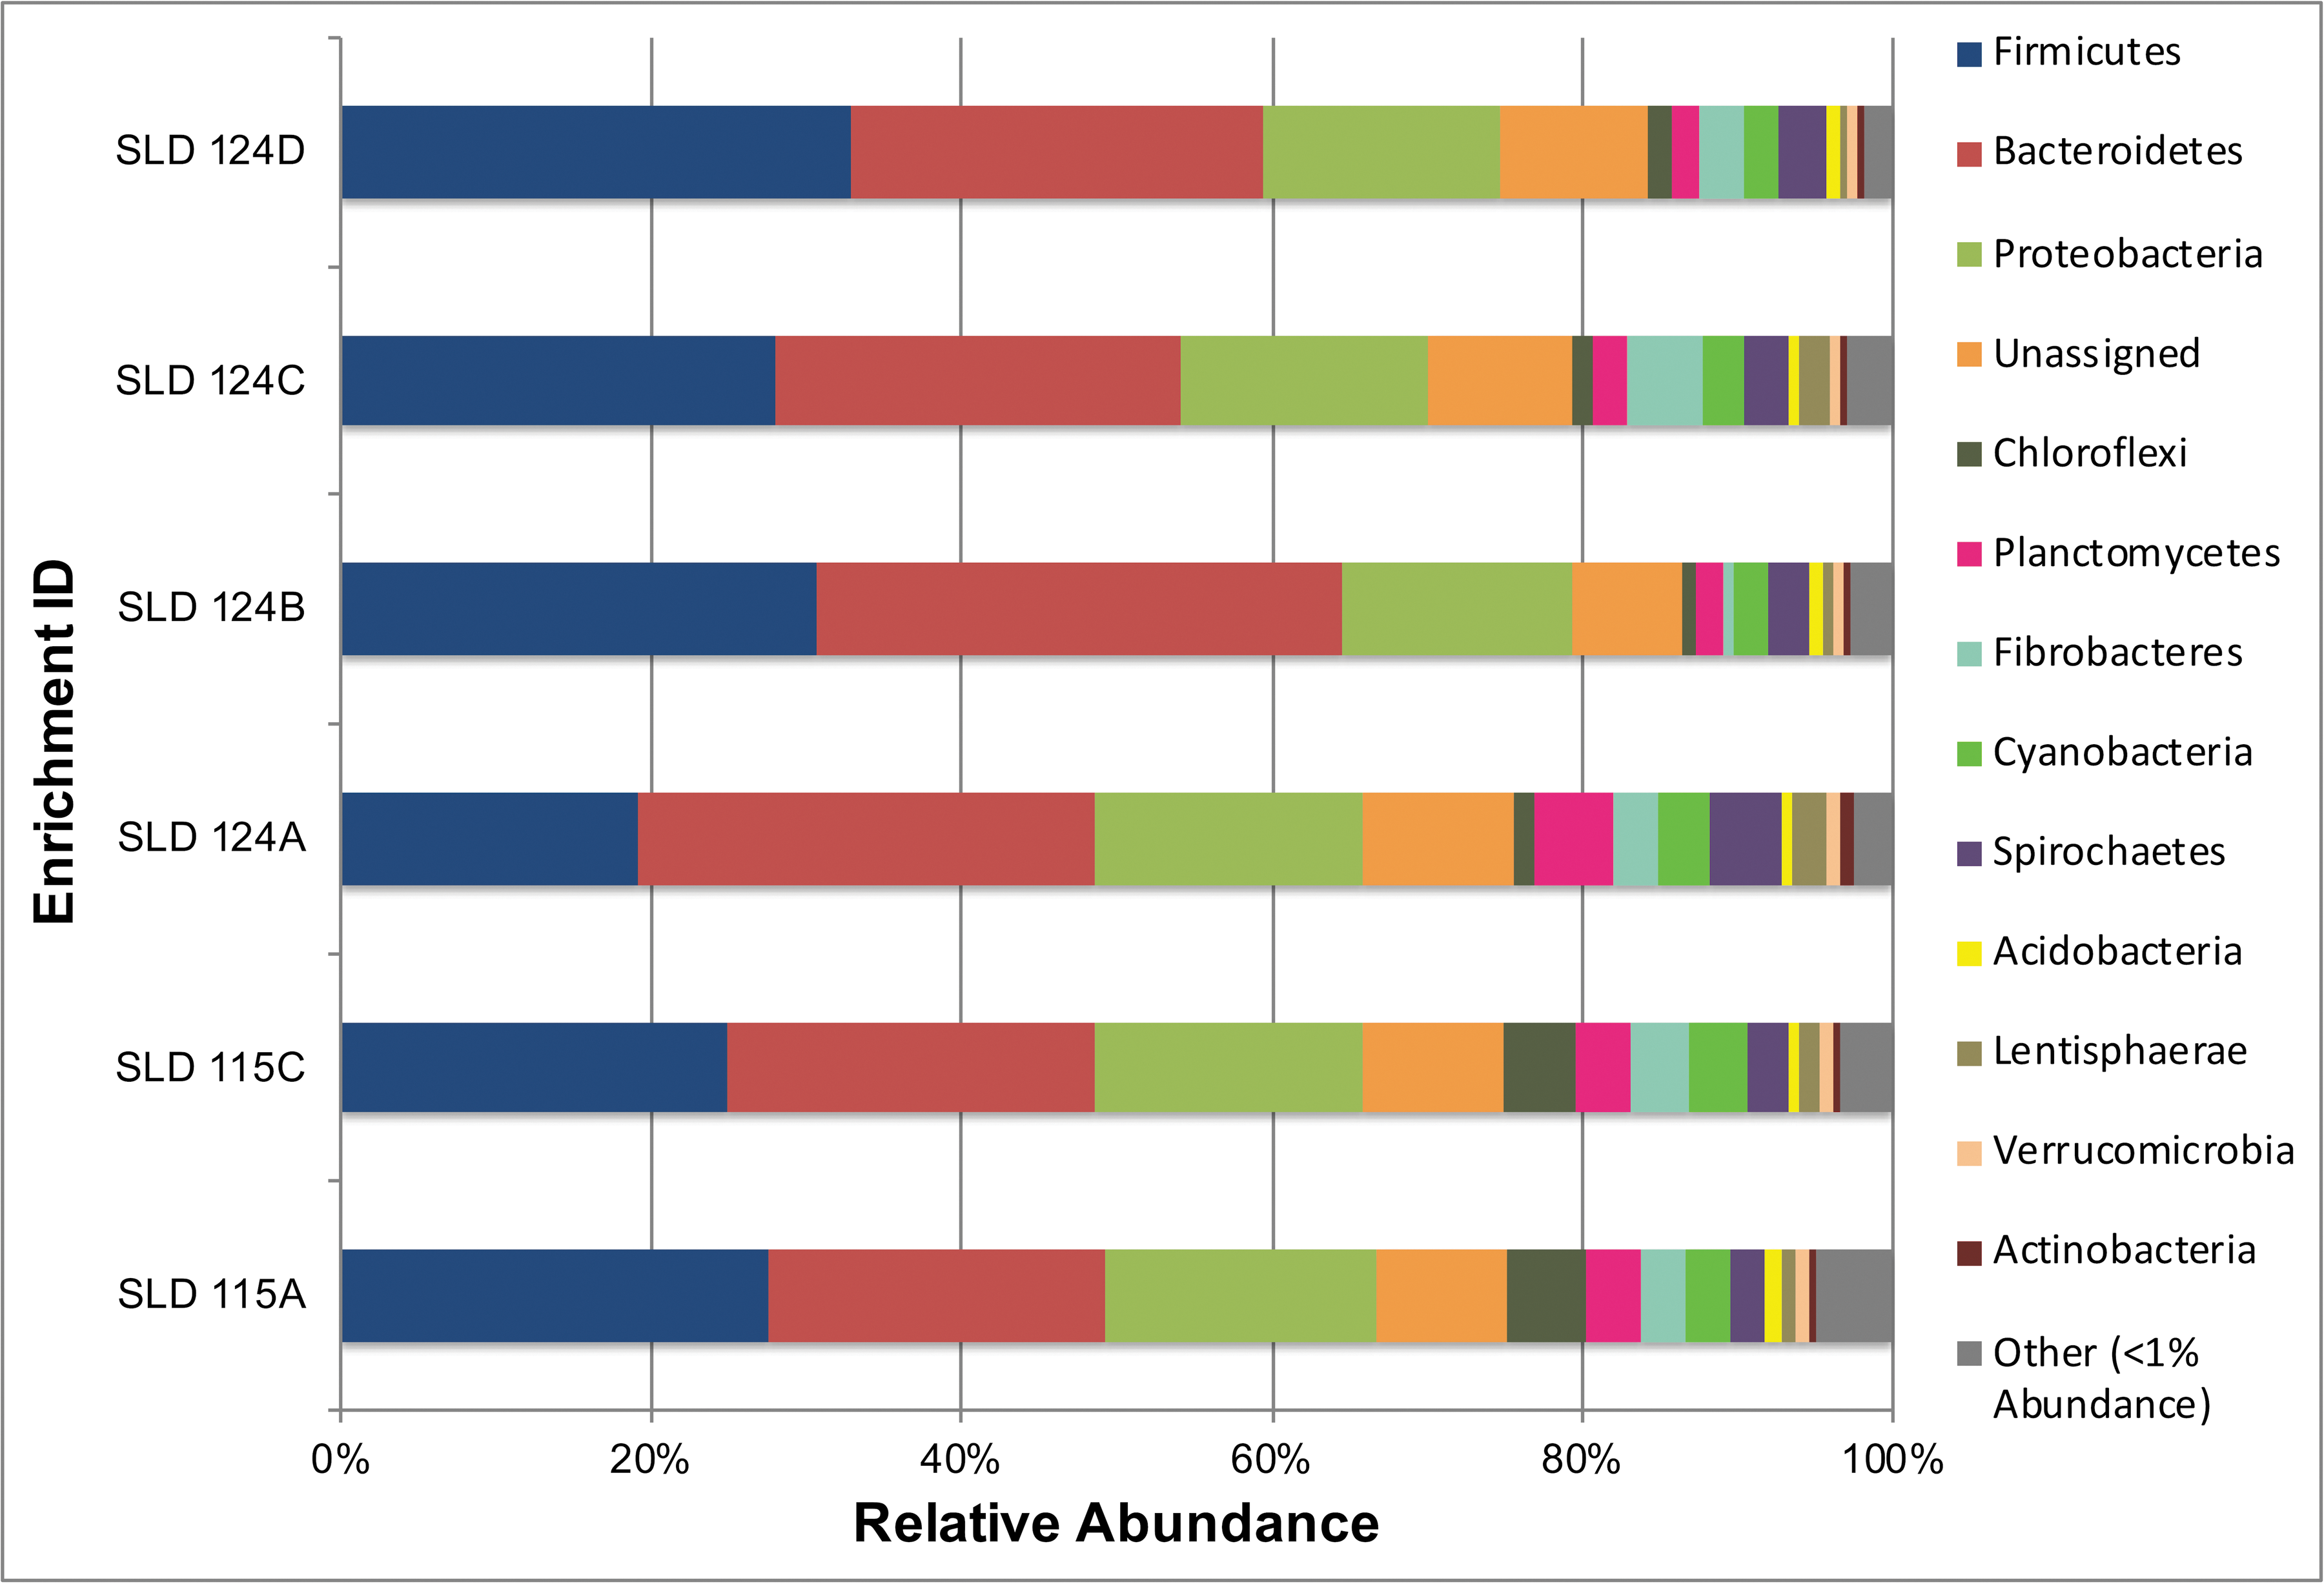
Phylum-level community structure for perchlorate enrichment experiments depicted in Figure 3. DNA samples were obtained from day 97 Seq-six sample set and analyzed with respect to the diversity and relative abundance of 16S rRNA gene sequences. Enrichment samples were retrieved from site PV4.
Summary Sequencing Statistics
Sequencing statistics based on six enrichments from the day 97 time point: SLD 115A, SLD 115C, and SLD 124A-D.
OTUs = operational taxonomic units.
Both SLD 124 and SLD 115 samples were taken from site PV4 in the Pilot Valley basin (Figs. 1C and 2). Site PV4 and site PV3 lie in close proximity (Fig. 1C), and they exhibit similar morphological and geochemical features (data not reported). Figure 6 compares community structure among SLD 124 replicates collected at site PV4 with that of Pilot Valley sediments collected at site PV3 (Lynch, 2015). The detailed microbial ecology of site PV3 is part of an ongoing metagenomic study of the Pilot Valley basin. The data we report here on PV3 indicate that community structure in sediments collected at this site is similar to that at site PV4, represented by SLD 124 samples enriched from that site. At both sites, the Proteobacteria and Bacteroidetes are among the phyla most abundantly represented, and within these groups a multitude of exactly the same OTUs were recovered (ENA accession numbers PRJEB11780 and PRJEB11779). Thus, PV3 serves as a reasonable proxy for the starting point of the SLD enrichment experiments.
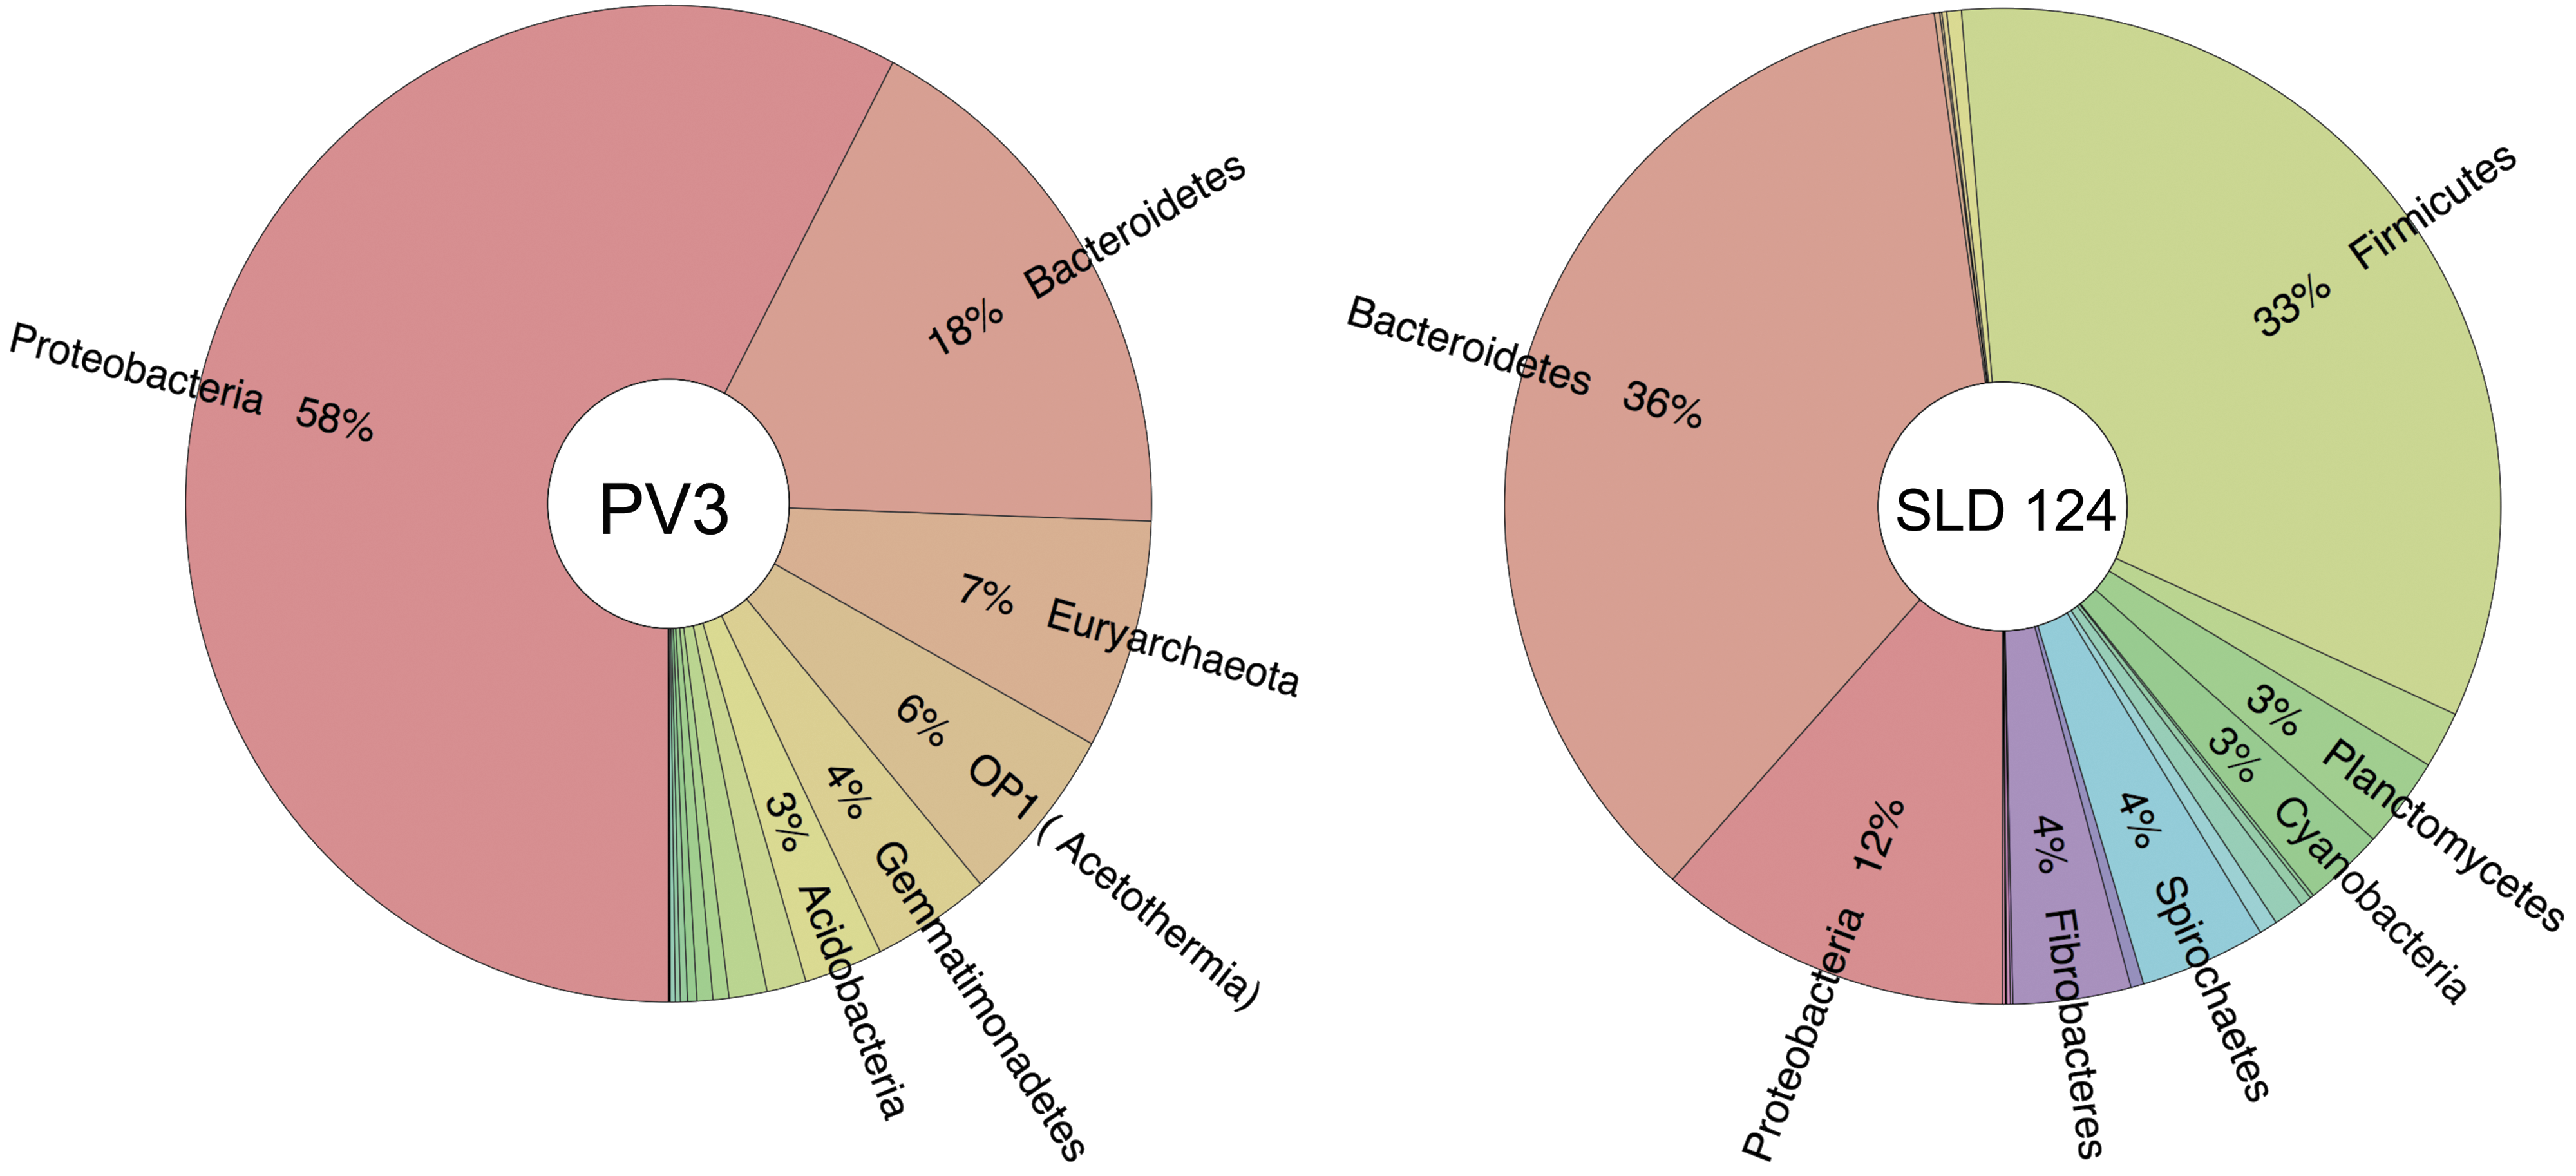
Phylum-level community structure inferred from 16S rRNA gene sequences obtained from sites PV3 and PV4 (sample SLD 124). Plot generated using Krona (Ondov et al., 2011).
The microbial community structure of SLD 124 samples also differs in important respects from that of native PV3 sediments (Fig. 6), and it is tempting to speculate that these differences may have arisen over time during the course of the enrichments. For example, relative abundance of Salinibacter is 2.4% in PV3, compared with 6% in the SLD 124 enrichments. Collectively, the relative abundance of Halomonas, Halobacteria, Gemmatimonadetes, candidate phylum Acetothermia (formerly OP1), and Acidobacteria drops from 41% at PV3 sediments to less than 1.2% in SLD 124 enrichments.
Beta diversity (Supplementary Fig. S1) shows that communities enriched from cores SLD 115 A and C are more similar to one another than to SLD 124A-D and vice versa across the following metrics tested: Bray-Curtis, Morisita-Horn, unweighted Unifrac, and weighted Unifrac. Similarity percentage analysis using the Bray-Curtis metric reveals that the largest contributors to the dissimilarity between the SLD 124 replicates and the SLD 115 replicates are a combination of known and unknown taxa within the Bacteroidetes, Firmicutes, Chloroflexi, and Fibrobacteres (Table 5).
Similarity Percentage Analysis of Dissimilarly Between SLD 124 and SLD 115 Replicates
Overall average dissimilarity was 43.5 (R 2 = 0.75, P ANOSIM = 0.07). Analysis data of taxa contributing less than 2% to dissimilarity not shown. Contribution % is the percentage that the taxa contribute to dissimilarity. Cumulative % is the Cumulative Contribution of Taxa to dissimilarity. Average dissimilarly per tax is calculated using the Bray Curtis Metric multiplied by 100.
Mean Ab = mean abundance of sequences.
Taxonomic groups known to harbor PRM are present in Pilot Valley enrichments. These taxa are Azospira, Haloarcula, Acinetobacter, Sporomusa, and Marinobacter (Youngblut et al., 2016b; Barnum et al., 2018). Taxonomic groups known to harbor chlorate (ClO3 −) reducers are also present: Shewanella and Pseudomonas. Taken together, these genera constitute between 0.5% and 1% of the total 16S rRNA sequences recovered in our dataset. Taxonomic assignments using short-read Illumina data at such low abundances can be problematic. Nevertheless, a detailed study of taxonomic classification with our methods (Bokulich et al., 2018) claims success in resolving taxa to the genus level, provided that assignment method parameters are optimized, as was done here. At the Order level, we observed five taxonomic groups whose members are known to include PRM: Halobacteriales, Rhodocyclales, Pseudomonadales, Altermonadales, and Clostridiales.
4.3. qPCR shows that perchlorate reductase and chlorite dismutase gene sequences are present in Pilot Valley sediments
qPCR of DNA extracted from all SLD 124 replicates shows that both the cld gene and the pcrA gene are present (Table 5). The highest copy number of cld is seen in SLD 124A, and the lowest copy number is in SLD 124D. pcrA copy number is fairly consistent across all four SLD 124 samples. Little evidence for either gene sequence is observed in SLD 115A or SLD 115C. To estimate what percentage of the enrichment culture might consist of PRM, the following formula, which assumes that both genes occur as a single copy in each PRM, was applied to our dataset, as per De Long et al. (2010):
where P is the percent PRM; Q is the cld or pcrA copy number per qPCR; M is the mass of genomic DNA per qPCR; C is a constant equal to 9.13 × 10¹¹ bp/ng of DNA; and G is the estimated average bacterial genome size: 4.501 × 10⁶ bp (De Long et al., 2010). The cld qPCR assay estimates PRM abundance at ∼0.5–4% (Table 6). The pcrA assay estimates PRM abundance to be only ∼0.01–0.02% (Table 6); however, this assay is known to be less reliable and has been shown to consistently underestimate pcrA (De Long et al., 2010, 2012).
Quantitative Polymerase Chain Reaction Results
N/A = not applicable; PRM = perchlorate-reducing microorganisms.
5. Discussion
The aim of this study is to determine whether biotic perchlorate reduction might be an ongoing process in the Pilot Valley basin sediments. This was done by measuring the distribution of perchlorate in this environment, by testing the capacity of the Pilot Valley sediments to reduce exogenous perchlorate in sediment microcosms, and by performing genomic analyses that would reveal the taxonomic composition of resident microbial communities, as well as the relative abundance of gene sequences that encode proteins involved in perchlorate reduction.
5.1. Hydrogeological evidence that points to biotic perchlorate reduction in Pilot Valley
The results of our utilization study show that some constituent of the microbial community in the Pilot Valley sediments can reduce perchlorate. These findings coupled to the unique hydrogeology of the basin may help explain why perchlorate concentration declines along the rim-to-basin transect at the Pilot Valley study site (Table 1, Fig. 1). This statistically significant pattern (Ordinary Least Squares regression R 2 = 0.67, p ≤ 0.002) is correlated with increased wetting of the basin near-surface sediments as well as with increased abundance of microbial mats along the transect (Rey, 2012; Lynch et al., 2015). Given that perchlorate is extremely mobile, a possible explanation for its loss in near-surface sediments would be its transport into the subsurface brine aquifer. However, no perchlorate was detected in the brine aquifer fluids (Lynch et al., 2015); moreover, given the hydrogeology of the basin, it is unlikely that the perchlorate would be transported into the subsurface.
The Pilot Valley groundwater system has a complex hydrogeology in that the shallow brine aquifer appears to have no convection cells (K.A. Rey, Pers. Commun.). Although the surface of the Pilot Valley basin occasionally floods, there is little-to-no downward transmission of that floodwater from the basin surface to the subsurface brine aquifer and therefore no physical sink for NOP in surface sediments (K.A. Rey, Pers. Commun.). Early modeling efforts based on limited empirical data concluded that convection could occur within the shallow basin brine aquifer (Duffy and Al-Hassan, 1988; Fan et al., 1997). However, more recent in situ studies indicate that shallow brine aquifer recharge is chiefly generated via precipitation run-off from the Silver Island Mountain Range; thus, convection cells are unlikely to occur in the basin (Carling et al., 2012; Mayo and Tingey, 2014).
Perchlorate concentrations in flow channel sediments at the base of the Silver Island Mountain Range measure at ∼6.5 μg kg−1. However, as previously noted, perchlorate is below the level of detection (≤0.5 ppb) in brine aquifer fluids. There is no known abiotic, low-temperature reduction pathway for perchlorate in the terrestrial environment (Urbansky, 2002). Thus, even if some downward mobilization of perchlorate from the near-surface sediments occurred, these hydrogeological considerations point to biotic perchlorate reduction activity throughout the Pilot Valley basin.
5.2. Genomic and phylogenetic considerations for biotic reduction in Pilot Valley
Canonical perchlorate reduction is the most common form of biological perchlorate reduction among documented PRM species; the process is mediated by the two key enzymes: perchlorate reductase (PcrA) and chlorite dismutase (Cld) (Youngblut et al., 2016b). This pathway encompasses reduction of both perchlorate (ClO4 −) and the resulting chlorate (ClO3 −) via PcrA, and detoxification of the resulting chlorite (ClO2 −) to innocuous chloride and oxygen by Cld. Here, we evaluated the presence of the pcrA and cld genes as two molecular indicators of biotic perchlorate reduction capacity in Pilot Valley. Both the genes that encode each of these enzymes were recovered from SLD 124 sediments (Table 6).
Our 16S rRNA phylogenetic data corroborate qPCR copy number estimates of the cld gene, and they suggest that PRM make up ∼1% of communities enriched from SLD 124 sediments (Table 7). Cld is found in a variety of taxa that do not utilize PcrA. For example, organisms such as Shewanella and Pseudomonas found in our study can only reduce chlorate (ClO3 −) but make use of Cld for chlorite detoxification. Also, diverse Cld enzymes help to detoxify chlorite in nitrite-oxidizing bacteria (Maixner et al., 2008; Mlynek et al., 2011). Hence, detection of cld alone does not allow us to unequivocally state that perchlorate reduction occurs in this environment. However, detection of the pcrA gene in the SLD 124 replicates coupled with these cld data does indicate that capacity.
Known Perchlorate-Reducing Microorganisms and Chlorate Reducer Abundance in Seq-six Dataset (% Relative Abundance)
Data reported for taxa are reported in % relative abundance with respect to full 16S rRNA dataset. % Chlorate reducers only refers to the percentage of perchlorate reducers present in the sub-community reported here.
Two factors may account for the fact that qPCR copy number estimates of pcrA are an order of magnitude lower than those of cld. First, as noted, the current design of primers for pcrA is known to underestimate pcrA abundance assayed via qPCR (Nozawa-Inoue et al., 2008; De Long et al., 2010, 2012). This is due to the sequence variability in pcrA and subsequent mismatches across known species within selected regions of the most widely used primer. We believe that, as elsewhere, pcrA genes in the Pilot Valley sediments are simply mismatched to the currently available primers (Ledeker and De Long, 2013; Youngblut et al., 2016a). The recovery of novel pcrA sequences via metagenomics can be expected to improve primer design(s) for this key protein. Second, the 16S rRNA data indicate that a small population of known chlorate reducers exist within Pilot Valley and canonical chlorate reduction also makes use of Cld; hence, some portion of the cld gene copies we recovered can be attributed to chlorate reducers. In fact, Table 7 shows that chlorate reducers make up between 23% and 60% of the identified Cld-utilizing community in this study; such organisms may thus harbor between 23% and 60% of the cld copy numbers estimated via qPCR. Given the broad distribution of cld and the low efficiency of the pcrA primer, we cannot certify that there are canonical perchlorate reducers in Pilot Valley sediments. But the fact that both these genes can be retrieved from site SLD 124 makes it possible to confidently assert that the capacity for perchlorate reduction does exist, justifying the need for further study of this remarkable environment.
Although both perchlorate reduction genes were detected in the SLD 124 sample only, perchlorate drawdown was observed in both SLD 115 and SLD 124. This observation can be attributed to several causes, which are not mutually exclusive. First, it could be that PRM failed to grow, but SLD 115 DNA was extracted from multiple time points in increasing concentrations (unreported data). Second, qPCR within SLD 115 sediments might have been inhibited, as hypersaline matrices are known to carry a variety of PCR inhibitors. We deem this unlikely as the DNA extractions and PCR cleanup procedures used were optimized to remove PCR inhibitors from environmental samples.
Third, given that 16S rRNA sequence data indicate that potential PRM are present in SLD 115 and given that beta diversity analysis shows that SLD 115 communities are dissimilar from those in SLD 124 (Supplementary Fig. S1), we believe the most likely explanation for our observation is that SLD 115 sediments contain PRM that utilize alternative reduction pathways involving neither Cld nor PcrA. cld copy number-based estimates indicate a PRM population of ∼0.5% in SLD 115 (Table 6), but a large fraction of those may simply be chlorate reducers. The remaining PRM in these samples may carry out perchlorate reduction via cryptic or symbiotic pathways (Youngblut et al., 2016b). For example, many organisms that can reduce nitrate can also reduce perchlorate via nitrate reductase enzymes; in such cases, the resulting chlorite is often reduced externally, obviating the need for Cld (Oren et al., 2014; Liebensteiner et al., 2015). There is an appreciable amount of nitrate in the Pilot valley sediments (Supplementary Table S1) and taxa that harbor nitrate reducers are present, so perchlorate reduction via known or yet-to-be-discovered cryptic pathways is a possibility. In any case, our data strongly suggest that PRM are present and diverse in Pilot Valley sediments, that they thrive in the presence of perchlorate, and that some have the enzymatic machinery to use perchlorate as a terminal electron acceptor.
6. Implications for Mars Habitability
One of the chief astrobiological goals of the Mars exploration program is to ascertain the distribution of potentially habitable environments on the red planet. A prerequisite to achieving this goal is a thorough understanding of the potential energy sources and sinks that could drive microbial respiration (MEPAG, 2015). Although perchlorate is an abundant and highly energetic metabolic resource on Mars, studies of NOP analogs on Earth have been limited, due to lack of evidence that NOP and PRM co-occur in such environments. Our data suggest that they do in the Pilot Valley basin of northwestern Utah, and that a PRM community exists that can metabolize NOP.
The discovery of perchlorate salts on Mars is a significant finding for astrobiology as it opens up the possibility of a readily available and highly energetic electron acceptor that could have helped sustain ancient microbial ecosystems. Though halotolerant PRM have been previously identified, until now PRM have never been detected in an environment naturally enriched in perchlorate rather than enriched as a result of anthropogenic processes (Oren et al., 2014; Matsubara et al., 2016). Our study results provide tantalizing evidence for the possibility of perchlorate-reducing microbial communities living at a Mars analog site. If these findings are confirmed by isolation of PRM in pure culture, work that is currently underway, and by a systematic evaluation of the functional role(s) that the resulting isolates play in the Pilot Valley ecosystem, we will further advance understanding of the constraints around perchlorate reduction in this extreme environment and translate that information for exploration of potential habitable zones in future missions such as the Mars 2020 rover.
Footnotes
Acknowledgments
The authors thank Zackary Jones for his assistance with Illumina sequence protocols and analysis, and Susan De Long for providing Dechloromonas agitata, which served as a positive control for our qPCR experiments. They also thank Jennifer Glass and Jennifer Hanley for their thoughtful discussion and review of this article. This research was supported by funding from the NASA Harriet Jenkins Pre-Doctoral Fellowship Program, the Edna Bailey Sussman Internship Program, the Bechtel K-5 Excellence in Education Initiative at the Colorado School of Mines, as well as by the NASA Astrobiology Institute Director's Discretionary Fund and by start-up funds provided to FR by the College of Science at the Georgia Institute of Technology. All DNA sequence data and subsequent metadata related to this study can be obtained through the ENA via accession number PRJEB11780.
Author Disclosure Statement
No competing financial interests exist.
Abbreviations Used
Associate Editor: Charles Cockell
References
Supplementary Material
Please find the following supplemental material available below.
For Open Access articles published under a Creative Commons License, all supplemental material carries the same license as the article it is associated with.
For non-Open Access articles published, all supplemental material carries a non-exclusive license, and permission requests for re-use of supplemental material or any part of supplemental material shall be sent directly to the copyright owner as specified in the copyright notice associated with the article.