
Abstract
Terrestrial icy environments have been found to preserve organic material and contain habitable niches for microbial life. The cryosphere of other planetary bodies may therefore also serve as an accessible location to search for signs of life. The Wireline Analysis Tool for the Subsurface Observation of Northern ice sheets (WATSON) is a compact deep-UV fluorescence spectrometer for nondestructive ice borehole analysis and spatial mapping of organics and microbes, intended to address the heterogeneity and low bulk densities of organics and microbial cells in ice. WATSON can be either operated standalone or integrated into a wireline drilling system. We present an overview of the WATSON instrument and results from laboratory experiments intended to determine (i) the sensitivity of WATSON to organic material in a water ice matrix and (ii) the ability to detect organic material under various thicknesses of ice. The results of these experiments show that in bubbled ice the instrument has a depth of penetration of 10 mm and a detection limit of fewer than 300 cells. WATSON incorporates a scanning system that can map the distribution of organics and microbes over a 75 by 25 mm area. WATSON demonstrates a sensitive fluorescence mapping technique for organic and microbial detection in icy environments including terrestrial glaciers and ice sheets, and planetary surfaces including Europa, Enceladus, or the martian polar caps.
1. Introduction
Once considered inhospitable to life, in recent decades icy environments on Earth have been found that preserve organic material and even harbor active microbial communities (Priscu et al., 1998, 1999; Siegert et al., 2001; Priscu, 2005; Santibáñez et al., 2005, 2018; Krembs et al., 2011; Uhlig et al., 2015). Glacial ice on Earth is known to contain organic material (Barnes et al., 2003; Barletta et al., 2012), including bacteria, algae, viruses, plant fragments, pollen grains, and black carbon. Glacial ice cores from Antarctica have been found to contain bulk cell concentrations of 102 to 103 cells/mL (Abyzov et al., 1998, 2004; Christner et al., 2006), and microbes have been observed in 3590 m deep accretion ice above Lake Vostok (Priscu et al., 1999; Siegert et al., 2001). Higher cell concentrations, up to 108 cells/mL, have been measured from silty regions on the Greenland ice sheet (Miteva et al., 2009), and the total number of bacterial cells in the Greenland and Antarctic ice sheets is estimated to be 9.61 × 1025 cells (Priscu and Christner, 2004). Habitable spaces are known to persist in icy environments, including cryoconite holes on glacial surfaces that contain organic and mineral sediment and microenvironments within veins between ice grain boundaries (Maccario et al., 2015; Cook et al., 2016; Smith et al., 2016). Organic material, including cells, and geochemical compounds including sulfates and nitrates can become extruded into the fluid-filled veins and boundaries between grains during the recrystallization of snow into glacial ice (Barletta et al., 2012; Maccario et al., 2015), increasing the local concentration of these materials by a factor of 104 to 105 (Mader et al., 2006). In this concentrated liquid environment, active metabolic processes have been documented (Boetius et al., 2015), although at a slowed rate (Bakermans and Skidmore, 2011) compared to temperate conditions. While examples of these processes have been observed in glacial ices, the full extent to which microbes are adapted to these environments and their in situ activity remains largely elusive (Morgan-Kiss et al., 2006; Priscu et al., 2008). As the extent of active biology within glacial ice is not well understood, further work is required to constrain the chemical gradients, nutrients, and biosignatures and their distribution in ice. Understanding these aspects of icy habitats on Earth will inform the search for life throughout the Solar System, including the icy crusts of ocean worlds such as Europa and Enceladus as well as the polar caps of Mars (Jepsen et al., 2007; Priscu and Hand, 2012).
The study of organic material in ice through laser-induced fluorescence is well established (Bramall, 2007; Rohde and Price, 2007; Rohde, 2010; Pautler et al., 2012; D'Andrilli et al., 2017). Fluorescence techniques, including excitation emission matrices (EEMs) are capable of trace aromatic organic detection and characterization of dissolved organic matter (Bhartia et al., 2008; Barker et al., 2010; Johnson et al., 2011). However, in these and other established methods of ice analysis, bulk samples are typically melted and concentrated for analysis, resulting in a loss of the spatial context of organic deposition. In situ techniques, including Raman spectroscopy, have been demonstrated to enable detection of organic material in ice without melting the sample (Rohde et al., 2008; Böttger et al., 2017). Deep-UV (DUV) techniques have also been demonstrated to distinguish microbes and other organic compounds based on their fluorescence spectra (Bhartia et al., 2010; Eshelman et al., 2015; Eshelman et al., 2018; Shkolyar et al., 2018), and field DUV fluorescence instruments have been deployed to study deep marine biospheres, successfully detecting microbe-like signatures (Bhartia et al., 2010; Salas et al., 2015). The work described here builds on prior field instrumentation using DUV fluorescence to study bacteria in situ (Salas et al., 2015) and in icy environments (Rohde et al., 2008).
The Wireline Analysis Tool for Subsurface Observation of Northern ice sheets (WATSON) is an instrument under development at NASA's Jet Propulsion Laboratory in collaboration with The University of Southern California, Montana State University, and Honeybee Robotics. WATSON incorporates DUV fluorescence spectroscopy along with a fine-scale 2D mapping capability to search for and determine the spatial distribution of organic material. WATSON leverages technology developed for SHERLOC, the Mars 2020 DUV Raman and fluorescence spectrometer (Beegle et al., 2015), repackaged into a 101.6 mm diameter tube 1.2 m long that can be lowered into an ice borehole. Like SHERLOC, WATSON scans a pulsed 248.6 nm laser across a sample surface, collecting fluorescence emission in a backscatter geometry and producing a spectral map of fluorescent materials. The primary science objective of WATSON is to determine the spatial distribution of organic matter, including microbes, present in glacial ice. WATSON is intended to achieve this objective by in situ measurements of the ice borehole wall, obtaining spectral maps to spatially correlate organic material and biosignatures to inorganic minerals and the geochemical environment throughout the depth of the borehole.
The 248.6 nm excitation wavelength of the WATSON laser was selected for the ability to electronically excite the absorption bands of organic molecules containing aromatic rings, including those found in bacteria, resulting in strong laser-induced fluorescence in the 275–450 nm range (Bhartia et al., 2008). This technology is well suited for icy environments, as ice does not absorb significantly between 248.6 and 450 nm (Onaka and Takahashi, 1968). At the millimeter- to centimeter-scale depth of field of WATSON's spectrometer, bubble-free ice, analogous to blue ice found in a glacial ice environment, is effectively transparent, as demonstrated in Section 4.5. The primary spectral signature from ice, the Raman O-H stretching mode, presents as a narrow band between 268 and 274 nm (3000 and 3700 cm−1) (Cross et al., 1937) and can provide morphological information about the physical makeup of the ice matrix (e.g., features including bubbles, cracks, and veins) while not overlapping with fluorescence signals from other materials.
Detection of organics, microbes, and potential biosignatures on Solar System bodies and their spatial distribution are fundamental capabilities required to meet NASA's strategic goals. This capability was highlighted by the Mars 2020 Science Definition Team report (Mustard et al., 2013) and subsequent Mars 2020 payload selection that incorporated instruments such as SHERLOC, PIXL, and SuperCam to use noncontact spectroscopic methods to assess the distribution of organics, minerals, key elements, and potential biosignatures. More recently, the Europa Lander Science Definition Team (Hand et al., 2017) highlighted the need for spectroscopic analysis of organics using SHERLOC as an example for the strawman payload. The primary goal of WATSON is in situ determination of the spatial distribution of microbial and organic material in a borehole. Subsurface in situ analysis is a necessary step for exploration of planetary environments including the northern polar cap on Mars, the icy surfaces of Europa, the deposited ice layers near Enceladus' plumes, and the organic and aqueous ices of Titan (National Research Council, 2011). In situ characterization of subsurface ice will lead to a better understanding of life in ice and constrain our understanding of how it can survive and be preserved in the icy regions of planetary bodies (e.g., Mars polar region, Europa, and Enceladus).
Here we present the instrument design and operations of WATSON and discuss the results of laboratory experiments intended to determine the sensitivity to organic material and the ability to detect organic material under various depths of ice. Interrogation of the ice with a single laser pulse is shown to result in sufficient emission to characterize the morphology of the ice and detect microbial cells in analogs to terrestrial glacial ice. These experiments demonstrate the utility of a field-deployable compact DUV borehole instrument for the detection and mapping of organic material in a natural glacial ice system. The work described here was performed in anticipation of coupling the WATSON instrument to a Honeybee Robotics Planetary Deep Drill (Zacny et al., 2016) for a 2019 deployment to the Greenland ice sheet.
2. WATSON Instrument
2.1. Instrument overview
A schematic of WATSON is shown in Fig. 1. Excitation is provided by a 248.6 nm NeCu hollow-cathode laser, along with a custom laser power supply (LPS) capable of operating up to 160 Hz. Laser pulses are directed and focused onto the ice wall through a fused silica UV-transparent window (Fig. 1-W). The optical path is described in detail in Section 2.2. Linear and rotational motors (Fig. 1-C) move a carriage assembly containing the focusing optic and a rotating mirror, resulting in the ability to raster scan the laser over a 25 × 75 mm area with a spatial resolution up to 100 μm. Details of the carriage assembly are presented in Fig. 1-C. The carriage also includes an outward-facing camera that provides visible context images of the ice surface with a field of view of approximately 50 × 50 mm. Fluorescence emission is collected in a backscatter geometry and sent into the spectrometer and detector (Fig. 1-S). An onboard CPU, electronics, and power package coordinate the firing of the laser with the motorized stages and communication with the detector. Power and Ethernet are provided through a tether to a surface computer, through which commands are sent and data is returned. Figure 2A shows an image of the WATSON instrument, with Fig. 2B, 2C depicting the spectrometer and carriage shown in the schematic insets, respectively. The instrument specifications and typical acquisition parameters are listed in Table 1. A block diagram of the instrument subsystems is presented in Fig. 3.

WATSON optical schematic in the expected field configuration. Exiting the laser, the 248.6 nm laser line is isolated using two laser edge filters (
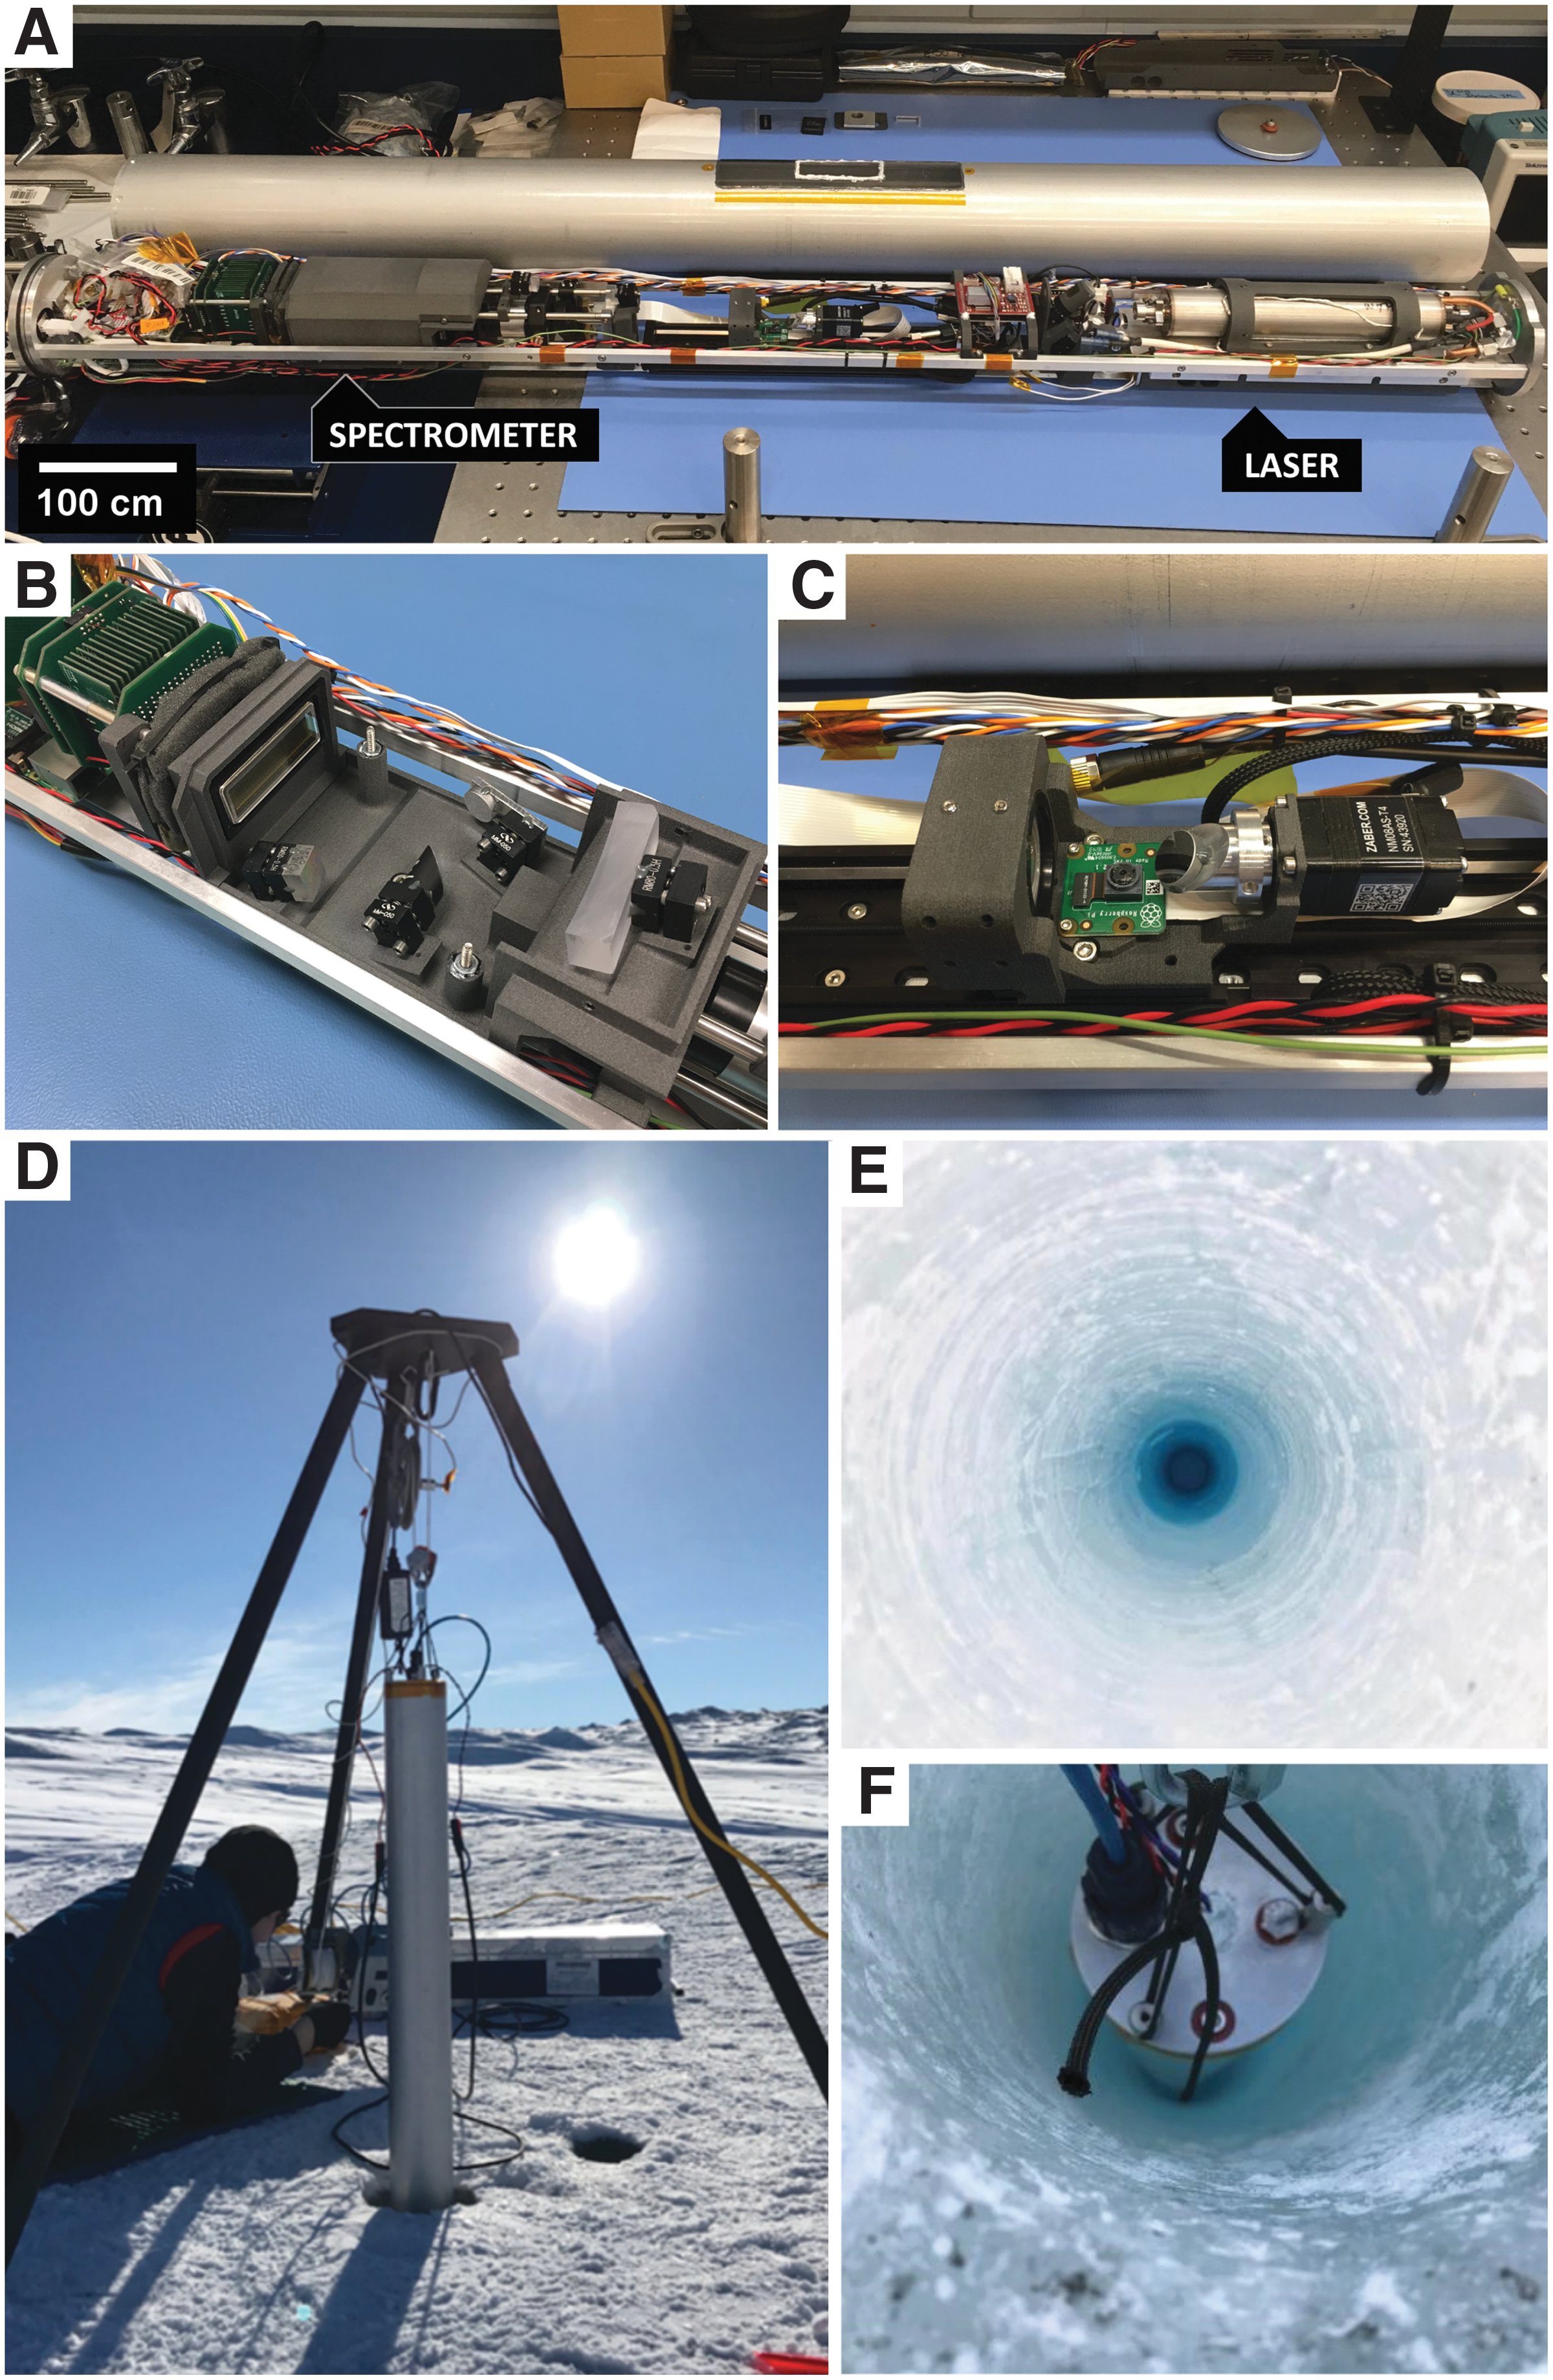
(
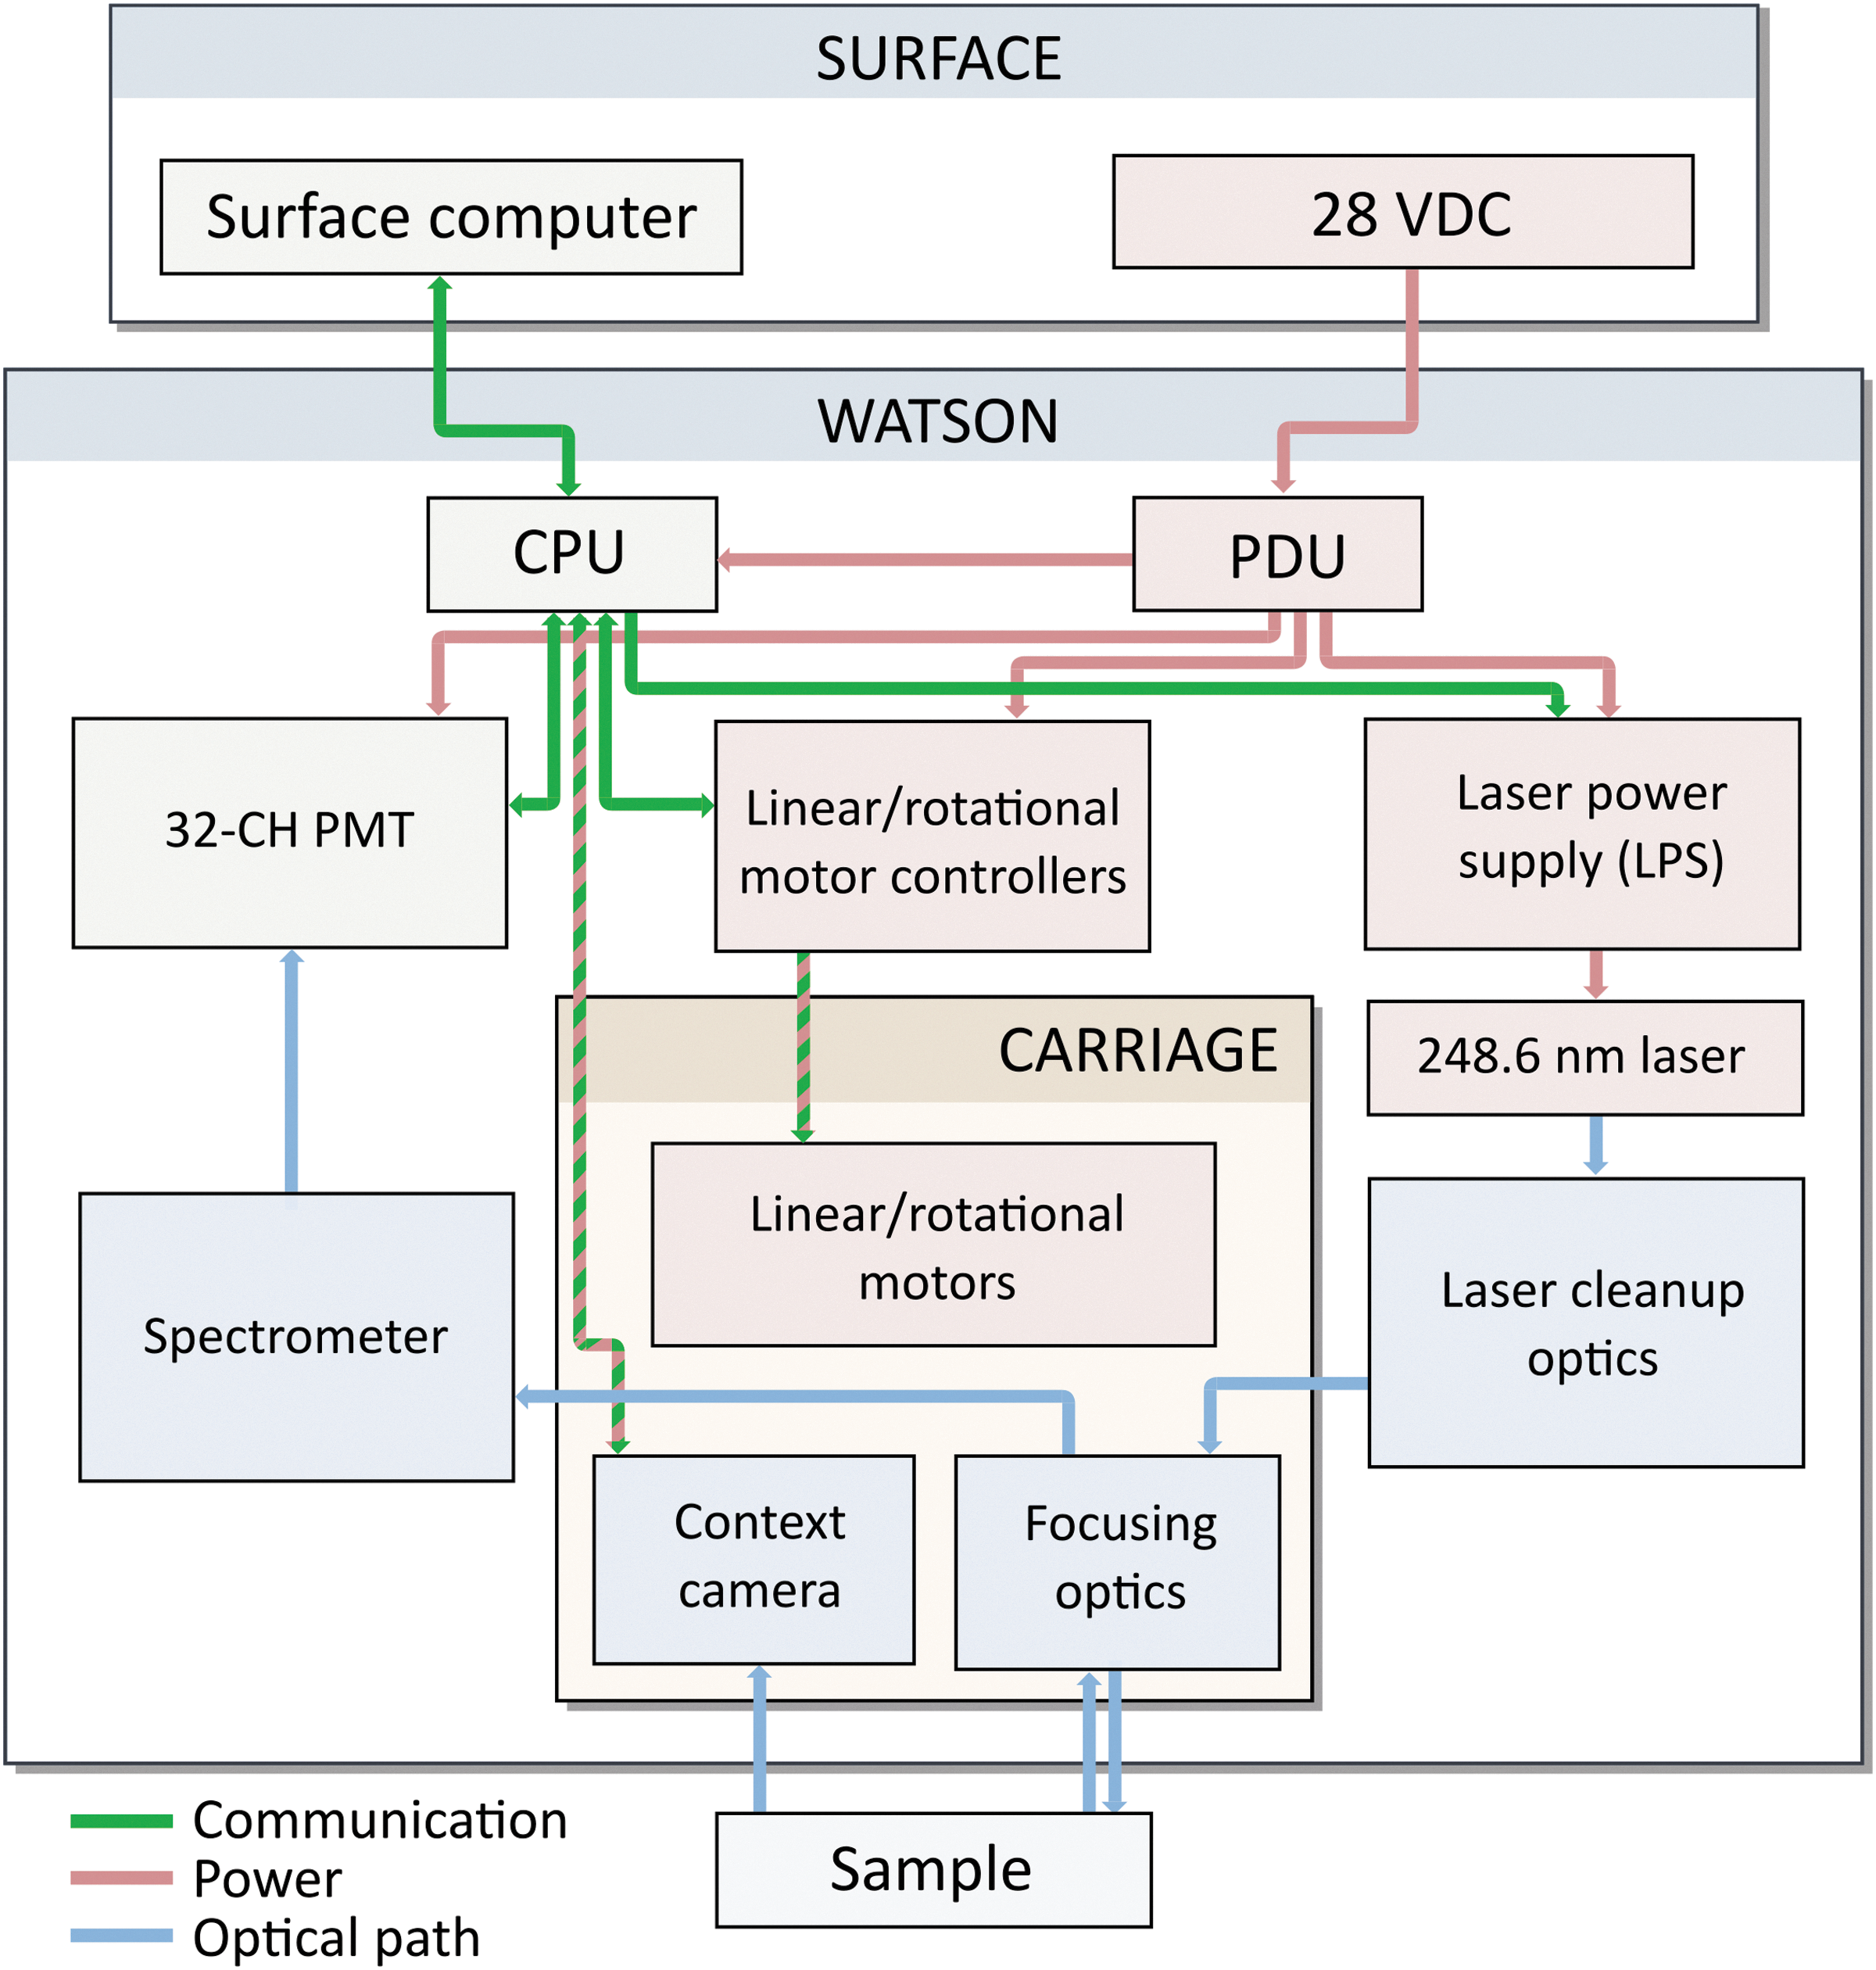
WATSON block diagram presenting the subsystems of the instrument. A surface power supply and computer are connected to WATSON through an Ethernet and power tether. Inside WATSON, a CPU and power distribution unit (PDU) control and power the 32-channel PMT detector, linear and rotational motors for rastering the laser across the sample, and the LPS. The carriage subassembly block is shown in Fig. 2-C and is noted by a dashed box in Fig. 1-C.
WATSON Instrument Parameters
2.2. Optical concept
The optical path through the instrument is shown in Fig. 1. Exiting the laser, the 248.6 nm line is isolated; and other NeCu transitions, primarily a 252.9 nm line, are removed by two custom edge filters (F1, F2). The edge filters transmit light above 249 nm and reflect >99.5% of the 248.6 nm emission. Following isolation of the 248.6 nm line, a series of mirrors (M1–M4 in Fig. 1) direct the light to an additional edge filter (F3), which co-boresights the laser with the optical path of the spectrometer. The three edge filters were developed from commercially available filters to have a steep 16° angle of incidence (AOI). The steep incidence angle allows the optical path to have a compact geometry and reduces the length and volume of the instrument. The laser beam is then focused onto the ice wall, located 3.175 mm from the outer surface of the instrument, with a 90 mm EFL triplet lens assembly. The focused spot at the target is approximately 100 μm in diameter. An additional mirror (M5), placed after the triplet and fixed to the rotating stepper motor, is used in conjunction with the linear stage to raster the laser spot across the sample surface. Fluorescence emission from the sample is collected by the focusing triplet (L1) and directed onto the spectrometer entrance slit by a second triplet with a 45 mm EFL (L2).
The instrument optics allow for collection of emitted light not just from the sample surface but at millimeter- to centimeter-scale depths within the ice, demonstrated in Section 4.5 below. This results in an in situ measurement capability, where organic material can be observed without any alteration to the local environment.
2.3. Spectroscopy
The spectrometer design is shown as an inset in Fig. 1-S. Entering the spectrometer, fluorescence emission is collimated by using a 50 mm focal length 90 degree off-axis parabolic mirror (Fig. 1-b). An 1800 lines/mm grating (Fig. 1-c) and a 100 mm focal length concave circular mirror (Fig. 1-d) are used to achieve a dispersion across the detector from 270 to 440 nm. A Hamamatsu H7260-106 32-channel photomultiplier tube (PMT) array connected to an electronics assembly developed by Photon Systems, Inc. (Fig. 1-e) is used as a detector. Each of the 32 PMTs, arranged in a linear array, has dimensions of 0.8 by 7.0 mm, resulting in a combined sensor array size of 31.8 by 7.0 mm. This includes a 200 μm gap between adjacent anodes. An onboard computer communicates with the electronics assembly and triggers the PMT array in coordination with the laser pulses. Background spectra are acquired by integrating the signal on the PMT array between laser pulses. This capability also allows the instrument to serve as a passive UV spectrometer, measuring ambient light within the ice.
The spectral range of the spectrometer, 270–440 nm, encompasses laser-induced fluorescence generated by a wide range of astrobiologically relevant organic compounds, including aromatic amino acids found in proteins, single-ring and multi-ring aromatic hydrocarbons, and aromatic heterocycles. Additionally, the higher-energy region of this range contains the Raman O-H stretching band, a strong spectral feature found in liquid water and water ice. The overall size of the spectrometer was kept to a minimum, with a length of about 140 mm. The magnification of the laser spot at the detector was kept close to 1 × to obtain adequate spectral resolution. Much of the optical path travels through the center axis of the instrument, aiding alignment of the system as the motorized carriage moves along its z-range. A PMT array was selected as a detector to avoid the thermal management (i.e., active thermoelectric cooling or passive liquid N2) requirements associated with a CCD. While CCDs can provide a higher spectral resolution than a PMT array, achieving adequate sensitivity to measure weak fluorescence signals would require significant cooling of the detector and would be challenging in the hermetically sealed tube.
2.4. Telemetry
To spatially define a sample position within an ice borehole, both the instrument depth and roll angle must be recorded. Depth information is provided external to the instrument, for example by an encoder attached to the instrument tether, and received by the surface computer during data acquisition. The instrument roll angle is measured by a combination of an internal gyroscope, magnetometer, and accelerometer. In WATSON, data from the internal gyroscope, magnetometer, and accelerometer sensors are continuously recorded at 20 Hz as spectral data is acquired. Temperature sensors placed at the LPS and near the onboard computer measure the air temperature and are monitored through a LabVIEW interface to determine if the LPS is at a risk of overheating. To avoid condensation inside WATSON, a humidity sensor combined with temperature readings provides dew point measurements using worst-case assumptions that the instrument tube temperature is at the ambient borehole temperature.
2.5. Operations
WATSON has two primary modes of operation: extended linear sidewall mapping of the ice borehole as the instrument is lowered or raised from the borehole, and fine-scale x/y spectral mapping over a 75 × 25 mm region when the instrument is stationary. These operations, described in the remainder of this section, were successfully tested in a −10 °C cold freezer during the experiments described in Section 4. In that environment, the instrument was cold-soaked for periods lasting up to 5 days. The internal temperature of the instrument during continuous operation, with repeated scans each lasting 45 min, plateaued below +30 °C, well below the +50 °C upper operational limit. This indicates that WATSON could likely operate continuously in cold environments such as terrestrial ice boreholes at a stable and safe internal temperature.
2.5.1. Ice borehole mapping
The total area of the interior of a 108 mm (4 in.) diameter × 100 m deep ice borehole exceeds 65 m2, while the focused laser spot of WATSON is under 150 μm. As the distribution of organic and biological material in glacial ice is expected to be both low in concentration and spatially localized, it is necessary to have a method to locate regions in the ice that contain organic material. As WATSON is raised or lowered through an ice borehole, the instrument can fire the laser and collect data continuously, correlating spectra with depth and roll data from the sensor suite. Over multiple trips up and down, the data collected would populate a point-cloud with spectral information, giving broad fluorescence trends that can be used to down-select regions within the ice where detailed mapping would provide a more high-resolution investigation of organic material that is present.
2.5.2. Fine-scale spectral mapping
The linear and rotational motors within WATSON are used to raster the laser over a 25 × 75 mm sample surface, generating a fluorescence spectral map. The motor speed and laser repetition rate can be coordinated to define the spatial distance between sampling points, with typical parameters resulting in a 100–200 μm distance between points. Similar to the operations described in Section 2.5.1, measurements of depth and roll can locate the high-resolution spectral map within the borehole. Spectral maps are overlaid on visible imagery provided by the context camera to help interpret features observed in the spectra. Typically, the laser fires as the motors continuously move, resulting in a single laser pulse per spatial sampling point. If weak fluorescence was observed in a natural system during a field deployment, multiple pulses per point (up to 10,000) could be obtained to increase the signal-to-noise ratio. Spatial binning of the resulting spectral map can also increase the signal to noise, for example by averaging all spectra correlated with a morphological feature present in the visible context image, such as a crack, bubble, or vein within the ice. A 25 × 75 mm scan with a spatial resolution of 200 μm contains 46,875 points. Assuming a conservative interrogation depth into the ice (i.e., 1 cm), averaging these spectra can be considered a bulk measurement of approximately 2 cm3 and could reveal weak fluorescence signals not detectable in a single sampling point. A spectral map of this size with the instrument parameters listed in Table 1 can be obtained in 30 min.
3. Materials and Methods
Laboratory ice samples containing organic compounds were prepared for two experiments, with the goals of determining the sensitivity of WATSON to organic material in ice and the ability of WATSON to detect organic material at increasing ice thickness. Three organic materials were selected for study: aqueous solutions of the aromatic amino acids
3.1. Sample preparation
All glassware and metal apparatus used during the sample preparation and scanning processes were cleaned with soap, washed with deionized water, and baked for 12 h at 550 °C to remove organic contamination. Initial concentrations for each of the aromatic amino acids were 0.98 mM
3.1.1. Sample preparation to determine sensitivity to organic material in ice
In a −10 °C cold room, a series of 6.5 μL drops of each dilution were deposited on a cleaned aluminum block in a 6 × 4 grid, with a 4 mm spacing between drops. The drops were pipetted onto the prechilled aluminum block inside the −10 °C cold chamber in order to freeze and scan the drops as quickly as possible, thereby minimizing sublimation. The first three columns contained the two amino acid standards selected for study plus the E. coli, while the fourth column contained a water control. Drops placed on the aluminum typically reached a supercooled liquid state and were frozen by touching the base of the drop with the tip of a pipette that had been in contact with a pure ice control drop. Three of these blocks were prepared, each using one of the triplicate dilution series. WATSON was then used to obtain a spectral map over the sample surface, using the instrument parameters described in Table 1. Images of the ice drops on the aluminum surface are shown in Fig. 4.
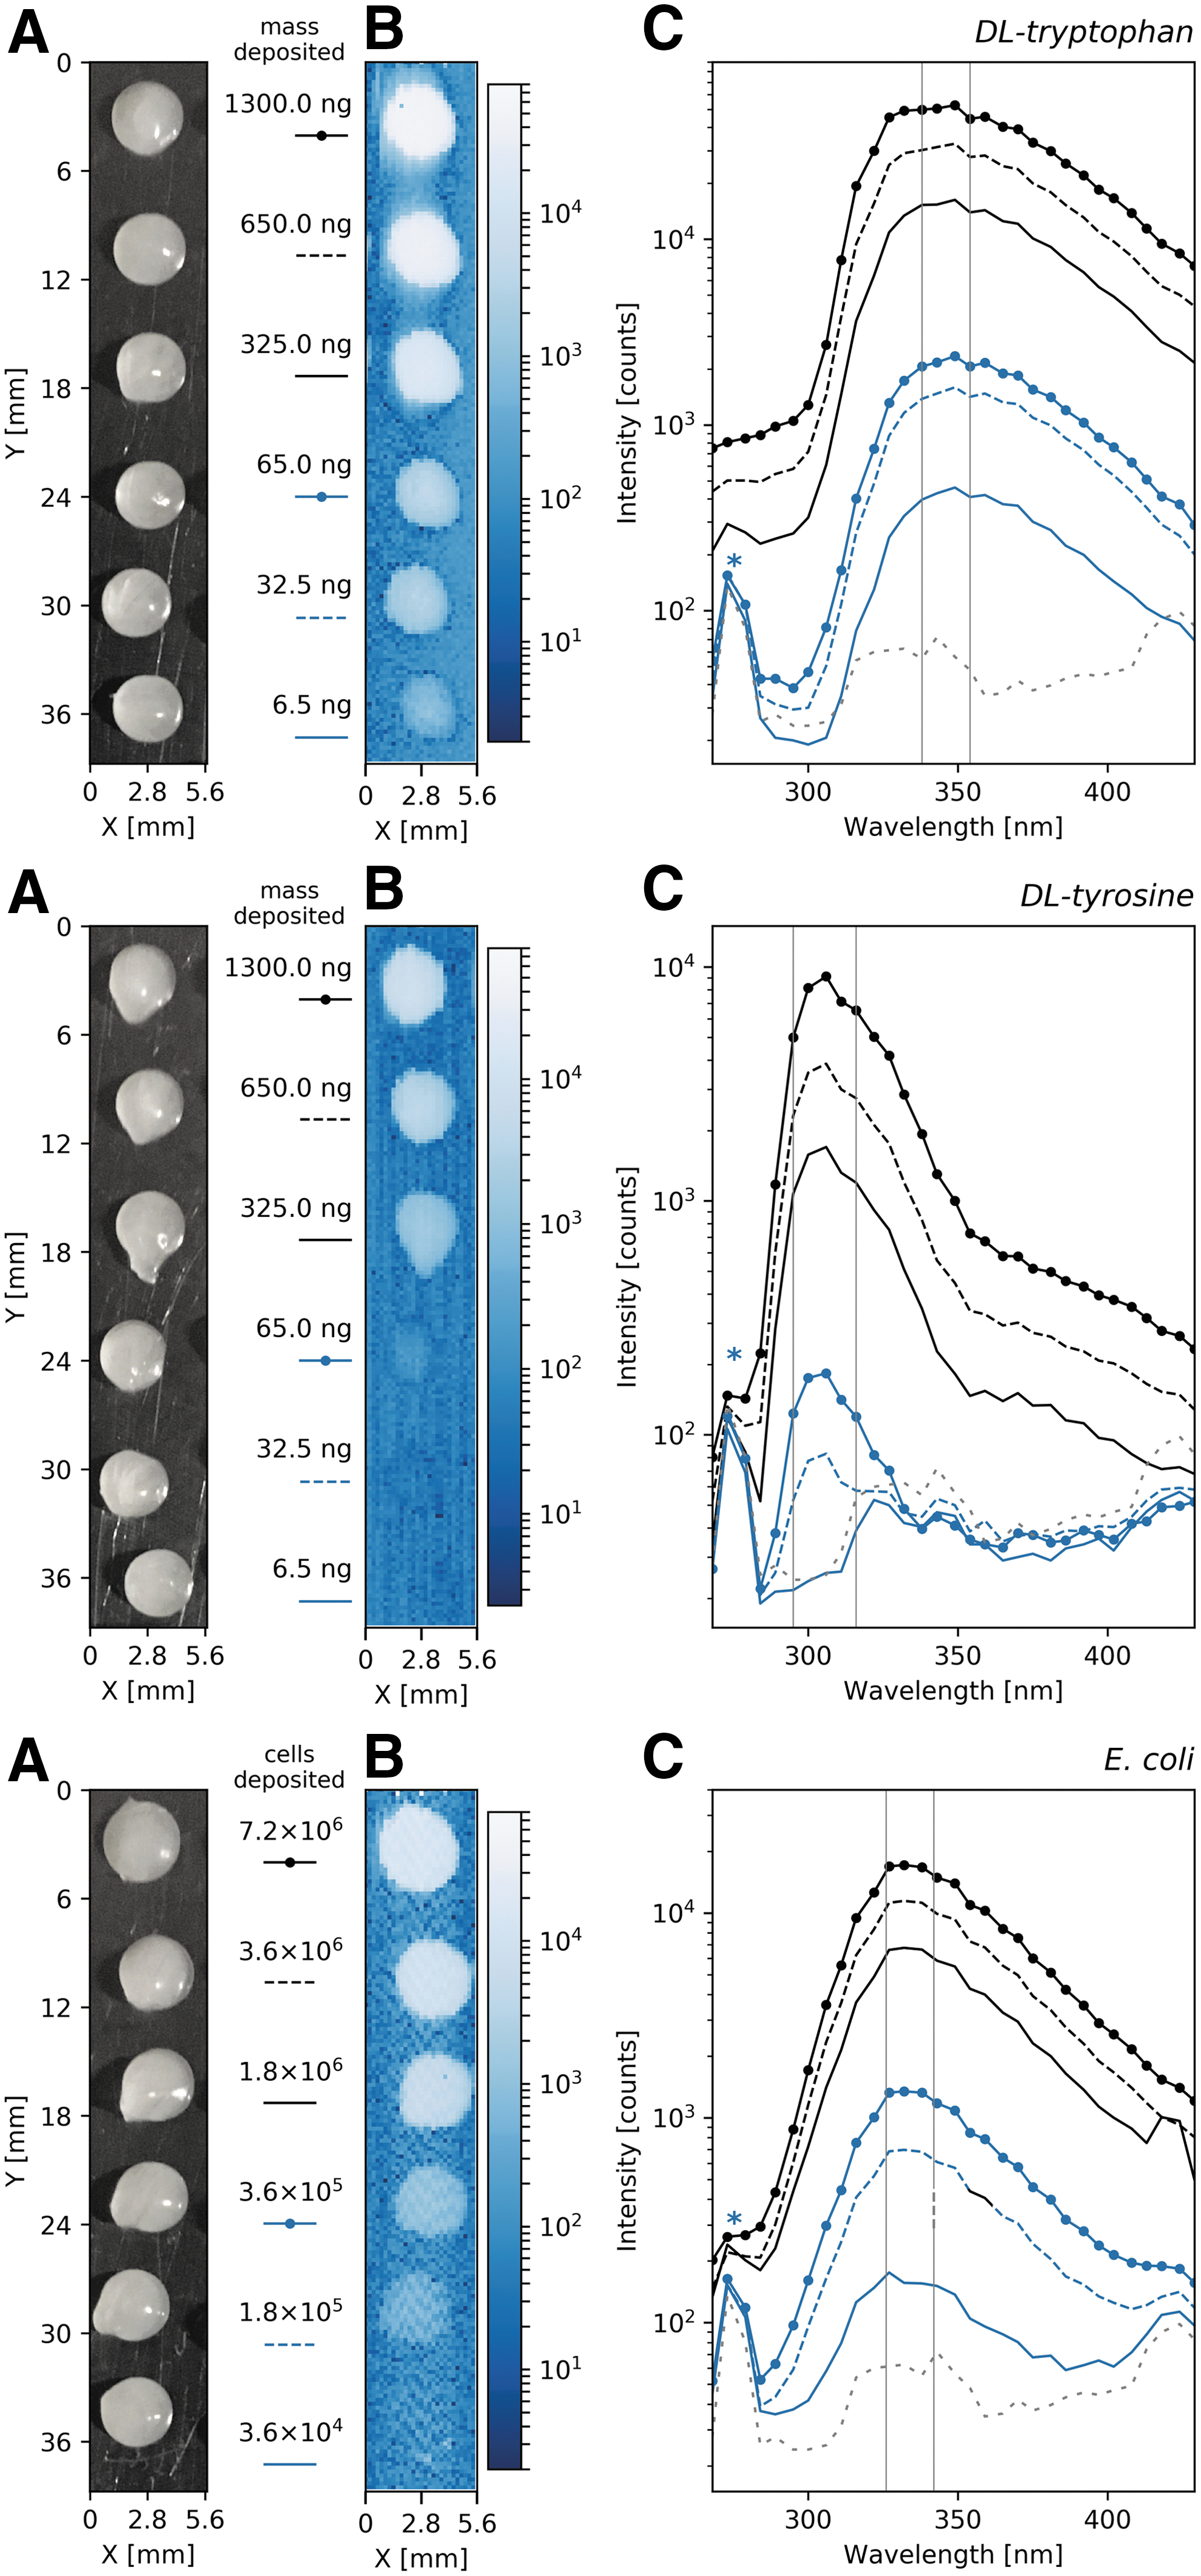
Ice drops with varying quantities of
3.1.2. Samples prepared to determine the ability to detect organic material at varying depths in clear and opaque ice
Blocks of clear ice and opaque ice with small bubble inclusions with approximate dimensions of 100 × 150 × 50 mm were obtained from a commercial ice vendor. These ices served as analogs to clear glacial ice and glacial ice with morphological features that could scatter incident radiation. The structure of the opaque ice was visually inspected by using a CANON EOS 70D camera equipped with a lens providing a 13 μm/pixel resolution. The ice was determined to have a size distribution that included ∼500 μm diameter bubbles with a number density of approximately 30/cm3, 50–200 μm diameter bubbles with a number density of approximately 5000/cm3, and a dense homogenous distribution of <50 μm diameter bubbles at or below the camera resolution. These ice blocks were formed into a wedge with dimensions shown in Fig. 6 using a clean aluminum surface on a hot plate. The purpose of the wedge was to provide an angled surface on which to deposit organic material in order to observe organics under varying thicknesses of ice. The blocks were oriented with the angled surface of the wedge as an overhang, and organics were observed top-down through the level surface of the wedge block. A wedge angle of 35° was used, and a grid of 4 × 6 6.5 μL drops was deposited into melted pits on the wedged surface. The pits were produced by pressing a 4 × 6 grid of 1.5 mm diameter heated steel dowel pins onto the ice surface. This angle and grid spacing resulted in a maximum organic deposition depth of 2.4 cm. This geometry is shown in detail in Fig. 6E.
4. Results
4.1. Sensitivity to organic material in ice
The ice drops with varying concentrations of organic material, described in Section 3.1.1, were scanned with WATSON, resulting in the spectral maps shown in Fig. 4. The three sections of Fig. 4 each contain a visible context image of the 6.5 μL drops (Fig. 4A), a spectral map with a 200 μm spatial resolution (Fig. 4B), and a plot of the average spectra of 64 sampled points around the center of each drop (Fig. 4C). Intensity values of the spectral maps were calculated by integrating the wavelength region denoted by the vertical lines in the spectral plots. The intensities of the spectral maps and plots are presented on a logarithmic scale to accommodate the dynamic range of the PMT detectors. An asterisk denotes the position of the Raman O-H stretching mode of the ice, which is observed as a peak between 268 and 274 nm (Cross et al., 1937). The spectrum of the water control droplet is displayed as a dashed line on each spectral plot.
The fluorescence intensities measured from the drops decrease as the concentration of organic material in the drops decreases. The quantity of organic material deposited within each drop is noted on the axis between the context images (Fig. 4A) and the spectral plots (Fig. 4B). Properties of the fluorescence signatures of the aromatic amino acids, including their spectral profiles and peak emission wavelengths, agree with the known profiles of these compounds (Teale and Weber, 1957). The fluorescence spectrum of the E. coli agrees with previously reported results (Seaver et al., 1998). Fluorescence from the E. coli is primarily due to the presence of aromatic amino acids, which are present in the cell proteins. The bacteria (E. coli) fluorescence spectrum is a combination of tryptophan and tyrosine amino acids in proteins, while the spectrum of bacterial spores is dominated by tyrosine-like residues (Pandey and Aronson, 1979; Leblanc and Dufour, 2002; Ammor, 2007; Bhartia et al., 2008). While the aromatic amino acids in the bacterial cells and spores are the
4.2. Modeled instrument performance compared to measured calibration curves
To determine whether the instrument met its design sensitivity requirements, a model of the instrument performance was applied that included the known fluorescence cross sections of the compounds selected for study, as well as the properties of the optics and detector electronics. This model is plotted in Fig. 5 as a dashed gray line and is described in the remainder of this section. The number of fluorescence photons that reach a single PMT element in the 32-PMT array following illumination by a single laser pulse is given by Eq. 1
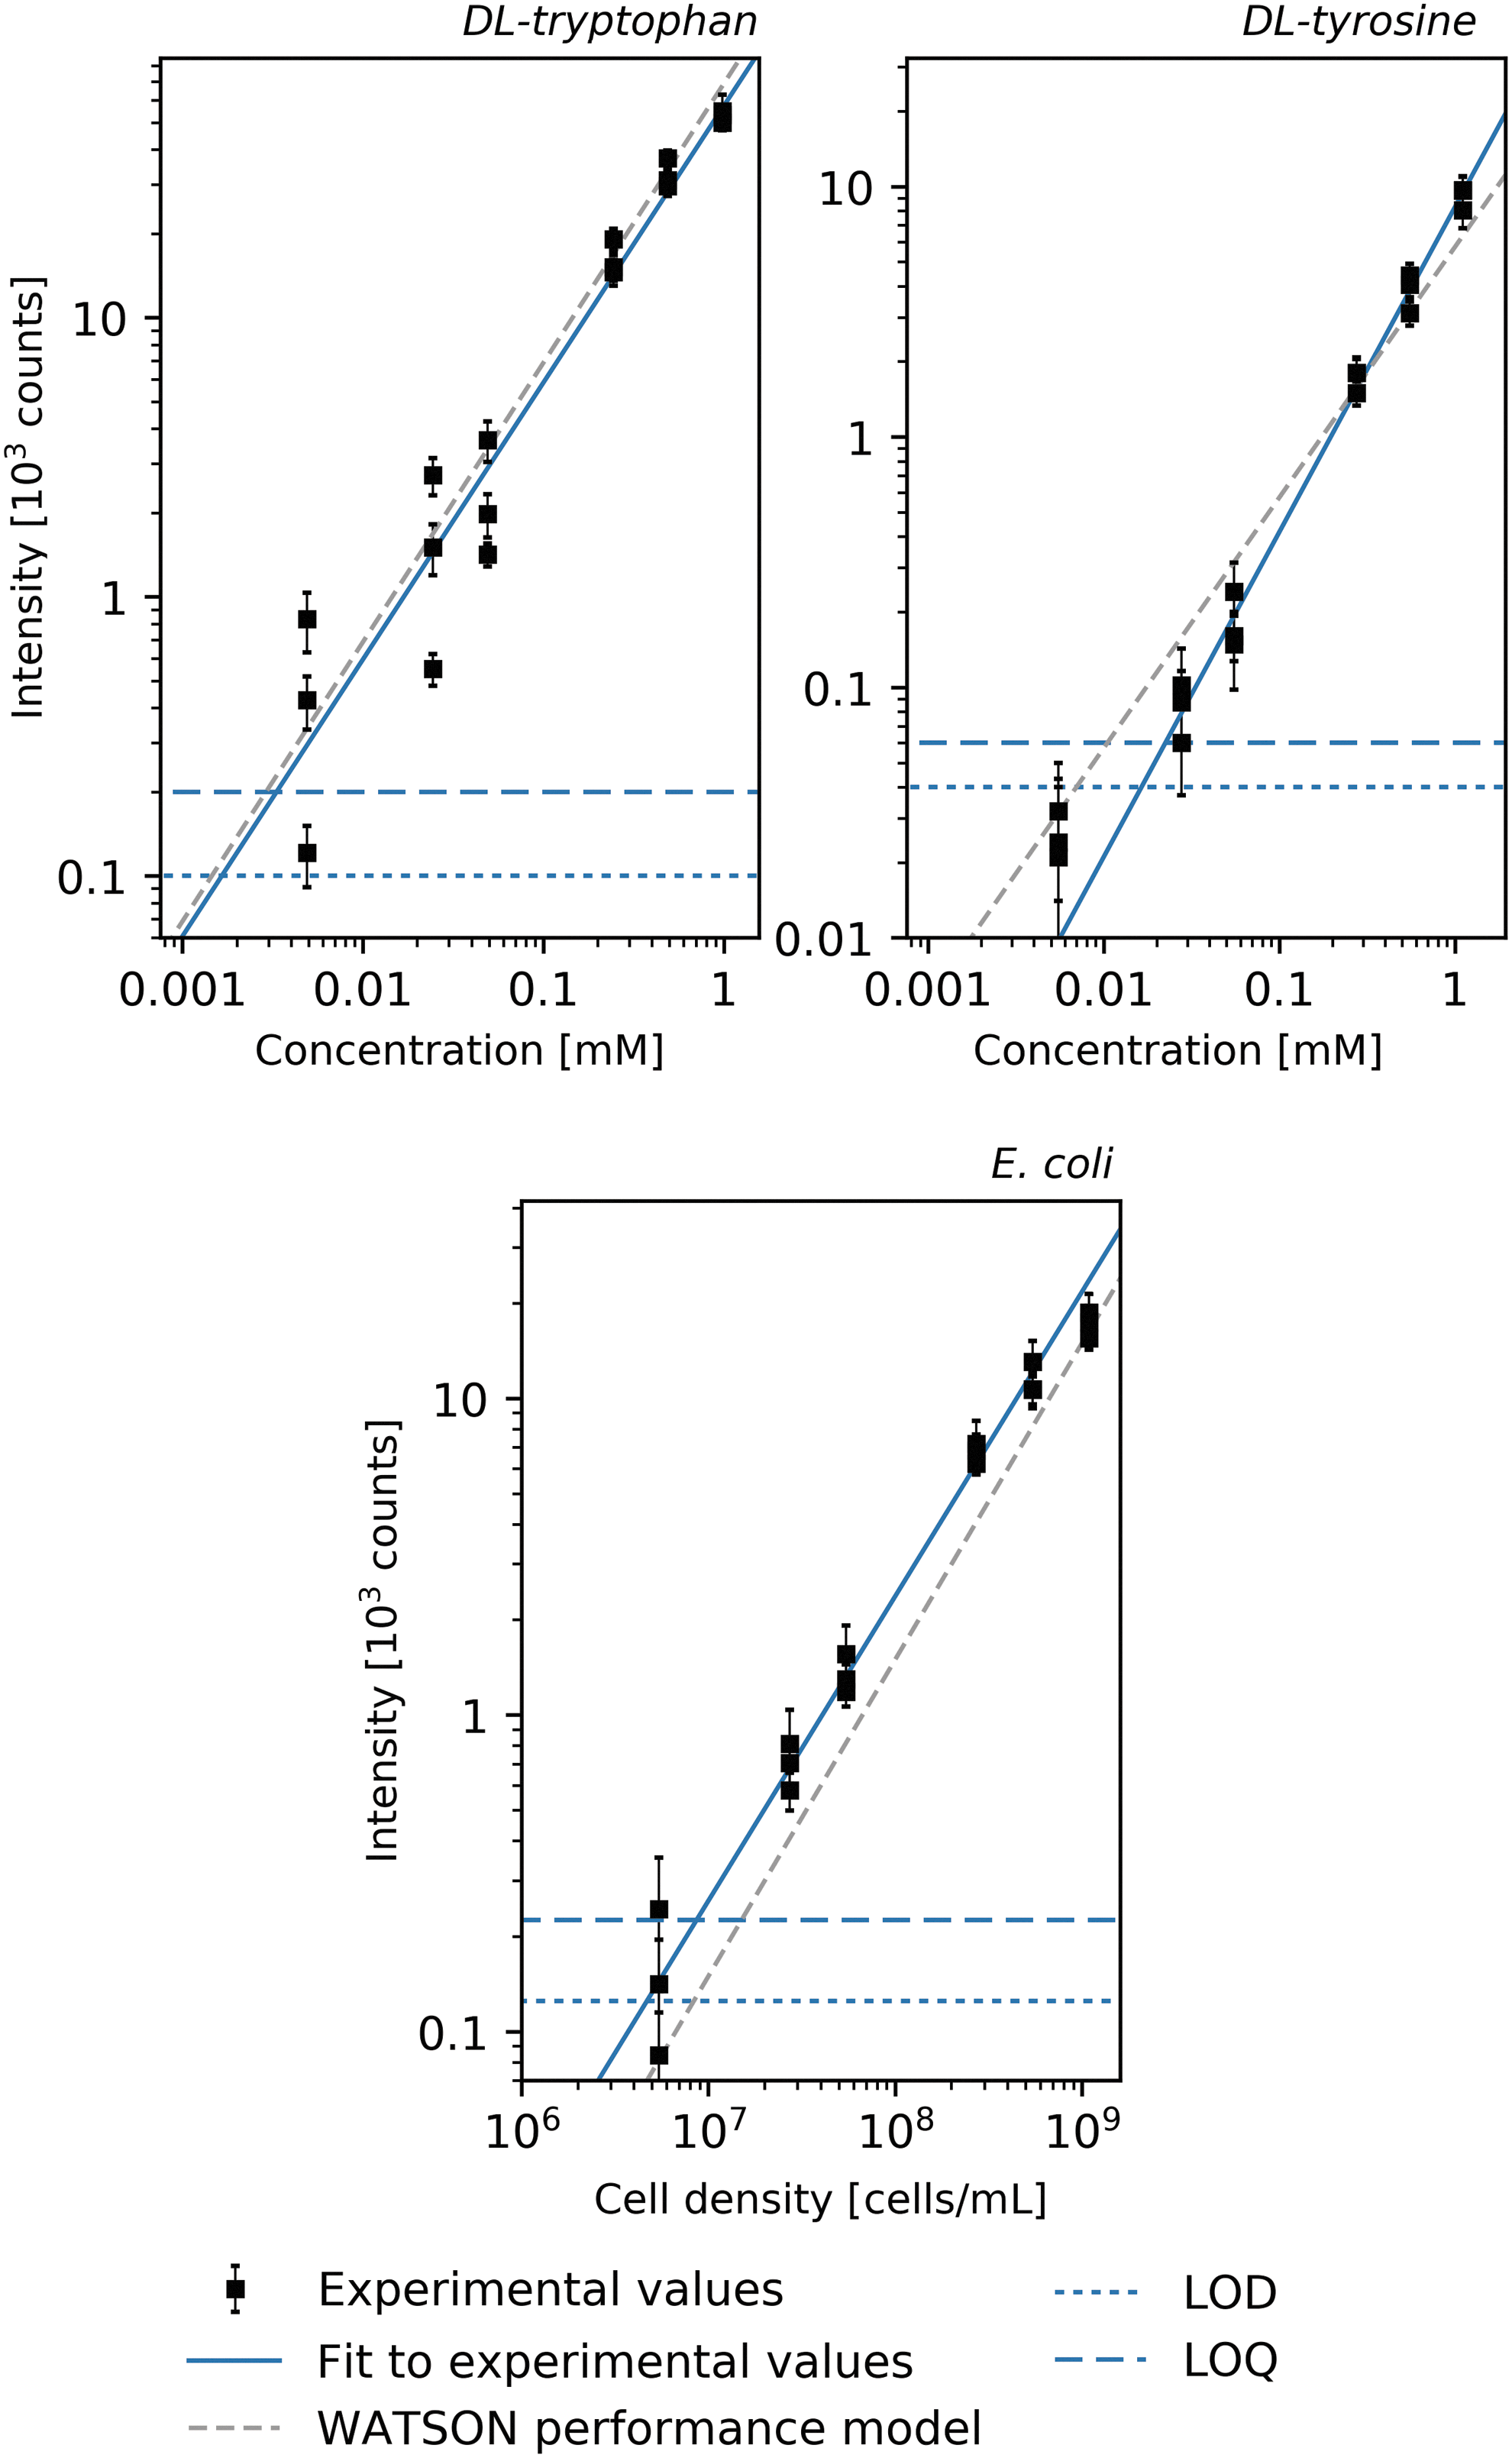
Calibration curves for
where
Calibration Curve Fitting Parameters and Determined LOD/LOQ for Each Material
For cell units of reported values and parameters given in cell density (cells per cm−3). For molecules, given in moles per liter (M).
To validate the instrument performed according to the model, calibration curves based on experimental data were determined by examining the measured signal intensities of the water ice drops detailed in Section 3.1, shown in Fig. 5. The individual drops were roughly of uniform size and thickness and appeared homogeneous on visual inspection. Around the center of each drop, 8 × 8 spectra (64 points) were averaged to obtain the mean spectrum. The three spectral maps resulting from the triplicate dilution series of ice drops were used to generate three values for each of the six concentrations prepared. The measured intensity at the maximum emission wavelength for each material at varying concentrations was plotted to generate the calibration curve. For tyrosine, the peak emission wavelength (λmax) was 306 ± 3 nm, for
The limit of quantitation (
For
where y is the measured signal intensity, x is the sample concentration/density in M (for molecules) or cells/mL (for cells), and A and b are fitted values. To determine A and b, a linear fit of plotted log10 values of measured signal and concentration was generated from the 15 E. coli,
4.3. Determination of LOD and LOQ concentrations for organic materials and E. coli
The calibration curves shown in Fig. 5 can be extrapolated to where they intersect the limit of quantitation (LOQ) and limit of detection (LOD) signal levels for the appropriate wavelength to determine the LOD/LOQ concentration limits. These values are shown in Table 2. The error range for the LOD/LOQ concentrations is based on the % RSE (relative standard error) for the calibration curve (Edgerley, 1998). The calibration curves show a unique correspondence that spans at least 2 orders of magnitude for the substances tested. This indicates consistency and predictability (within error limits) when comparing frozen samples of unknown concentrations/cell densities of the measured amino acids/E. coli cells that were prepared with the same techniques to generate drops with similar morphological parameters (e.g., shape across the 8 × 8 area, thickness of the frozen drop).
4.4. Absolute detection quantities for various molecules and E. coli
It is possible to convert the concentration or cell density values in Table 2 into absolute cell numbers or absolute number of molecules given an assumed interrogation volume into the ice drops. Our assumed interrogation volume is in the shape of a cylinder 150 μm in diameter with a height of 1.5 mm. This assumption is based on a 150 μm laser beam diameter, which is an average of the beam diameter focused through the center of a 1.5 mm volume, accounting for the objective focal length, the laser beam diameter at the objective, and the M2 value of the laser. The 1.5 mm cylinder height is the estimated height of the center of the 6.5 μL drops. The 8 × 8 grid of sample points was located near the center of each drop and therefore had a close to uniform thickness. This results in a cylindrical volume of 2.65 × 10⁻² μL, which is 0.41% of the amount of the total 6.5 μL drop volume. Given the LOD and LOQ values listed in Table 2, the absolute number (in units of moles, cells) in the estimated interrogation volume of 2.65 × 10⁻⁵ mL is listed in Table 3.
Absolute LOD and LOQ Quantities of Material in the 150 Micron × 1.5 mm Cylindrical Interrogation Volume Assuming Uniform Distribution of Materials throughout Sample
4.5 Detecting organic material at various depths under clear and opaque ice
To determine the ability of WATSON to detect organic material under increasing thicknesses of ice, organic material was deposited on clear and opaque ice wedges, shown in Fig. 6, using the method described in Section 3.1.2. The clear and opaque ice serve as analogs to clear glacial ice and ice with morphological features such as bubbles resulting in significant scattering of light. Spectral maps were obtained in the geometry shown in Fig. 6E. Figure 7 presents an analysis of the rows of drops containing E. coli cells. Figure 7A, 7C shows visible top-down context images of the regions of the ice wedges highlighted in Fig. 6C, 6D, where the depth of the E. coli under the ice increases toward the right. Figure 7B, 7D presents spectral maps obtained by WATSON over this region with a 200 μm spatial resolution. Figure 7E presents the average fluorescence intensity of the signal measured within each drop as a function of the drop depth within the ice. The six data points, corresponding to the six drops, were normalized to the intensity of the drop at the depth nearest to the ice surface. The fluorescence intensity was measured at the emission maximum. WATSON was able to detect E. coli at the maximum depth tested, 2.4 ± 0.14 cm, without significant attenuation of the signal in the clear ice wedge. In the opaque ice wedge, the fluorescence signal from the E. coli was attenuated significantly, but the signal was still detectable at a 2.4 cm depth. Solid traces on Fig. 7E present the intensity of the Raman O-H stretching mode of the ice as a function of the ice depth. As the ice thickness increased, the Raman intensity from the clear ice increased, and the intensity from the opaque ice plateaued, indicating that the scattering properties of the ice matrix are likely the cause of the attenuation of the organic signal. Cracks, bubbles, or other morphological features in natural ice would also result in similar scattering of incident radiation. Even in a highly scattering environment, WATSON was able to detect E. coli at a 1 cm depth with less than an order of magnitude attenuation in the fluorescence intensity.
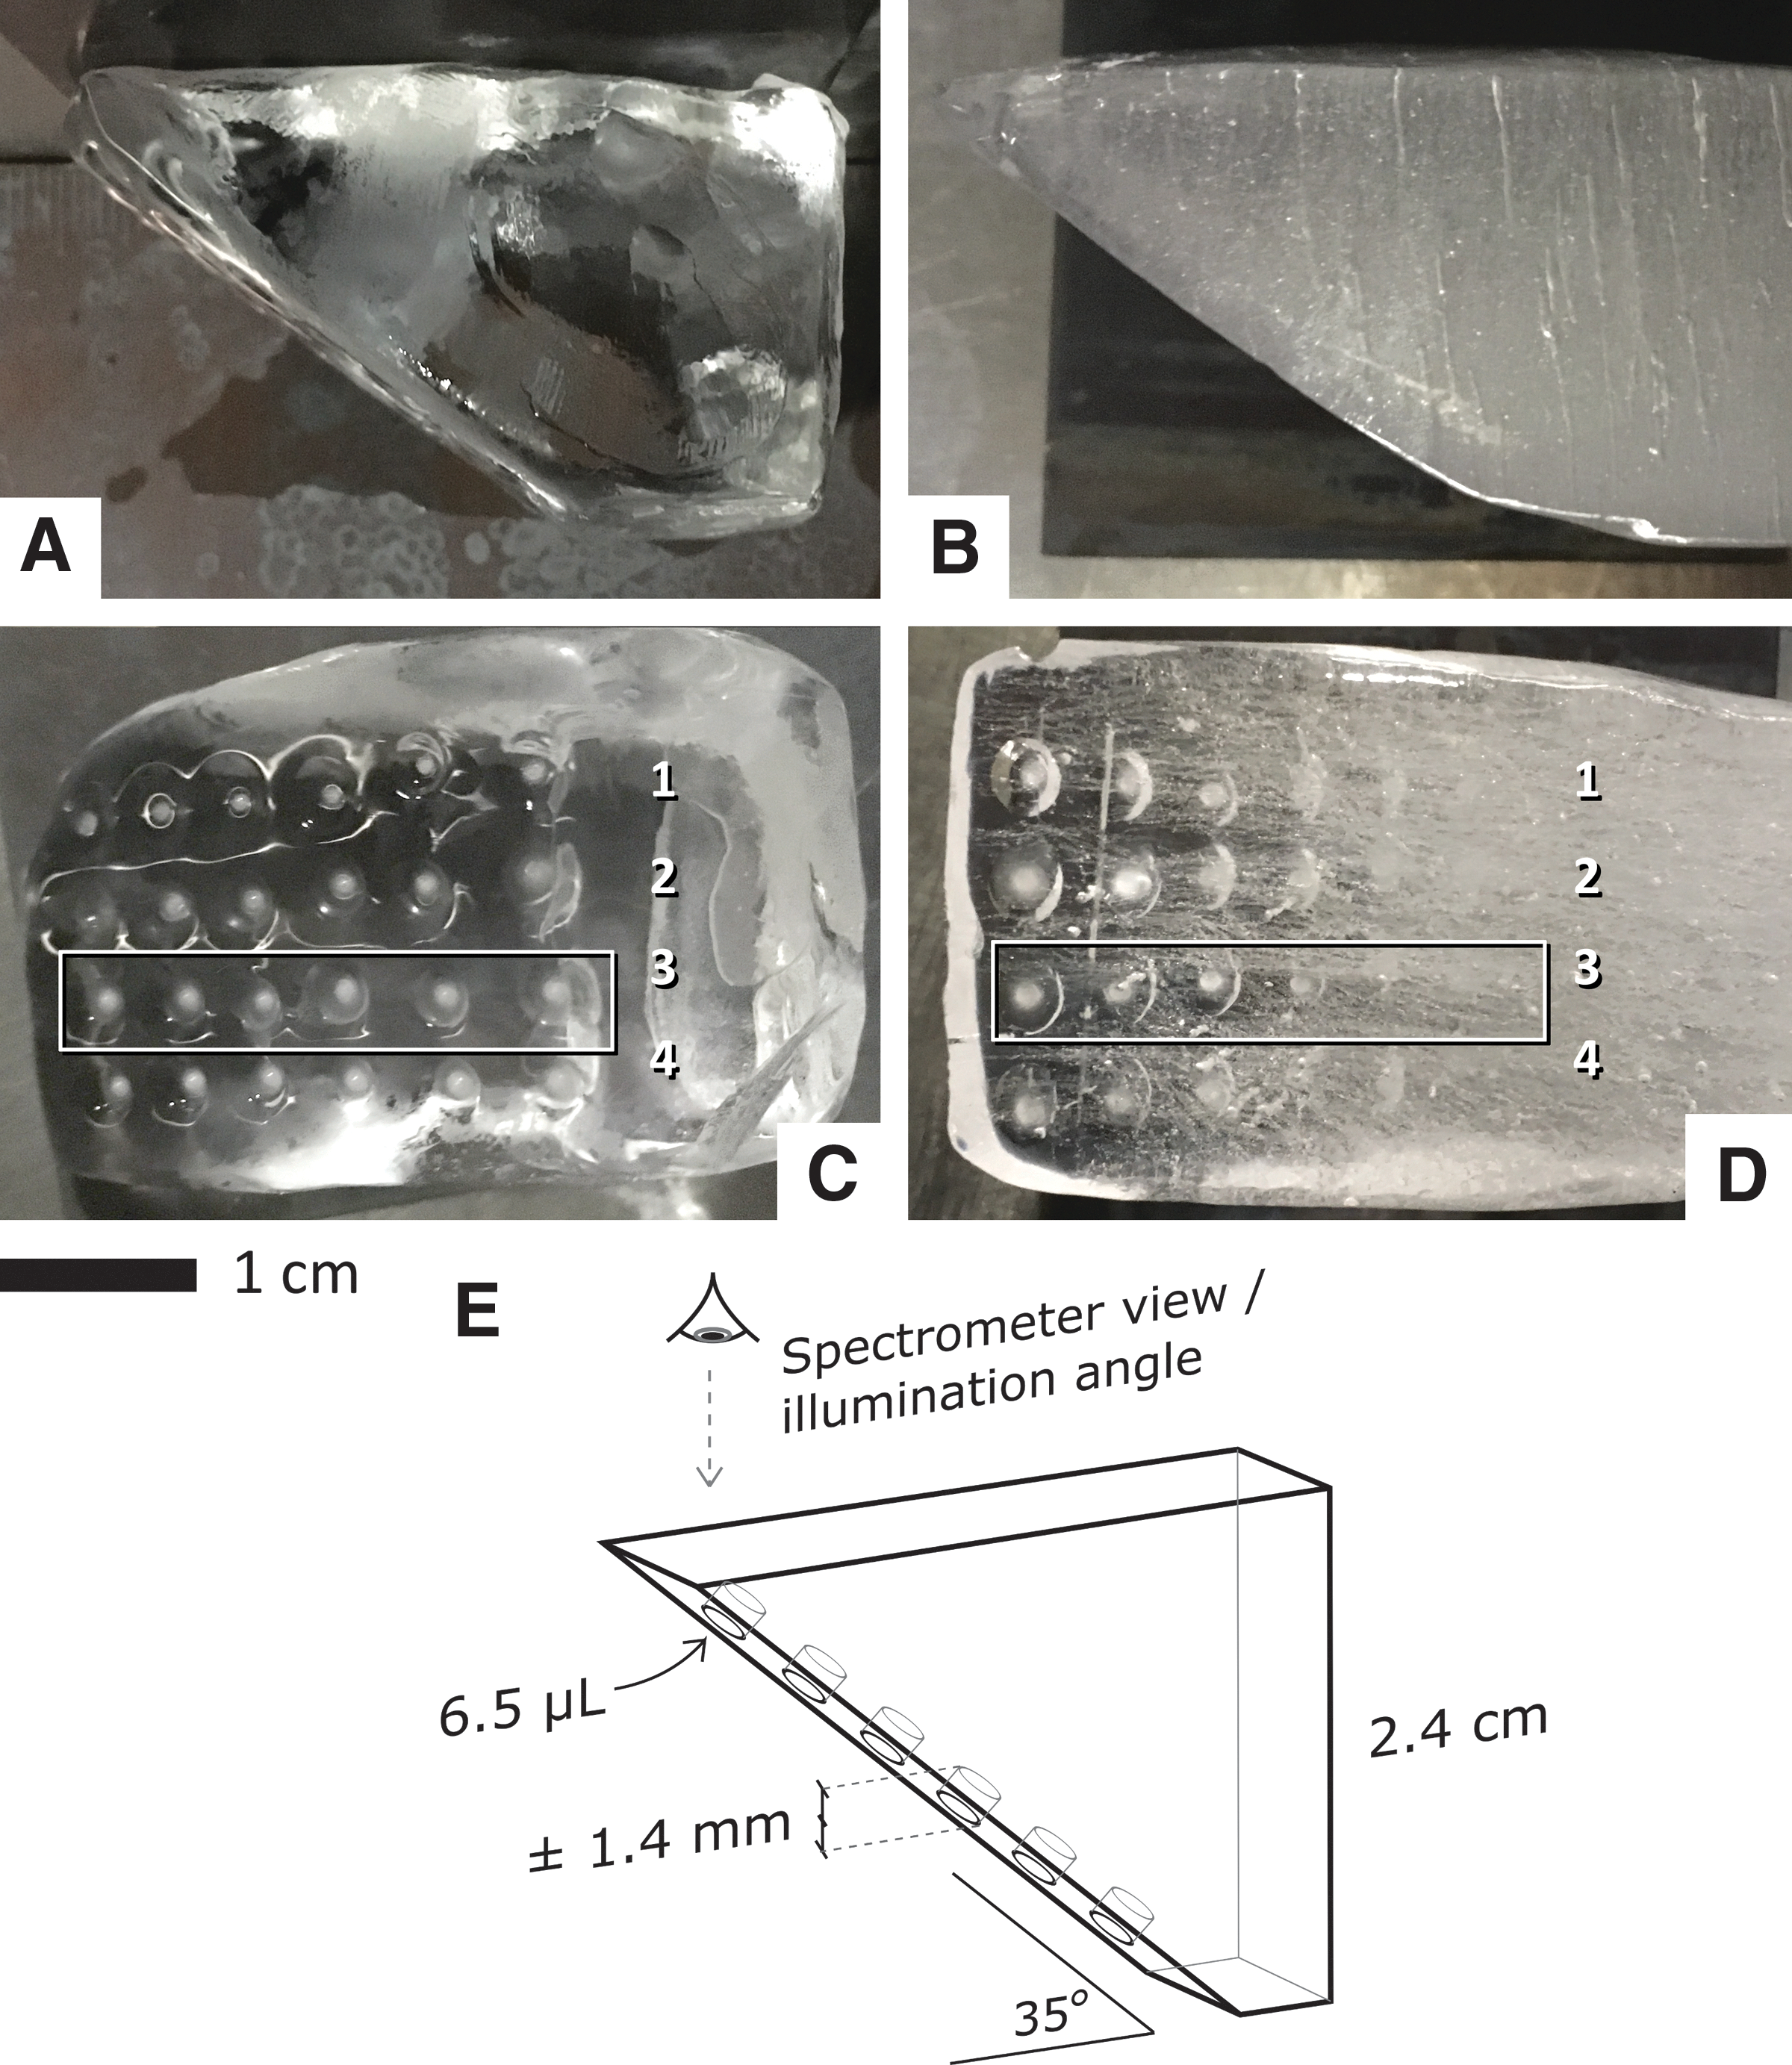
Images of clear and opaque ice wedges with 6.5 μL drops of organic material deposited in a grid pattern. The organic material was deposited on the angled undersurface of the wedges shown in (
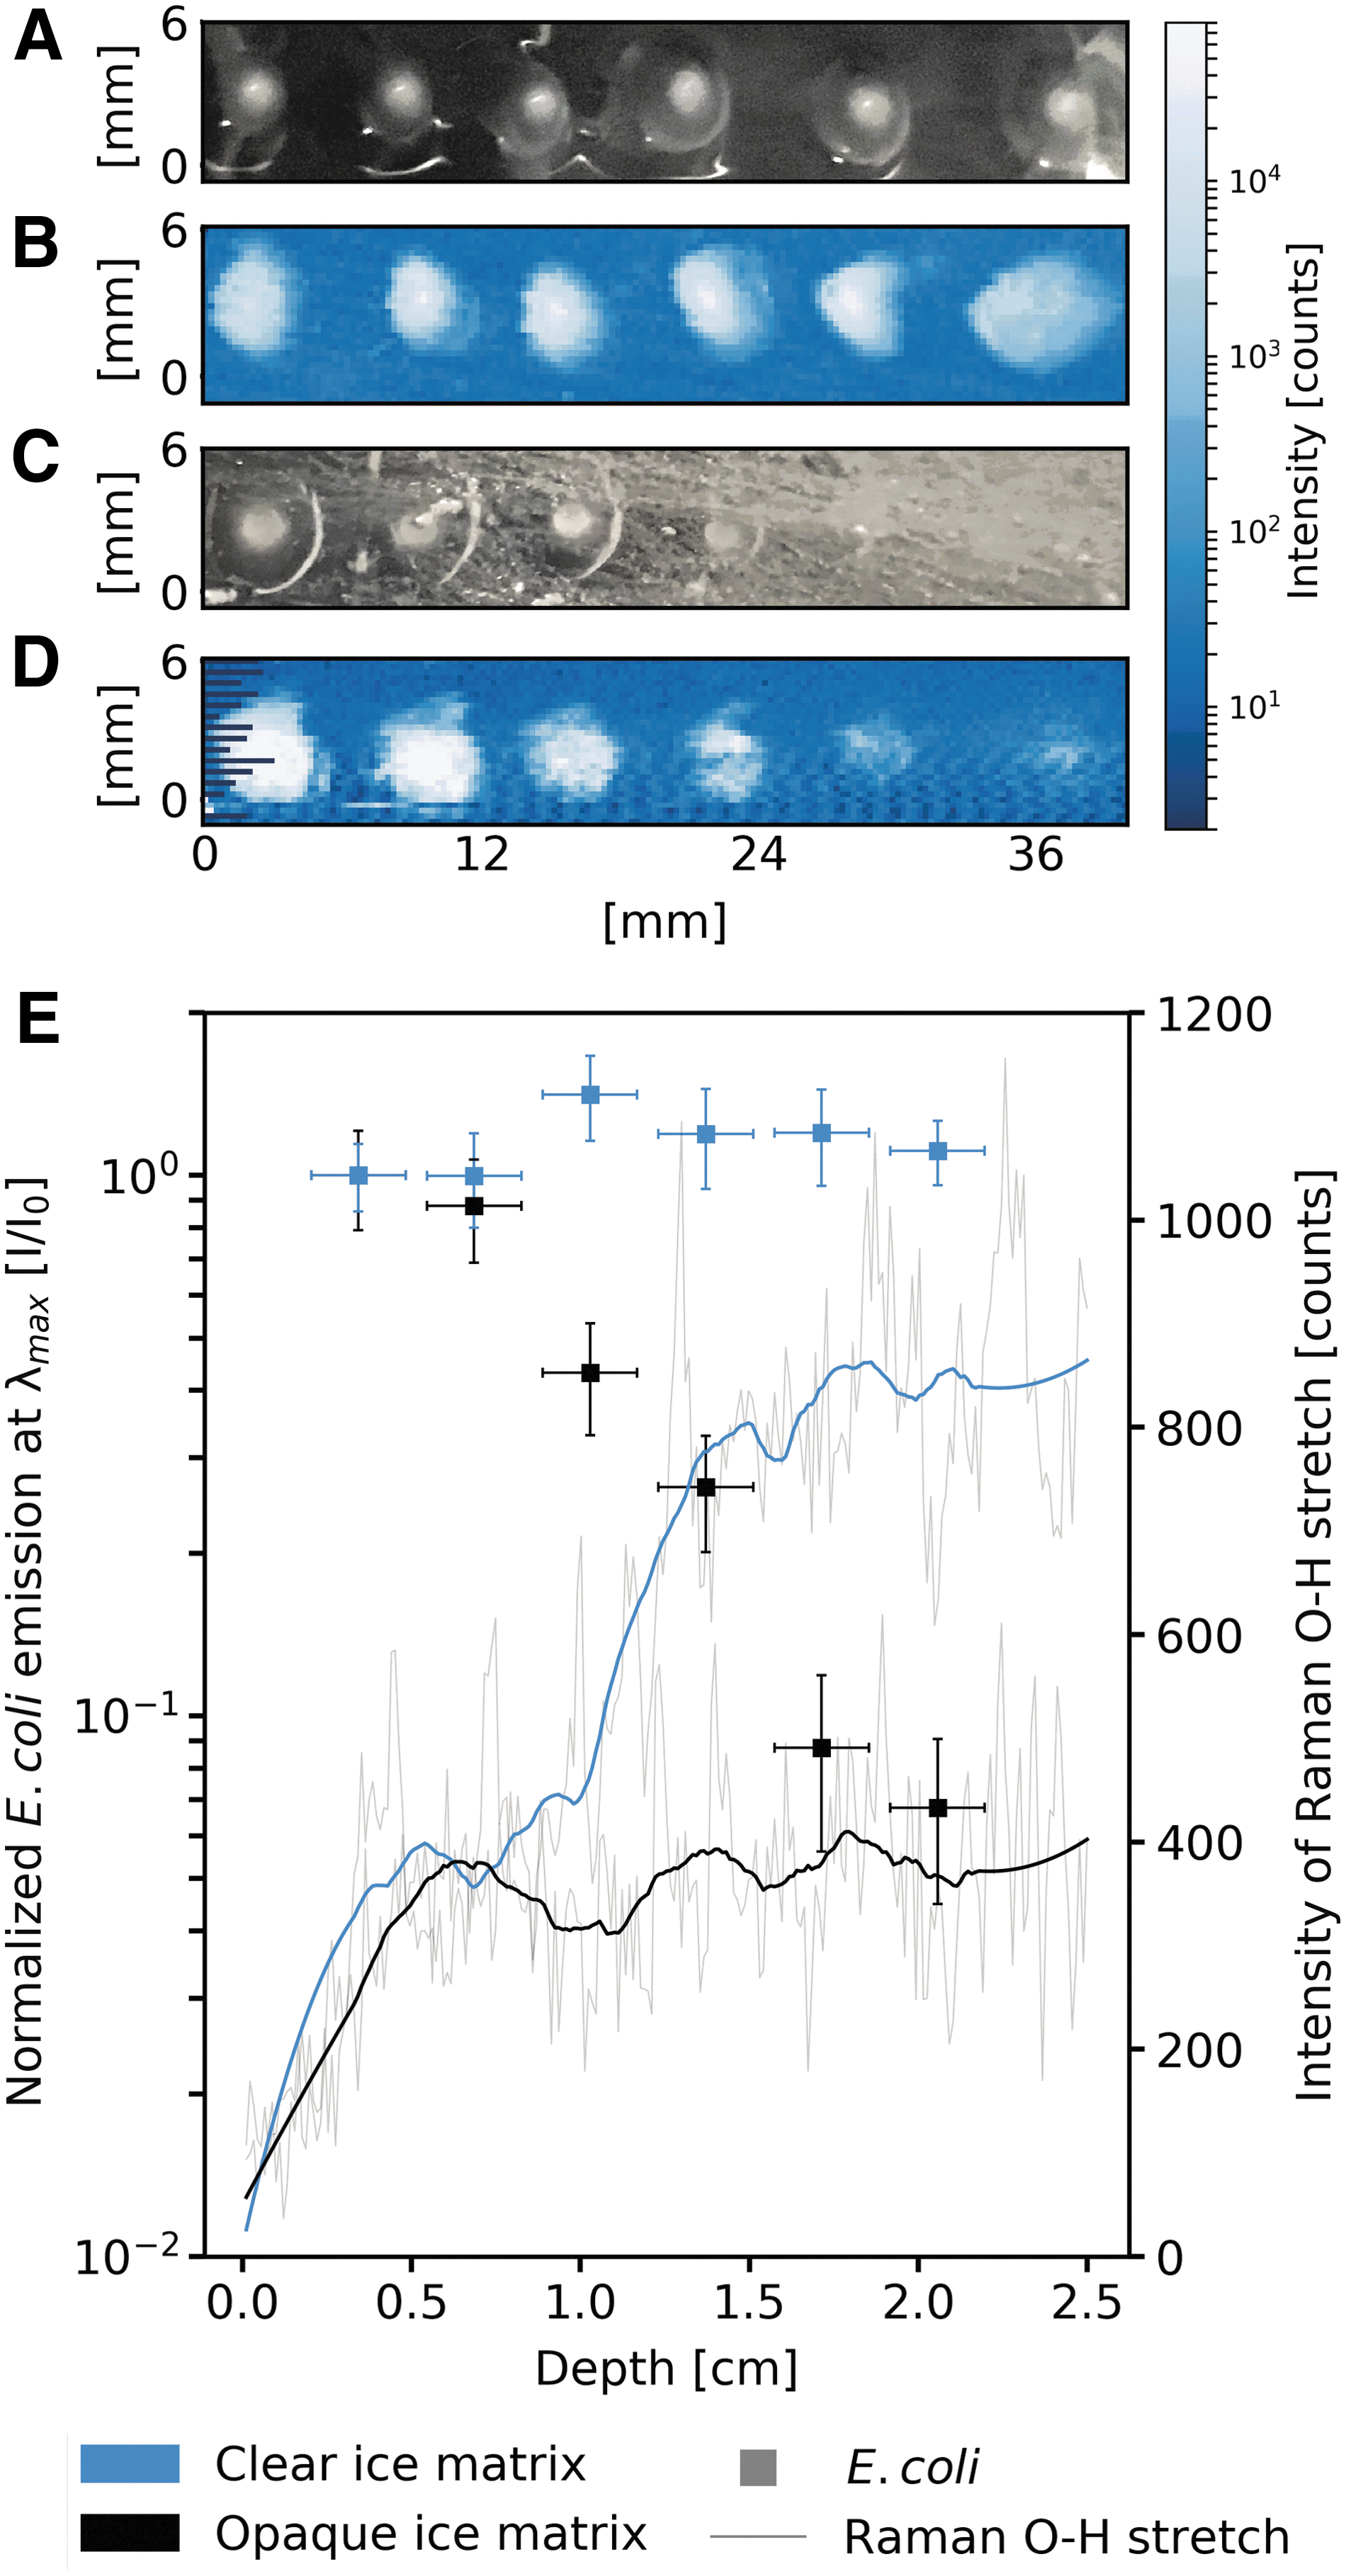
Drops measuring 6.5 μL and containing 3.6 × 10⁶ E. coli cells each were deposited on the ice wedges shown in Fig. 6 and scanned to determine WATSON's capability to detect microbes under various thicknesses of ice. The context images and fluorescence scans shown in (
5. Discussion
5.1. Implications for detecting cells in natural glacial systems
Bulk measurements of cell levels have previously been obtained in natural glacial ice systems and were determined to be between 102 and 108 cells/mL (Mader et al., 2006; Miteva et al., 2009; Santibáñez et al., 2018). However, what is unaccounted for in these measurements is the submillimeter- to centimeter-scale spatial heterogeneity in the distribution of cells within the ice. In a natural system, microbes are likely not homogenously distributed, but rather extruded and concentrated into bubbles, veins, nodes, and grain boundaries present in the ice. Studies by Mader et al. have demonstrated in lab-grown ice that the local cell concentration within these regions could increase by a factor of 104 to 105 (Mader et al., 2006). The analysis presented in this work demonstrates that WATSON has sufficient sensitivity to detect cells in ice with a single laser pulse, with a limit of detection of 125 (± 32) cells in a sampling volume, corresponding to an average value of 4.72E6 (± 1.20E6) cells/mL.
The sampling volume of WATSON was designed to allow the instrument to detect material at a millimeter- to centimeter-scale depth within ice. Therefore, an ice vein, node, or grain boundary containing cells will occupy only a portion of the sampling volume of the instrument. The absolute LOD values in numbers of cells presented in Table 3 can be compared against a simplified model of a natural system, for example, when a 100 μm diameter ice node is in the laser beam path. In this case, if lower bounds are taken for the bulk cell load of the ice (102 cells/mL) and concentration factor into the node (104), the resulting cell concentration in the node will be 106 cells/mL. The number of cells in the node (
For the lower bound values, the number of cells present in a node in this simplified model is less than one cell (with
For spatial investigations of ices with cell loads on the order of 102 cells/mL, similar to the cleaner ices measured terrestrially, it would be desirable for WATSON to have an improved limit of detection. A primary outcome of this work is a benchmarking of the instrument requirements needed to advance the detection limit to a level where cells can be observed in situ at the lower bounds of expected concentration. We identify three key areas that can be addressed. (1) The detector electronics used in this work exhibited a time-dependent oscillation in the voltage supplied to the PMT array. This introduced a sawtooth-like signal to the acquired data that accounted for approximately 20% of the standard deviation in the signal used to calculate the limits of detection and quantitation. (2) The f-number of the collection optics can be halved to increase the amount of light collected by a factor of 4. While this would increase the magnification at the spectrometer, spectral resolution would still be limited by the PMT anode dimensions. Coupled with a factor of 5 increase in laser output (realized from improved mirrors in the DUV laser), the instrument would collect up to 20 times more light generated from the laser interaction with the sample compared to the current configuration. (3) The sample preparation procedure employed to determine the instrument sensitivity, described in Section 3.1.1, generated small frozen drops of organic-containing material. When these drops were frozen, they became significantly opaque due in part to gasses present in the liquid. The drops therefore are a poor analog to clear glacial ice and are a highly scattering environment. While this effect was measured and accounted for in the sensitivity model described in Section 4.2 (with the sample scattering factor
6. Conclusions
In the configuration described herein, WATSON provides DUV fluorescence spectroscopy in a compact instrument package capable of obtaining measurements in situ within an ice borehole. WATSON was developed to detect the spatial distribution of organic material containing aromatic rings, including microbes, and correlate these signatures to their environmental context. The results of laboratory experiments indicate that WATSON is sufficiently sensitive to identify cells with a single laser pulse in a glacial ice analog with a limit of detection of 125 (± 32) cells in a sampling volume and that WATSON can observe organic material at millimeter- to centimeter-scale depths in both clear ice and ice with morphological impurities that scatter the incoming radiation. WATSON demonstrates instrumentation for organic detection in terrestrial icy environments and supports the development of technology for future landed missions to the icy bodies of Europa, Enceladus, and the polar caps of Mars. WATSON represents the first step in the development of technology and measurement methodologies that provide the necessary information to infer past climate, distribution of organics, and habitability of both terrestrial extreme environments and icy planetary surfaces. By increasing our understanding of the limits and constraints on life in extreme environments such as the Greenland ice sheet, we gain a better understanding of how to detect, identify, and characterize life and life-related chemistry that may exist or may have existed on other Solar System bodies.
Footnotes
Acknowledgments
The authors would like to thank the reviewers of this work, including Chris McKay, whose feedback significantly improved the paper and in particular the discussion of the data presented. We would also like to thank Jim Wilcox, Ray Reid, Bill Hug, Prashant Oswal at Photon Systems Inc. for developing and supporting the PMT and detector electronics. Thanks to Rufus Simon, Matt James, and Vatche Vorperian at JPL for developing the laser power supply and providing integration assistance. Thanks to Haley Sapers and Ellie Hara for discussions and assistance with the experimental work presented here. Funding: This work was carried out in part at the Jet Propulsion Laboratory, California Institute of Technology under the NASA PSTAR program (NNH14ZDA001N-PSTAR). Government sponsorship is acknowledged. Copyright 2018.
Author Disclosure Statement
No competing financial interests exist.