
Abstract
The surface conditions on the Moon are extremely harsh with high doses of ultraviolet (UV) irradiation (26.8 W · m−2 UVC/UVB), wide temperature extremes (−171°C to 140°C), low pressure (10−10 Pa), and high levels of ionizing radiation. External spacecraft surfaces on the Moon are generally >100°C during daylight hours and can reach as high as 140°C at local noon. A Lunar Microbial Survival (LMS) model was developed that estimated (1) the total viable bioburden of all spacecraft landed on the Moon as ∼4.57 × 10¹⁰ microbial cells/spores at contact, (2) the inactivation kinetics of Bacillus subtilis spores to vacuum as approaching −2 logs per 2107 days, (3) the inactivation of spores on external surfaces due to concomitant low-pressure and high-temperature conditions as −6 logs per 8 h for local noon conditions, and (4) the ionizing radiation by solar wind particles as approaching −3 logs per lunation on external surfaces only. When the biocidal factors of solar UV, vacuum, high-temperature, and ionizing radiation were combined into an integrated LMS model, a theoretical −2479 log reduction in viable bioburden was predicted for external spacecraft surfaces per lunation at the equator. Results indicate that external surfaces of landed or crashed spacecraft are unlikely to harbor viable spores after only one lunation, that shallow internal surfaces will be sterilized due to the interactive effects of vacuum and thermal cycling from solar irradiation, and that deep internal surfaces would be affected only by vacuum with a degradation rate of −0.02 logs per lunation.
1. Introduction
During the Apollo/Viking era of the 1960s and 1970s, prelaunch microbial surveys of robotic and crewed vehicles documented a wide diversity of microorganisms present on spacecraft surfaces (see reviews by Taylor, 1974; Schuerger, 2004; Horneck et al., 2010). Bioburdens on Moon-bound vehicles were estimated by using traditional culture-based assays yielding between 1 × 10⁴ and 2 × 10⁸ viable mesophilic bacterial species per vehicle (Favero, 1971; Dillon et al., 1973). Recovered microorganisms were composed of ∼80% nonspore-forming bacterial, 10% spore-forming bacterial, and 10% eukaryotic species (Favero, 1971; Dillon et al., 1973; Taylor et al., 1973; Puleo et al., 1977). The most common fungi are typically asexual anamorphs in the Ascomycota (e.g., Aspergillus, Cladosporium, Fusarium, Penicillium, and Trichoderma); and the most common bacteria are in the phyla Firmicutes (e.g., Bacillus, Staphylococcus, Streptococcus) and Actinobacteria (e.g., Micrococcus, Corynobacterium) (Favero, 1971; Herring et al., 1974; Puleo et al., 1970, 1973a, 1977; Taylor, 1974; Taylor et al., 1973). More recently, molecular microbial assays of Mars-bound spacecraft surfaces (Venkateswaran et al., 2001; La Duc et al., 2003, 2004) have identified a much wider diversity of microbial species, and have updated the taxonomic relatedness of recovered species from spacecraft surfaces.
Based on this literature, several general conclusions can be drawn on the microbial ecology of spacecraft. First, 80–95% of all culturable microorganisms recovered from spacecraft are mesophilic heterotrophic species considered indigenous to human, soil, or airborne ecologies. Second, microbial contaminants of spacecraft are generally composed of bacterial and fungal species that closely reflect the environments within which spacecraft are assembled. Third, microbial species recovered from spacecraft (Favero, 1971; Puleo et al., 1973b, 1977; Venkateswaran et al., 2001) are nearly identical to species observed in airborne samples in clean rooms (Favero et al., 1966; La Duc et al., 2007). Fourth, unusual extremophiles from diverse terrestrial ecosystems, including nonculturable species, have been recovered from spacecraft (e.g., La Duc et al., 2003, 2004), but precise estimates of the percentage of nonculturable species present on spacecraft surfaces are lacking. Fifth, during the Apollo era, a correlation between relaxed sanitation protocols and increased microbial diversity was observed in latter missions (Puleo et al., 1973b). Sixth, many of the microbial species recovered from spacecraft surfaces are aerobic mesophilic species, although facultative anaerobes have been recovered from some vehicles (Foster and Winans, 1975). And seventh, the abundance of spore-forming bacteria (predominantly Bacillus spp.) ranged between 1% and 36% of the total culturable heterotrophic species recovered from spacecraft; the overall average of 12 assayed spacecraft was reported to be 10% of the total diversity for spore-forming Bacillus spp. (Dillon et al., 1973).
Although a significant number of articles have characterized microbial diversity of spacecraft before launch, almost no literature exists on how terrestrial microorganisms might survive the journey to the lunar surface or how long they might survive after delivery. One exception is the study by Mitchell and Ellis (1971) that describes the recovery of a single colony of Streptococcus mitis from foam insulation that was deeply embedded within the Surveyor III camera recovered by Apollo 12 astronauts. However, in an article by Knittel et al. (1971), published in the same conference report as the Mitchell and Ellis article, a second team of microbiologists was unable to recover viable terrestrial microorganisms from Surveyor III wire cables. Rummel (2004) was the first to question the validity of the S. mitis report and he suggested that the S. mitis recovery might have been terrestrial contamination during postflight analyses on the Surveyor III camera. In addition, Rummel et al. (2011) presented a 16 mm film record taken during the processing of the Surveyor III camera that clearly demonstrated that the hardware was not handled by appropriate aseptic protocols. We agree with the conclusions of Rummel (2004) and Rummel et al. (2011) and we encourage them to make a full presentation of their arguments in the peer-reviewed literature. Furthermore, setting aside the potentially specious nature of the Mitchell and Ellis (1971) report (see Section 4.2. for more details), the possible survival of at least one terrestrial microbe on the lunar surface for 2.5 years has remained a frequent problematic claim in the non-astrobiology literature in which long-term survival rates by Earth microorganisms on the Moon are presumed.
In contrast, Horneck and colleagues (Horneck et al., 1994; Horneck, 1998) reporting on results from the Long Duration Exposure Facility (LDEF) demonstrated that spores of Bacillus subtilis can survive 69 months in low-Earth orbit (LEO). However, the LDEF samples were exposed in a space environment below the Van Allen radiation belts, and thus, may not have experienced the full range of biocidal factors that a spacecraft might be exposed to on the Moon. For example, B. subtilis in experimental payloads on several LEO orbiters was exposed to temperatures between −30°C and 60°C (Horneck, 1998; Horneck et al., 2001), whereas external surfaces of equipment on the Moon were heated between 100°C and 140°C (Lucas et al., 1967a, 1967b; Langseth et al., 1972). In addition, the pressure in LEO can be as high as 10−4 Pa, whereas the pressure on the surface of the Moon can be as low as 10−10 Pa (Schuerger, 2004). And finally, the ionizing radiation environment in LEO is significantly lower than on the Moon because the exposures to galactic cosmic rays (GCRs) and solar cosmic rays (SCRs) are substantially reduced by Earth's magnetic field.
The primary objectives of this study were to characterize the effects of lunar conditions on survival of common spacecraft microorganisms with the goals of (1) developing a first-order approximation for a Lunar Microbial Survival (LMS) model for landed or crashed spacecraft, (2) estimating the length of time that spacecraft bioburdens might remain viable on the Moon, and (3) exploring the possibility that the recovery of S. mitis from Surveyor III (Mitchell and Ellis, 1971) can be theoretically supported or rejected by a quantitative LMS model. During this study, the interactive effects of high temperatures (i.e., up to 100°C generated on the Moon by solar infrared irradiation) and low pressures were tested. The effects of ultraviolet (UV) irradiation, ionizing radiation (e.g., electrons, protons, neutrons, GCRs, or high Z and E [HZE] particles), and high-energy electromagnetic radiation (e.g., gamma, X-rays, or secondary particle cascade radiation) on microbial survival were modeled based on available literature.
2. Materials and Methods
2.1. Definition of “lethal dose”
We define the term lethal dose (LD) here to mean reducing a viable bioburden by a factor of −10 logs (10−10) in which the kill rate of a given factor is empirically derived for a reduction of −6 logs from time zero to some specific time step and dose, followed by theoretically extrapolating an additional −4 logs reduction in microbial inactivation. A LD per biocidal factor is considered the point at which the bioburden is “functionally sterilized” by that biocidal factor. Furthermore, most kill kinetics for biocidal factors follow exponential decay curves in which significant die-offs are observed over short time periods (first phase) followed by slower additional die-offs (second phase) due to shielded or aggregated spores or cells being protected from the biocidal factor. To simplify the overall LMS modeling, we will use two linear models to represent the two phases of the kill curves reported here and from the literature.
2.2. Estimating the accumulated microbial bioburdens on the Moon
Since the Luna 2 spacecraft impacted the Moon on September 14, 1959, 54 missions have either landed or crashed 77 vehicles or major components on the lunar surface (Table 1). No systematic estimate of the microbial bioburdens on all of these vehicles has been compiled. A study by Dillon et al. (1973) did survey the literature to estimate the bioburdens at launch for vehicles launched before February 1971. Based on the report by Dillon et al. (1973), spacecraft bioburdens are estimated for all documented vehicles beginning with Luna 2 in 1959 and extending to the Lunar Atmosphere Dust and Environment Explorer (LADEE) spacecraft that impacted the lunar surface on April 18, 2014 (Table 1). Data for spacecraft specifications including landing or impact dates, latitude and longitude coordinates of landing or impact sites, and vehicle dry masses were derived from the Lunar and Planetary Institute website (
Spacecraft Data, Location of Lunar Landing or Impact Sites, Number of Lunar Days Since Landing or Impacting on the Moon, and Estimated Microbial Bioburden at Launch
Table data in columns 1–7 based on the following sources: Lunar and Planetary Institute website (
Number of cells predicted based on assumptions A1 through A11, as described in the Materials and Methods section.
Number of cells predicted by the LMS model based on assumptions A12 through A16, as described in the Materials and Methods section.
Bioburden levels for spacecraft components that were impacted onto the lunar surface were scaled downward by 104 based on the biocidal effects of compression forces identified for bacteria in simulated bolide impacts (see Fraser et al., 1971; Whitfield et al., 1973; Burchell et al., 2004; Barney et al., 2016; Plescia et al., 2016). Number of cells predicted by the LMS model based on assumption A15, as described in the Materials and Methods section.
Abbreviations: LADEE, Lunar Atmosphere Dust and Environment Explorer; LCROSS, Lunar Crater Observation and Sensing Satellite; LM, Lunar Module; LMS, Lunar Microbial Survival.
Estimates of the probable bioburdens at landing (Table 1, column 10) for the LMS model of all spacecraft were calculated based on 16 sequential model assumptions (A).
(A1) A key assumption of the LMS model is that microbial cells and spores occur on spacecraft surfaces as single cells or small aggregates of cells/spores such that each cell or spore is directly exposed to the space conditions in question. Large aggregates of 10's to 100's of cells are assumed to be absent. This assumption is supported by the literature on microbial surveys of spacecraft surfaces in which colonies on assay plates generally appear as low densities of single colonies per assay plate (e.g., Schwendner et al., 2013).
(A2) The data of Dillon et al. (1973) on the number of culturable bacteria (henceforth culturable bioburden) at launch for lunar spacecraft from 1959 to February 5, 1970 were reported as originally published (Table 1, column 7). The review by Dillon et al. (1973) was consistent with other studies on microbial bioburdens at launch for lunar spacecraft (Powers, 1967; Puleo et al., 1970, 1973a, 1973b; Favero, 1971; Taylor et al., 1973; Herring et al., 1974).
(A3) Lunar Orbiters 1 and 2 were assigned the launched bioburden of 2.74 × 10⁵ viable cells based on the mean of bioburdens reported for Lunar Orbiters 3, 4, and 5 (Table 3 in Dillon et al., 1973).
Numbers of Days at or Above 70°C, 80°C, 90°C, or 100°C on Lunar Surface Equipment or Landers
Based on a single thermocouple mounted on the exterior wall on Compartment B, Surveyor III (Lucas et al., 1966).
Based on a single thermocouple mounted on the solar panel oriented on the central mast of the Surveyor III spacecraft (Lucas et al., 1967a, 1967b).
Based on the average of six thermocouples attached to ground cabling on the Apollo 15 Heat Flow experiment (Langseth et al., 1972).
(A4) All Apollo surface payloads landed on the Moon were assigned bioburdens of 7.01 × 10⁵ viable microbes at launch based on similarities to the Surveyor spacecraft in designs, complexities, masses, and the mean culturable bioburdens published for Surveyors I through VII (Table 3 in Dillon et al., 1973).
(A5) Luna 18, 19, 20, 21, 22, 23, and 24 were assigned bioburdens of 4.0 × 10⁷ at launch based on similarities to other Luna spacecraft in design, complexity, mass, and the mean bioburdens per launched lander (Table 5 in Dillon et al., 1973).
(A6) Bioburdens at launch for the Saturn S-IVB boosters that were crashed into the Moon after Apollo 13, 15, 16, and 17 missions were assigned the value of 3.1 × 10⁸ viable microbes at launch based on the published bioburden for the Apollo 14 S-IVB booster (Table 7 in Dillon et al., 1973).
(A7) Apollo 15, 16, and 17 Lunar Module (LM) descent stages were assigned culturable bioburdens of 3.9 × 10⁷ viable cells based on the published bioburdens for Apollo 11, 12, and 14 LM descent stages (Table 7 in Dillon et al., 1973).
(A8) Apollo 11, 15, 16, and 17 LM ascent stages were assigned the bioburden value of 1.4 × 10⁷ viable cells based on the average of LM ascent stage bioburdens for Apollo 12 and 14 (Table 7 in Dillon et al., 1973).
(A9) Lunokhod 1 and 2 were assigned the culturable bioburdens of 9.6 × 10⁶ viable cells based on the mean bioburdens at launch for all Luna missions (4.0 × 10⁷; Table 5 in Dillon et al., 1973) scaled downward by a factor of 0.24 to adjust to the lower masses of Lunokhod 1 and 2 (Table 1; this study). The average dry mass of all Luna missions was 3384 kg, and the average dry mass for the Lunokhod 1 and 2 rovers was 795 kg. The Lunokhod rovers had in general one-quarter the mass of the Luna landers and, therefore, we assigned one-quarter the culturable bioburdens (i.e., on a dry mass basis).
(A10) Apollo 15 and 16 subsatellites were assigned bioburden values of 1.59 × 10⁴ viable cells based on the average value for Lunar Orbiters 3, 4, and 7 (Dillon et al., 1973) adjusted for mass differences. The mean dry mass of Lunar Orbiters 3, 4, and 7 was 387 kg and the mean dry mass of two Apollo subsatellites was 41 kg (Table 1; this study). The Apollo 15 and 16 subsatellites had in general only 0.11 mass of the Lunar Orbiters, and thus, we assigned only 0.11 of the bioburdens (i.e., on a dry mass basis).
(A11) Launch estimates for spacecraft contamination between April 10, 1993 (Hiten orbiter) and April 18, 2014 (LADEE orbiter) were not readily available. The vehicles between these dates in Table 1 (column 8) were assigned bioburdens at launch based on taking the average bioburden per kg per spacecraft (2.54 × 10⁴ spores–cells/kg) (Dillon et al., 1973) and estimating each value in Table 1, column 8, by scaling the average bioburden/kg dry mass of published spacecraft to the dry masses of the more recent spacecraft.
(A12) Early literature on the culturable bioburdens on spacecraft (e.g., Powers, 1967; Puleo et al., 1970; Favero, 1971; Dillon et al., 1973; Herring et al., 1974) underestimated the total bioburdens at launch due to the emphasis on enumerating heterotrophic aerobic spore-forming and nonspore-forming bacteria. A paradigm of modern molecular microbiology states that between 1% and 0.01% of microbial species in natural ecosystems are culturable (Ward et al., 1992; Amann et al., 1995; Torsvik et al., 1996). However, recent studies on the microbial diversity of spacecraft surfaces have identified only a small number of species that are generally considered nonculturable (Venkateswaran et al., 2001; La Duc et al., 2004). Unlike natural soil and marine ecosystems that are rich in water and nutrient resources, spacecraft are oligotrophic ecosystems that are likely to be constrained in nonculturable species. Thus, a conservative scalar of 2 logs (102) upward for data in Table 1, columns 7 and 8 was used to include under-represented and nonculturable microbial species present on spacecraft surfaces. The data given in Table 1, column 9, for all lunar spacecraft are reasonable estimates of the total probable bioburdens at launch for each mission.
(A13) Apollo LM ascent stages that were later impacted on the surface of the Moon were scaled an additional 2 logs upward based on the increased bioburdens contained within the astronaut habitats. In general, microbial contamination can be between 102 and 103 higher within human crewed compartments than in robotic vehicles (Puleo et al., 1973b).
(A14) Lunar cycles (henceforth lunations) in Table 1 were estimated from dates that spacecraft were landed or crashed on the surface to January 1, 2019 based on a lunation equal to 42,524 min (29.53 days) for noon-to-noon cycles.
(A15) No articles in the literature were found that quantitatively estimated the loss of spacecraft bioburdens due to impact processes on the lunar surface. However, a number of studies (e.g., Fraser et al., 1971; Whitfield et al., 1973; Burchell et al., 2004; Barney et al., 2016; Plescia et al., 2016) have demonstrated that compression forces on bacteria during simulated impact events into regolith-like materials yield a range of biocidal effects with an overall average of approximately −4 logs (10−4) in survivors. Thus, all spacecraft crash landed on the Moon were scaled downward by −4 logs to accommodate the probable loss of viable bacteria during impact events (adjusted in Table 1; column 10 data).
(A16) Although recent articles (e.g., Glavin et al., 2010; Loftus et al., 2010; Linnarsson et al., 2012) have examined the biotoxicity of lunar dust, we have assumed that spacecraft microorganisms were not mixed with lunar regolith, and thus, the potential biocidal effects of lunar dust are ignored in the current LMS model.
2.3. Estimating the inactivation rates of the landed or crashed bioburdens on the Moon
2.3.1. Inactivation of microorganisms exposed to high vacuum
A number of articles have studied the effects of various extraterrestrial factors on microbial survival (e.g., Bücker et al., 1994; Horneck et al., 1994, 2010; Schuerger et al., 2003), but most studies report only a few time steps for test microorganisms under individual stress factors. To develop a first-order LMS model on how fast terrestrial microorganisms might be inactivated on the Moon by cis-lunar vacuum conditions, control data from a diversity of articles were plotted against time for B. subtilis, a spore-forming bacterial species (Fig. 1). Data from “control” treatments refer to survival rates for B. subtilis spores maintained at ∼25°C and exposed to pressures between 1 × 10⁻⁴ and 6 × 10⁻⁷ Pa. The data were extracted from articles published from microgravity and high-vacuum laboratory experiments. Effects of other parameters on microbial survival in the literature were temporarily ignored. Data for vacuum effects on B. subtilis were derived from the studies of Bücker et al. (1974), Dose and Klein (1996), Hagen et al. (1971), Horneck et al. (1984, 1994, 1995), Koike and Oshima (1993), Lorenz et al. (1968), and Morelli et al. (1962).
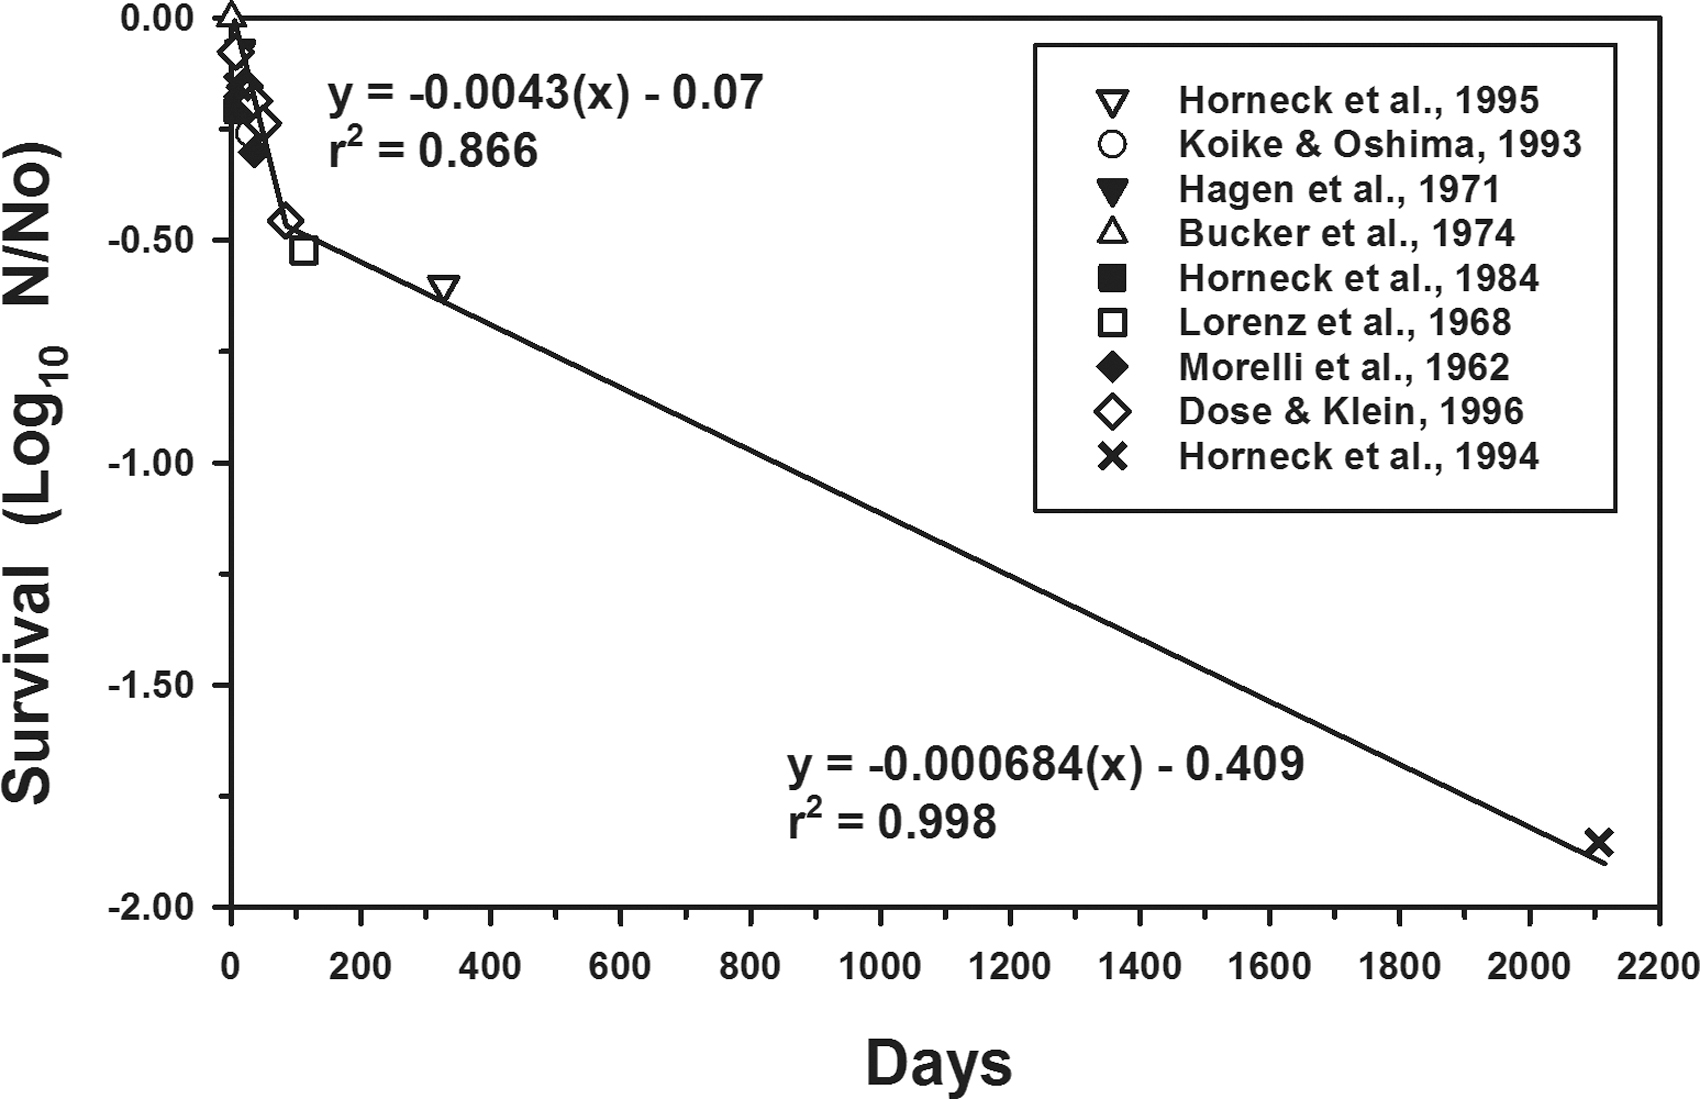
Effects of vacuum only on the survival of Bacillus subtilis spores. Data were extracted from the cited articles and represent the control treatments in the studies that were exposed to only high vacuum conditions during microgravity or laboratory experiments. Linear models were independently generated for both phases with each point representing the mean of the appropriate experimental replicates summarized in the articles. The longest time step is 2107 days for B. subtilis spores exposed to space on the LDEF (Horneck et al., 1994). The precise inflection point (or elbow) between the first and second phases occurred at −0.473 logs (y-axis) and 93.7 days (x-axis). LDEF, Long Duration Exposure Facility.
2.3.2. Interactive effects of high temperature and high vacuum on survival of B. subtilis
Thermocouples on the Surveyor spacecraft (Lucas et al., 1966, 1967a, 1967b) and on surface equipment of deployed Apollo payloads (Langseth et al., 1972) demonstrate that the temperatures of spacecraft external surfaces on the Moon can reach daytime highs between 100°C and 140°C. Temperatures in excess of 50°C can begin to impact the survival of most terrestrial microorganisms. Two separate experiments were designed to investigate the interactive effects of high temperature and low pressure on the survival of B. subtilis.
First, spores of B. subtilis HA101 were produced according to previously published procedures (Schuerger et al., 2003, 2006). Aluminum coupons (Seton, Inc., Brainford, CT) measuring 5.3 cm × 1.7 cm × 1 mm were doped with 2 × 10⁶ endospores per coupon and dried at 25°C for 4 h in a forced-air biosafety cabinet (model NU-400-157, NuAire Class II, Type A2 biosafety cabinet; NuAire, Inc., Plymouth, MN). Doped aluminum coupons were exposed to experimental conditions of 70°C, 80°C, 90°C, or 100°C for time periods up to 56 days in a convective air oven. Treated coupons were then assayed by using a Most Probable Number (MPN) procedure described previously (Mancinelli and Klovstad, 2000; Schuerger et al., 2003, 2006). The minimum detection level of the MPN assay was 11 viable spores per coupon (Schuerger et al., 2006). The experiment was conducted twice with four replicates per treatment per run (n = 8).
To determine the interactive effects of high temperature and high vacuum on bacterial survival, endospores of B. subtilis HA101 were prepared on aluminum coupons as already described. Doped coupons were placed in a 1.5 m3 high-vacuum chamber (model IVI 6100-3030-0401 High Vacuum System; IVI Corporation, Pembroke, MA) in glass Petri dishes configured with thermocouples connected to an external datalogger (Hydra-II; Fluke Corp., Everett, WA). Doped coupons were placed immediately adjacent to thermocouples. Spores of B. subtilis were exposed to high vacuum (3 × 10⁻⁴ Pa), high temperature (100°C), or both for 8 h. Survival of B. subtilis spores was estimated with the MPN assay. Experimental treatments were compared with a set of Earth-control coupons maintained adjacent to the lunar simulator at 25°C and 101.3 kPa. The experiment was conducted three times with four replicates per treatment per run (N = 12).
2.3.3. Inactivation of microorganisms on crashed spacecraft by impact forces
Although meteoroid impact velocities on the Moon can range between 2.4 and 73 km/s (Whitfield et al., 1973), recent estimates for impact velocities of spacecraft into the lunar surface are on the low end of this range at ∼2.6 km/s (Plescia et al., 2016). Estimates for bacterial spore survival in the genus Bacillus for bolide impact velocities of 1.0–5 km/s have yielded survival rates in the range of 0.1% to <10−6 of the starting spore densities per impact event (e.g., Whitfield et al., 1973; Burchell et al., 2004; Fajardo-Cavazos et al., 2005; Barney et al., 2016).
We use here the conservative kill rate of 10−4 spores/cells per crashed spacecraft for two reasons. First, the much lower density of crashed spacecraft compared with interplanetary meteoroids (Plescia et al., 2016) yields smaller impact craters for spacecraft than for meteoroids and, thus, some of the kinetic energies in spacecraft impacts are likely dissipated in the collapsing spacecraft structures compared with solid meteoroids. And second, we found no data in the literature that estimated the thermal dynamics of crashing spacecraft, whereas the temperatures achieved for impacting meteoroids might reach 2500 K (Keil et al., 1970). If the kinetic energy is dissipated more slowly, or more efficiently, in semihollow spacecraft than in solid meteoroids, it seems reasonable to expect that the impact temperatures should be lower for spacecraft and, thus, bacterial survival higher. The impact-induced temperatures for spacecraft into the Moon requires further study to better constrain the pressure and thermal kill kinetics processes for impacting spacecraft. Therefore, the total probable bioburdens at launch (Table 1, column 9) for spacecraft crashed into the lunar surface (most crash site locations are provided in Table 1, column 5) were adjusted downward by −4 logs per vehicle to yield their total probable bioburden at Moon contact that are indicated in Table 1, column 10.
2.3.4. Inactivation of microorganisms by solar UV irradiation
The solar constant for Earth (1344 W/m2; between 200 and 2500 nm; based on Arvesen et al., 1969; Schuerger et al., 2003) is assumed for the solar irradiation of the Moon's surface. Although vacuum UV <200 nm will likely contribute to the biocidal nature of solar UV irradiation on the Moon, the irradiation <200 nm was ignored for the current LMS model. Biocidal solar UV irradiation for Earth's solar constant was estimated by Schuerger et al. (2003) for UVC (200–280 nm; 7.39 W/m2) and UVB (280–320 nm; 19.49 W/m2) that equals a total flux of 26.9 W/m2 [96.8 kJ/(m2·h)] (Table 2).
Lethal Dose Rates and Lunar Microbial Survival Predictions for Individual and Combined Biocidal Factors on the Surface of the Moon Using Bacillus subtilis Spores as the Modeled Organism
Data for the surface conditions present on the Moon were adapted from Appelbaum and Flood (1990), Cockell and Andrady (1999), Horneck et al. (2001), Kuhn and Atreya (1979), and Schuerger et al. (2003).
LD values are defined as the dose equivalents for biocidal factors to directly inactivate at least −10 logs of viable spores of B. subtilis over given time periods assuming that the biocidal factors are acting in linear manners at the lunar equator at local noon. The LD values are derived from the literature and from data shown in Figs. 1–4. For example, if spores or B. subtilis were placed on a horizontal surface at the Moon's equator, at local noon, the LD value for UVC+UVB would yield greater than −10 logs of spores killed in 36 min.
Log10 reductions in bioburdens present on spacecraft were derived from Eqs. 1 to 7 and represent the LMS model. External surfaces were defined as those surfaces in which all space factors could act upon, including UV irradiation, temperature, vacuum, and ionizing radiation. Shallow internal surfaces were defined as those spacecraft surfaces that only heat (≥70°C thermally conducted from external spacecraft surfaces) and cis-lunar vacuum pressure could act upon. And deep internal surfaces were those that were thermally isolated from spacecraft external surfaces, in which temperatures were <70°C, and vacuum alone was impacting microbial survival.
Owing to the low energy of the solar wind nuclei and electron energies, the penetration depth is in the range of micrometers. For the estimate in the table a range of 10 μm was chosen. LD values for ionizing radiation (i.e., SWP, SPE, SCR, GCR, and HZE) were estimated at ∼5 kGy for B. subtilis wild-type spores (Moeller et al., 2007, 2010).
The total absorbed dose for SPEs is calculated taking the very strong events from Kim et al. (2009) for the past 50 years arriving at a value of ∼140 Gy, with a 90% confidence level behind 1 g/cm2 shielding thickness.. Shielding is very efficient for solar particles, so the inactivation rates for microorganisms decrease considerably with shielding depth. The surface dose (unshielded) may be as high as 600 Gy/year (ESA-ESREC, 2008), but is negligible compared with the SWPs dose.
A space vehicle in the interplanetary environment would receive approximately twice the GCR dosage because on the Moon's surface nearly one-half of the isotropic GCRs are attenuated by the Moon itself. Thus, shielding provides not more than a sparing factor of 2. LD values are calculated by applying mean absorbed dose levels.
The HZE calculations were based on measured inactivation cross sections of B. subtilis spores for single heavy ions in spaceflight and accelerator experiments (Horneck et al., 1989).
The biocidal effects of spacecraft impacts are attributed to compression pressures (e.g., Barney et al., 2016; Plescia et al., 2016). Impact temperatures for materials in spacecraft crash landed on the Moon were not found in the literature and, thus, were not modeled. However, some of the biocidal effects attributed to the impact velocities of spacecraft might be caused by increased temperatures during impact events on the Moon.
Abbreviations: G, 1 Earth gravity; GCRs, galactic cosmic rays; Gy, Gray; HZE, high (H) atomic number (Z) and energy (E) particles; LD, lethal dose given for a bioburden reduction of −10 logs for spores and cells (100% biocidal effect; see Section 2.1); na, not applicable; SCRs, solar cosmic rays; SPEs, solar particle events; SWPs, solar wind particles; T, temperature; UV, ultraviolet; UVB, 280–320 nm; UVC, 200–280 nm.
The UV-induced kill kinetics for monolayers of B. subtilis HA101 (adapted from Schuerger et al., 2006) were used to predict the survival rates for spore-forming bacteria under lunar conditions. Because spores of Bacillus spp. are considered to be significantly more resistant to space conditions than nonspore-forming species (Horneck et al., 2010; Rummel et al., 2014), we assume that all nonspore-forming microorganisms will be inactivated ∼10 × faster than described here for B. subtilis (see also, Portner et al., 1961; Hagen et al., 1971; Koike, 1993; Saffary et al., 2002). The LD for UV irradiation is defined to be (1) the UVC+UVB flux that yields at least −6 logs reduction in a population of spores (as determined through microbial assays; for example, Schuerger et al., 2006) and (2) extrapolated downward an additional −4 logs in viability (to approximate the sterilization protocol used for the Viking landers) (Puleo et al., 1977).
2.3.5. Inactivation of microorganisms exposed to ionizing radiation
The Moon possesses no substantial atmosphere nor a planetary magnetic field, so its surface is exposed to the full influx of galactic and solar radiation. Solar cosmic rays (SCRs) consist of low energy solar wind particles (SWPs) that flow constantly from the Sun and the so-called solar particle events (SPEs) that originate from magnetically disturbed regions of the Sun, which sporadically emit bursts of charged particles with high energies.
SWPs consist of 96% protons, 4% helium ions, and varying small amounts of heavier ions up to iron and, to keep charge balanced, an equilibrium amount of electrons. Nuclei energies range from 0.3 to 3 keV/nucleon and electron energies range from 1 to 100 eV (Vaniman et al., 1993). The penetration depth of SWPs is, therefore, very limited and they are absorbed within a few micrometers of the surface. However, since the proton particle flux reaches up to 3 × 10⁸ particles/(cm2·s), the absorbed dose can become quite high in the micrometer scale (e.g., for microorganisms exposed on outer surfaces of spacecraft). At a depth of 1 μm, up to 30 kGy/d can be deposited. We use the energy deposition depth of 10 μm in Table 2, which yields a dosage of 50 Gy/d for SWPs (or 1.83 × 10⁴ Gy/year) (Smithers et al., 2007; see also ESA-ESTEC, 2008).
The composition of particles in SPEs is not very different from that of the low energy SWPs, but the energies of the particles can reach several GeV. SPEs develop rapidly and generally last for a few hours to several days. During the August 1972 solar event, the largest dose event in the spaceflight era, an absorbed dose as high as 50 Gy would have occurred by the skin in an extravehicular activity (EVA) suit behind 0.5 g/cm2 shielding. Behind 1 g/cm2 shielding there is still an absorbed dose of 20 Gy declining after 5 g/cm2 shielding to about 3 Gy (Wilson et al., 1997). Such strong events are very rare, typically about one event during the 11-year solar cycle. Kim et al. (2009) listed the major SPEs from solar cycle 19 to 23 during which seven very large SPEs occurred. Assuming a worst-case scenario, which is seven times the exposure rates of the August 1972 SPE, we estimate 140 Gy for 1 g/cm2 shielding in spacecraft interiors, and about 20 Gy behind 5 g/cm2 shielding. Divided by 50 years, the annual absorbed doses are about 3 or 0.4 Gy, respectively. For space engineering, the European Space Agency (ESA) uses an annual exposure rate of 600 Gy for SPEs unshielded and 50 Gy behind 1 g/cm2 shielding applying a 95% confidence level (ESA-ESTEC, 2008). This is a factor ∼20 times higher than calculations based on Kim et al. (2009) that modeled the 1 g/cm2 shielding value. Being conservative concerning inactivation of spores, we apply an annual dose of 3 Gy in Table 2.
Galactic cosmic rays (GCRs) are composed mainly of protons with 14% α-particles (He-ions) and 1% heavier particles, (called high Z and E particles; HZE) (Mewaldt, 1988). At the lunar surface, GCRs give rise to an annual absorbed dose around 100 mGy, depending on solar activity (peaking at solar minimum and lowest at solar maximum). The dose is calculated based on the Radiation Assessment Detector-Mars Science Laboratory (RAD-MSL) measurements at a mean shielding depth of 10 g/cm2 during the cruise of 0.48 mGy/d (Hassler et al., 2014; Zeitlin et al., 2013) taking into account that a point on a planetary surface sees only 2π of the solid angle, so only half of the absorbed dose compared with free space is present. About the same dose rate was measured with the radiation monitor (RADOM) on the Chandrayaan spacecraft (Dachev et al., 2011). The spacecraft orbited around the Moon at an average altitude of 100 km from November 2008 to May 2009, which was very close to solar minimum. The measured absorbed dose rate was 0.23 mGy/d for a solid angle of about 1.32 × 2π. From June 2009, the Cosmic Ray Telescope for the Effects of Radiation (CRATER) of the NASA Lunar Reconnaissance Orbiter (LRO) measured behind 4.4 g/cm2 aluminum equivalent integrated absorbed dose of 700 mGy in 5.5 years, which gives a daily mean absorbed dose of 0.35 mGy/d (Mazur et al., 2015), including some SPEs for a solid angle approximately the same as for RADOM. Reitz et al. (2012) calculated absorbed doses for the skin in an EVA scenario with a shielding of ∼0.5 g/cm2 of 0.22 mGy/d using the Monte Carlo framework GEANT4. We choose an annual dose of 0.1 Gy based on MSL measurements in Table 2.
Since GCRs expose microorganisms to a very low fluence of particles, the application of the absorbed dose to describe the effects of heavy ions is not appropriate. A single cell can be only affected if it is hit by a heavy ion. Therefore, information about the inactivation cross section is needed. For example, onboard of Apollo 16 and 17, experiments were performed to study the biological effects of GCRs. Layers of spores of B. subtilis were sandwiched between visual track detectors in Biostack experiments and the effects were traced back to traversals of single heavy ions (Bücker and Horneck, 1975). Therefore, this concept is included in Table 2 with a separate line for single HZE particle effects.
Secondary particles such as neutrons, pions, electrons, and muons are produced from the interactions of high-energy particles of solar and galactic origin with the atoms of the spacecraft material and regolith. The number of secondary particles increases with the depth in the shielding material until the cascade dies out due to the absorption of primary particles. The absorbed dose begins to decrease after ∼10 g/cm2 of aluminum shielding due to the absorption of low-energy particles. Through the interaction of the high-energy particles, the absorbed dose due to secondary production increases after ∼20 g/cm2 shielding but does not approach the absorbed dose value at 0 g/cm2 shielding. A good example is Earth's atmosphere in which the amount of ionization increases to a maximum at a shielding thickness of 56 g/cm2. Therefore, depending on the energy spectrum and the choice of shielding material, the local spacecraft geometry may even enhance the doses observed behind thicker shielding inside the interior. Calculations done by Slaba et al. (2011) show for SCRs and GCRs a decrease of the dose equivalent (i.e., absorbed dose multiplied by a radiation quality factor) can be observed with depth. For example, in the interiors of the Apollo Ascent LM stages, survival rates of spores would be higher because secondary radiation does not cause an enhancement effect in dose equivalent. Thus, predictions for secondary particles were not included in Table 2 because their contribution is included in the GCRs contribution.
To assess the survivability of B. subtilis spores to the absorbed dose on the lunar surface, the data from the study of Moeller et al. (2010) are taken, in which B. subtilis spores of different strains were irradiated with X-rays. Wild-type strains of B. subtilis exhibited the highest resistance to X-rays, reaching an inactivation level of −10 logs at an exposure of 5 kGy (data obtained by extrapolation). The comparison with X-ray exposures is justified because most of the absorbed doses in SPEs or GCRs are delivered by protons, which have approximately the same relative biological effectiveness (RBE) compared with X-rays.
For the high-charge and high-energy HZE particles, the RBE is shown higher than for X-rays in several test systems. In accelerator experiments on the ground with single low-energy ion exposures, inactivation cross sections of about the size of the spores (∼1.41 μm2) are measured, which exceed fivefold the geometrical cross section the spore protoplast of ∼0.25 μm2 (Horneck et al., 1989). In the Biostack spaceflight experiments on Apollo 16, 17, and the Apollo-Soyuz Test Project (ASTP) mission, inactivation cross sections of ∼5.24 μm2 were determined (Facius et al., 1978, 1979). An inactivation cross section of 5.24 μm2 was used to calculate the inactivation probabilities for HZE particles.
The question on the appropriate cross section to estimate the inactivation by heavy ions resulted in three commonalities including (1) the inactivation probability for a hit on a B. subtilis spore is always <1, (2) a far reaching effect is observed in accelerators and in space experiments, and (3) that the accelerator experiments deliver cross sections that are similar to fluence effect curves, which are far below the cross sections received in space experiments (Horneck et al., 1989). By using the assumption that the inactivation cross section is 5.24 μm2 and the flux is 0.02 particles/(cm2·s), after 50 years 20% of the spores are survivors. When using the inactivation cross section of 1.41 μm2 from accelerator experiments, 65% of the exposed spores would still survive after 50 years of exposure. Assuming that a spore hit by a heavy ion will be inactivated and that the heavy ion flux in 50 years accounts to 0.3 particles per μm2, Poisson statistics results in nonhit spores of ∼74%, which of course are all survivors. For one lunation, the inactivation probability for the inactivation cross section of 5.24 μm2 arrives at −0.0045 log, whereas for the inactivation cross section of 1.41 μm2 a value of −0.0003 log was derived (Table 2).
2.4. Statistics and data management
Data for Fig. 1 were derived from the articles indicated in the figure and these represent the mean values for the vacuum-only controls in each study. Data for Fig. 2 were based on the experiments for biocidal effects of elevated temperatures already described. Data for Fig. 3 were based on the experiments for interactive effects of high temperature (100°C) and low pressure (10−6 mbar) already described. Data for Fig. 4 were adapted from a previous study by Schuerger et al. (2006) on the effects of UV irradiation on B. subtilis HA101 spores. However, we have reanalyzed the data from the study of Schuerger et al. (2006) to force a spline point where the two linear models overlap. We present here updated linear models for the data shown in Fig. 4.
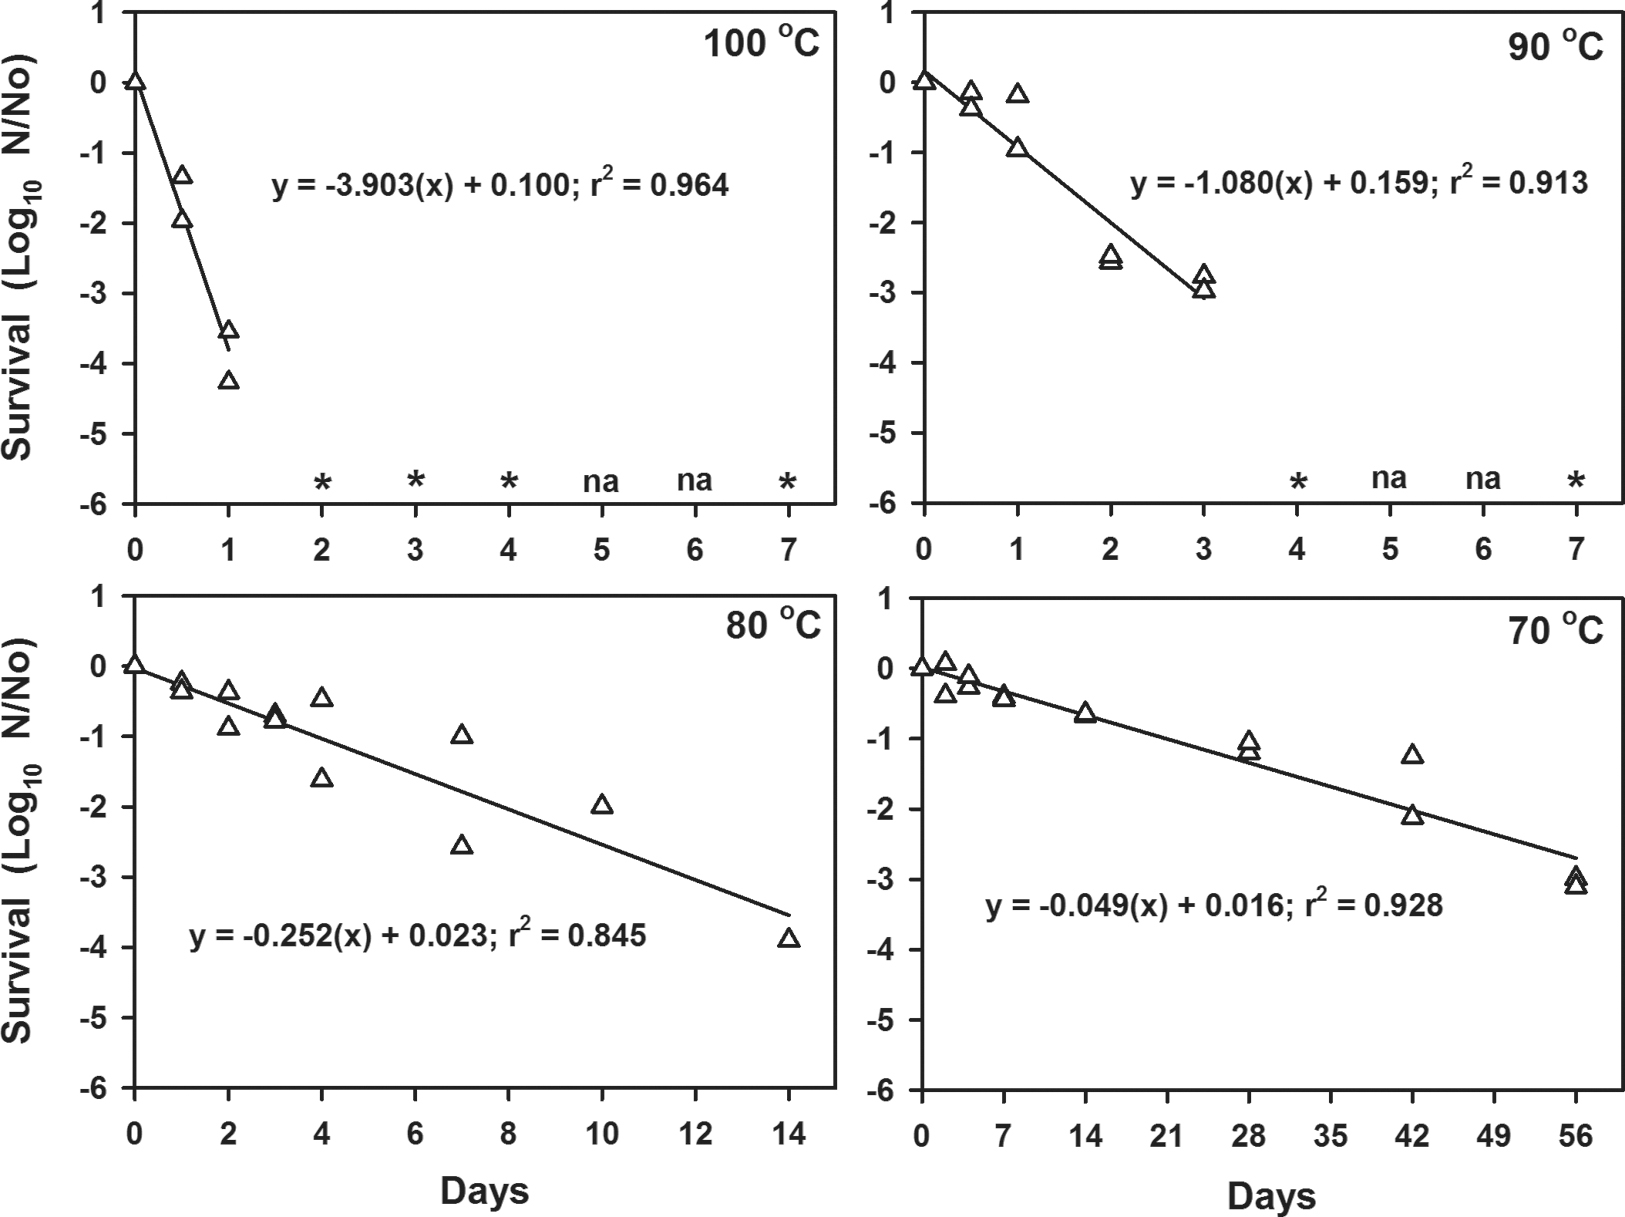
Kill curves for the inactivation of B. subtilis HA101 spores exposed only to high temperatures for up to 56 days at laboratory normal pressures of 101.3 kPa. Linear models were independently generated with each datum point representing four replicates in separate and completely randomized experiments. Each time step was conducted twice (total n = 8 per day tested) and the means of both experiments per time step were plotted (i.e., each plotted point represents n = 4 samples). Asterisks represent time steps in which no viable spores were detected in the assays (lower detection limit = 11 viable spores per sample). The time steps marked by na were not assayed.
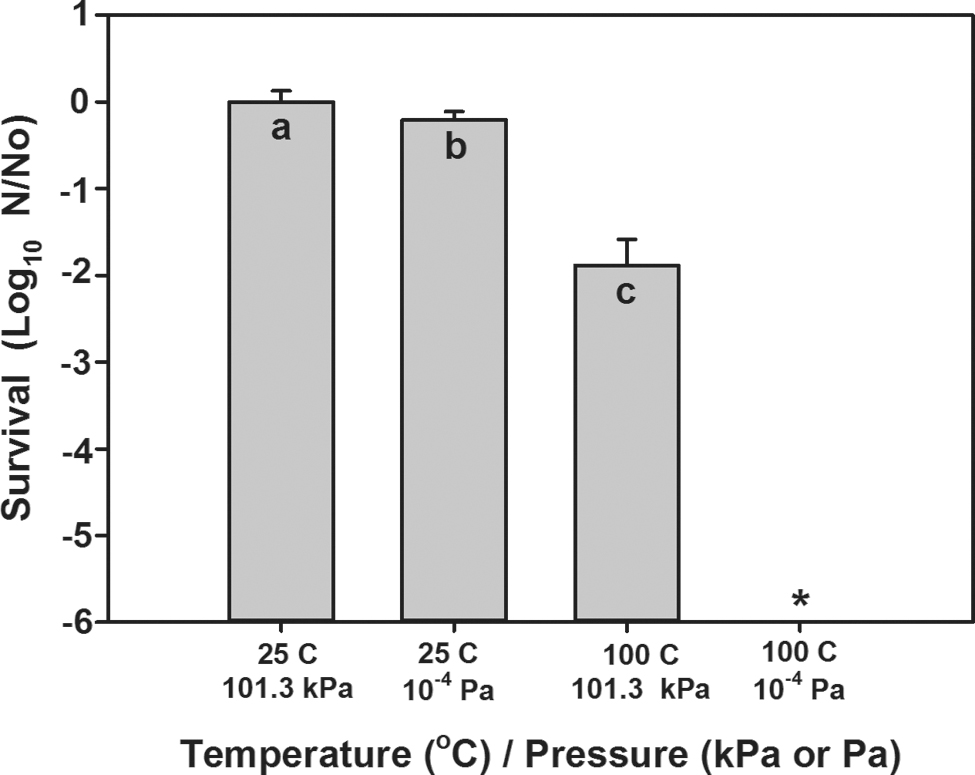
Interactive effects of high temperature (100°C) and low pressure (10−4 Pa) on spore survival by B. subtilis HA101. Spores exposed to 10−4 Pa and 25°C decreased approximately −0.25 logs compared with laboratory controls at 101.3 kPa and 25°C, whereas spores exposed to 101.3 kPa and 100°C decreased approximately −2 logs. *The combination of high temperature and low pressure resulted in the sterilization of the aluminum coupons doped with bacterial spores. The minimum detection level was 11 spores per sample. Data were log transformed and subjected to ANOVA and protected least-squares mean separation tests; different letters indicate a significant difference between means (p ≤ 0.05; n = 12). Error bars are standard deviations of the means. ANOVA, analysis of variance.

Kill curve kinetics for B. subtilis HA101 spores exposed to UV irradiation and exposed at normal laboratory pressures of 101.3 kPa. The data are replotted from Schuerger et al. (2006) with updated linear models. In the original article, the plotted data represented the means of eight replicates. Linear models were independently generated. The first phase of the kill curve represents a rapid inactivation of −4 logs over the course of only 2 min. The second phase of the kill curve exhibits a much slower inactivation rate that decreased an additional −2 logs between 2 and 30 min of UV exposure. The precise inflection point (or elbow) between the first and second phases occurred at −4.196 logs (y-axis) and 1.09 min (x-axis). UV, ultraviolet.
Linear models for Figs. 1, 2, and 4 were independently generated with either SigmaPlot (v13.0) or Microsoft Excel for Mac 2011 (v.14.7.3) graphing subroutines. Statistics were conducted with the PC-based Statistical Analysis System (SAS) version 9.2 (SAS Institute, Inc., Cary, NC). Data for Figs. 1, 2, and 4 were log10-transformed and analyzed by linear regression using the SAS subroutine PROC REG. All linear models for Figs. 1, 2, and 4 exhibited significant p-values (p ≤ 0.05). Data for Fig. 3 were log10-transformed and subjected to an analysis of variance and a protected least-squares mean separation test (PROC GLM; p ≤ 0.05).
Untransformed and original data sets for Figs. 1–4 are presented in Supplementary Tables S1–S4, respectively, with annotations (Supplementary Data are available online at

Bioburden reductions for the strongest biocidal factors on external surfaces. The top panel shows the reduction due to temperature and vacuum acting together, the middle panel shows UVC and UVB irradiation acting on a flat level surface. The bottom panel combines all factors. The color indicates the instantaneous reduction rate expressed in logs per lunation, in which larger values indicate the greatest bioburden reductions. The smaller panels at right integrate the values in the left panels over the entire lunation. The primary phase of UV irradiation on survival is represented by the faint-blue vertical bar at sunrise (i.e., 0.25 fractional lunations). The combination of temperature, vacuum, and UV generates at least −10 log reductions in spacecraft bioburdens in less than a single lunation for latitudes equator ward of 89.8°.

The LMS model applied to all lunar landings from the moment of touchdown to January 01, 2019. The upper left panel shows the bioburden at landing per spacecraft. Subsidiary panels show the loading on external surfaces (upper right), internal surfaces in thermal contact with the exterior (lower left), and deep insulated interior surfaces (lower right) over time. As of January 01, 2019, the exterior surfaces of all landed spacecraft are currently sterile, whereas some spores remain in the deep interiors of more recently landed spacecraft, particularly at polar latitudes. LMS, Lunar Microbial Survival.
3. Results
3.1. Estimated bioburdens on launched spacecraft to the Moon
Since September 14, 1959, 54 lunar missions have delivered 77 spacecraft, boosters, payloads, rovers, and other structures to the surface of the Moon. Using a 16-factor model, we estimate the probable viable bioburdens on all spacecraft components that have reached the lunar surface. Overall, 4.57 × 10¹⁰ viable microorganisms are likely to have been landed or crashed on the lunar surface (Table 1). The average microbial bioburden per individual spacecraft was estimated to be 5.47 × 10⁸ viable vegetative cells and spores per spacecraft. Dividing the average spacecraft bioburden (5.47 × 10⁸ cells/spores) by the average dry mass (2375 kg) of the spacecraft and structures landed or crashed on the Moon yields an estimate of 2.30 × 10⁵ viable cells/spores per kg. The highest estimated bioburden was predicted for the Apollo 14 LM descent stage at 1.0 × 10¹⁰ spores/cells at lunar contact. A number of lunar landers and other Apollo LM descent stages were also predicted to have >1.0 × 10⁹ spores/cells at lunar contact.
Although the human occupied LM ascent stages initially had significantly higher bioburdens within the crewed habitats compared to other spacecraft components (Table 2, column 9), all LM ascent stages were crashed into the lunar surface after serving to return the astronauts to the Apollo Command Modules in lunar orbit. Based on the LMS model assumption A15 that a bioburden reduction of −4 logs was achieved by impact compressional forces, the average total probable bioburden per crashed LM ascent stage was estimated to be 7.57 × 10⁶ surviving cells/spores at lunar impact.
3.2. Pressure effects on microbial survival
A biocidal kill curve for B. subtilis spores exposed to vacuum (<10−4 Pa) from <1 day (e.g., 90 min) (Bücker et al., 1974) to almost 6 years (e.g., 2107 days) on the LDEF (Horneck et al., 1994) in LEO yields a biphasic kill curve in which a rapid decrease (∼70%) can be observed for the first 94 days followed by a much slower kill rate out to 2107 days (99%; −2 logs) (Fig. 1). Although temporal kill kinetics are in general lacking for nonspore-forming species under simulated or actual spaceflight conditions, a few studies have demonstrated that nonspore-forming species are significantly more sensitive to the biocidal effects of space conditions (e.g., Hagen et al., 1971; Koike, 1993; Koike and Oshima, 1993; Horneck et al., 2010). Based on these few studies, we assume here that nonspore-forming bacteria will be inactivated at a rate of ∼10 × faster than the kill kinetics for B. subtilis spores.
3.3. Long-term exposure of B. subtilis spores to high temperatures
Thermal infrared photons in solar irradiation can raise the temperatures of external spacecraft surfaces to >100°C during each lunation (Table 3). For example, thermocouples on Surveyors I, III, and V recorded temperatures >100°C for 4–5 days per lunation (Lucas et al., 1966, 1967a, 1967b), with the highest spacecraft surface temperature recorded at 140°C for the Surveyor V planar array antenna (Lucas et al., 1967b). Furthermore, through conduction and radiant heat transfer, many internal components of landed equipment or spacecraft will reach between 70°C and 90°C during each lunar cycle. Table 1 demonstrates that spacecraft on the lunar surface have experienced between 57 and 737 lunations since landing or crashing on the surface (based on dates estimated from landing to January 1, 2019). Although no estimates on thermal inertia or thermal conductivity within spacecraft structures on the Moon were found in the literature, we assume here that ∼50% of all internal components of lunar spacecraft are likely to achieve temperatures that exceed 70°C during the lunar day, and that perhaps as much as 25% of all spacecraft internal components may exceed 100°C.
The thermal inactivation models of Dillon et al. (1973) predict thermal inactivation of all external surfaces of lunar spacecraft between 9 and 12 months after landing. To validate the thermal inactivation models of Dillon et al. (1973), and extend the models to lower temperatures, a series of laboratory experiments were conducted to test the survival of the high-temperature-resistant spores of B. subtilis (Hagen et al., 1971; Horneck et al., 1984) at elevated temperatures between 70°C and 100°C. Results indicate that at 100°C, as little as 2 Earth days were required to reduce the viability of B. subtilis spores by −6 logs (i.e., below the detection limit of the assay) (Fig. 2). At 90°C, between 4 and 7 days were required to induce a decline of −6 logs in the number of viable spores recovered from coupons. At lower temperatures of 70°C or 80°C, the populations of B. subtilis spores decreased between −4 and −3 logs, for 14 and 56 days, respectively. Although the 70°C or 80°C assays were not continued to extinction due to logistical constraints of the experiments (e.g., time and resources), we assume the cells would have continued to lose viability with longer incubation times at the same rates as shown in Fig. 2. The extrapolation of thermal decay curves for microorganisms to time steps beyond the available empirical data, as used here, is consistent with other literature on thermal inactivation rates of Bacillus spp. under diverse humidity and high-temperature regimes (e.g., Nicholson, 2003; Schubert and Beaudet, 2011).
3.4. Interactive effects of low pressure and high temperature
Although temperatures >90°C are likely to inactivate greater than −6 logs of Bacillus spores per lunation (Fig. 2), most spacecraft and deployed equipment are vented to the vacuum of space, and thus, cis-lunar vacuum will likely interact with temperatures >70°C to induce significant bioburden reductions within internal surfaces. A series of short-term assays were conducted to determine whether the interactive effects of low pressure (<3 × 10⁻⁴ Pa) and high temperature (100°C) would increase the lethality of the simulated lunar surface. When spores were incubated for 8 h at 25°C and 101.3 kPa in the laboratory (control), ∼3.0 × 10⁶ spores per coupons were recovered (Fig. 3). When spores were incubated for 8 h under low pressure only or high temperature only conditions, survival was reduced by −0.5 and −1 logs, respectively. In contrast, when spores of B. subtilis were incubated for 8 h under the combined conditions of low pressure (<10−4 Pa) and 100°C, no viable cells were recovered from the aluminum coupons (i.e., greater than −6 logs of spores were killed by the combined treatments). Thus, the synergistic effects of low pressure and high temperature resulted in at least −6 logs of increased lethality on the deposited spores. During the course of each lunation, the shallow internal and external temperatures of Sun-exposed compartments will likely be >100°C for 1–6.5 days (Table 3).
3.5. Solar UV irradiation effects on microbial survival
Figure 4 reanalyzed a subset of the data from a previous study on the effects of UV irradiation on the survival of seven Bacillus spp. For simplicity sake, and to be aligned with the data shown in Figs. 1–3, we use only the kill curve for B. subtilis HA101 (adapted from Schuerger et al., 2006). The kill curve is split into a biphasic model in which the first phase shows a rapid decrease of −4 logs of inactivated spores over a period of 2 min, followed by a much slower degradation rate of the second phase that required 30 min to achieve a bioburden reduction greater than −6 logs per coupon (Fig. 4). The transition (i.e., spline point) between the two linear phases shown in Fig. 4 is located at log10 (y) = −4.196 and (x) = 1.09 min. The UVC+UVB flux that killed >1010 spores of B. subtilis was estimated to be 57.9 kJ/m2 by Schuerger et al. (2006), which is delivered to the equatorial lunar surface in 36 min at local noon (Table 2).
3.6. Ionizing radiation effects on microbial survival
In scenarios in which microorganisms are not shielded, SWPs will reduce efficiently the amount of spores with an LD rate of ∼100 days to achieve survival of −10 logs (Table 2). In contrast, due to the very low energies of the SWPs, there will be no effect below a depth of ≥300 μm of shielding material, and the contribution of SPEs becomes dominant. Calculations for the annual mean dose behind a shielding depth of ∼3.7 mm aluminum (which equals the mean shielding depth of an astronaut EVA suit) show dose values ∼3 Gy per year from SPEs and, thus, >1600 years are needed to approach a survival of −10 logs. SPEs, therefore, cause no significant reduction of microorganisms. The annual absorbed dose delivered by GCRs is ∼0.1 Gy, and thus >1.5 × 10⁴ years are needed to reach the required level of −10 logs. GCR particles, therefore, contribute very little to the inactivation of spores in terms of absorbed dose over realistic time scales.
Taking into consideration inactivation studies of B. subtilis spores hit by a single HZE particle, bacterial spores are faced with a much higher inactivation probability. Applying the measured inactivation cross sections of 5.24 μm2 observed in the Biostack spaceflight, HZE particles might cause an inactivation of −10 logs after ∼180 years (Reitz et al., 1995, Horneck et al., 1989; Reitz, 2008) (Table 2). In contrast, when using inactivation cross sections measured in accelerator experiments of only 1.41 μm2, a survival rate of −10 logs is achieved after >2600 years.
The only significant LD induced by ionizing radiation was observed for routine SWPs impinging on external spacecraft surfaces. In Table 2, we modeled that only −3 log reductions would be possible for SWPs on external surfaces of spacecraft per lunation. The other types of ionizing radiation are expected to have minimal effects (e.g., −0.0045 logs per lunation for HZE particles), or no adverse effects per lunation for SPEs, SCRs, GCRs, or secondary particle fluence rates.
3.7. LMS model
The LMS model combines together all the deleterious effects described in Figs. 1–4 and Table 2 to predict the number of viable microbial spores and vegetative cells on spacecraft surfaces at any time after landing on the Moon's surface. In this way, the LMS model is useful not only to describe the bioburden present on past spacecraft but may also be used to assess the time required for bioburdens to be deactivated on future spacecraft, not yet flown. The text that follows will detail how each deleterious effect is considered mathematically, and how together each of these effects builds up the overall LMS model.
To capture the protective properties of spacecraft hardware, the LMS model divides the bioburden residing on spacecraft into three categories: (1) spores residing on the exterior surfaces of spacecraft that are subject to the greatest variations in temperature, solar UV, SWPs, and all other effects without shielding; (2) spores residing on the shallow interior of spacecraft but that are in thermal contact with the spacecraft exterior surfaces; and (3) spores residing deep within the spacecraft and thermally insulated from the spacecraft exterior surfaces heated directly by solar irradiation. Thus, spores in the second category are considered shielded from all deleterious effects except for vacuum and heat, whereas those in the third category are subject only to the long-term effects of cis-lunar vacuum. To provide upper bounds on survivability, the code makes the assumption when considering each category that the entire bioburden described in Table 1 (5.47 × 10⁸ spores/cells per spacecraft) can be found within that category.
3.7.1. Isolated effects of UV light
Both UVC and UVB photons are considered as the key biocidal irradiation bands on the Moon's surface with the flux of such light at 1 astronomical unit (AU) estimated as 26.8 W/m2 (Schuerger et al., 2003, 2006). The amount of UVB+UVC striking the surface of any point on the Moon with latitude φ and longitude θ at any time during a lunation may then be calculated by computing the solar direction vector,

where S is the instantaneous flux at a location on the Moon in W/m2. The 1.54° offset of the rotational axis of the Moon and its net orbital plane around the Sun (Siegler et al., 2011) are small enough to be ignored.
To convert the instantaneous flux into a reduction in the bioburden, the biphasic response of B. subtilis HA101 to solar UV irradiation (Schuerger et al., 2006) was used (Fig. 4). In this formulation, the ordinate axis was converted from time to received insolation by dividing the exponent numerators by the UVC + UVB flux rate reported by Schuerger et al. (2006) (i.e., 590 J m-2 min-1 to achieve −3.374 log reductions after 1 min); however, the elapsed time, Δt, is expressed in seconds:
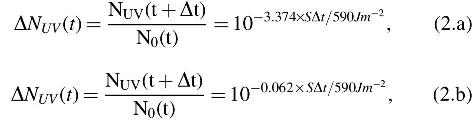
where Eq. 2.a provides the primary phase of the response and Eq. 2.b provides the secondary phase. Given Eqs. 2.a and 2.b, ΔNUV is the fractional reduction at time t over time Δt from a starting bioburden of N0 at time t. Note that since we only need the relative reduction in this formulation, the intercepts of the linear models of Schuerger et al. (2006) are neglected. Initially, the primary phase equation was used when the total cumulative reduction in bioburden due to UV reached 6.37 × 10⁻⁵; the LMS model switches to the secondary phase that is then used until the end of the simulation.
3.7.2. Isolated effects of temperature
Next, the survival of B. subtilis HA101 strain was modeled at a standard laboratory pressure of 101.3 kPa and changing temperature. Examining the data shown in Fig. 2 shows that the reduction curves can be treated as the result of an Arrhenius process to a high degree of confidence (R2 = 0.999), in which
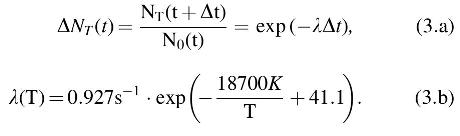
Note that for Eqs. 3.a and 3.b, Δt was calculated in terms of seconds and that here we use the natural logarithm, as is the convention in the chemical literature. Analogous to the analysis for UV irradiation, ΔNT is the fractional reduction over the period Δt from N0 viable spores remaining at time t. The temperatures used in the LMS model are based on a simple analytical model of the Moon described in the study of Moores (2016) and based upon the study of Vasavada et al. (2012). In contrast to the UV reduction curve, the high temperature curve has a monophasic response. Furthermore, given that this process was described well by a chemical rate formulation, it is strongly suggestive that high temperature acts to degrade a specific chemical compound within the cells.
3.7.3. Isolated effects of high vacuum
Not all spores within a spacecraft will be subject to UV, high temperature, or ionizing radiation, and thus, for the most protected spores, high vacuum alone is the most deleterious effect. By using the long-timescale data shown in Fig. 1, the data follow a biphasic response, with a change in behavior noted at ∼94 days of exposure:
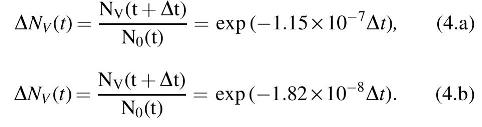
Note that for Eqs. 4.a and 4.b, Δt was calculated in terms of seconds. The experiments that form the basis for Eqs. 4.a and 4.b were conducted at a variety of temperatures, but yet conform well to the biphasic model. The likely reason for this is that at room temperature and below (≤25°C), the synergy between temperature and vacuum ceases to be important. For instance, at 0°C (273 K), the synergistic rate constant derived from Eq. 5.b was two orders of magnitude larger than the rate constant derived from Eq. 4.b for the second phase of the vacuum only plot (Fig. 1). Average day/night overall temperatures at the Moon's equator are rarely more than −27°C (246 K); therefore, for deep internal surfaces, the biocidal effects of vacuum only are the most important bioburden reduction mechanism.
3.7.4. Synergistic effects of high temperature and vacuum
As demonstrated by Fig. 3 and Table 2, reductions in bioburdens occur considerably faster for simultaneous interactions of high temperature and low pressure than when either factor acts alone. Furthermore, the combined reduction observed in Fig. 3 is greater than what would be predicted by a simple multiplication of Eqs. 3.b and 4.a. This suggests that there was a synergistic effect between temperature and vacuum that must be modeled.
Given the results of temperature alone (Eqs. 3.a and 3.b), it seems reasonable to approximate the interaction between high temperature and vacuum by using an analogous Arrhenius process. Thus, using the data from Fig. 3, we derive

Note that for Eqs. 5.a and 5.b, and analogously Eqs. 3.a and 3.b, Δt is calculated in terms of seconds and that here we use the natural logarithm, as is the convention in the chemical literature. The net effect of adding in high vacuum is to substantially reduce the energy barrier, leading to greater bioburden reductions at lower temperatures.
3.7.5. SWPs and HZE particles
SWPs and HZE particles can be significant for exposed surfaces on the Moon. The reduction per lunation can be up to −3 logs for SWPs, or as low as −0.0045 logs for HZE particles under 5.24 μm2 of shielding (Table 2). The ionizing radiation biocidal effects of SPEs, SCRs, and GCRs were found to be negligible, and thus, no adverse effects were assumed (Table 2). This leaves only the effects of SWPs as the major contributor. Using the data of Moeller et al. (2007, 2010), we calculated the deleterious effect of SWPs, as adjusted by the projected area of interaction with the solar wind (
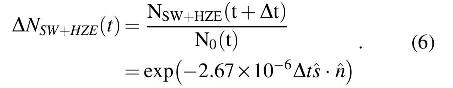
Note that the direction of the instantaneous solar wind vector is typically significantly different from the solar vector described in Eq. 1 and varies temporally. However, both lie within the ecliptic plane and, when integrated over a full lunation, the same result was obtained with Eq. 6 for any vector in the ecliptic plane. As such, and for simplicity, the solar vector was also used in Eq. 6.
3.7.6. LMS model predictions
To quantify the reductions over timescales less than a single lunation, the lunar day was divided into 1024 equally divided time steps, each 2491.6 s in length. At each time step, reductions were applied for each relevant factor for each population of spores. Each effect was assumed independent of the others such that all of the relevant effects were multiplied together:
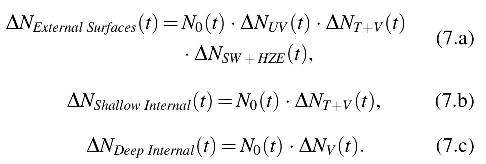
For those parameters that exhibit biphasic behavior,
For Eqs. 7.a and 7.b, there was a latitude dependence and a dependence on the time of day. Figure 5 shows the instantaneous reduction rates in log10 reductions per lunation (labeled as log reductions). The integrated reductions over the first lunation are shown at the right of each plot. The most rapid reductions are obtained from high UVC+UVB flux near the lunar equator (Fig. 5; middle panel) at local noon. However, the reduction falls off quickly away from the subsolar point (i.e., the location on the Moon where the Sun angle is directly overhead) due to the nonlinear UV dependence on solar zenith angle.
The middle panel in Fig. 5 also includes the biphasic nature of the reduction due to UV irradiation. As the Sun rises on the Moon (identifiable as the faint blue vertical “bar” of increased bioburden reduction at left in Fig. 5, middle and bottom panels), the first phase of the response rapidly reduces the bioburden until the fraction of viable spores remaining reach the threshold for the second phase (from Fig. 4 and Eq. 2.b). In the second phase, the greatest reductions are observed at the subsolar point, falling off more gradually than the temperature response.
When both factors are combined, it becomes apparent that reductions of at least −10 logs per lunation are observed within 89.8° of the equator. Poleward of 89.8° of latitude, the reduction factors decrease slowly to approximately −4 logs at the poles per lunation, corresponding to the primary phase of the UV reduction curve.
The LMS model can be applied to the spacecraft described in Table 1 to examine microbial survival at existing landing sites. The physical locations and predicted bioburdens of each spacecraft landed or crashed on the lunar surface are shown in Fig. 6, upper left panel. Next the LMS model is applied to spacecraft spore/cell densities, and the total current (as of January 1, 2019) predicted bioburdens on external surfaces (Fig. 6; upper right), shallow internal surfaces in thermal contact with the exterior of spacecraft (Fig. 6; lower left), and on deep internal surfaces (Fig. 6; lower right) are obtained.
For all spacecraft currently on the lunar surface, the external surfaces are likely to have been sterilized (less than −10 logs surviving spores or vegetative cells) between the landing or impact dates and January 1, 2019 (Fig. 6). The analyses of internal surfaces show that for surfaces that are in thermal contact with the exterior, a small number of spores may remain at polar sites. When considering deep interior locations, a few equatorial sites are also seen to have nonsterilized interiors that represent the most recent landings on the Moon as the vacuum sterilization rate is independent of latitude and depends only on how much time a spacecraft has spent on the surface.
Furthermore, the LMS model was used to estimate the number of log10 reductions in spacecraft bioburdens per lunation for B. subtilis spores (Table 2). A LD for any specific bioburden will be equivalent to a bioburden reduction of −10 logs from any given starting population. In Table 2, the highest number of bioburden reductions per lunation was found to be −2290 logs at the equator decreasing to −1163 logs at ± 60° latitude. For spacecraft the landed or crashed on the Moon, the effects of high temperature and vacuum would be initially −188 logs at the equator diminishing to only −16 logs per lunation at ±60° latitude. The log10 reduction for temperature-only per lunation at the equator was −97. Vacuum-only had a minor effect on bacterial survival per lunation, delivering perhaps no more than about a −0.02 logs of the spacecraft bioburden per lunation. A surprising result was the generally low biocidal effects on microorganisms per lunation observed for the radiation parameters SWPs, SPEs, SCRs, GCRs, HZE particles, and secondary particles. Of these radiation parameters, the highest LD per lunation was observed for SWPs; but even here they were only −3 log reductions per lunation at the equator.
However, it is the accumulation of multiples of LDs (LD ≥1010 spores/cells killed) over many lunations for multiple biocidal factors that quickly sums to very high inactivation rates for microbial bioburdens on landed or crashed spacecraft on the Moon. The overall LMS model predicted an upper bound of −2479 logs per lunation at the equator for all factors impacting external surfaces of spacecraft (Table 2). Lower log10 reductions are given in Table 2 for higher latitudes and internal components of spacecraft.
Although the LMS predictions in Table 2 only extend to ±60° latitude, the bioburden reduction at the poles was predicted as −10 logs per lunation at 89.8° for all factors modeled for external surfaces of spacecraft (Fig. 5). The LMS model also predicted that over the course of one Earth year (12.4 lunations), the total accumulated bioburden reduction for external surfaces of spacecraft landed at the equator would approach −3.1 × 10⁴ logs.
4. Discussion
4.1. LMS predictions for current landed or crashed spacecraft on the Moon
A LMS model was developed that can be used to predict spacecraft bioburdens at landing, and to estimate inactivation rates for combinations of four biocidal factors present on the lunar surface. The primary reasons for developing the LMS model were to predict whether previously landed spacecraft might harbor viable bioburdens over time and identify for Earth return the most promising landed or crashed spacecraft hardware for future human missions. In addition, the LMS model can be applied to a diversity of lunar astrobiology studies (see Gronstal et al., 2007; Crawford et al., 2012) including research on microbial survival of landed or crashed spacecraft, field testing planetary protection strategies for mitigating the presence of microbial bioloads on interplanetary spacecraft, and technology development to advance the human exploration of the Moon and Mars.
The LMS model was based on predicting the spacecraft total probable bioburdens at lunar contact, and then estimating the inactivation rates of bacteria by UV irradiation, vacuum, high temperature, and ionizing radiation on the lunar surface. Spacecraft bioburdens at launch (Table 1) were estimated by using published data for a significant number of lunar missions up to 1971 (column 7; Dillon et al., 1973), followed by reasonable extrapolations of later missions based on assumptions A1 to A11. The data were scaled upward by two orders of magnitude to include (1) nonculturable bacterial species, (2) the likely presence of low numbers of fungi, archaea, actinomycete, and other extremophile species on spacecraft (see the literature in assumption A12, and Stieglmeier et al., 2009; Ghosh et al., 2010), and (3) microbial communities associated with humans in Apollo LM ascent stages (assumption A13). The LMS model predicted the total viable bioburden at lunar contact of 4.57 × 10¹⁰ propagules for all spacecraft, and the average per vehicle bioburden of 5.47 × 10⁸ spores/cells (Table 1).
The LMS biocidal inactivation rates for vacuum, UV irradiation, high temperature, and ionizing radiation were focused solely on the kill kinetics for Bacillus spp. because of inadequate data on nonspore-forming bacteria and fungi in space. However, because Bacillus spores are significantly more resistant than nonspore-forming species to many of the conditions found in interplanetary space (see Horneck et al., 2010), we assume that the inactivation of Bacillus spores will be significantly slower than for all other microorganisms present on spacecraft. Thus, if B. subtilis spores are killed at the rate of −10 logs per biocidal factor (the LD dose used here) for any given time step, then all other nonspore-forming species are assumed to be killed. For example, the nonspore-forming bacteria, Micrococcus sp. and Staphylococcus epidermidis, exhibited significantly lower survival rates of −1 and −2 logs, respectively, compared with only −0.25 logs for B. subtilis var. niger spores when exposed to ultrahigh vacuum close to 10−8 Pa at 60°C (Hagen et al., 1971).
The slowest inactivation rate for spacecraft microorganisms was found to be due to the effects of high vacuum (down 10−8 Pa; see literature cited in Fig. 1) yielding −0.02 logs per lunation, or −0.247 logs per year and −2.47 logs per decade. The LMS model also assumes that all surfaces on and within the landed spacecraft are exposed to the cis-lunar vacuum, with the exception of sealed tanks and tubing for cryogenic fluids. Thus, even if microorganisms are deeply embedded within landed or crashed vehicles, survival of microorganisms will be negatively affected by low pressure alone. Interestingly, the data from the cited articles in Fig. 1 were closely aligned with the linear models (i.e., low scatter), and the data were derived from multiple strains of B. subtilis in experiments that extended over a wide range of low pressures (10−4 to 10−8 Pa) in assays that were conducted in terrestrial laboratories, LEO, and cis-lunar space.
Both UV irradiation and high temperature alone were predicted to contribute aggressive kill rates for microorganisms on external surfaces with up to −2290 logs or −97 logs of inactivation, respectively, at equatorial latitudes. As the latitudes increased, the corresponding effects would be reduced (Table 2). The most aggressive kill rates were predicted for UV irradiation on external surfaces. Next, synergistic interactions of high temperature and high vacuum in which both external and shallow internal surfaces of spacecraft would be expected to see up to −188, −116, or −16 log reductions for latitudes at 0°, ± 30°, or ±60°, respectively. Only a few articles were found in the literature that tested the interactive effects of temperatures <100°C and pressures close to cis-lunar vacuum (≤10−8 Pa). For example, using both spore-forming (B. subtilis var. niger) and nonspore-forming (Micrococcus sp. and S. epidermidis) bacteria, Hagen et al. (1971) demonstrated that simultaneously increasing temperatures from 25°C to 60°C in a high vacuum environment of 10−8 Pa resulted in increased inactivation of the simulated space environment for all three bacteria. The smallest reduction in surviving spores was observed for B. subtilis (−0.25 logs), but also nonspore-forming species exhibited −1 to −2 log reductions over the same temperature range.
Although only the synergistic effects of temperatures at 100°C and low pressures at 10−4 Pa were tested here, other literature (Horneck, et al., 1984, 1995; Dose and Klein, 1996; Nicholson et al., 2000) indicates that the interactions of UV+vacuum can increase the lethality of the space environment by upward of two additional orders of magnitude. In short, the current LMS model is likely underestimating the lethality of the space environment for microbial spores/cells on spacecraft surfaces due to the periodic occurrence of temperatures >100°C on spacecraft hardware (e.g., Surveyor III compartments periodically reached 140°C during the lunar day) (Table 3; Lucas et al., 1967a), by interactive effects of vacuum and lower temperatures than tested here, and by the interactive effects of UV+vacuum.
When considering the effects of various types of ionizing radiation on microbial survival on the Moon, only SWPs were found to contribute any significant biocidal effect (Table 2). However, even for SWPs, the inactivation rate was only −3 logs per lunation, and for only the external surfaces of the spacecraft. Microbial survival rates on all internal surfaces, whether shallow or deeply embedded within the spacecraft, were found to be relatively unaffected by all forms of ionizing radiation so as to be regarded here as negligible in the LMS model. This finding is based on the high dose rates reported in the literature for B. subtilis that approached 3 kGy for a −6.0 log reduction (e.g., Moeller et al., 2007, 2010), and that were extrapolated here to 5 kGy for −10 logs (based on 450 Gy per −1.0 logs inactivation) (Moeller et al., 2007, 2010).
The LMS model overall predicts that most spacecraft listed in Table 1 would be expected to have zero viable bacteria as of January 1, 2019 (Fig. 6), except for spacecraft landed in polar regions and within the past 13 years. Table 4 presents the results of two LMS model runs for the last 10 landed or crashed spacecraft on the Moon for January 1, 2019 and January 1, 2030. All 10 of these spacecraft are likely to still harbor low numbers of viable bacteria as of January 1, 2019. However, LMS predictions for 2030 indicate that only the Chang'e/Yutu lander is likely to retain any significant numbers of viable bacteria, and only on deeply embedded surfaces.
The Lunar Microbial Survival Model Was Used to Predict the Surviving Bioburdens on Deep Internal Surfaces of the 10 Most Recent Spacecraft Landed on the Moon
Landed bioburdens are given in Table 1 for the spacecraft already listed.
The only other microbial survival model found in the literature for microorganisms on lunar spacecraft was advanced by Dillon et al. in 1973 (henceforth the Dillon model). The LMS model predicts overall significantly longer survival times than the Dillon model for microorganism on deeply embedded spacecraft surfaces on the Moon because the Dillon model only considered the effects of thermal inactivation kinetics extrapolated to all spacecraft surfaces, which we have shown to only be persistent on external and shallow internal surfaces. The Dillon model predicted that all microorganisms would be killed within 7–8 months. In contrast, the LMS model separates thermal effects into external surfaces, shallow internal surfaces, and deeply embedded internal surfaces, and includes four biocidal factors in the model (i.e., UV irradiation, high temperature, vacuum, heat+vacuum, and ionizing radiation) instead of only just thermal effects. If we compare the inactivation of microorganisms between the Dillon and LMS models for external surfaces only, the LMS model predicts up to a −97 log reduction for one lunation (14.77 days for daylight hours) on spacecraft near the equator (Table 2), which is substantially faster than the 7–8 months in the Dillon model. The LMS model updates and refines the earlier Dillon et al. (1973) predictions by using four biocidal factors on the Moon instead of just thermal inactivation, and by considering external and internal surfaces separately. Thus, the LMS model predicts much faster inactivation of microorganisms on external surfaces and much slower death rates for internal surfaces than the Dillon model.
And finally, based on the definition that a −10 log reduction in viable bioburden equals a LD on the Moon, the LMS model predicts extremely high numbers of accumulated LD rates over the course of a given surface mission. For example, the overall LMS model for all spacecraft surfaces near the equator is −2479 logs per lunation. Such an inactivation rate equals an accumulation of 248 LDs per lunation, or as many as 1.82 × 10⁵ accumulated LDs for external surfaces on the Luna 2 impactor since September 14, 1959, the first spacecraft to make lunar contact (Table 1). Such high levels of microbial lethality on spacecraft surfaces all but preclude that most microorganisms on spacecraft will survive only very short periods of time on the Moon. Only deeply embedded internal surfaces offer adequate protection from thermal cycling, UV irradiation, and ionizing radiation on the Moon.
4.2. Validation of LMS model: the case of S. mitis and Surveyor III
During the Apollo 12 mission, astronauts Pete Conrad and Alan Bean landed the LM Intrepid within 500 m of the Surveyor III spacecraft that was present on the Moon for 942 days (31.9 lunations) from April 20, 1967, to November 20, 1969 (Nickle, 1971). During the surface EVA, the astronauts visited the Surveyor III spacecraft (Fig. 7A) and recovered ∼10 kg of components for return to Earth. The equipment was inserted into a nonsterile “beta-cloth bag” composed of “… a woven quartz-glass fabric covered with FEP Teflon …” on the lunar surface and kept in the beta-cloth bag until the samples arrived at the crew reception area (CRA) at the Lunar Receiving Laboratory (LRL) in Houston, TX (Nickle, 1971). It was at the CRA that the Surveyor III parts were then catalogued, photographed, and heat sealed in polyethylene bags until processed. Of the equipment returned to Earth, the TV camera (manufactured by Hughes Aircraft Company; HAC) and the electrical cables were assayed at the Manned Space Center, Houston, TX (renamed the Johnson Space Center in 1973) for microorganisms that may have survived 2.5 years on the lunar surface. The camera weighed 7.95 kg (Hughes Aircraft Company, 1970), and the cables are estimated here to be <0.25 kg based on the descriptions of the returned equipment by Nickle (1971).
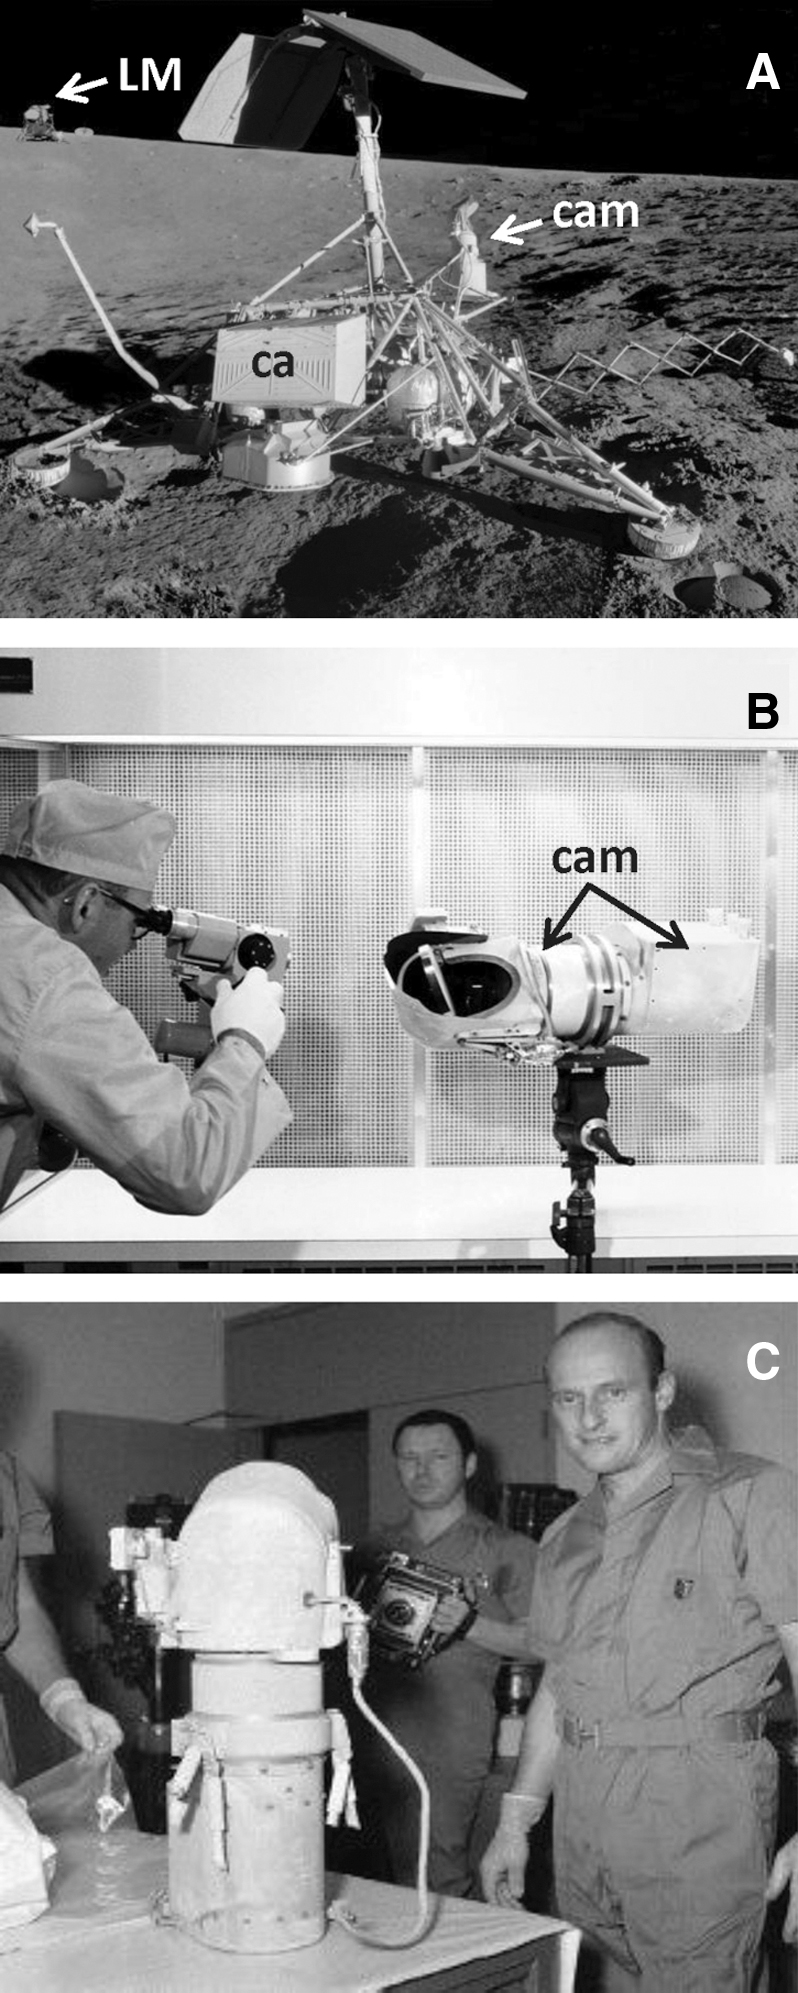
The Surveyor III camera (cam) was recovered by the Apollo 12 astronauts during a surface EVA in November 1969 and returned to Earth for analysis.
Mitchell and Ellis (1971) reported that a single pure culture of Streptomyces mitis was recovered from circuit board foam insulation that was deeply embedded within the camera body (Fig. 7B). The study used multiple replicates per each of three liquid media for the assays of samples from 33 locations on the external shroud (2 samples) and internal components (29 samples) of the camera. The materials tested (e.g., circuit boards, nylon ties, electrical wiring, and insulation foam) were either swiped with cotton swabs and the swab tips submerged in liquid culture medium, or materials were removed and placed directly into the enrichment medium. Of the 33 areas tested, only a single pure culture of S. mitis in one replicate for sample location 32 (foam insulation) was recovered. A similar set of 86 enrichment assays in which sections of electrical cables (e.g., nylon ties, insulation, wire, and teflon sleeving) were cut into short sections and submerged into multiple replicates per each of two separate liquid media yielded zero recovered microorganisms (Knittel et al. (1971). Although there were no prelaunch microbial assays conducted of the Surveyor III camera and cabling, an identical backup TV camera, designated the Type Approval Test (TAT) camera by HAC (Mitchell and Ellis, 1971), was assayed. The TAT camera was stored “… undisturbed in … bonded storage …” (Mitchell and Ellis, 1971) from before the launch of Surveyor III in April 1967 until the flight camera was processed for microorganisms in late 1969. The TAT camera served as a proxy for an Earth-based control and yielded strains of a Bacillus sp., several Aereobasidum spp., and Aspergillus pulvanis from internal electrical cabling.
The recovery of S. mitis from Surveyor III was reported by Mitchell and Ellis (1971) as the first known isolation of an Earth bacterium that had survived 2.5 years on the Moon. However, Rummel and colleagues (Glavin et al., 2004; Rummel, 2004; Rummel et al., 2011) have suggested that the isolate of S. mitis was likely a laboratory contaminant introduced into the assays during nonaseptic handling of the camera. For example, the camera was kept outside of laminar flow hoods for initial processing (Fig. 7B, C), including placing the camera on a desk in a generic laboratory with an open door clearly seen in the background (Fig. 7C). The laboratory appears to lack an active air filtration system, and the personnel appear in non-cleanroom garments.
Can the LMS model be used to support or reject the claim by Mitchell and Ellis (1971) that S. mitis survived 2.5 years on the Moon? First, if the launched culturable bioburden of Surveyor III was 1.97 × 10⁶ spores/cells (Dillon et al., 1973), the Surveyor III spacecraft weighed 296 kg at landing (dry mass) (Table 1), and the camera weighed 7.95 kg (Hughes Aircraft Company, 1970), then it follows that the landed culturable microbial bioburden for the TV camera alone would be ∼5.29 × 10⁴ spores/cells [i.e., ((1.97 × 10⁶)/296 kg) × 7.95 kg]. Second, although an hourly record of the internal temperatures of the TV camera is not available, the internal maximum temperature for the Surveyor III camera was estimated to be 70°C for lunar daylight hours per lunation (Mitchell and Ellis, 1971). Based on the temperature profiles of other spacecraft compartments on Surveyor III (e.g., Lucas et al., 1967a), maxima temperatures for any measured compartment were stable at the maximum temperatures for about one-third of the daylight hours per lunation.
Assuming that the internal components of the TV camera were close to 70°C for 33% of each lunar day per lunation, then the data shown in Fig. 2, (70°C), and Eqs. 3a and 3b, would predict that a population of spores of 5.29 × 10⁴ would be inactivated (<1 viable spore) after 10.4 lunations based exclusively on the biocidal effects of high temperatures at 70°C over time. Furthermore, if the full LMS model is applied to the same question, we estimate that a −188 log reduction would be expected for the shallow internal surfaces of the camera per lunation. Both answers are very much equal to a predicted level of zero surviving spores in the Surveyor III camera for the 2.5 years between landing and recovery.
Although we have not tested the interactive biocidal effects of vacuum (<10−4 Pa) and 70°C, we believe the enhanced lethality of low pressure and high temperature shown for 10−4 Pa and 100°C (Fig. 3) likely would hold for increasing the lethality of cis-lunar vacuum at 70°C. In addition, the electrical cabling assayed for culturable microorganisms (Knittel et al., 1971) would have been expected to contain ∼1.66 × 10³ culturable microorganisms at launch, and of these materials, the postmission assays yielded no recovered viable microbial spores or cells after 2.5 years.
The LMS model does not support the claim that the nonspore-forming bacterium, S. mitis, survived on the Moon for 2.5 years. The only plausible manner for S. mitis to survive for the 942 days on the lunar surface would be for the insulation foam to have been at significantly lower temperatures than 70°C encountered during each lunation. The LMS model also predicts that culturable bacteria should not be recoverable from the electrical cabling, as was described by Knittel et al. (1971). Based on the findings that viable bacteria and fungi were recovered from the ground control TAT camera (Mitchell and Ellis, 1971), only one out of several hundred enrichment assays was positive for any Earth microorganisms (Knittel et al., 1971; Mitchell and Ellis, 1971), we conclude that the lethality of the lunar surface is confirmed, and that the LMS model predicts the extremely low recovery rates of the microorganisms from the Surveyor III camera. We agree with Rummel and coworkers (Glavin et al., 2004; Rummel, 2004; Rummel et al., 2011) that the most likely explanation of the presence of S. mitis in the single positive culture tube from the assayed Surveyor III equipment was through contamination during the postlanding processing of the camera.
4.3. Introducing the terms lethal dose rate and functional sterilization
The LD rates for the four biocidal factors in the LMS model were based on new data presented here (i.e., high temperature alone [Fig. 2] and temperature+vacuum [Fig. 3]), or from the literature (i.e., vacuum alone [Fig. 1], UV irradiation [Fig. 4], and ionizing radiation [Table 2]). To make the LMS model easier to quantify, linear models were used when the data followed monophasic (Fig. 2) or biphasic (Figs. 1 and 4) responses. In addition, the effects of ionizing radiation on microbial survival were based on the linear decay rates for B. subtilis spores exposed to X-rays (e.g., Fig. 2 and Moeller et al., 2010).
Empirical bioburden reduction rates down to −6 logs can be easily derived in most laboratory experiments because starting populations are often fixed between 1.0 × 10⁶ and 5 × 10⁶ spores per sample (e.g., Schuerger et al., 2006; Moeller et al., 2010 and Figs. 2 and 4). As the initial populations are raised >5.0 × 10⁶ spores per sample (especially for spores dried on to spacecraft materials) (e.g., Schuerger et al., 2006; Moeller et al., 2010 and Figs. 2 and 4), the spores begin to develop multilayered aggregates in which buried spores are protected by spores in the upper layers of the aggregates (see Schuerger et al., 2005). Thus, the results are often skewed to higher survival rates at spore/cell populations >5.0 × 10⁶ per sample. The approach here for the LMS model was to use empirically derived data down to −6 logs, and then extrapolate an additional −4 logs for a total LD dosage of −10 logs of microbial inactivation.
We propose the term functional sterilization of a spacecraft surface to refer to the effects of biocidal factors acting to inactivate microbial spores or vegetative cells down to −10 logs. This approach is consistent with the Viking landers' heat-sterilization protocol (Puleo et al., 1977), in which the length of time to inactivate all spores and vegetative cells down to a probability of <10−4 below inactivating a known population of 106 spores yields a total LD of −10 logs. The use of functional sterilization gives the astrobiology and planetary protection communities a pragmatic approach to determining when extremely low bioburden survival rates approach a functional level for spacecraft sterility, below which further bioburden reduction efforts appear unproductive in mitigating forward contamination any further.
4.4. LMS model caveats
Thermal transport models are required for complex spacecraft architectures on the Moon. First, the current LMS model idealized the spacecraft geometries as horizontal surfaces sitting parallel to the lunar terrain. However, more complex architectures will increase or decrease shading effects on other surfaces, making new LMS predictions more complicated. For example, as the Sun rises on the Moon, portions of spacecraft structures will be perpendicular to the rising Sun, and thus, will heat up more quickly than horizontal surfaces. The Surveyor III camera was elevated into the solar beam at sunrise and was not shaded during lunar daylight hours (Fig. 7A). Understanding how spacecraft surfaces heat and cool during daylight hours will greatly advance the LMS model predictions for microbial survival on and within complex spacecraft structures. Second, additional data are required on heat transfer processes into deeply embedded components of complex spacecraft structures during daylight hours. The warmer the internal high temperatures reach, the greater the biocidal effects will be observed due to the interactive effects of low pressure and elevated temperatures. And third, additional data are essential for defining the interactive effects of temperatures <100°C and low pressures close to cis-lunar vacuum conditions (10−8 to 10−10 Pa). As already discussed, the few articles found on interactive effects of vacuum and temperatures <100°C all indicated that warmer temperatures enhance the lethality of the vacuum. Thus, the LMS model predictions for deeply embedded spacecraft components might be increased if the deeply embedded components reach temperatures closer to 50–70°C. Biocidal effects are not limited to only temperatures >70°C (Figs. 2 and 3).
Kill kinetics for nonspore-forming and nonculturable microorganisms are required to constrain the LMS model regarding complex microbial communities and/or assemblages on spacecraft. Although most of the identified microbial contamination on lunar spacecraft appears to be in the domain Bacteria (e.g., Puleo et al., 1970, 1973a; Dillon et al., 1973) and some studies described a few fungal species on lunar spacecraft (Puleo et al., 1970, 1973a; Taylor et al., 1973), it appears that no more than ∼10% of the launched bioloads on lunar spacecraft are from the domain Eukarya. The LMS model focused here on the inactivation of B. subtilis spores, but data on other species, particularly species with higher resistance rates to the stresses modeled, would provide insights into refractory species with higher rates of survival than B. subtilis.
And lastly, the LMS model is based on a set of assumptions and empirical data in which a LD rate was defined as the interactive effects of all stressing agents culminating in a −10 log reduction in survivors. If new data indicate that the total microbial populations on launched lunar spacecraft were higher than modeled here, then the survival rates over time would be slightly longer. For example, if the estimated total probable bioburdens at lunar contact are estimated to be 2 logs higher than modeled here, increasing from 5.47 × 10⁸ to 5.47 × 10¹⁰ spores/cells per spacecraft (Table 1), the LMS model would still predict that microorganisms on most landed or crashed spacecraft on the Moon (except the Chang'e 3 and Yutu lander) would be inactivated by 2030 (Fig. 6 and Table 4). On average, increasing the total probable bioburdens at lunar contact by 1 log increases the time required to drop below one viable spore or cell by 50 lunations (Table 2) for the vacuum-only case on deep internal surfaces.
4.5. Future astrobiological targets for recovery of viable microorganisms on lunar hardware
Table 4 shows LMS predictions for bioburden levels for the last 10 spacecraft to have landed or crashed on the lunar surface up to January 1, 2019 (column 2) and January 1, 2030 (column 3). The LMS predictions for January 1, 2019 suggest that the last 10 lunar spacecraft may have residual viable microorganisms that are deeply embedded near the central cores of each spacecraft. For January 1, 2030 (a reasonable date for the return of humans to the Moon), 5 of the last 10 lunar spacecraft would be expected to harbor no viable microorganisms. Only the Chang'e/Yutu lander was estimated to plausibly harbor significant bioburdens near 1 × 10⁵ spores/cells on deeply embedded components (Table 4); a population of viable microbes that may be detected on returned spacecraft components. For all earlier spacecraft landed or crashed between September 14, 1959 (Luna 2) and August 18, 1976 (Luna 24) (Table 1), the LMS model predicts them to be free of viable Earth microorganisms.
The following high-priority astrobiology targets are proposed for collecting lunar archived payloads and equipment for microbial study.
First, although the most easily accessible materials on the Moon would be the surface experiments deployed by the Apollo astronauts (e.g., the Apollo 15 Heat Flow experiment) (Fig. 8A) or the Lunar Rover Vehicle (Fig. 8B), these payloads are of limited value for astrobiology studies because they are either small and poorly shielded (Fig. 8A) or are of similar unshielded construction as the Surveyor III lander (Fig. 7A). However, samples from these payloads would provide insights into how spacecraft materials have survived space weathering since their initial deployments, including the effects of rocket exhaust plumes during lander ascents (i.e., plumes can “sand-blast” spacecraft surfaces; see Immer et al., 2011).
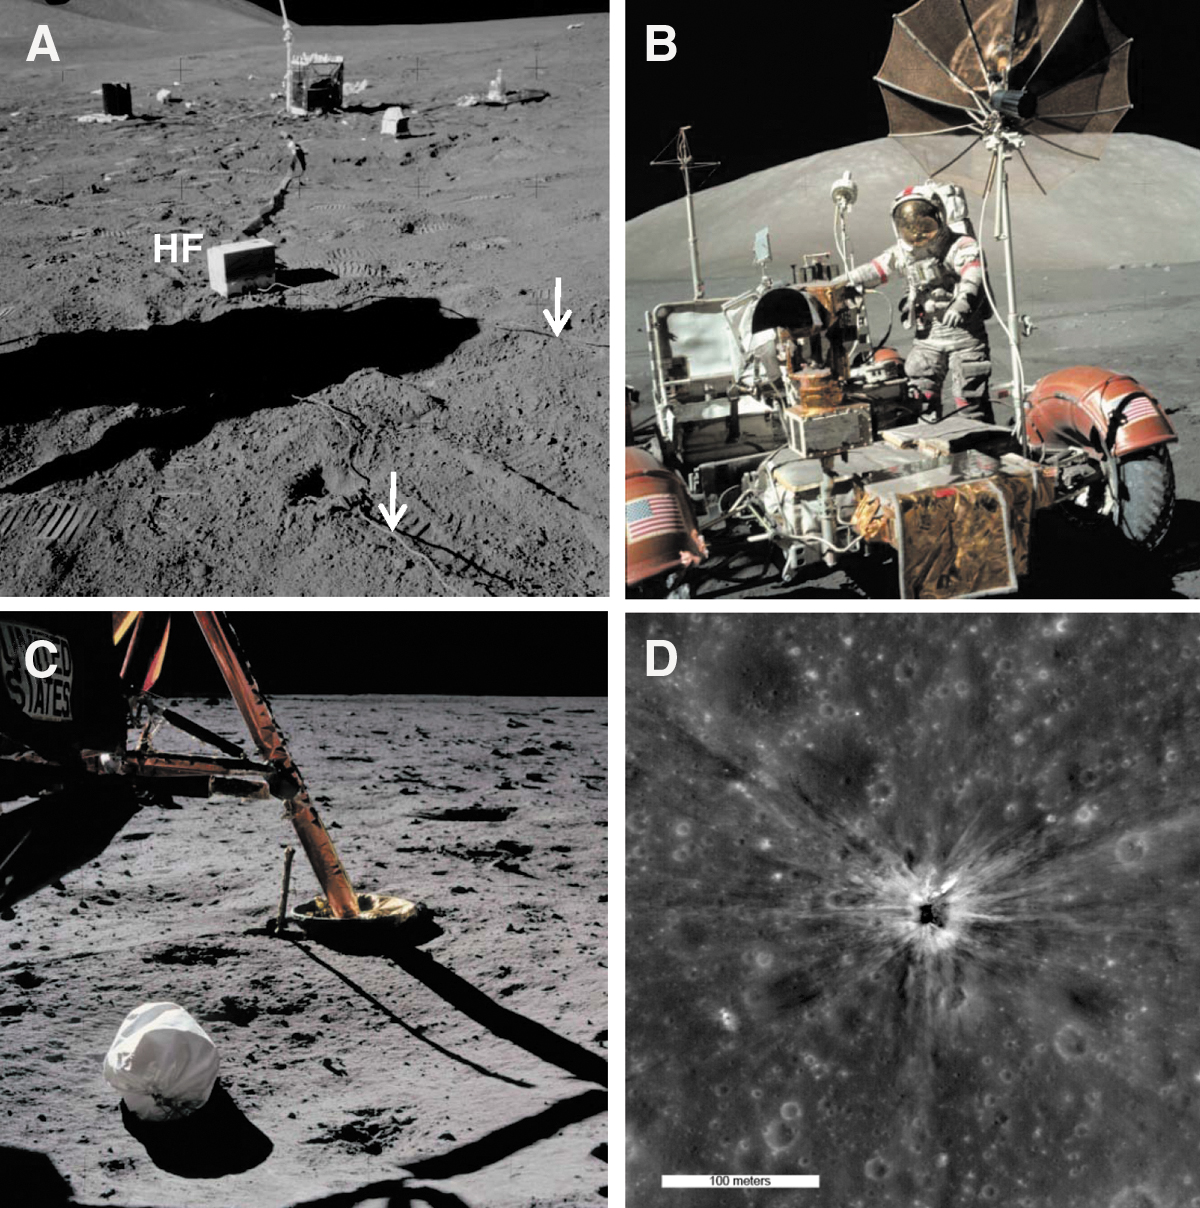
Apollo images depicting the complexity of the landed modules, equipment, rovers, and impact sites.
Second, the highest priority for an Apollo era microbial survey would be the nylon jettison (JETT) bags placed underneath the LM descent stages or tossed onto the lunar surface before leaving the Moon (e.g., Apollo 11 JETT bag) (Fig. 8C). The JETT bags contain disposable materials from within the crewed LM ascent stages before landing, including water containers, human waste, food wrappers, LiOH canisters (for airborne spores), and sleep restraints (dermal microbiota) (e.g., Anonymous, 1971, 1972). If the JETT bags with human waste and sleep restraints were placed under the LM descent stages, they would have the richest microbial bioburdens and species diversity of the accessible materials on the Moon (i.e., materials directly handled by human astronauts), and the bags have been mostly shielded from the worst of the thermal cycling conditions on the Moon. Furthermore, the LM descent stages are the largest intact structures on the Moon and would provide insights into shielding against ionizing radiation effects on biological systems.
Another interesting astrobiological target for recovering materials would be samples from one of the Apollo Saturn IVB booster or LM ascent stage impact craters (e.g., Fig. 8D). Assumption (A15) in the LMS model states that thermal heating of spacecraft during impact events was not incorporated because data were not available that would predict impact temperatures of such vehicles. Data on the thermal heating of impacted spacecraft and materials would advance the LMS model predictions for such events, and possibly significantly lower the survival rates of microorganisms for impacted spacecraft components.
Fourth, the spacecraft with the highest predicted surviving bioburden on the Moon is the Chang'e and Yutu lander (Table 4). The LMS model predicts that as of January 01, 2019, the Chang'e Yutu lander may retain ∼7.03 × 10⁷ viable spores/cells on deeply embedded surfaces. This population will be inactivated on average by only −0.02 logs per lunation (or −0.247 logs per year) by vacuum-only effects, and thus, by January 1, 2030, the abundance of viable microorganisms within the lander would be ∼1.29 × 10⁵ spores/cells. Of the spacecraft currently on the surface of the Moon, the Chang'e and Yutu lander may hold the greatest promise for the recovery of viable Earth microorganisms present on the Moon for at least 10 years.
And lastly, any new lunar spacecraft landed or crashed to the lunar surface during the next decade should be fitted with astrobiology payloads that could be recovered and analyzed for microbial survival, biosignature degradation, and materials alterations when humans return to the Moon around 2030. Such astrobiological experiments would require very little mass, but could greatly advance our understanding of how Earth microorganisms can withstand the perils of the lunar environment.
Footnotes
Acknowledgments
The authors thank NASA Space Science Data Coordinated Archive (NSSDCA) curator Dr. Dave Williams at NASA Goddard Space Flight Center who assisted with Apollo dry mass values given in ![]() . The research by A.C.S. was supported by NASA's Planetary Protection Office through three grants awarded in 2008 (NNX08AQ81A), 2012 (NNX12AJ84G), and 2017 (80NSSC17K0263). J.E.M. was supported in this study by a Discovery Grant (436252–2013) from the Natural Sciences and Engineering Research Council of Canada (NSERC). D.J.S. contributions were made possible with a NASA Planetary Protection Office grant (15-PPR15–0007). And G.R. was supported by the Open Program for Research, Development and Education, MEYS, under the project CRREAT (Reg. No. Z.02.1.01/0.0/0.0/15_003/0000481). Raw data and the MatLab code used to generate the LMS model are archived as Supplementary Data linked to the published main text.
. The research by A.C.S. was supported by NASA's Planetary Protection Office through three grants awarded in 2008 (NNX08AQ81A), 2012 (NNX12AJ84G), and 2017 (80NSSC17K0263). J.E.M. was supported in this study by a Discovery Grant (436252–2013) from the Natural Sciences and Engineering Research Council of Canada (NSERC). D.J.S. contributions were made possible with a NASA Planetary Protection Office grant (15-PPR15–0007). And G.R. was supported by the Open Program for Research, Development and Education, MEYS, under the project CRREAT (Reg. No. Z.02.1.01/0.0/0.0/15_003/0000481). Raw data and the MatLab code used to generate the LMS model are archived as Supplementary Data linked to the published main text.
Authors' Contributions
All coauthors participated in the writing of the article. A.C.S. conceptually envisioned the LMS model and conducted the empirical experiments described in Figs. 2 and 3 and reviewed the literature to collect data used in Figs. 1 and 4. J.E.M. used the data given in Tables 1 and 3 and Figs. 1–4 to generate the LMS model. In addition, J.E.M. used the LMS model to then generate the data given in Tables 2 (columns 5–7) and 4 (columns 2 and 3), and Figs. 5 and 6. D.J.S. compiled the data given in Table 1 and assisted A.C.S. with the lunar simulation experiments. G.R. developed the data sets used for ionizing radiation parameters given in ![]() .
.
Author Disclosure Statement
There are no competing financial interests for the authors.
Supplementary Material
Supplementary Data
Supplementary Table S1
Supplementary Table S2
Supplementary Table S3
Supplementary Table S4
Supplementary Table S5
Abbreviations Used
References
Supplementary Material
Please find the following supplemental material available below.
For Open Access articles published under a Creative Commons License, all supplemental material carries the same license as the article it is associated with.
For non-Open Access articles published, all supplemental material carries a non-exclusive license, and permission requests for re-use of supplemental material or any part of supplemental material shall be sent directly to the copyright owner as specified in the copyright notice associated with the article.