
Abstract
No instrument capable of direct life detection has been included on a mission payload to Mars since NASA's Viking missions in the 1970s. This prevents us from discovering whether life is or ever was present on Mars. DNA is an ideal target biosignature since it is unambiguous, nonspecific, and readily detectable with nanopore sequencing. Here, we present a proof-of-concept utilization of the Oxford Nanopore Technologies (ONT) MinION sequencer for direct life detection and show how it can complement results from established space mission instruments. We used nanopore sequencing data from the MinION to detect and characterize the microbial life in a set of paleochannels near Hanksville, UT, with supporting data from X-ray diffraction, reflectance spectroscopy, Raman spectroscopy, and Life Detector Chip (LDChip) microarray immunoassay analyses. These paleochannels are analogs to martian sinuous ridges. The MinION-generated metagenomes reveal a rich microbial community dominated by bacteria and containing radioresistant, psychrophilic, and halophilic taxa. With spectral data and LDChip immunoassays, these metagenomes were linked to the surrounding Mars analog environment and potential metabolisms (e.g., methane production and perchlorate reduction). This shows a high degree of synergy between these techniques for detecting and characterizing biosignatures. We also resolved a prospective lower limit of ∼0.001 ng of DNA required for successful sequencing. This work represents the first determination of the MinION's DNA detection limits beyond ONT recommendations and the first whole metagenome analysis of a sinuous ridge analog.
1. Introduction
The search for biosignatures is increasingly important in Mars exploration missions and will be a primary objective for the upcoming ExoMars 2020 and Mars 2020 missions (McLennan et al., 2012; Mustard et al., 2013a, 2013b; Summons et al., 2014). To test strategies, techniques, logistics, and instruments, terrestrial analog sites are used to approximate field operations and further understand the corresponding extraterrestrial body's environment, geology, and potential for life and biosignature preservation (Thiel et al., 2011).
Hanksville, UT, is situated near a number of diverse Mars analogs, including segmented and inverted anastomosing paleochannels exhumed from the Late Jurassic Brushy Basin Member of the Morrison Formation (Williams et al., 2007; Clarke and Stoker, 2011; Ehrenfreund et al., 2011). Like other inverted fluvial channels, the Hanksville paleochannels have resulted from relief inversion, in which materials in topographic lows are more resistant to erosion than their surroundings (Williams et al., 2007, 2009; Clarke and Stoker, 2011). Because fluvial channels are composed of higher permeability sediments than their floodplain surroundings, the water flow can lead to cementation of the channels. Cemented fluvial channels can then be exhumed by denudation of the surrounding landscape, resulting in inversion of the former topography (Williams et al., 2009; Clarke and Stoker, 2011).
The Hanksville paleochannels were exhumed in this way, and the sedimentary sandstone of the channels is capped with erosion-resistant coarse sandstones and fine-grained conglomerates (Williams et al., 2007, 2009). This capping protects the underlying clay floodplains and preserves the fluvial sediments, as well as sedimentary structures and biosignatures (Williams et al., 2007; Clarke and Stoker, 2011). The Hanksville paleochannels are strong geomorphological analogs to sinuous ridges on Mars, which is a nonspecific term for elongated ridge structures on the martian surface. They may have formed from inverted stream channels but could also result from other, non-hydrological processes (e.g., wrinkle ridges) (Williams et al., 2009, 2013).
Dating from the Noachian Period to the Amazonian Period on Mars, sinuous ridges represent compelling evidence for a history of prolific water flow (Clarke and Stoker, 2011; Balme et al., 2015; Davis et al., 2016). They are distributed globally, but are particularly abundant in Arabia Terra, the northernmost region of Mars' heavily cratered southern highlands (Williams et al., 2009; Clarke and Stoker, 2011; Davis et al., 2016). One prominent sinuous ridge in this area is Aram Dorsum, a former candidate landing site for ExoMars 2020 (downselected in March 2017).
In November 2016, the Hanksville paleochannels were chosen for CanMars 2016, a simulation Mars sample return mission led jointly by the Canadian Space Agency and Western University (Osinski et al., 2019). Mars sample return will take its first steps with the Mars 2020 rover, which will identify and cache organic samples and water-formed samples for potential return to Earth in the 2030s (Mustard et al., 2013a, 2013b; Summons et al., 2014; Beegle et al., 2015).
The National Research Council (United States) and the Mars 2020 Science Definition Team both state that the determination of whether life is or ever was present on Mars is the prime focus of the 2013–2022 decade (NRC, 2012; Mustard et al., 2013b). Yet neither ExoMars 2020 nor Mars 2020 contain instrumentation capable of detecting definitive biosignatures, which are substances, objects, or patterns that could not form via abiotic processes (Mustard et al., 2013b; Hays et al., 2017; Sephton, 2018).
Nucleic acids, including DNA, are strong definitive biosignatures given the virtual impossibility of their generation in the absence of life (Mustard et al., 2013b; Neveu et al., 2018). In missions focusing on Mars, DNA is an especially good target. There is some evidence for the exchange of possible microbe-carrying rocks between the Earth and Mars during the Late Heavy Bombardment period ∼4 billion years ago, when both planets shared a warm and wet environment capable of harboring life (Mileikowsky et al., 2000). Overall geological and chemical similarities between Earth and Mars indicate that any potential martian life could share fundamental biochemistry with terrestrial life because the emergence of inorganic-based biology would require conditions and chemistries vastly different from the two rocky planets (e.g., gas giants and icy moons) (Mustard et al., 2013b).
There is also a widespread occurrence of organic molecules in interstellar space (Pace, 2001; Meinert et al., 2016), and putative hydrogen-rich aliphatics have recently been detected in Mars' Gale Crater (Eigenbrode et al., 2018). While it is certainly not definite that life on Mars (or anywhere else in our Solar System) would share its biochemical phenotype with Earth, we should include the capability to detect these features on Mars exploration missions. We must search for what we know before we can rule out its impossibility. This is especially true with increasing activity in both the private and public space sectors that could compromise future life detection and science activities on Mars (Fairén et al., 2017; Musk, 2017; Spry et al., 2018).
As well as detecting DNA, life detection instrumentation should have the capacity for miniaturization and low-power requirements to ease deployment on a rover or lander vehicle. It should also have proven functionality in terrestrial analog environments (Ellery et al., 2002). The Oxford Nanopore Technologies' (ONT) MinION is a promising candidate for life detection based on these requirements. The MinION is a miniaturized device designed to sequence DNA, RNA, and potentially proteins (Loman and Watson, 2015; Goordial et al., 2017; Leggett and Clark, 2017). The MinION uses nanopore technology to generate sequences (Loman and Watson, 2015; Leggett and Clark, 2017). It is portable and can operate in difficult environmental conditions, including the high Arctic, Antarctic, tropical rainforests, and the microgravity of the International Space Station (ISS) (Edwards et al., 2016; John et al., 2016; Castro-Wallace et al., 2017; Goordial et al., 2017; Johnson et al., 2017; Menegon et al., 2017).
Indeed, the MinION was the first sequencer to operate in space as part of the Biomolecule Sequencer project in 2016 (John et al., 2016; Castro-Wallace et al., 2017), making it a promising candidate for direct life detection in space missions. Its small size would make it easier and cheaper to develop than larger payloads, it can function in a controlled environment such as the heated interior chamber of a rover, and it can directly detect unambiguous signs of life through nucleic acid sequencing (Carr et al., 2017; Goordial et al., 2017). This would enable the best selection of samples for future caching and potential return to Earth (Goordial et al., 2017). If DNA is detected on a mission, the ability of the MinION to generate sequences in real time also means that contamination from terrestrial microorganisms can be quickly ruled out.
However, ONT requires a minimum input of 400 ng of DNA without polymerase chain reaction (PCR) amplification and 1 ng of DNA with PCR amplification for MinION sequencing. The low biomass present in many Mars analogs, such as high-elevation University Valley permafrost (103 cells/g) (Goordial et al., 2016) and Lost Hammer Spring sediment (105 cells/g) (Niederberger et al., 2010), corresponds to just ∼0.01–1 ng of DNA based on an average bacterial genome size of 2–5 Mbp and ∼2.5–5 fg of DNA per genome (Dolezal et al., 2003; Raes et al., 2007; Goordial et al., 2017), meaning that DNA detection limits of MinION sequencing need to be explored beyond ONT recommendations.
We tested the life detection capability of the MinION with samples from a high-fidelity analog environment, the Hanksville paleochannels. We determined DNA detection limits using a high biomass endolith sample and generated a metagenomic profile of this site with MinION sequences. Simultaneous analyses with an X-ray diffractometer, microreflectance spectrometer, and micro-Raman spectrometer and protein detection with the Life Detector Chip (LDChip) (Parro et al., 2005) were also performed to complement MinION results and to establish baseline data for a paleochannel environment.
These instruments were chosen because they are analogs to current and future payload instruments. An X-ray diffractometer forms the core of the Curiosity rover's CheMin instrument, a microreflectance spectrometer acts as an approximation for ExoMars 2020's Mars Multispectral Imager for Subsurface Studies (Ma_MISS), and a micro-Raman spectrometer approximates ExoMars 2020's Raman Laser Spectrometer (RLS) (Rull et al., 2017) and Mars 2020's SuperCam and SHERLOC (Scanning Habitable Environments with Raman and Luminescence for Organics and Chemicals). The LDChip approximates the Life Marker Chip, a former Pasteur payload candidate for ExoMars 2020. These instruments characterize other biosignatures (e.g., isotopes, organics, and polymeric biomarkers), contextualize the environment and geologic setting, and help reveal metabolic potential of the microbial community.
2. Materials and Methods
2.1. Sample site and collection
The study site is located ∼7.8 km NW of Hanksville, UT (38.41709915, −110.78539335; Fig. 1). It is part of the Colorado Plateau and contains a diverse array of early Jurassic to late Cretaceous-aged evaporitic and fluvial sediments. The geology of the site is dominated by quartz, calcite, and gypsum, and has been shaped by fluvial and aeolian processes (Martins et al., 2011; Stoker et al., 2011). It is an arid desert with an average annual temperature of 11.9°C and 144 mm of precipitation (Martins et al., 2011). Samples were collected to represent a range of geomorphology and biomasses (e.g., desiccated regolith, high biomass endoliths).
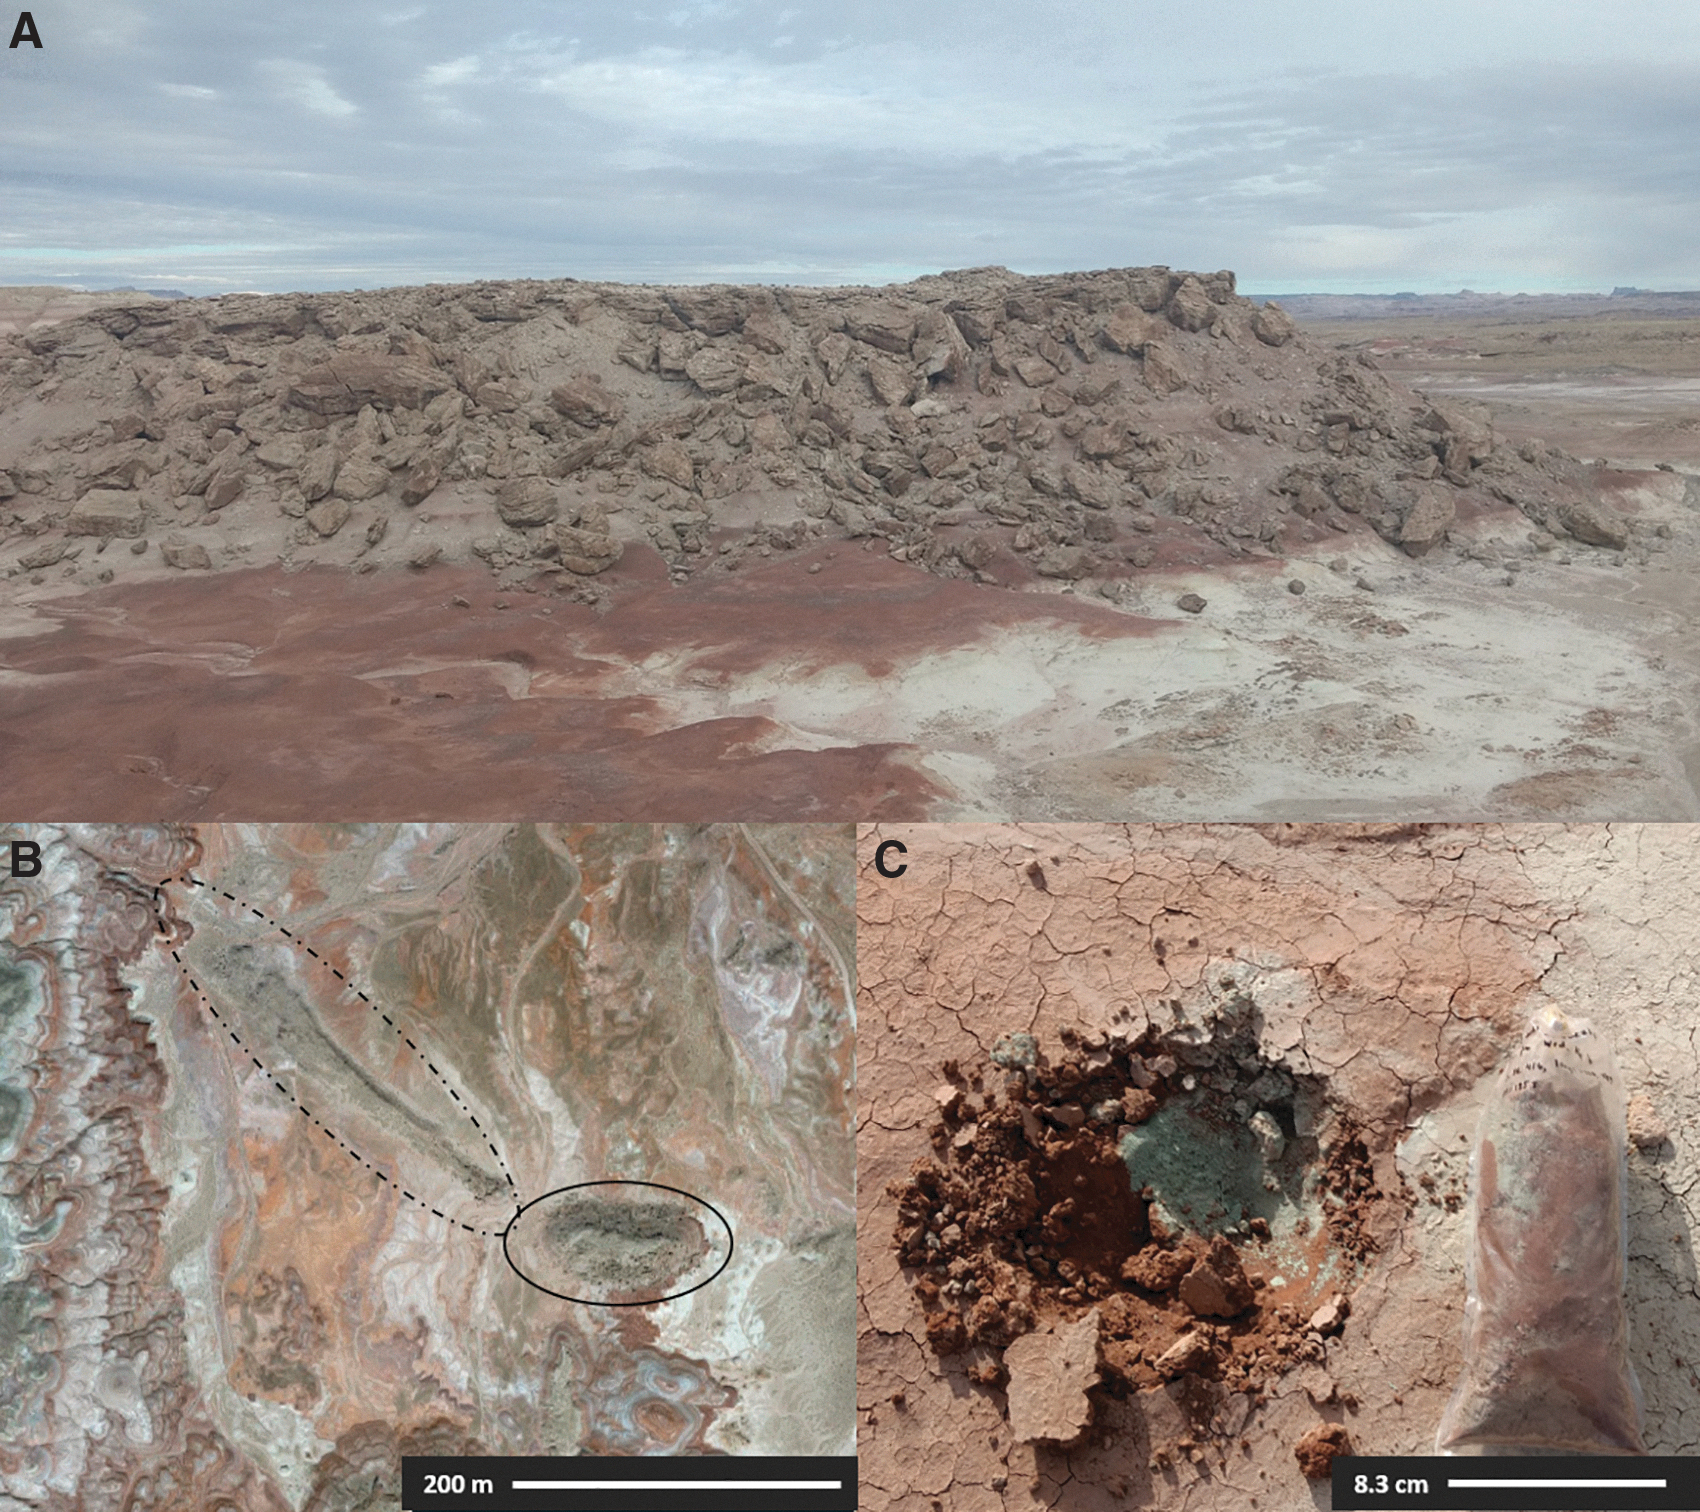
Hanksville paleochannel site and samples.
Regolith was aseptically collected with a hand shovel and harder rocks were broken off larger concretions with a rock hammer. All collection tools were sterilized with 70% ethanol and a lighter. Latex gloves were worn during collection and samples were loaded into sterile Whirl Pak plastic bags. Samples were transported from the Utah site to Montreal, Quebec, Canada, at ∼5°C and subsequently stored at −30°C while waiting for analysis at McGill University (MinION sequencing), the University of Winnipeg (X-ray diffraction [XRD], reflectance spectroscopy, and Raman spectroscopy), and the Centro de Astrobiología (INTA-CSIC) (LDChip immunoassays).
2.2. DNA extraction and MinION sequencing
DNA was extracted from all samples with the PowerLyzer PowerSoil DNA Isolation Kit (Mo Bio Laboratories, Inc., Carlsbad, CA) according to the manufacturer's protocol and eluted in 50 μL of nuclease-free water. Extractions were stored at −20°C until sequencing. Extractions were prepared for 1D single-strand sequencing with the Rapid Low Input by PCR Barcoding kit (SQK-RLB001), and all samples were sequenced on one R9.5 FLO-MIN107 flow cell during one run (Table 1).
Input DNA and MinION Sequence Details from the Hanksville Paleochannel Samples
Also included are the number of correct reads by Canu, the percent of reads classified by JGI IMG/M ER, and the JGI IMG/M ER submission ID.
JGI IMG/M ER = Joint Genome Institute's Integrated Microbial Genomes and Microbiomes Expert Review.
DNA detection limits were established using the endolith sample E4 because it had the highest percent of sequences classified in the Joint Genome Institute's Integrated Microbial Genomes and Microbiomes Expert Review (JGI IMG/M ER) system (Markowitz et al., 2011) and the second highest number of sequences produced (Table 2). To determine whether the MinION could distinguish false positives from true positives, a run containing no DNA (3 μL of sterile nuclease-free water) was also sequenced using the same method (SQK-RLB001 preparation) on an R9.5 flow cell. The detection limit trial samples were prepared for sequencing with the Rapid PCR Barcoding kit (SQK-RPB004), since the Rapid Low Input by PCR Barcoding kit (SQK-RLB001) was discontinued soon after our metagenome analyses. Each trial was sequenced on a separate R9.4 FLO-MIN106 flow cell; R9.5 chemistry was no longer recommended for 1D single-strand sequencing when we conducted our detection limit trials.
DNA Detection Limit Trial Details with Endolith Sample E4
Also included are the number of correct reads by Canu, the percent of reads classified by JGI IMG/M ER, and the JGI IMG/M ER submission ID.
All sequences were basecalled with MinKNOW v1.7.7 and underwent the following downstream processing: basecalled sequences were demultiplexed and trimmed using Porechop version 0.2.3 (
We also performed 16S rRNA gene sequencing with an Illumina MiSeq according to the protocol described in the work of Kozich et al. (2013). All sequences were classified with the Mothur software package (
2.3. Powder XRD
XRD data were acquired in continuous scans from 5 to 80°2θ on a Bruker D8 Advance with a DAVINCI automated powder diffractometer from crushed aliquots of sample. It uses a Bragg/Brentano goniometer with a theta/theta system. The setup was equipped with a 2.5° incident Soller slit, 1.0 mm divergence slit, a 2.0 mm scatter slit, a 0.6 mm receiving slit, and a curved secondary graphite monochromator. Diffracted X-rays were collected by a scintillation counter at increments of 0.02° and an integration time of 1 s per step. The line focus Co X-ray tube was operated at 40 kV and 40 mA, using a take-off angle of 6°. Diffraction patterns were interpreted with Bruker DIFFRAC.SUITE EVA software and the International Center for Diffraction Data Powder Diffraction File (ICDD-PDF-2) database.
2.4. Reflectance spectroscopy (UV-VIS-NIR, 350–2500 nm)
Spectra of regolith samples were collected in powdered and whole rock aliquots, and multiple spots were analyzed on the endolith-bearing samples (both fresh and weathered rock, and endolith surfaces). Long-wave ultraviolet, visible, and near-infrared (350–2500 nm) reflectance spectra were measured with an Analytical Spectral Devices FieldSpec Pro HR spectrometer (ASD). This instrument has a spectral resolution between 2 and 7 nm (internally resampled by the instrument to 1 nm). Spectra were collected at a viewing geometry of i = 30° and e = 0° with incident light being provided by an in-house 150 W quartz/tungsten/halogen collimated light source. Samples were measured relative to a Spectralon® 100% diffuse reflectance standard and corrected for minor (<2%) irregularities in its absolute reflectance. We acquired and averaged 200 spectra of the dark current, standard, and sample to provide sufficient signal-to-noise for subsequent interpretation.
2.5. Raman spectroscopy (532 nm)
Raman spectra were collected from multiple spots on both whole rock and powdered (<45 μm) samples (same as the reflectance spectra) by a B&WTek i-Raman-532-S instrument in the Raman shift range of 175–4000 cm−1. This was done with a spectral resolution of ∼4 cm−1 at 614 nm with a 532 nm excitation energy provided by a ∼50 mW solid-state diode laser. Raman-scattered light was detected by a Glacier™ T, a high spectral resolution (0.08 nm) thermoelectrically cooled (14°C) charge coupled device detector. The automatic integration time function (which increases integration time incrementally until the response is close to saturation) was used, yielding an optimal signal-to-noise ratio.
Measurements for each sample were made by first acquiring a dark current spectrum, followed by measurement of the sample. Both measurements were made using an identical viewing geometry, integration time, and number of averaged spectra. Raman-shift calibration was monitored through regular measurements of a polystyrene standard. The RUFF database (
2.6. LDChip biomolecule detection
The LDChip is the core of the Signs of Life Detector (SOLID) instrument (Parro et al., 2011) and consists of an antibody microarray composed of about 200 polyclonal antibodies (purified IgG fraction) designed to search for microbial molecular biomarkers for environmental and space applications (Rivas et al., 2008). The LDChip contains antibodies to the following: (1) prokaryotic strains to cover the most abundant phylogenetic phyla and groups; (2) proteins and peptides from key metabolic processes operating in extreme and “normal” environments (e.g., nitrogen fixation, sulfate reduction/oxidation, iron reduction/oxidation, and methanogenesis); (3) universal microbial markers such as peptidoglycan; and (4) crude extracts from extreme environments (Rivas et al., 2008; Parro et al., 2011). The targets for the antibodies of this study are described in Sánchez-García et al. (2019) (Laura Sánchez-García, pers. comm.).
For this work, LDChip microarrays were constructed, processed, and analyzed as detailed in Blanco et al. (2015, 2017). Briefly, samples (IgG fraction of each antibody) were printed in a triplicate spot-pattern on the surface of epoxy-activated glass slides, fluorescently labeled, titrated, and used in a mixture that consisted of 181 antibodies to reveal immunoreactions. Each 0.5 g sample was resuspended into 2 mL of TBSTRR buffer (0.4 M Tris-HCl pH 8, 0.3 M NaCl, and 0.1% Tween 20) and used as a multianalyte-containing sample for fluorescent sandwich microarray immunoassays.
LDChip images were analyzed and quantified by GenePix Pro software (Molecular Devices, CA). The final fluorescence intensity (F) was quantified as described previously (Rivas et al., 2011; Blanco et al., 2012). An additional cutoff threshold, which was the interval of F with an accumulated frequency higher than 80%, was applied to minimize the probability of false positives. Results were finally represented as a color-patterned heatmap for a better visualization, normalizing output F attending to a number of antibodies per taxonomic/metabolic group and to total microarray fluorescence values (He et al., 2007).
3. Results
3.1. MinION sequencing produced diverse metagenomes from the Hanksville paleochannels
DNA was extracted from all samples and sequenced with the MinION (Table 1). The highest input was 19.5 ng from sample R2 and the lowest was 0.667 ng from sample S2. With the exceptions of samples E1, S3, and R2, total reads produced generally increased with input DNA, while the average sequence length was between 2598 and 3571 bp for all samples. After adaptor trimming and correction with Porechop and Canu, the total number of reads decreased sharply as a result of Canu's error correction, removal of noisy sequences, and replacement with consensus sequences.
The number of reads classified by JGI IMG/M ER was very low (0.72–9.15%) (Table 1). This is not uncommon for nanopore sequencing, which can have classification rates ranging from 15% (Edwards et al., 2017) for single-strand 1D sequencing up to 98% (Brown et al., 2017) for double-strand 1D2 sequencing. This may be partially due to high error rates in MinION basecalling (Jain et al., 2017) and is likely exacerbated in natural microbial consortia. In addition, metagenomic data sets tend to have low taxon classification in general due to incomplete databases and higher numbers of unclassifiable sequences, as opposed to amplicon sequencing data sets (Tessler et al., 2017).
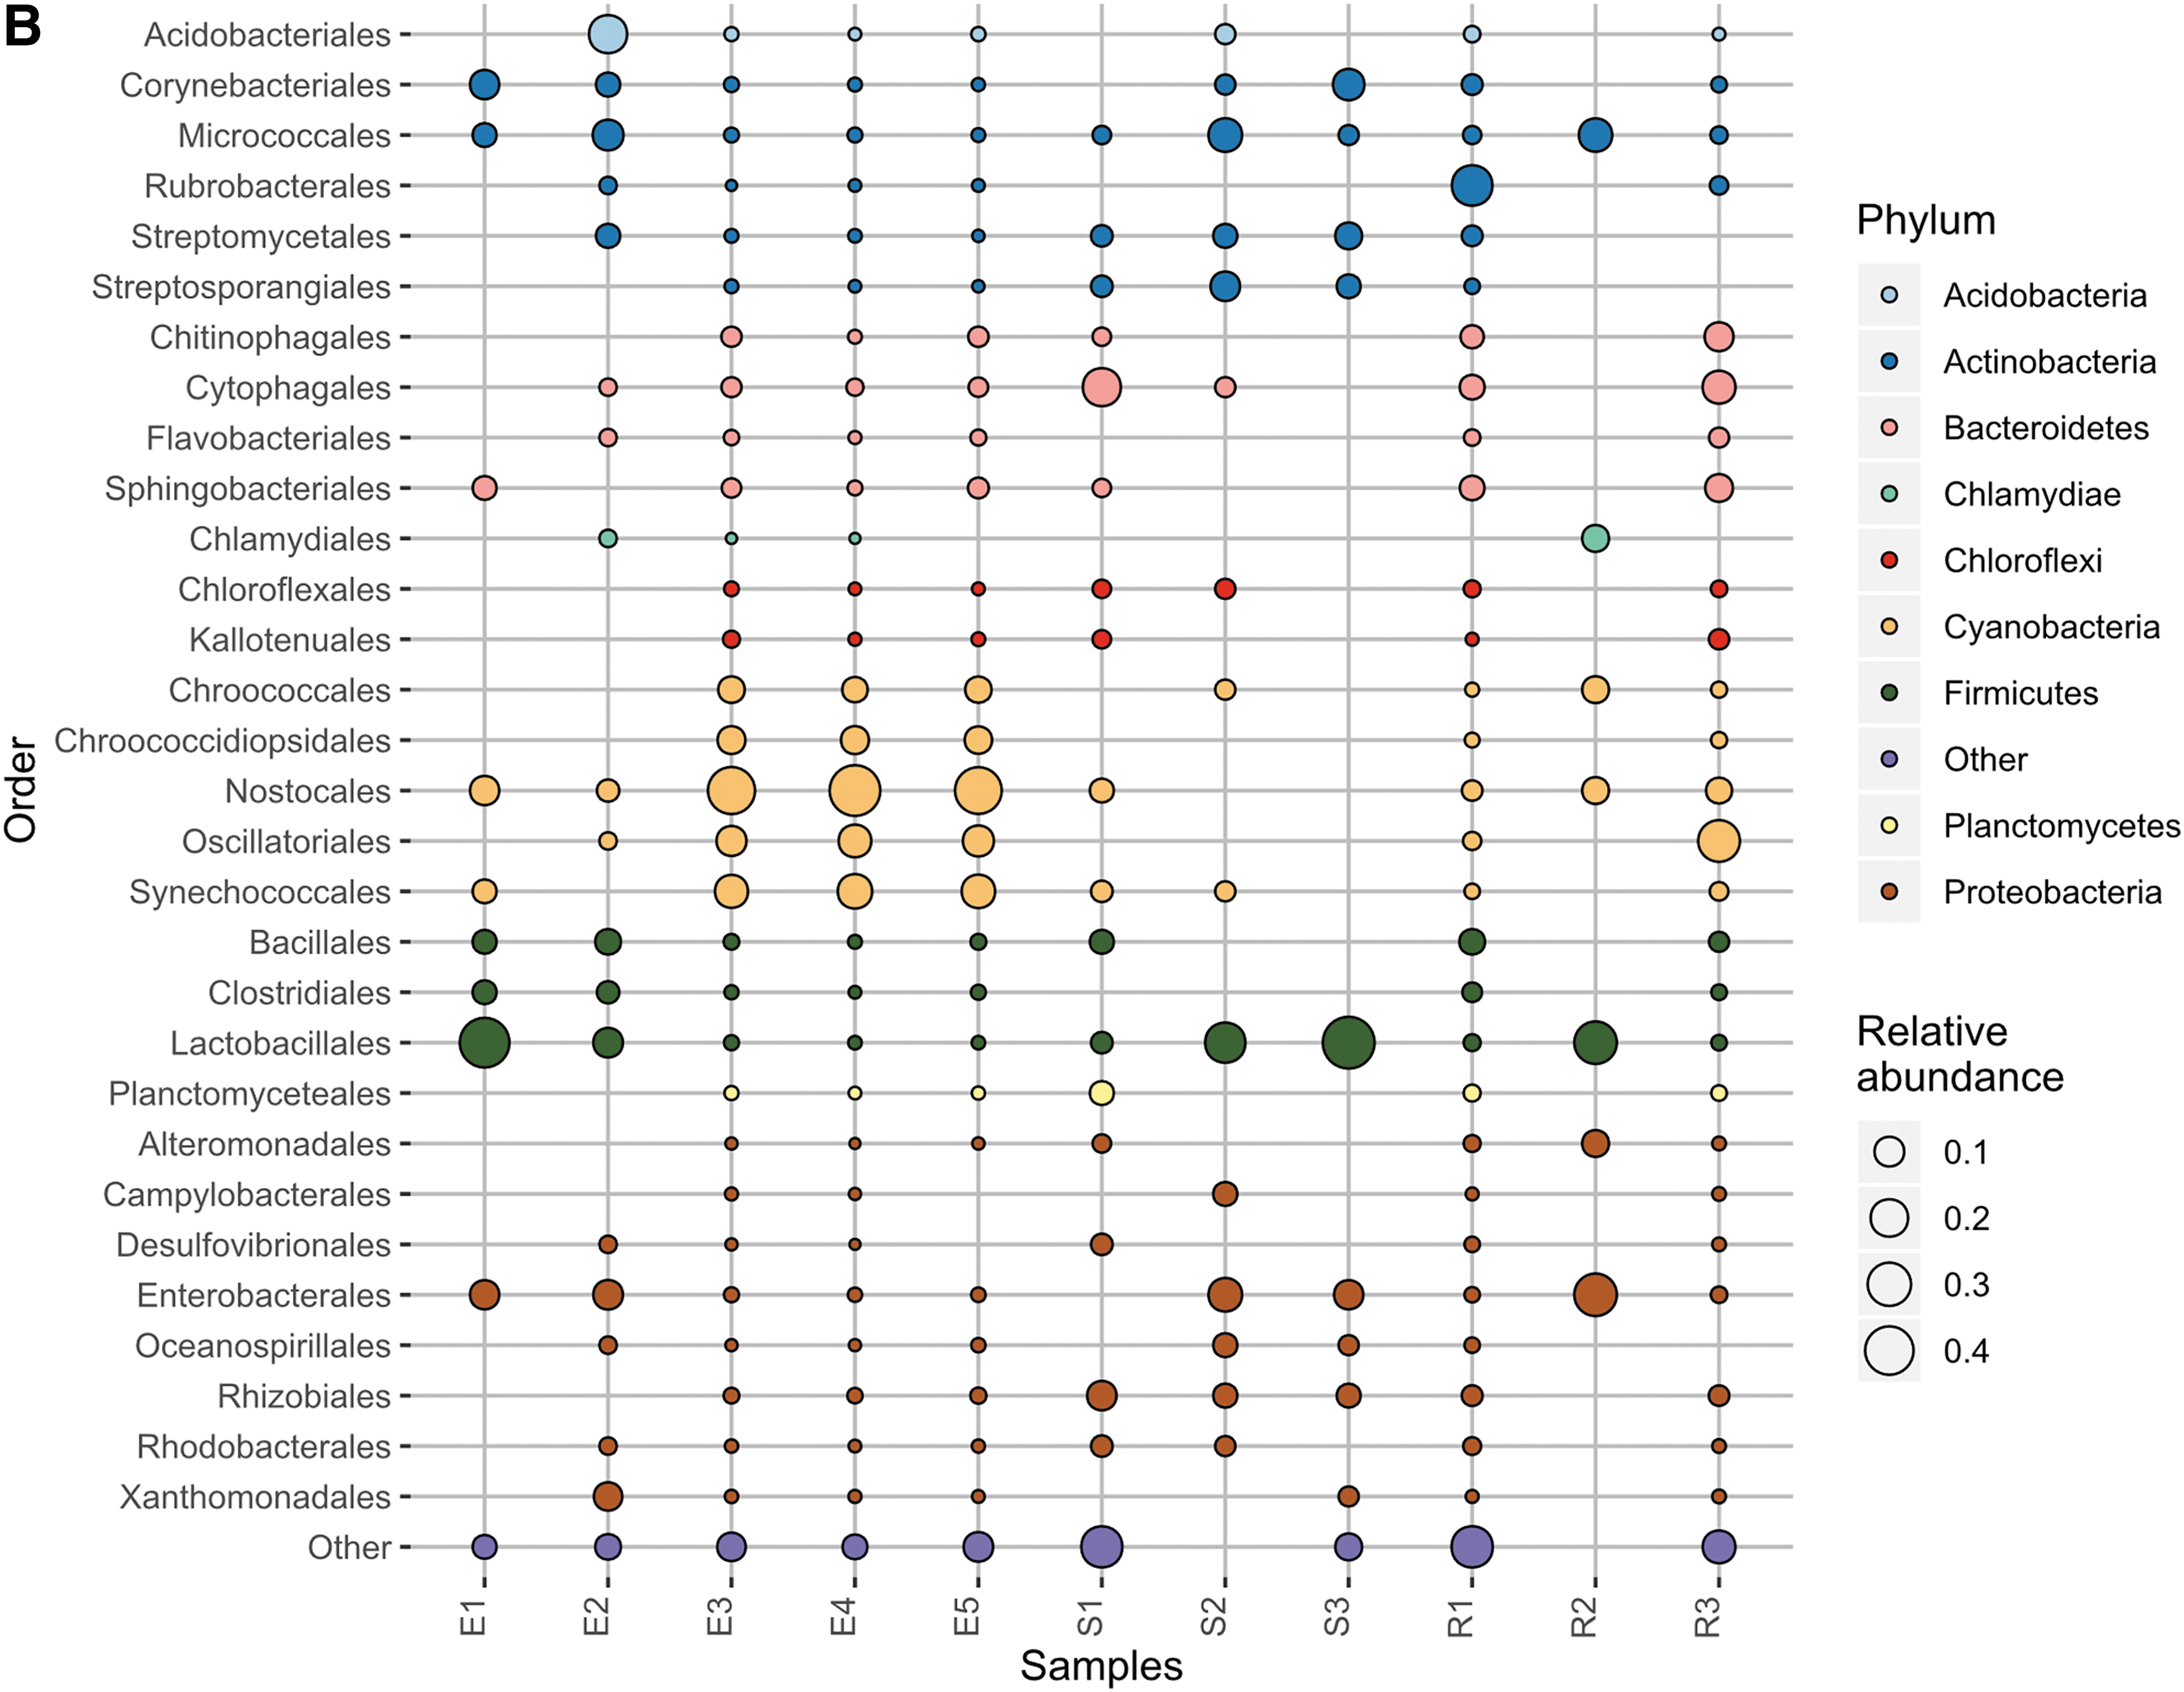
The Hanksville paleochannel metagenomes contain rich microbial communities, with members from all three domains of life (bacteria, archaea, and eukarya), as well as viruses (Fig. 2). The samples contain a wide variety of bacteria, with samples E1 and R1 each containing genes from 21 distinct bacterial phyla. Proteobacteria, Actinobacteria, Cyanobacteria, and Bacteroidetes were the most prominent phyla encountered. Proteobacteria and Actinobacteria were detected in all 11 samples, and in large proportions (≥10%) in 7 and 3 samples, respectively.
Metagenomes of the Hanksville paleochannel samples generated by MinION sequencing. All three domains of life are detected, as well as viruses. Samples E1, E2, E3, E4, and E5 are endoliths. Samples S1, S2, and S3 are regoliths. Samples R1, R2, and R3 are non-endolith rocks.
Three endolith samples (E3, E4, and E5) were strongly dominated by Cyanobacteria (≥76%), followed by Bacteroidetes and Proteobacteria. Nostocales were the most prominent cyanobacterial order present. Among the sediment and rock samples, Actinobacteria, Bacteroidetes, and Proteobacteria were the dominant taxa, save sample R3, which had Cyanobacteria as a chief phylum (38%). This sample had also had Nostocales as its most abundant cyanobacterial order. R3 had no visible endoliths and instead was covered by a dark oxidized coating (likely desert varnish). Desert varnish has been observed at the Viking and Pathfinder landing sites on Mars (McCauley et al., 1979; Guinness et al., 1997), and while the method of desert varnish formation remains unclear, it is postulated to involve microbial mediation and deposition of manganese-rich films (Dorn and Oberlander, 1981).
Archaea were present in small proportions (∼1%) in 7 of 11 samples as Euryarchaeota and Thaumarchaeota. Among the bacterial and archaeal genes detected are several extremophiles capable of surviving Mars-like conditions, further enforcing the analog potential of this site beyond geomorphology. These extremophiles include UV-resistant and halophilic Halobacteria, methanogens Methanobacteria and Methanomicrobia, desiccation-tolerant Chroococcidiopsis, and 25 distinct genomes of the polyextremophilic phylum Deinococcus/Thermus (Direito et al., 2011). Also present in the paleochannel metagenomes are a diverse range of eukaryotes, including fungi such as Ascomycota, algae such as Streptophyta and Chlorophyta, and unclassified eukarya (mainly algal protists and choanoflagellates).
3.2. Illumina 16S rRNA gene sequencing revealed a rich bacterial community in the Hanksville paleochannels
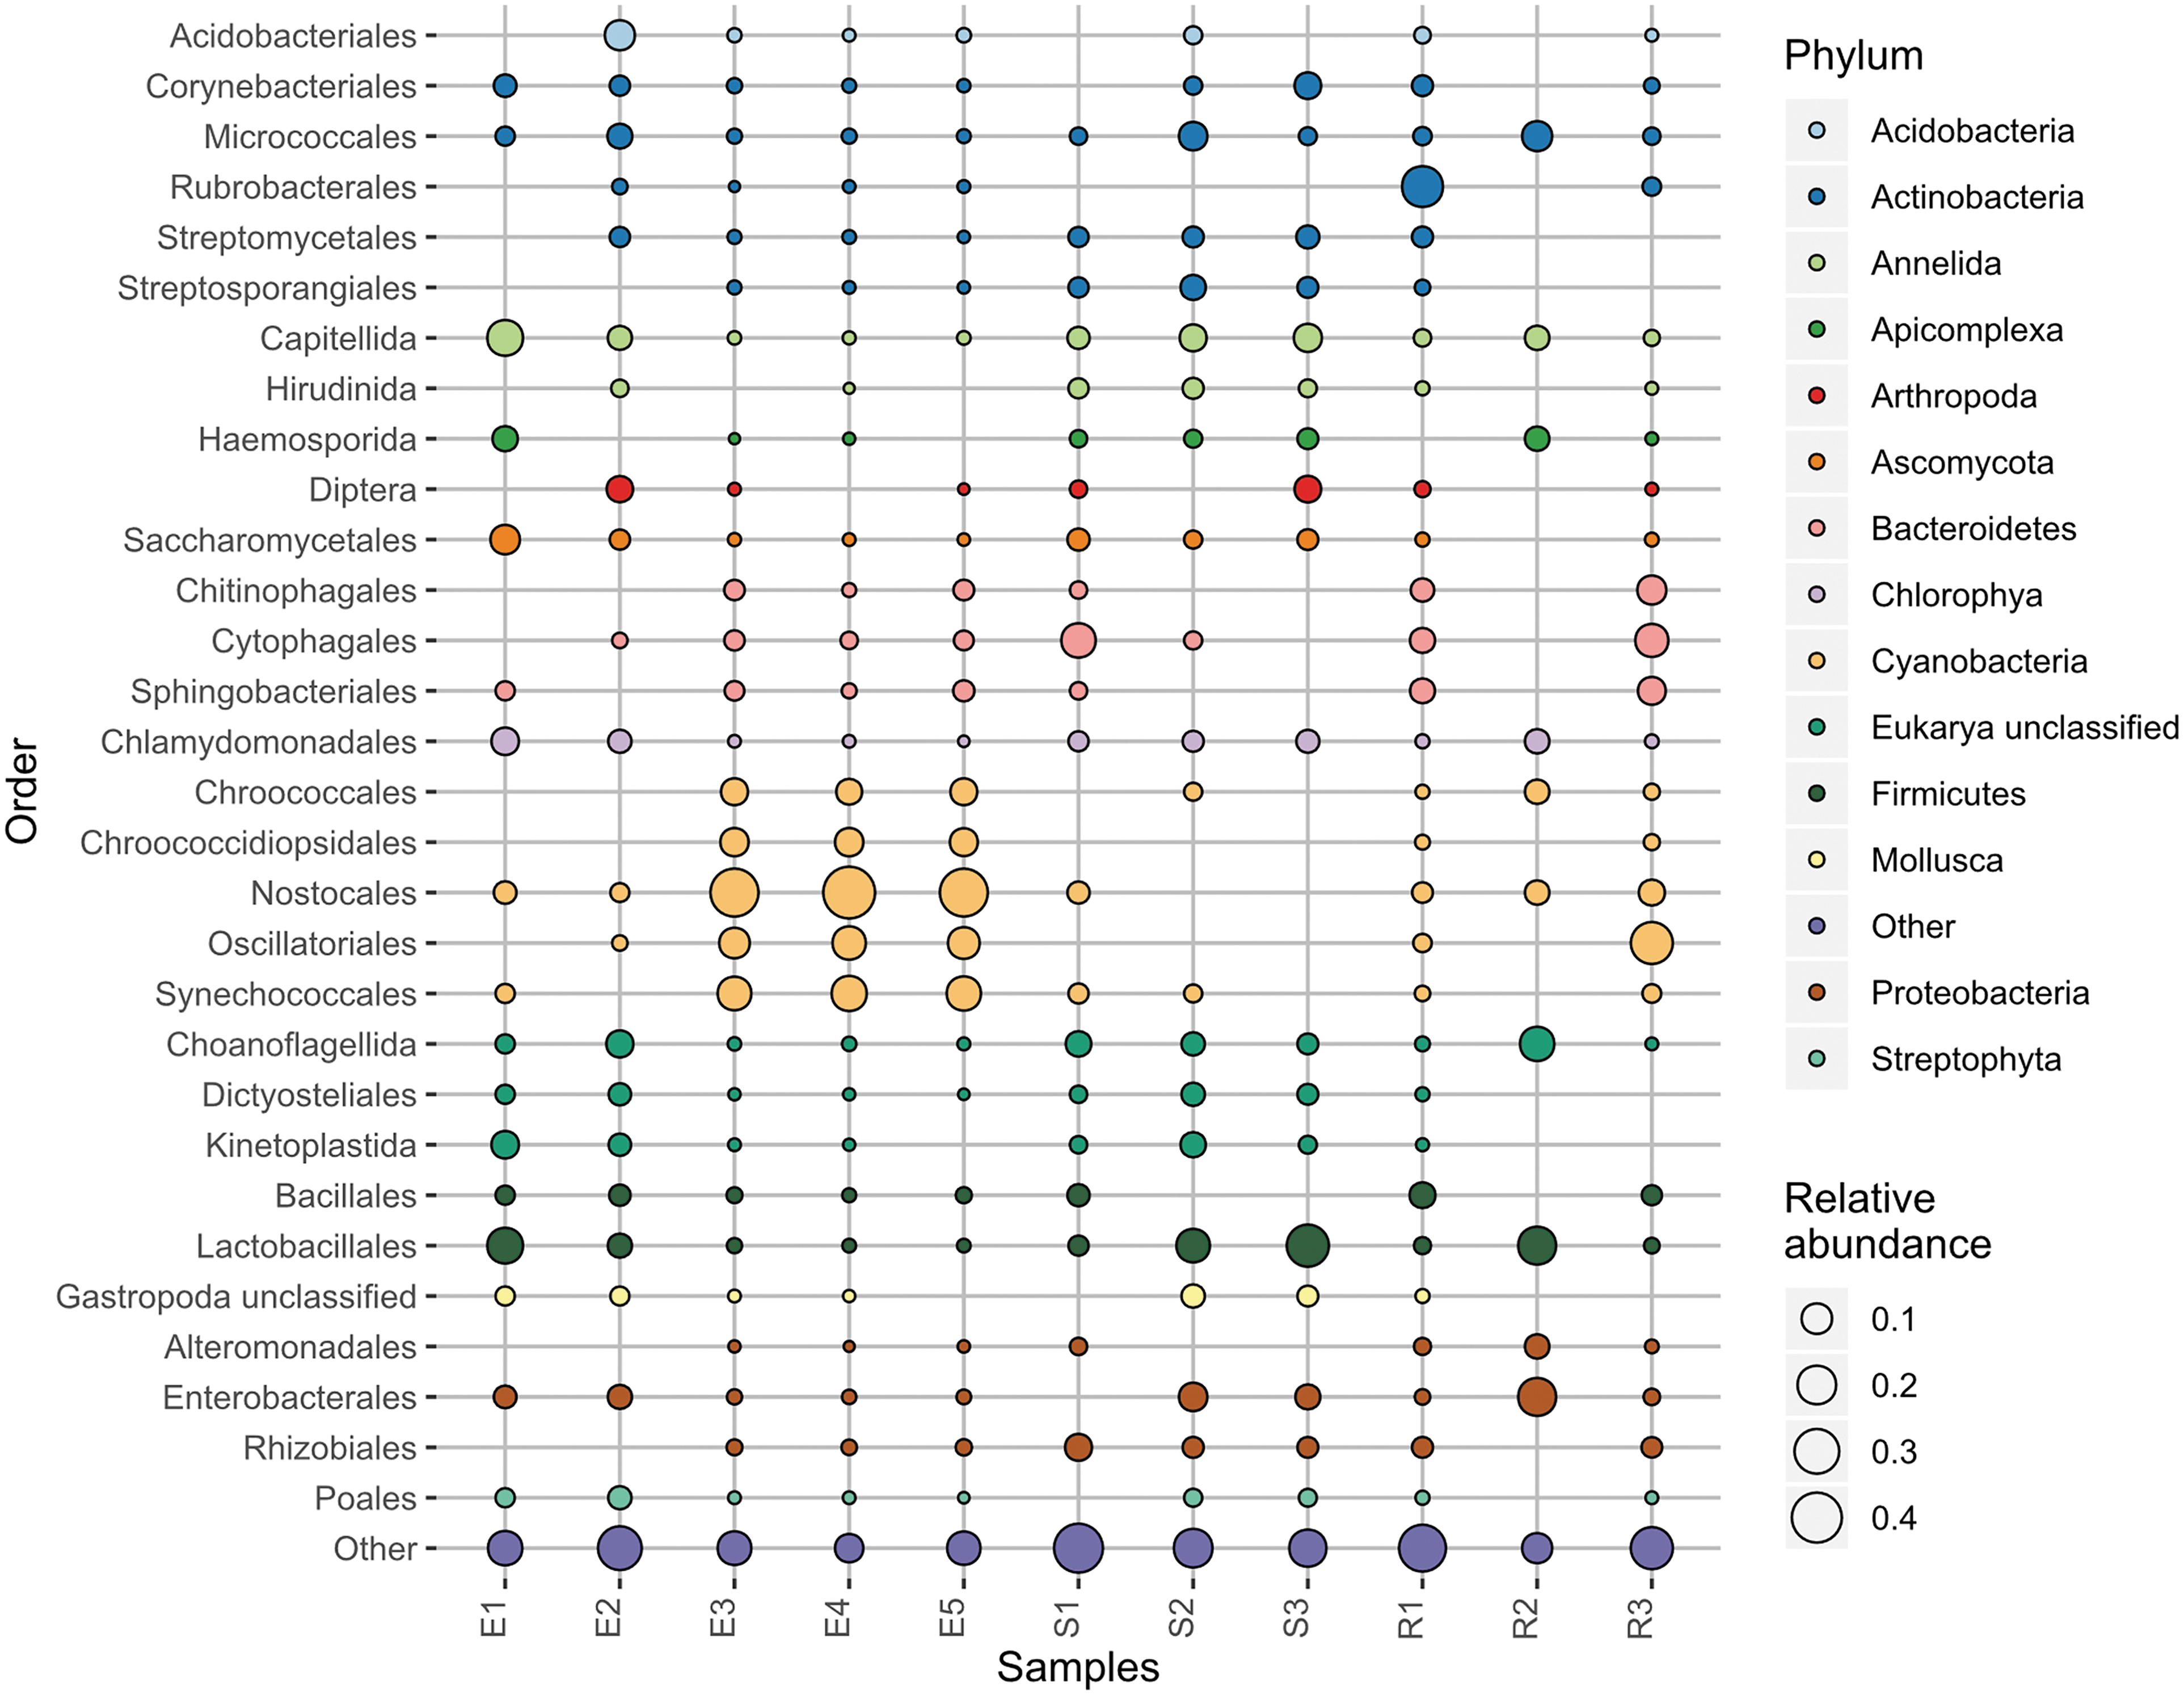
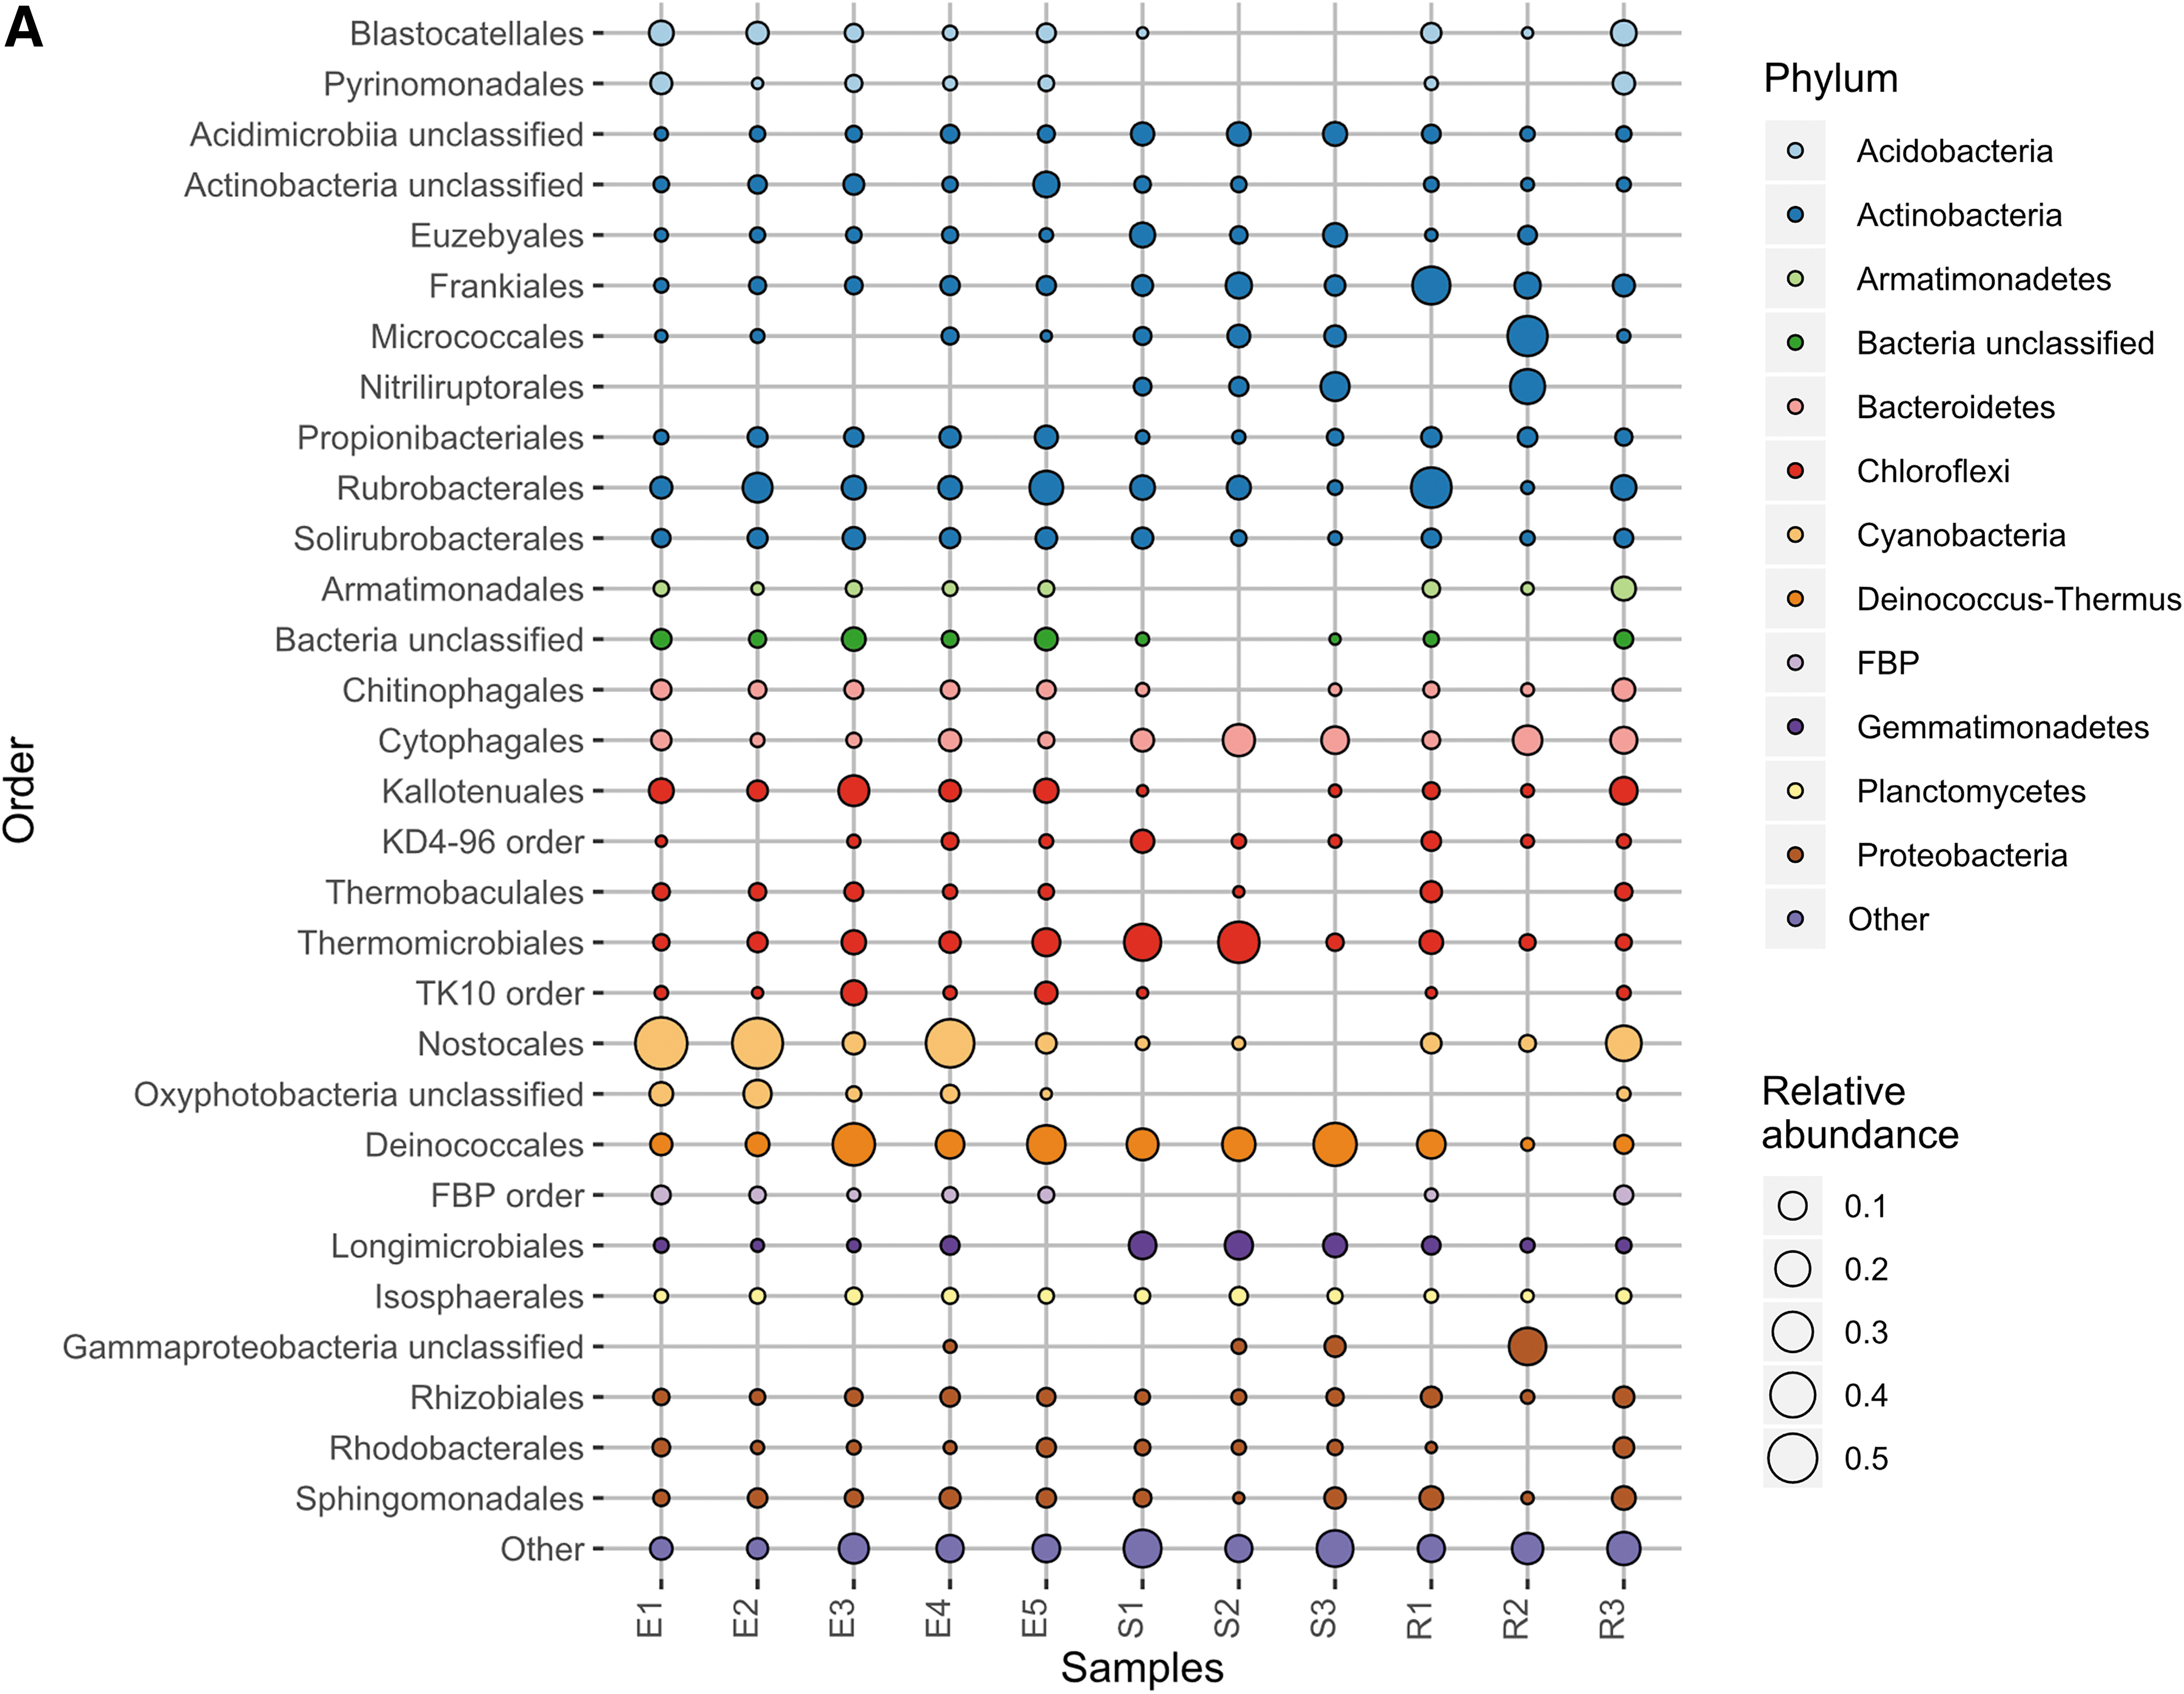
Given the large proportion of bacteria detected in the MinION sequencing data, we performed 16S rRNA gene sequencing to better illuminate the bacterial diversity present and provide a comparison with the MinION results. This comparison can be seen in Fig. 3A and B. Sequencing the 16S rRNA gene content of the 11 samples yielded 2,478,778 reads of mean length 253 bp. One thousand four hundred thirty-five OTUs were generated after clustering at 97% similarity. The most abundant phyla detected among these OTUs were Actinobacteria, Cyanobacteria, Proteobacteria, Deinococcus/Thermus, and Chloroflexi (Fig. 3A), and these were detected in all samples. In particular, Actinobacteria comprised ≥5% of OTUs in all samples.
Like the MinION results, three of the endolith samples were strongly dominated by Cyanobacteria (particularly Nostocales) (≥44%), but were samples E1, E2, and E4 (rather than E3, E4, and E5). Unlike the MinION data, E3 and E5 contained higher proportions of Actinobacteria and Deinococcus/Thermus (mostly Deinococcales) (≥13%) instead of Cyanobacteria. Sediment and rock samples were dominated by Actinobacteria, Proteobacteria, and Chloroflexi. The endolith, sediment, and rock samples showed some differences in taxonomy, which was visualized with a weighted UniFrac PCoA of the 16S data (PERMANOVA: pseudo-f statistic = 2.89990; p-value = 0.01905) (Anderson and Walsh, 2013) (Fig. 4). The endoliths appear to cluster solely with other endolith samples (E1, E2, and E4 vs. E3 and E5), demonstrating the closer phylogenetic relationship within the endolith samples.
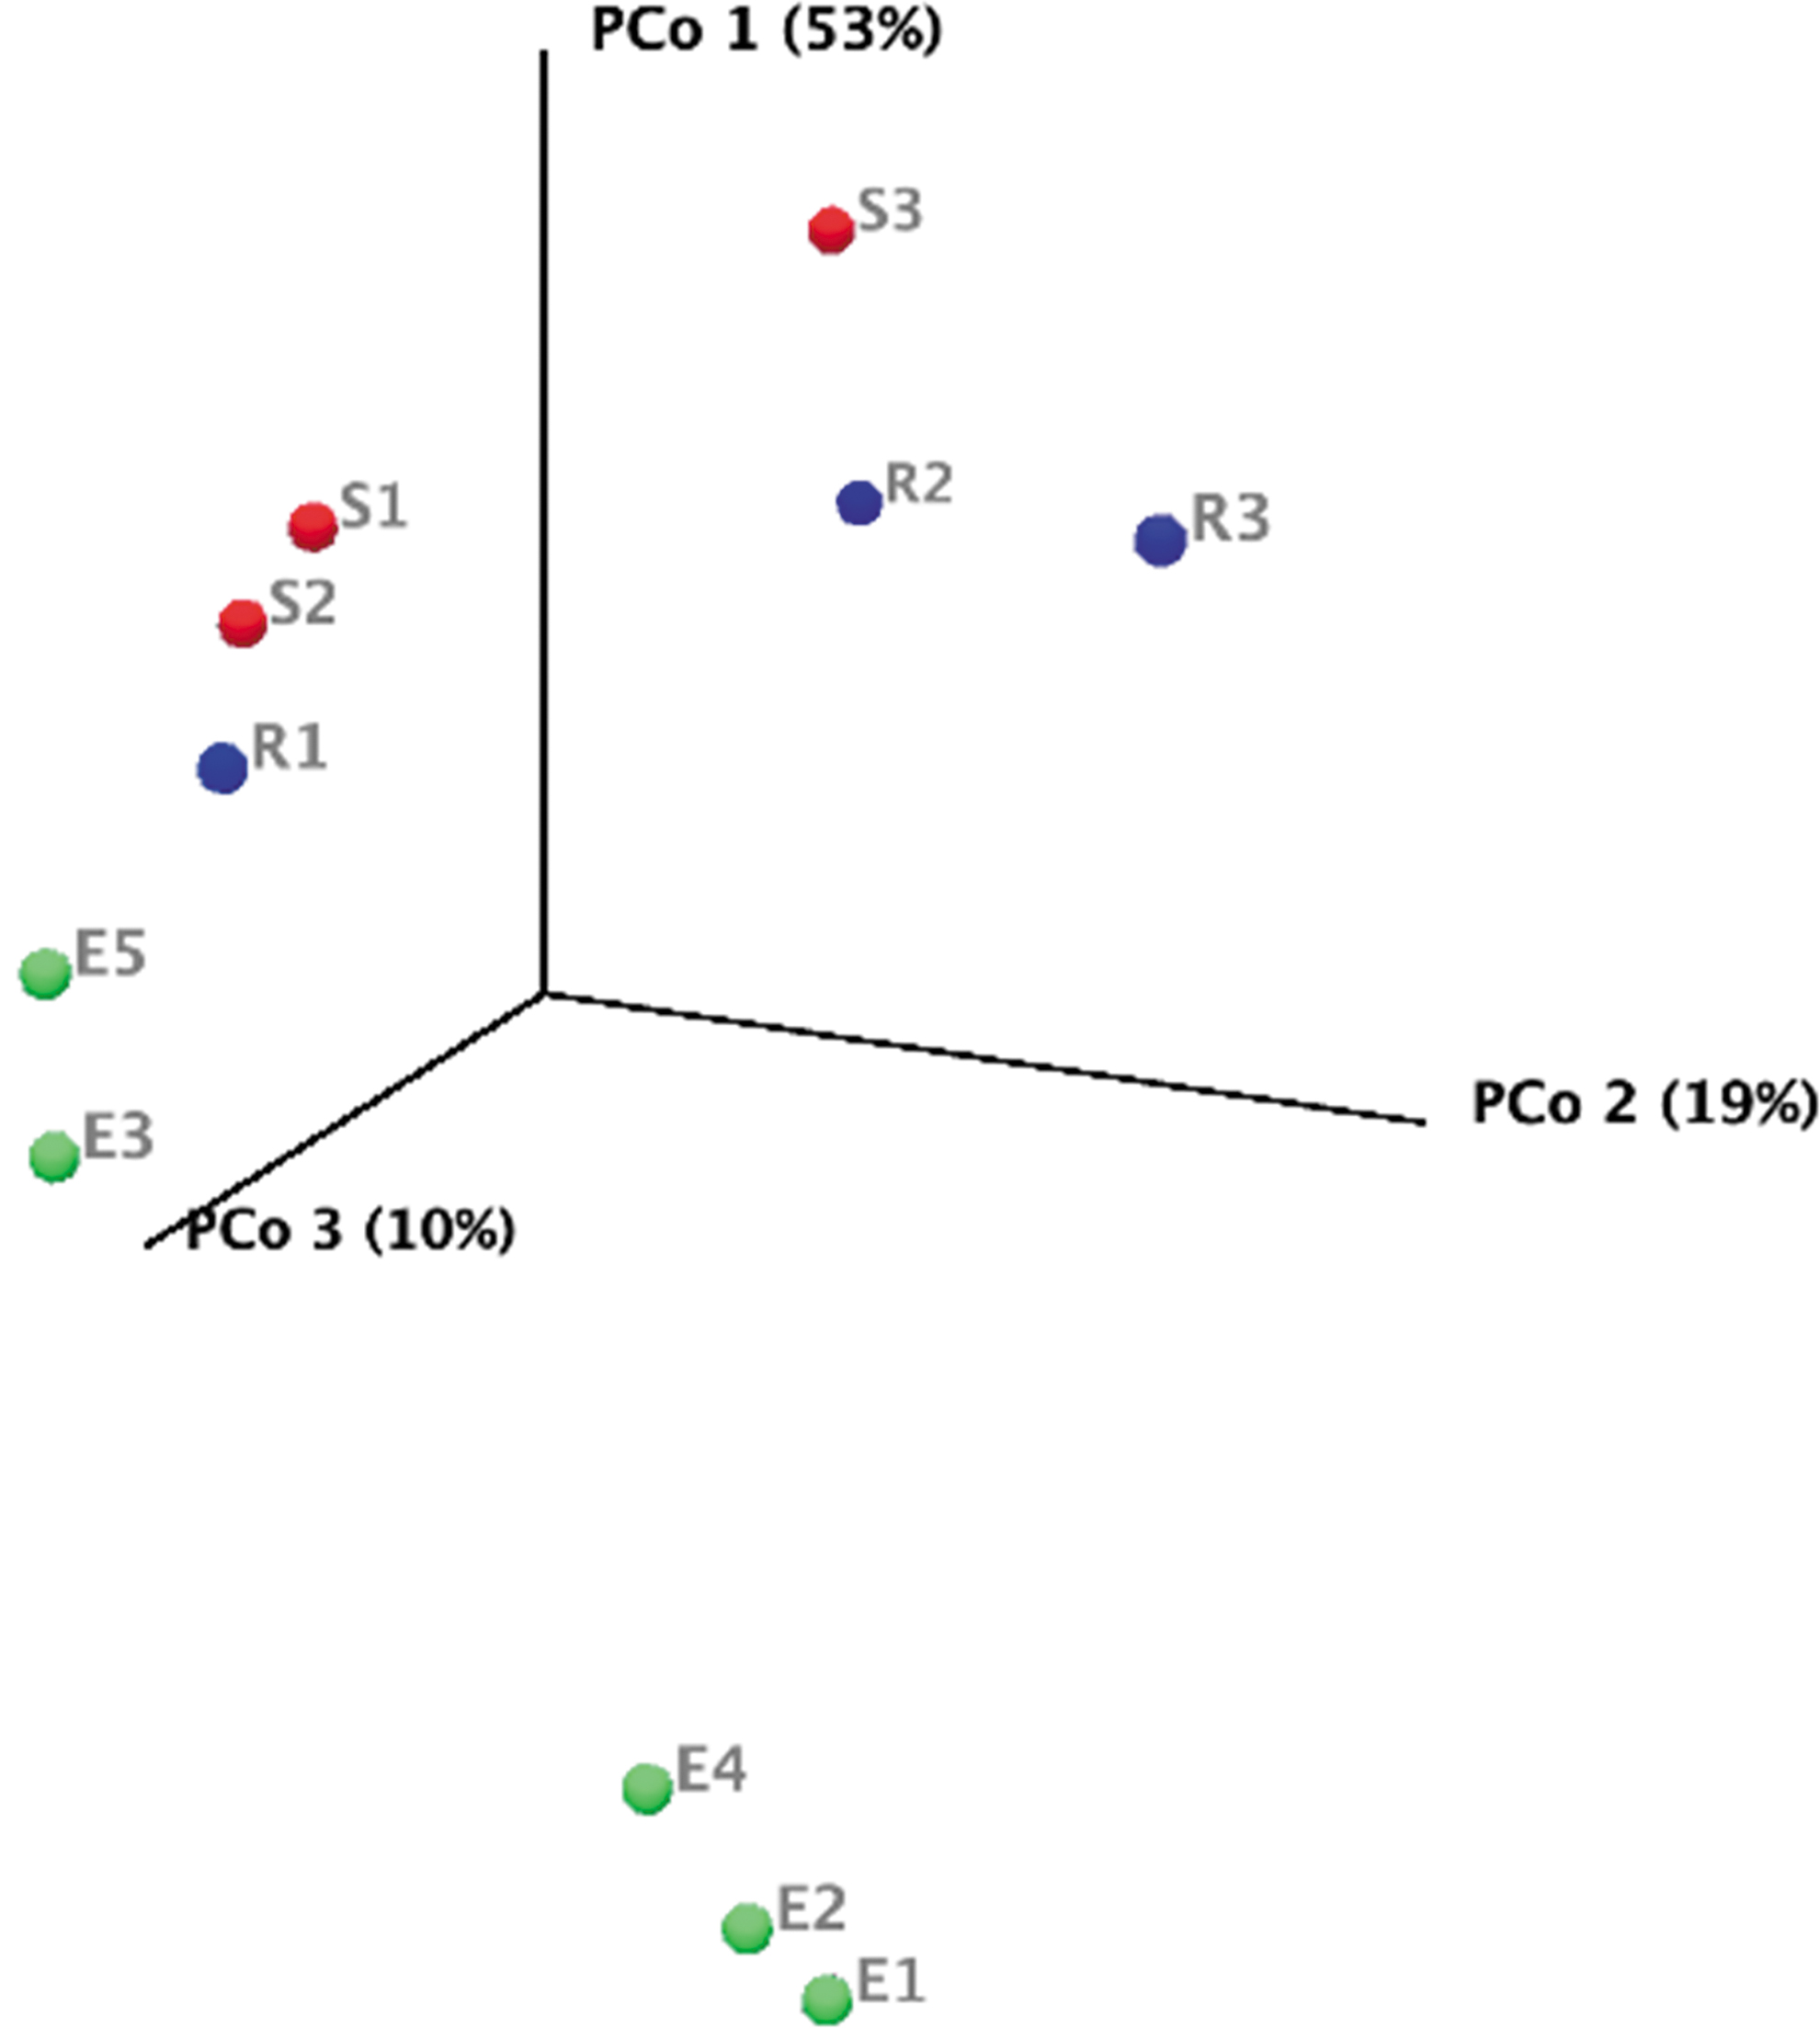
Weighted UniFrac PCoA of the 16S rRNA sequencing data of the Hanksville paleochannels. Samples are colored by type: endoliths in green (E1, E2, E3, E4, and E5), sediment in red (S1, S2, and S3), and non-endolith rocks in blue (R1, R2, and R3). The variation between samples is expressed as percentages along each axis. PCoA, principal coordinates analysis.
3.3. Determination of putative DNA detection limits for MinION sequencing
We used high-quality DNA from the endolith sample E4 to determine prospective DNA detection limits of MinION sequencing (Table 2; Fig. 5). We began our detection limit trials at 0.110 ng of DNA, a tenth of the minimum recommended input from ONT. Sequencing 0.110 ng of DNA from E4 yielded 253,188 total reads, nearly 26 times more than when 4.04 ng of DNA from this sample was sequenced. This is likely due to the use of R9.4 FLO-MIN106 flow cells rather than R9.5 FLO-MIN107 flow cells. R9.5 chemistry was initially recommended during our metagenome sequencing but has since been advised for only 1D2 double-strand sequencing by ONT (1D single-strand sequencing was used in this study). We subsequently tested 0.0408, 0.0106, and 0.00106 ng of DNA. Total read number dropped with input concentration, as expected, and the metagenomes produced during these trials are relatively similar (Fig. 5).

Detection limit trials with endolith sample E4 at the phyla level. The first column “E4” is the same data presented in Fig. 2. Taxonomy and abundance change with input DNA, and the final 0.001 ng trial bears little resemblance to E4's original community composition.
Cyanobacteria are the dominant phylum, followed by Proteobacteria and Bacteroidetes. Other phyla become more prominent as input DNA decreases and Cyanobacteria are completely undetected in the final 0.00106 ng trial. We also determined whether the MinION would produce a false positive with no DNA present. Sequencing nuclease-free water containing no DNA produced 121 reads, likely as a result of barcode adapter dimers and PCR amplification of these dimers. None of these reads were classified by JGI IMG/M ER.
We also examined the quality score distribution of this run, compared with the other DNA inputs in the detection limit trials (Supplementary Fig. S1). PHRED score is a common metric of sequence quality (Manley et al., 2016) and decreases strongly with DNA input in our study, with a seemingly random distribution in our run containing no DNA. Low sequence number, lack of classification, and random quality score distributions are therefore strongly indicative of a run in which no environmental DNA is present.
3.4. Powder XRD revealed a quartz-rich environment
The XRD patterns of the Hanksville paleochannel samples are dominated by quartz (Supplementary Table S1). Many samples also contain minor chemical sedimentary minerals (gypsum and calcite) and a phyllosilicate component identified in most cases as montmorillonite. The diffraction patterns for endolith samples E2, E3, and E4 contain only quartz, while endoliths E1 and E5 also exhibit traces of calcite and albite (possible Ca-rich), respectively. Regolith samples S1 and S2 display similar mineralogy, with minor albite (Ca-rich) and montmorillonite components. Regolith S3 is more heterogenous and contains calcite, gypsum, albite (Ca-rich), and montmorillonite. The non-endolithic rock samples R1, R2, and R3 are diverse; R2 is composed of minor components of magnesian calcite, carbonate-fluorapatite, and nontronite. R1 contains montmorillonite, gypsum, and apatite-(CaCl), while R3 has a minor calcite component.
3.5. Reflectance spectra showed hydrated minerals and some organic features
The reflectance spectra of all samples are dominated by absorption features characteristic of hydrated mineral phases (Fig. 6). Prominent absorption features include overtones and combinations of H2O and OH− stretches and bends occurring at ∼1400 nm (OH−), ∼1900 nm (H2O and OH−), and a combination of vibrational stretching and bending of Al2OH at ∼2220 nm. The shape and position of the main ∼1400 nm, ∼1900 nm, ∼2200 nm (Al-OH), and 2350 nm (Mg-OH) features in the samples provide insights into the hydrated and sheet silicate phases present.
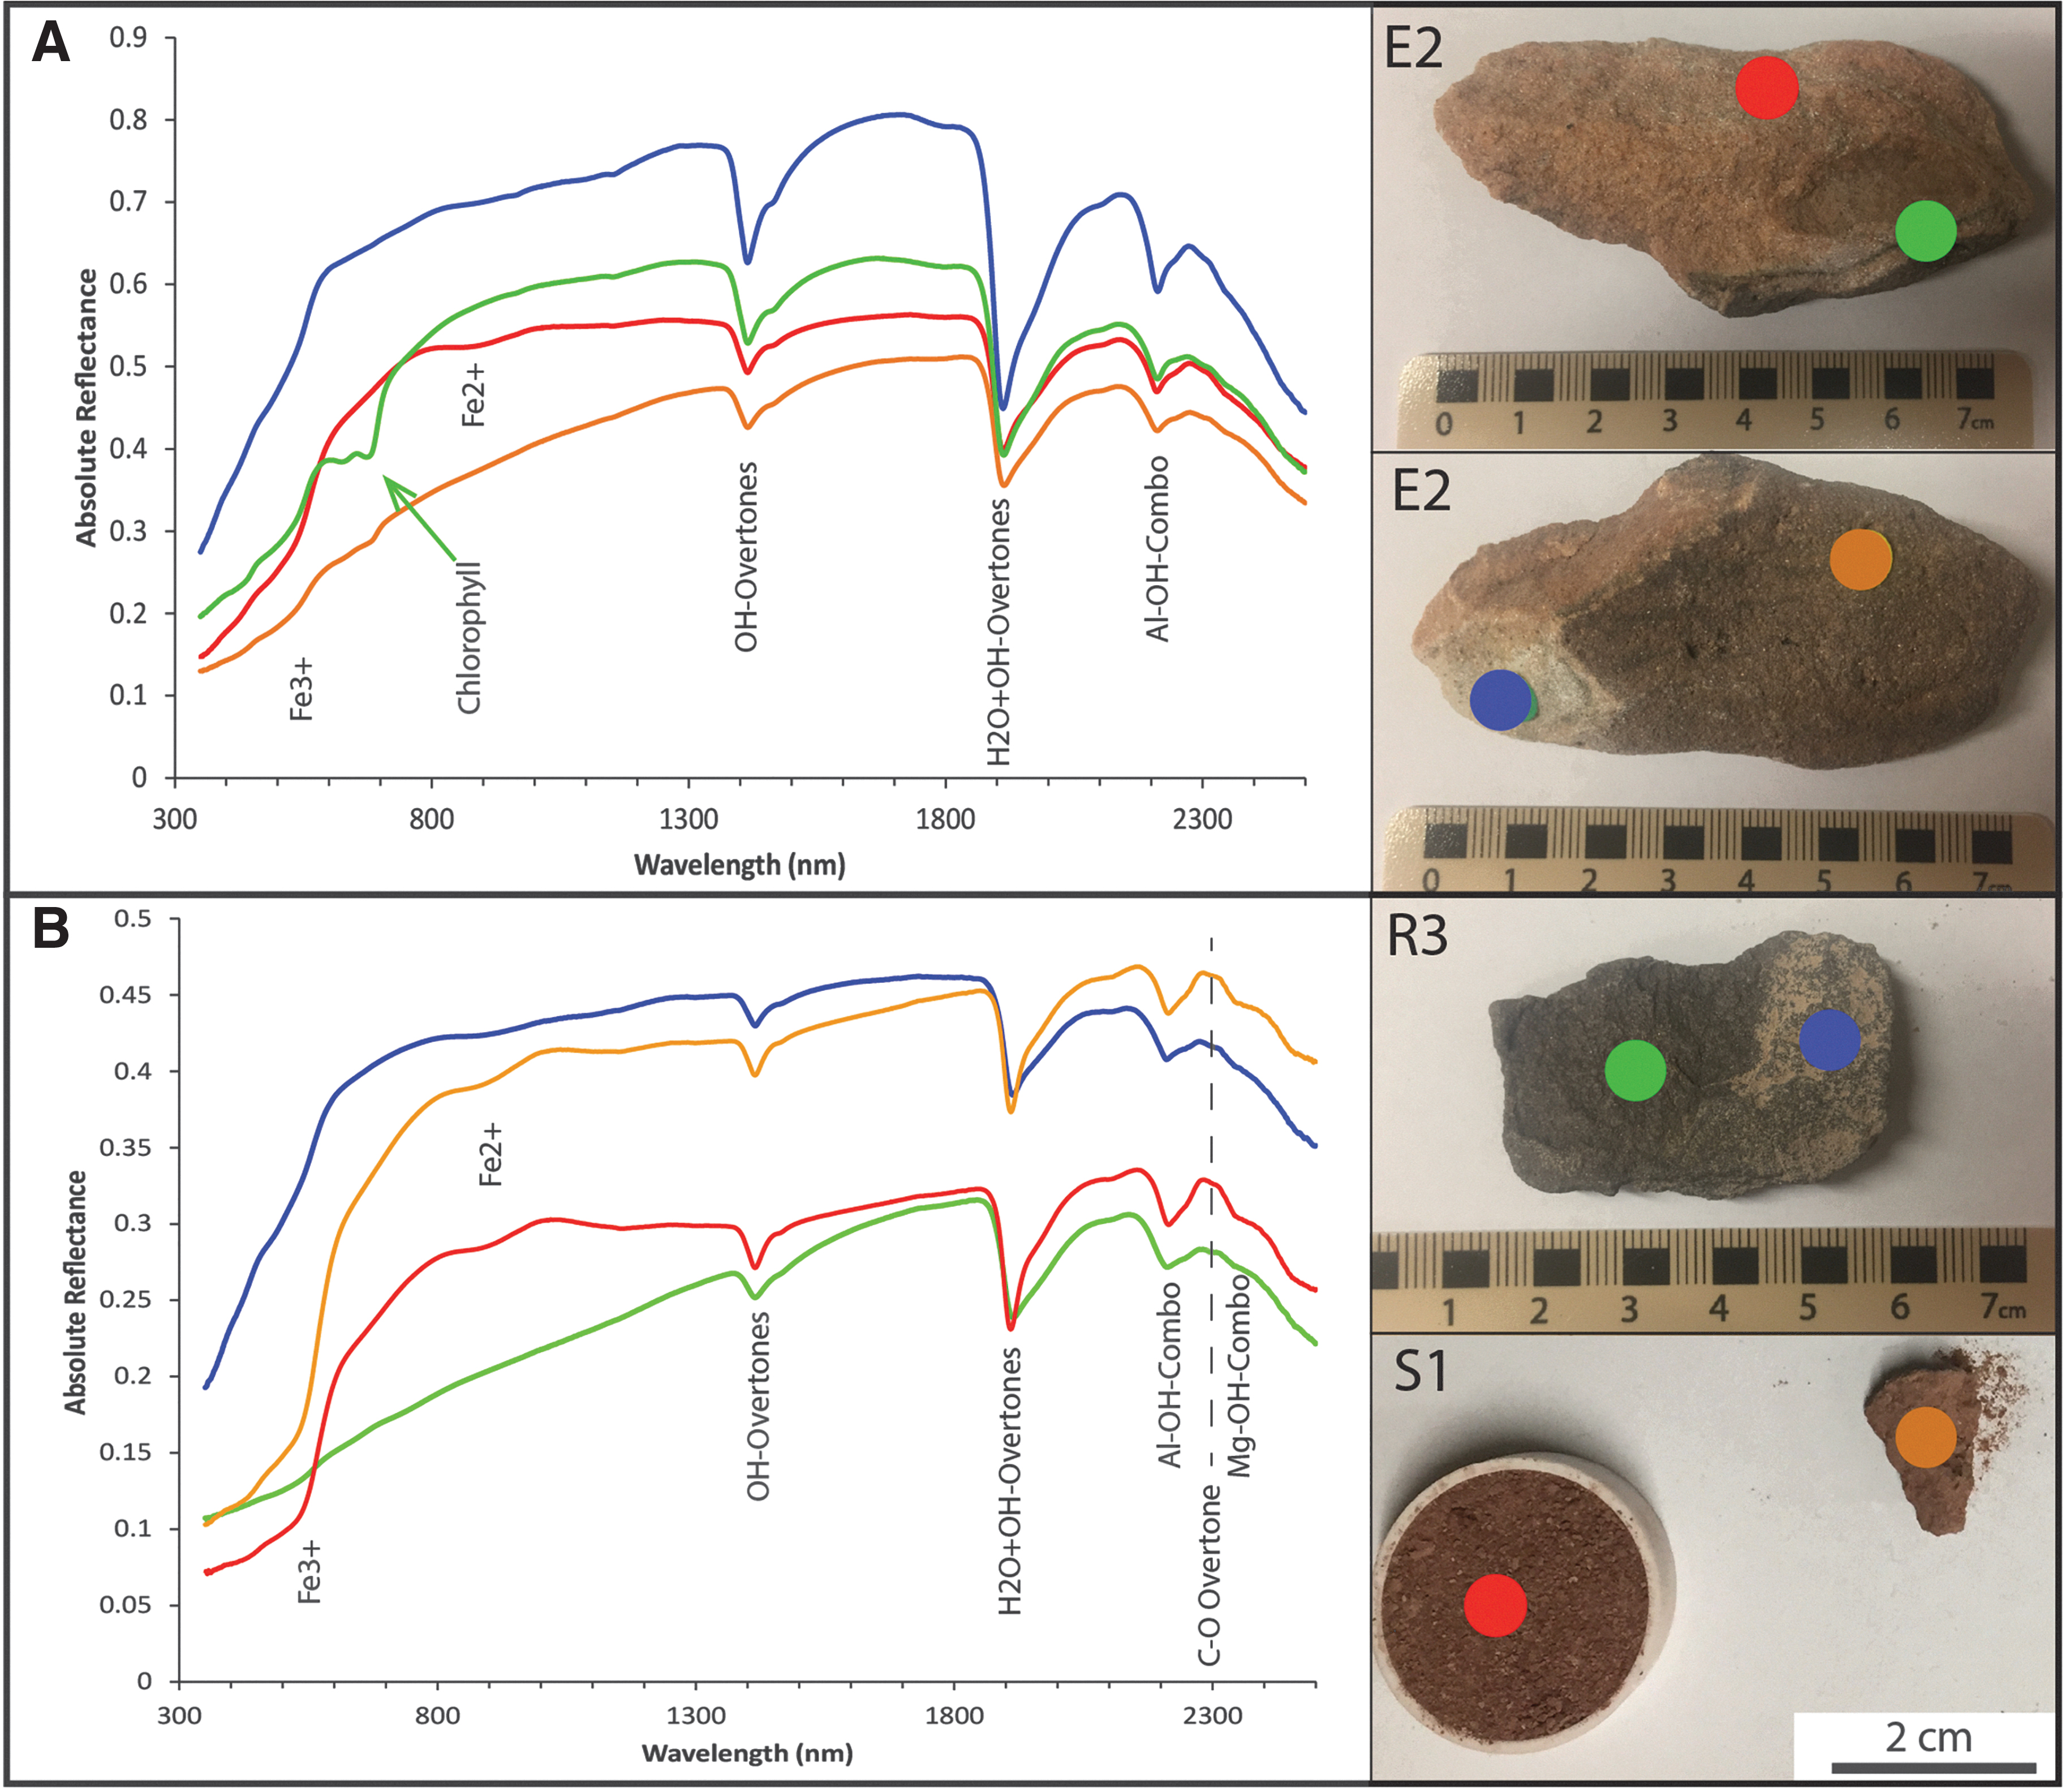
Reflectance spectra of representative samples from the Hanksville paleochannels with major absorption features labeled.
The presence of ∼1400 nm and ∼1900 nm bands indicates that both OH− and molecular water are present in the samples (Cloutis et al., 2006). The position, shape, and depth of these water features and the ∼2200 nm (band center at ∼2212 nm) feature indicate that the bulk of the samples have spectra characteristic of montmorillonite (Clark et al., 1990; Bishop et al., 2008). The weak feature observed in multiple samples at ∼2300 nm is a C-O feature due to the second overtone of a CO2 asymmetrical stretch and signifies carbonate minerals (Fig. 6B) (Clark et al., 1990). This position is indicative of carbonate chemistry, and in these samples supports the presence of calcite. Absorption features of Fe-bearing oxyhydroxides such as goethite at ∼500 nm, ∼900 nm, and ∼1150 nm are also evident, as is the characteristic drop in reflectance below ∼1000 nm due to charge transfers in Fe-bearing minerals (Crowley et al., 2003).
Organic features are also present, primarily in samples containing visible endoliths (E1, E2, E3, E4, and E5). These samples exhibit a characteristic absorption band at 670 nm, a sharp increase in reflectance (“chlorophyll bump” or “green peak”) preceding this feature, and an overall drop in reflectance below ∼800 nm (“red edge”) that are all diagnostic of chlorophyll a (Rhind et al., 2014; Stromberg et al., 2014). A small peak at ∼400 nm can be attributed to the presence of porphyrins, resulting either from the degradation of chlorophylls or as a component of various cytochromes (Berg et al., 2014). A broad band at ∼465 nm can be indicative of either carotenoids (Berg et al., 2014) or NADPH (Ammor, 2007). A generic C-H overtone at ∼1750 nm is also present, but N-bearing molecules can also affect absorption features in this region (Berg et al., 2014).
3.6. Prominent bands of chlorophyll and quartz are observed in the Raman spectra
The samples exhibit a large number of distinct Raman peaks at an excitation wavelength of 532 nm (Fig. 7), which was chosen to optimize biomolecule detection and mimic that of the RLS on ExoMars 2020 (Edwards et al., 2012; Rull et al., 2017). Prominent peaks associated with the mineralogy of the site are observed at ∼470 cm−1 (quartz) and ∼1006 cm−1 (gypsum) (Edwards et al., 2007). The non-endolith samples are dominated by background iron fluorescence, a common artifact in Fe-containing samples and a 532 nm source.
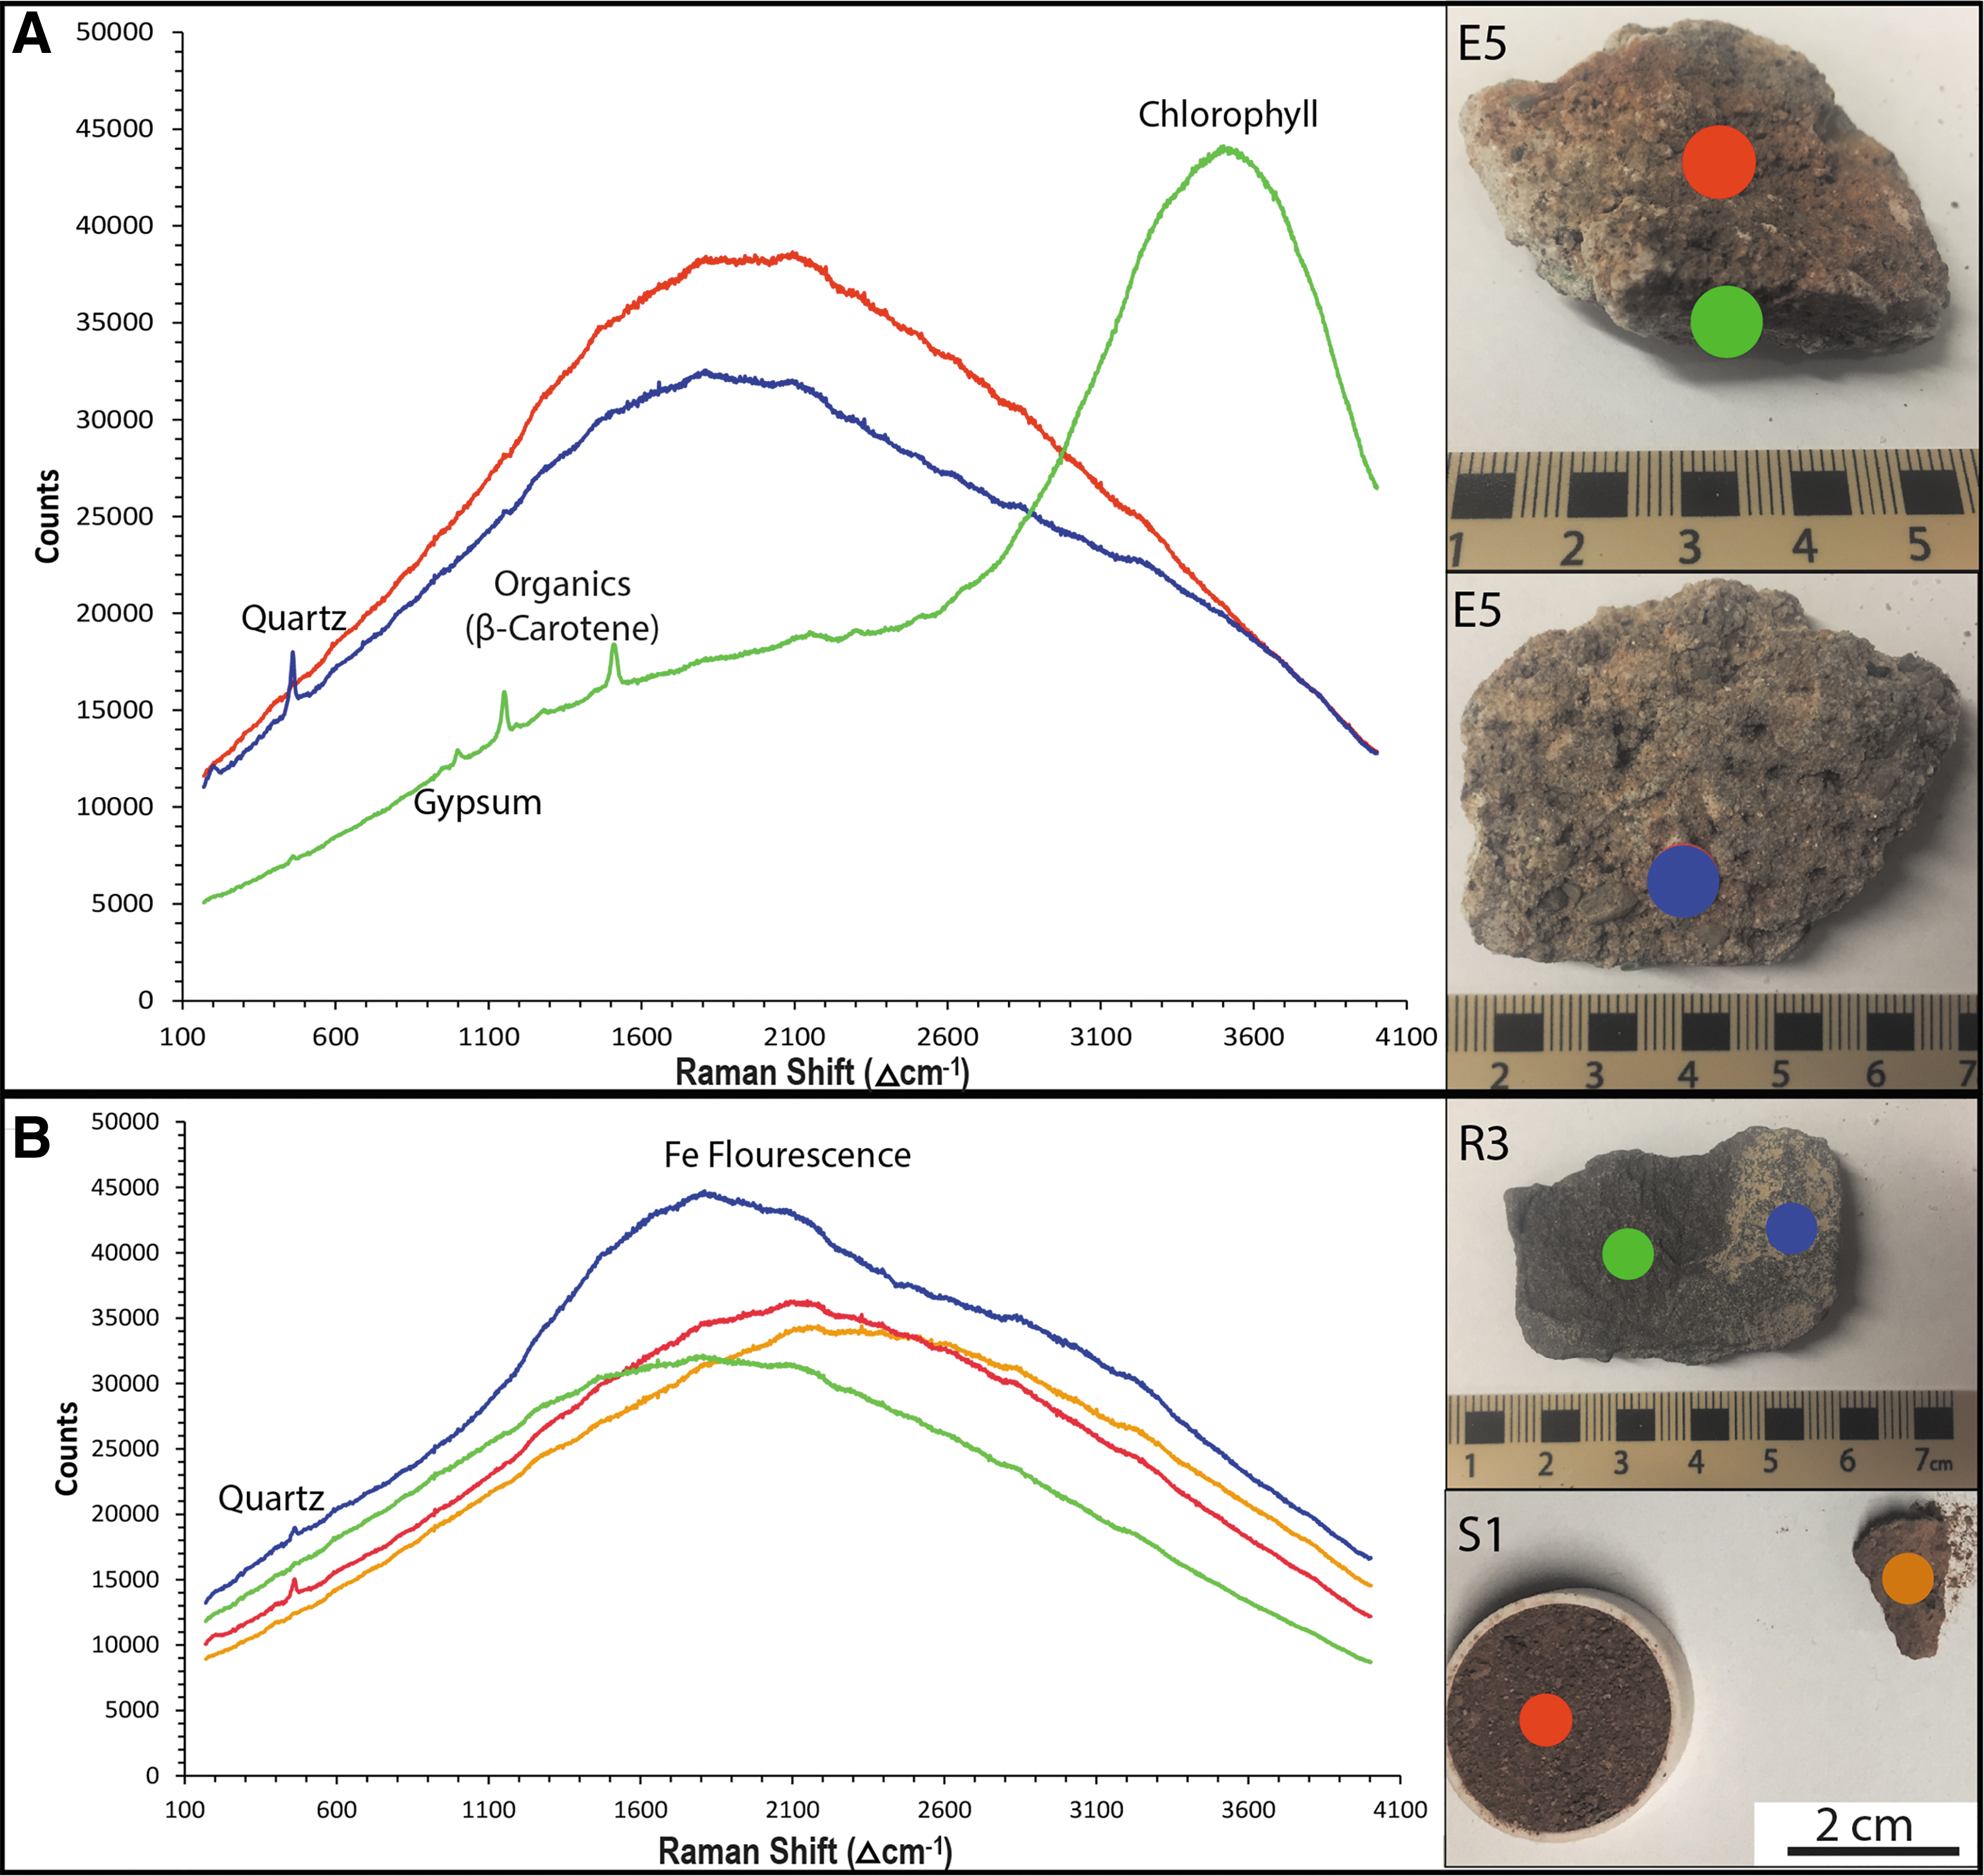
Raman spectra of representative samples from the Hanksville paleochannels with major features labeled.
Other noticeable features include a small peak at ∼930 cm−1, which is attributable to C-COO− stretching vibrations (Kim et al., 1987) or the presence of perchlorate (Jones et al., 1961; Ruan et al., 2006). Asymmetric stretching vibrations from CO2 are presented as a small band at ∼2340 cm−1 (Sandford and Allamandola, 1990; Feng et al., 2004). A peak at ∼1655 cm−1 is indicative of the presence of organics and represents the amide I band in classical Raman spectroscopy. This band is the result of asymmetric C = O stretching vibrations and an α-helical secondary structure in proteins (Thomas et al., 1987; Maiti et al., 2004).
The endolith-bearing samples also contain numerous features indicative of the presence of organic matter. A broad spectral feature at ∼3530 cm−1 signifies the presence of chlorophyll in these samples (Rhind et al., 2014). Peaks at ∼1155 and ∼1520 cm−1 are the result of C-C and C = C stretching vibrations, respectively, in various carotenoids, including β-carotene (Ellery et al., 2002; Edwards et al., 2005; Rhind et al., 2014), bacteriorhodopsin (Jehlička et al., 2013), bacterioruberin (Marshall et al., 2006), astaxanthin (Kaczor and Baranska, 2011), and lutein (Edwards et al., 2007). In addition, while the ∼470 cm−1 band is characteristic of quartz, this feature can also indicate the presence of parietin, a secondary UV-protectant pigment. Edwards et al. (2005) noted that the ∼470 cm−1 feature only appeared in samples from known parietin-containing environments and attributed its cause to parietin rather than quartz.
3.7. LDChip immunoassays detected a wide variety of potential metabolisms and taxa
Positive signals corresponding to antibodies against numerous bacterial, archaeal, and viral organisms were detected by the LDChip (Figs. 8 and 9). The strongest immunoassay signals corresponded to biomarkers associated with Actinobacteria (Streptomyces), Cyanobacteria (Aphanizomenon, Chroococcidiopsis), iron/sulfur bacteria from Acidithiobacillia (Acidithiobacillus), Nitrospirae (Leptospirillum), and crude environmental extracts from the Río Tinto that are rich in iron and sulfur.

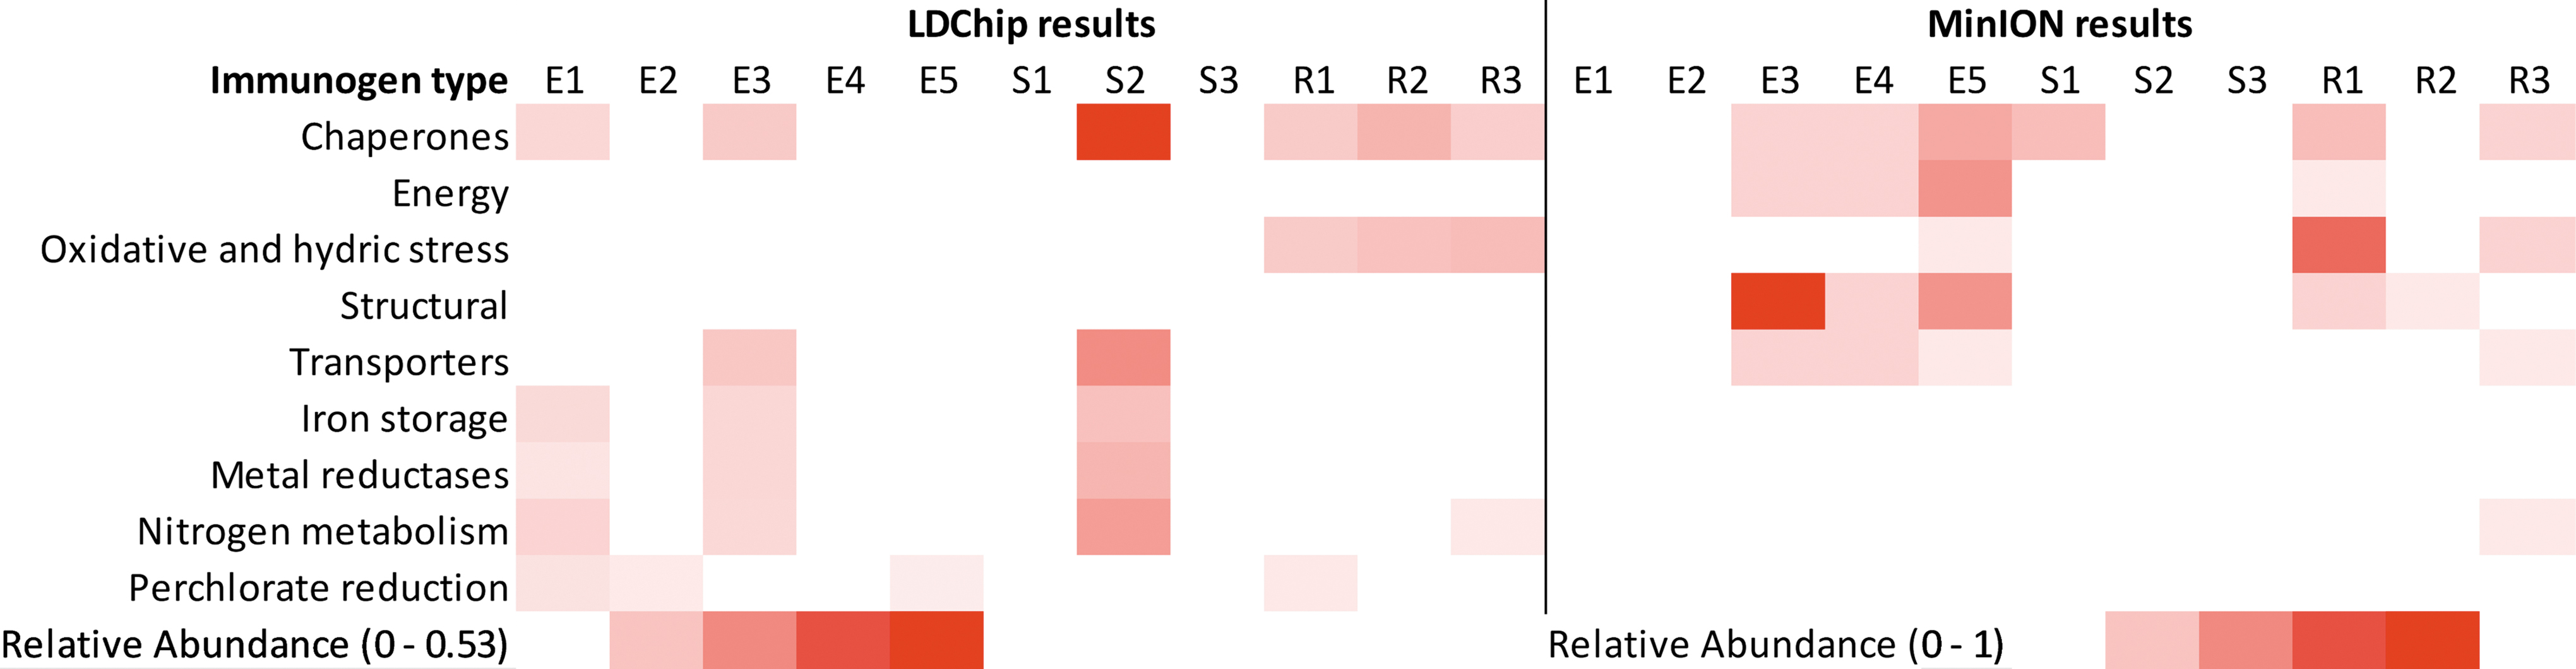
Heat map comparing positive LDChip and MinION results at the phylum level. Relative abundance, which represents the value of signal intensity corresponding to each positive antibody within the category with regard to the other categories and to the total signal intensity in the sample, was plotted in a scale from white (negative results) to red (maximum). The maximum value was 0.53 for LDChip results. Total number of MinION sequences corresponding to the listed antibodies were counted and are presented on a scale from 0 to 1. LDChip, Life Detector Chip.
Heat map comparing positive LDChip and MinION results for specific protein detection. Relative abundance, which represents the value of signal intensity corresponding to each positive antibody within the category with regard to the other categories and to the total signal intensity in the sample, was plotted in a scale from white (negative results) to red (maximum). The maximum value was 0.53 for LDChip results. The total number of MinION sequences corresponding to the listed antibodies was counted and presented on a scale from 0 to 1.
Proteins relating to common microbial functions (e.g., chaperones HscA2 and HtpG) were readily detected, as well as more specialized functions, such as nitrogen metabolism (e.g., NifD and nitrate reductase) and hydric stress (e.g., DhnA). The LDChip also detected proteins related to perchlorate reduction in samples E1, E2, S1, and S3. Archaeal markers associated with halophiles (Haloferax) and methanogens (Methanobacterium) were detected in samples E3, E4, S1, S2, S3, and R1, respectively.
4. Discussion
4.1. MinION metagenomes complement and support XRD data, reflectance spectra, Raman spectra, and LDChip immunoassays
Here we have shown that the MinION is capable of detecting a wide variety of microorganisms from all three domains of life, as well as viruses (Fig. 2). Our results are consistent with a previous study by Direito et al. (2011), who conducted a 16S rRNA survey of the Mars Desert Research Station (MDRS) soil, an area adjacent to the Hanksville paleochannels. Direito et al. (2011) found overall high diversity in the bacterial and eukaryal populations of this area, and low archaeal diversity.
Bacteria dominated the total microbial content in our study, as well as in a PCR-based detection survey of the MDRS (Thiel et al., 2011). Strangely, we also detected Mollusca, Cnidaria, and Porifera. These organisms are not common laboratory contaminants, but Mollusca was present in the Direito et al. (2011) study where MinION sequencing was not used. Direito et al. (2011) noted the presence of a hill consisting fossil oyster shells in this area, signifying the marine history of this environment and indicating that these sequences are potentially naturally occurring.
Direct comparison of the bacterial taxa detected in both Illumina and MinION sequencing shows some overlap (Fig. 3A, B, respectively). In particular, Acidobacteria, Actinobacteria, Bacteroidetes, Chloroflexi, Cyanobacteria, Planctomycetes, and Proteobacteria were detected in proportions >15% for all reads in both runs. While shotgun metagenome data sets often reveal more diversity and more rare taxa in an environment (Poretsky et al., 2014; Ranjan et al., 2016), our 16S amplicons revealed more diversity in the Hanksville paleochannels than our shotgun MinION data. Specifically, the candidate phylum FBP was detected in 7 of our 11 samples in the amplicon data set but was completely absent in our MinION data. FBP is closely related to Armatimonadetes (Lee et al., 2013) and is a common member of extreme environmental consortia (Tahon et al., 2018).
Gemmatimonadetes was also a significant component of our 16S data set (mainly Longimicrobiales) but was detected only as small amounts of Gemmatimonadales in E3 and E5 in our shotgun data set. This discrepancy was also observed by Tessler et al. (2017), who found that <50% of phyla detected in 16S amplicon data sets were also found in shotgun data sets. Conversely, nearly all phyla detected in their shotgun metagenomes were also picked up in their amplicon data.
Inherent differences between these techniques can account for this, namely reduced database size for shotgun metagenomes and a higher proportion of reads mapped to unknown taxa in shotgun data sets (Tessler et al., 2017). Our study introduces additional challenges that can contribute to the lower diversity observed in our shotgun data: low read output and the MinION's inherently high error rate of ∼7.5–14.5% (Jain et al., 2017). As a comparison, Illumina sequencing has an error rate of <0.1% (Manley et al., 2016).
The LDChip and MinION revealed somewhat different microbial profiles, both phylogenetically and metabolically (Figs. 8 and 9). While both sets of data detected Cyanobacteria, Proteobacteria, Bacteroidetes, and Firmicutes, differences arose at subphyla levels. The intrinsic differences in each technique can account for these variations.
The groups detected by the LDChip can be very broad, while MinION sequencing is inherently specific to a certain gene or taxa. While the LDChip's polyclonal antibodies are raised to detect certain proteins and peptides, they might be also recognizing similar epitopes in other proteins or closely related taxa (Parro et al., 2011). In addition, the specific microorganism may have been present but not had the gene in question sequenced by the MinION. The LDChip can also detect dead microbial polymers (e.g., proteins and extracellular polymeric substances) even when neither cells nor DNA is present. This indicates the powerful complementarity of both techniques to detect a wide variety of microorganisms and different types of definitive biosignatures in an environment (proteins and nucleic acids).
XRD results (Supplementary Table S1), reflectance spectra (Fig. 6), and Raman spectra (Fig. 7) provide geological context for our MinION data and characterize the surrounding environment. LDChip results (Figs. 8 and 9) also supplement the MinION sequences through more targeted detection of specific molecular markers. Table 3 shows the complementary relationship between these methods.
Relationship Between MinION Sequences, X-Ray Diffraction Data, Reflectance Spectra, Raman Spectra, and Life Detector Chip Immunoassays
A feature is presented in the left column, and its presence, potential presence as microbial taxa, or resulting trait in the corresponding techniques is noted.
LDChip = Life Detector Chip; ND = not detected; SRBs = sulfate-reducing bacteria; XRD = X-ray diffraction.
The Hanksville paleochannel environment is quartz-rich, as all samples presented quartz as their major mineral detected by XRD. Quartz has been shown to support cyanobacterial desert communities in previous studies (Schlesinger et al., 2003; Warren-Rhodes et al., 2006; Lacap et al., 2011). This corroborates the dominance of Cyanobacteria in samples E3, E4, E5, and R3 in the MinION metagenomes, as well as the presence of Cyanobacteria in all samples in both the MinION and LDChip data. Raman spectra also revealed quartz as an ∼470 cm−1 peak.
Calcite was present as a minor mineral in the XRD spectra, and is known to be commonly precipitated by many types of environmental bacteria (Boquet et al., 1973; Castanier et al., 1999), including sulfate-reducing bacteria (SRBs) (Van Lith et al., 2003) and various species of Bacillus (Boquet et al., 1973). Bacillus was detected in our MinION sequences, as were SRBs from Desulfobacterales and Desulfovibrionales. The presence of SRBs was further indicated by genes involved in sulfate transport, sulfate/sulfur assimilation, and sulfur and sulfate metabolism (e.g., sulfate transport system permease and sulfate adenylyltransferase). The LDChip also detected Bacillus and SRBs among the Firmicutes, Deltaproteobacteria, and positive results for antibodies raised against crude environmental extracts from the Río Tinto that are rich in iron and sulfur.
Gypsum was in the samples, as indicated by XRD spectra and a Raman peak at ∼1006 cm−1 and gypsum itself a source of sulfate. It therefore could host the same SRBs and their associated protein groups. Gypsum is also conducive to the presence of archaeal and cyanobacterial halophiles (Oren et al., 2009; Jehlicka and Oren, 2013; Ziolkowski et al., 2013), supporting the detection of various Cyanobacteria and Halobacteria by the MinION and LDChip.
Iron was detected as Fe-bearing oxyhydroxides in the reflectance spectra and as background fluorescence in the Raman spectra. Iron is crucial for most bacterial metabolisms (Frawley and Fang, 2014), and Fe-oxyhydroxides are associated with both iron-oxidizing bacteria (Emerson et al., 1999) and iron-reducing bacteria (Luef et al., 2013). The LDChip exhibited positive results for antibodies raised against crude environmental extracts rich in iron and sulfur from the Río Tinto in all samples. Heme oxygenase was detected in our MinION data, as well.
Perchlorate may have been responsible for the ∼930 cm−1 feature in non-endolith Raman spectra, and perchlorate reductase was detected by the LDChip. Perchlorate comprises 0.5–1% of midlatitude martian surface soils (Hecht et al., 2009; Glavin et al., 2013), and perchlorate reduction genes indicate the presence of microorganisms that can tolerate perchlorate-rich soils and that could serve as models for martian life. Perchlorate can also be used as a terminal electron acceptor during anaerobic growth for perchlorate-reducing bacteria (Coates et al., 1999).
We also detected numerous signatures for biological pigments and other metabolisms. In the reflectance spectra, chlorophyll is presented as a characteristic absorption band at 670 nm, its preceding “chlorophyll bump,” and its trailing “red edge” (Rhind et al., 2014; Stromberg et al., 2014). Porphyrins are denoted by a small peak at ∼400 nm (Giovannetti, 2012; Berg et al., 2014), and a broad band at ∼465 nm can be indicative of carotenoids (Berg et al., 2014). Raman spectra also contain a strong chlorophyll feature at ∼3530 cm−1, and peaks at ∼1155 and ∼1520 cm−1 indicate the presence of various carotenoids, including β-carotene (Ellery et al., 2002; Edwards et al., 2005; Rhind et al., 2014), bacteriorhodopsin (Jehlička et al., 2013), bacterioruberin (Marshall et al., 2006), astaxanthin (Kaczor and Baranska, 2011), and lutein (Edwards et al., 2007). Parietin may also be denoted by a band at ∼470 cm−1 (Edwards et al., 2005).
The presence of microbial pigments is supported by both MinION and LDChip results, which detected Cyanobacteria in all samples. Specifically, genes encoding chlorophyll's photosystem I and II, protochlorophyllide reductase, β-carotene ketolase and hydroxylase, and protoporphyrin IX cyclase were detected by the MinION.
The LDChip indicated the presence of nitrogen metabolizing microorganisms, as did some MinION sequences, but they differed on the specific gene or protein. The LDChip detected NifD1 and nitrate reductase, while the MinION detected nifU and nirS. Together, the LDChip and the MinION were able to detect a wider variety of genes involved in the nitrogen cycle than either alone. The same is true for methanogenic microorganisms. Methanobacterium was detected by the LDChip, while Methanosarcina, Methanothrix, Methanolacinia, and Methanosarcinales were detected by the MinION.
Through this combination of multiple techniques, we have characterized this paleochannel environment as rich in quartz, calcite, and gypsum and able to host a wide variety of microorganisms, including numerous Cyanobacteria and SRBs. We can also infer these microbes' potential metabolisms, which include nitrogen cycling, sulfur cycling, methane production, and perchlorate reduction.
4.2. Putative MinION DNA detection limits and suitability for life detection
DNA is an ideal target in the search for life since it is unambiguous, nonspecific, and readily detectable with nanopore sequencing. Past meteoritic exchange between the Earth and Mars (Mileikowsky et al., 2000), as well as the abundance of carbon molecules in our Solar System (Pace, 2001), indicates a plausibility of organic-based biochemistry for potential martian life (Mustard et al., 2013b). However, an extremely important criterion for life detection in sample return and other space exploration missions is the ability to detect low biomass, such as that present in various Mars analog environments.
We have successfully shown that the MinION can detect DNA as low as ∼0.001 ng and that it will not produce a false positive when no DNA is present. This is further enforced by Pontefract et al. (2018), who showed that the MinION will not produce sequencing artifacts or noise signals that could be mistaken positive results. Producing sequencing data in real time is also a strong asset. Chiefly, it would enable the best selection of samples to cache for potential future return to Earth (e.g., those containing DNA or other nucleic acids) (Goordial et al., 2017). While the MinION's high error rate (∼7.5–14.5%) (Jain et al., 2017) and low classification rate (Edwards et al., 2016) can be problematic, a well-curated genetic database of clean room contaminants would enable the quick and efficient identification of contamination on missions.
Our comparison between Illumina 16S amplicon data and MinION shotgun metagenome data has shown that the MinION is able to reliably detect common lineages in an environment. Despite the possibility of shared heritage between terrestrial and potential martian organisms (Mileikowsky et al., 2000; Carr et al., 2017), the divergence between them would likely have occurred ∼4 billion years ago and any martian DNA would map outside of modern branches on the tree of life (Fairén et al., 2017). Therefore, any potential martian life would be an independent lineage and unable to be classified.
The MinION has been shown to sequence inosine in nucleic acid chains (Carr et al., 2017), demonstrating its ability to detect nonstandard DNA and indicating its potential to detect a wider variety of charged chains. This indicates its potential for life detection on non-Earth-like worlds, such as the gas giants and icy moons (e.g., Enceladus and Europa) (Mustard et al., 2013b). In fact, a solid state (i.e., nondegradable) nanopore sequencer for detection of organic linear polymers is currently being developed by NASA's Concepts for Ocean worlds Life Detection Technology program (Bywaters et al., 2017).
While low-input preparations for MinION sequencing (such as that used here) require a PCR step for amplification and adapter attachment, the primers used are nonspecific and instead are attached to nucleic acid strands via transposase mediation. This greatly reduces the inherent bias present in PCR and renders the overall protocol nonspecific for certain genes or organisms. However, this introduces the need for a thermocycler in MinION-based life detection. PCR is possible in space and is able to be miniaturized for deployment, as shown by the successful use of the mini-PCR system aboard the International Space Station during the Biomolecule Sequencing project (John et al., 2016), but it is one more instrument that needs to be automated and added to the sequencing process.
Our putative lower limit for sequencing is ∼0.001 ng of DNA, which corresponds to 100 cells/g (Dolezel et al., 2003; Raes et al., 2007), a biomass common in Mars analog environments (Niederberger et al., 2010; Goordial et al., 2016). This is based on an average bacterial genome size of 2–5 Mbp and ∼2.5–5 fg of DNA per genome (Dolezal et al., 2003; Raes et al., 2007; Goordial et al., 2017). However, this assumes 100% extraction efficiency, which is unlikely. The lower limit of DNA detection in a mission will be strongly dependent on the extraction method and must be chosen to optimize efficiency, as well as automation and miniaturization.
Sequencing preparation will also need to be automated and miniaturized before deployment. This could be accomplished with the Signs of Life Detector Sample Preparation Unit (SOLID-SPU) (Parro et al., 2011) for DNA extraction and the VolTRAX device by ONT for sequencing preparation. Both instruments require relatively little human intervention but would still require a microfluidic system to connect the components. We are exploring these options presently.
The techniques we have used here form a powerful suite capable of biosignature detection and environmental characterization. The MinION was able to directly detect unambiguous biosignatures in all sample types (endolith, regolith, and rock) from this paleochannel site analogous to martian sinuous ridges. There are prominent organic and water-related features in the XRD data, reflectance spectra, and Raman spectra, although by themselves these biosignatures are not conclusive and an abiotic origin cannot be precluded. Features indicating pigments are present but only in samples containing high biomass endoliths. The LDChip detected signals corresponding only to the antibodies present on the chip and this introduces a strong bias toward very specific protein groups and species. However, when these techniques are combined with the MinION, which can detect and sequence DNA from a wide variety of microorganisms in many types of samples and in very small amounts, the potential for biosignature identification and characterization is greatly increased.
5. Conclusion
We present this work as a proof-of-concept that MinION sequencing is a promising candidate for direct life detection in future space exploration missions. It can detect DNA down to ∼0.001 ng (and potentially lower). The MinION is small, portable, low cost, and can successfully detect life in many analog environments, including the Hanksville paleochannels. Dominated by bacteria, the taxa detected here were able to be linked to the surrounding environment with XRD data, reflectance spectroscopy, Raman spectroscopy, and LDChip immunoassays. We can infer the presence of Cyanobacteria and SRBs based on these complementary analyses. Nanopore technology is synergistic with these techniques, and together they provide a thorough characterization of this environment and its biosignatures. Although development of the MinION as a standalone instrument offers significant challenges (e.g., automated nucleic acid extraction and sample preparation), it represents a positive future for a direct life detection payload.
Footnotes
Acknowledgments
We thank Isabelle Raymond-Bouchard, Ianina Altshuler, and Esteban Góngora for their guidance throughout this project. We also thank the CanMars 2016 team for their support.
Author Disclosure Statement
No competing financial interests exist.
Funding Information
This work was funded by the Canadian Space Agency Flights and Fieldwork for the Advancement of Science and Technology (FAST) and Mars Sample Return (MSR) grants, the McGill Space Institute graduate student fellowship and postdoctoral fellowship, and the Spanish Ministry of Science project no. ESP2015-69540-R (MINECO/FEDER).
Supplementary Material
Supplementary Figure S1
Supplementary Table S1
Abbreviations Used
References
Supplementary Material
Please find the following supplemental material available below.
For Open Access articles published under a Creative Commons License, all supplemental material carries the same license as the article it is associated with.
For non-Open Access articles published, all supplemental material carries a non-exclusive license, and permission requests for re-use of supplemental material or any part of supplemental material shall be sent directly to the copyright owner as specified in the copyright notice associated with the article.