
Abstract
Glycine is an amino acid that has already been detected in space. It is relevant to estimate its resistance under cosmic radiation. In this way, a sublimate of glycine in α-form on KBr substrate was exposed in the laboratory to a 1.0 keV electron beam. The radiolysis study was performed at 40 K, 80 K, and 300 K sample temperatures. These temperatures were chosen to cover characteristics of the outer space environment. The evolution of glycine compaction and degradation was monitored in real time by infrared spectroscopy (Fourier-transform infrared) by investigation in the spectral ranges of 3500–2100, 1650–1200, and 950–750 cm−1. The compaction cross-section increases as the glycine temperature decreases. The glycine film thickness layer of ∼160 nm was depleted completely after ∼15 min at 300 K under irradiation with ∼1.4 μA beam current on the target, whereas the glycine depletion at 40 K and 80 K occurred after about 4 h under similar conditions. The destruction cross-section at room temperature is found to be (13.8 ± 0.2) × 10−17 cm2, that is, about 20 times higher than the values for glycine depletion at lower temperatures (<80 K). Emerging and vanishing peak absorbance related to OCN− and CO bands was observed in 2230–2100 cm−1 during the radiolysis at 40 K and 80 K. The same new IR bands appear in the range of 1600–1500, 1480–1370, and 1350–1200 cm−1 after total glycine depletion for all temperature configurations. A strong N-H deformation band growing at 1510 cm−1 was observed only at 300 K. Finally, the destruction cross-section associated to tholin decay at room temperature is estimated to be (1.30 ± 0.05) × 10−17 cm2. In addition, a correlation between the formation cross-sections for daughter and granddaughter molecules at 300 K is also obtained from the experimental data.
1. Introduction
There are 20 standard amino acids related to the bases of complex organic life, particularly to the human DNA. These amino acids are classified as essential or not essential; nine standard amino acids are considered as essential type, which means they are not produced by the organism itself and so should be got from external sources. Amino acids are characterized by the amino (NH2) and the carboxyl (COOH) groups, both linked to an α-carbon that is bond to hydrogen (H) and a radical (R). Figure 1 depicts a typical amino acid molecular structure.

Representation of amino acid structure.
The amino acid kind is determined by the aliphatic or aromatic chain associated to the radical R. The simplest amino acid occurs when R is a hydrogen atom H, which corresponds to NH2CH2COOH, called glycine (GLY). Due to the symmetry in relation to the α-carbon plane, in contrast with all other proteinogenic amino acids, only glycine does not have chiral properties. Indeed, just for glycine the R-H exchange does not change the amino acid molecular structure (Fig. 1).
In solid state, glycine may be amorphous (Maté et al., 2011) or polymorphic, that is, its structure appears in three crystalline configurations: α, β, and γ-forms (Perlovich et al., 2001; Boldyreva et al., 2003a, 2003b; Liu et al., 2008; Maté et al., 2011). In water solution, glycine naturally appears in its zwitterionic form (+NH3CH2COO−), although this configuration could also be observed in solid phase (Maté et al., 2011). Finally, in the gas phase, glycine is found at three different conformer arrangements (Ivanov et al., 1999).
The searching for the origin of life has always been a matter of great relevance; in particular, a major question is whether it may have occurred outside the Earth's boundaries. The space weather concept refers to the action of the space environment (interplanetary or interstellar medium) on surfaces of astrophysical bodies via ionizing sources of radiation (ultraviolet [UV] photons, electrons, and ions), promoting the alteration of these surfaces when exposed to these cosmic agents (Gold, 1955).
In this context, there is nowadays a great interest in radiolysis in the surface of ices existing in the Solar System, such as those of comets, natural satellites, or asteroids, due to the fact that prebiotic compounds (amino acids, for example) have been discovered in these bodies (Bennett et al., 2013; Muñoz Caro and Dartois, 2013). Particularly, glycine has already been discovered in comets (Elsila et al., 2009) and in objects such as meteorites (Pizzarello et al., 1991, 1994; Botta and Bada, 2002). In addition, there is tenuous detection evidence that glycine may be formed in interstellar molecular clouds (Kuan et al., 2003). However, no hard corroboration about the real presence of this amino acid in molecular cores has been registered so far (Snyder et al., 2005; Cunningham et al., 2007; Jones et al., 2007), although several theoretical models predict that glycine traces are able to be detected in cold and hot protostellar regions (Garrod, 2013; Jiménez-Serra et al., 2014). In that sense, laboratory researches have been performed to simulate and understand how this organic compound could be formed and preserved in such hostile environments.
Moreover, since the astrophysical medium and cosmic bodies are constantly under photolysis and charged particle processing (Bennett et al., 2013), the motivation to study energetic electrons as irradiation agents is mainly related to sources such as the solar wind (Bennett et al., 2013) and intense planetary magnetospheres, for example from Jupiter (Cooper et al., 2001; Paranicas et al., 2001; Patterson et al., 2012).
In terms of solar wind, the flux variation of photons, ions, and electrons from the Sun depends on the solar activities (maxima and minima) that occur every 11 years; in addition, this solar cycle may also affect the amount of photons and extra-solar charged particles that are able to penetrate into the heliosphere (Bennett et al., 2013).
The population of electrons in the solar wind can be classified into categories according to its energy range (Lin, 1998; Louarn et al., 2009; Wang et al., 2012). The core electrons form the bulk of thermal electrons with low energies (E < 60 eV) representing the major population (more than 90%). The halo electrons are considered suprathermal electrons with intermediary energies (60 eV ≤ E ≤ 1 keV) that correspond to less than 5% of the electron solar wind population. The super halo electrons with high energies (E > 1 keV) achieve only ∼1% of this population. Finally, there is a special class composed by few suprathermal electrons that are strongly aligned with the Sun's magnetosphere that are known as strahl electrons (Louarn et al., 2009; Wang et al., 2012).
According to Barnett et al. (2012), there are few works associated with electron beams of energies between 100 eV and 2 keV. They state that electrons in this range of energy are able to reach few hundreds of nanometers in depth; on the other hand, low-energy electrons (<100 eV) would be responsible only for processes near the surface of the target (Barnett et al., 2012). In its turn, ion beams of the order of MeV penetrate as deep as 10 μm (Pilling et al., 2010; Bordalo et al., 2013).
In laboratory, analogs of astrophysical ices with different composition, temperature, and thickness have been submitted to ionizing radiation via keV electrons and UV photons to verify the occurrence of amino acid synthesis, in particular of glycine (Holtom et al., 2005; Lafosse et al., 2006; Kaiser et al., 2013), as well as of its natural precursors, such as: HCN, formamide, acetamide, and methyl formate (Chen et al., 2015; Henderson and Gudipati, 2015).
Inversely, various authors have also applied UV radiation, electron beams, and ion bombardment to obtain the glycine degradation itself (Guan et al., 2010; Gerakines et al., 2012; Pilling et al., 2013, 2014; Maté et al., 2014, 2015; Portugal et al., 2014). In some cases, how glycine could be shielded by H2O ice layers was verified (Gerakines et al., 2012; Maté et al., 2014, 2015). Different by-products of this amino acid irradiation processing were found at low temperature. CO2 and CH3NH2 were identified as products of UV photolysis, as well as CO and maybe CxOy oxides (Maté et al., 2014). For electron irradiation, CO2 and CO species were mostly observed (Maté et al., 2014, 2015; Pilling et al., 2014), in addition to OCN−and CN− (Maté et al., 2014, 2015) and probably amide groups from I to III (Maté et al., 2015). Considering the radiolysis by ions, the formation of OCN−, CN−, CO, CO2, and amide groups was also observed (Gerakines et al., 2012; Portugal et al., 2014).
In terms of morphological structure, it is important to point out that irradiated samples are submitted to modifications in their structural arrangements (Rothard et al., 2017). Crystalline materials may become amorphous, as well as the presence of porosity could be reduced, compacting the material (Rothard et al., 2017). In this sense, different models have been proposed to quantify the amorphization and compaction processes of irradiated materials by determining the associated cross-sections (Leto and Baratta, 2003; Dartois et al., 2015; Mejía et al., 2015; de Barros et al., 2016).
Herein, for the first time to our knowledge, the compaction and destruction cross-sections are determined for α-glycine irradiation by 1.0 keV electron beam at 40 K, 80 K, and 300 K. By monitoring the electron impact of radiolysis of glycine as a function of temperature and fluence via the in situ Fourier-transform infrared (FTIR) technique, the appearance of new IR bands indicates the presence of amide II and III groups, as well as the CH3 distortion and CH2 scissor modes at all temperatures. Tholins could be associated to these new bands at room temperature; however, the irradiated samples at low temperature do not show evidence of tholin formation, indicating that these new bands should be a consequence of condensation processes on their surface. The evolution of OCN− (2165 cm−1) and CO (2136 cm−1) bands was monitored during the radiolysis process at 40 K and 80 K. The absence of CO2 bands as an ordinary by-product was unexpected.
The experimental setup is presented in Section 2, including the X-ray diffraction (XRD) and FTIR technique descriptions. The theoretical models employed to determine the compaction, destruction, and formation cross-sections are described in Section 3. The main results obtained are shown in Section 4. Finally, in Section 5, a brief discussion on the results is performed, followed by conclusions.
2. Experimental Setup
2.1. Sample preparation
The sublimate of glycine was deposited simultaneously on three KBr substrates by using Edwards thermal evaporator equipment. About 1.1 × 10⁻² g of glycine powder (purity of 99%; BDH Chemicals) was placed on a molybdenum boat, through which ∼30 A flowed during 25 min at 3.0 × 10⁻⁶ mbar. The deposited glycine film thickness was determined to be ∼160 nm through a 6 MHz quartz crystal microbalance assisted by the FTM6 Edwards control unit. The glycine powder mean density is assumed to be equal to 1.58 g·cm−3 (Lange and Forker, 1967).
2.2 Radiolysis process
The experiment was carried out in an ultra-high vacuum (UHV) cylindrical stainless steel chamber (3.0 × 103 cm3) with the sample substrates sequentially at the temperatures: 40 K, 80 K, and 300 K. The mean residual pressure during each experiment was about 5.4 × 10⁻⁷ mbar for 300 K, 3.0 × 10⁻⁸ mbar for 80 K, and 2.1 × 10⁻⁸ mbar for 40 K.
Glycine films were individually irradiated by 1.0 keV electron beam produced by a Kimball electron gun (FRA-2 × 1–2). This electron gun is controlled by a modular power supply (EGPS-1011B; Kimball). To obtain the best electron beam stability, the irradiation process was conducted in emission current control mode. The measurement of the electric current leaving the target holder was performed by using a high-precision pico ammeter (Keithley, 6485) attached to a Faraday Cup placed in the target position. The beam current on the irradiated target was typically 1.4 μA. The electron beam enters in the UHV chamber at 40° angle with respect to the normal of the glycine sample plane. The working distance of the electron gun was about 35 mm from the sample-holder location. The electron flux on the glycine sample was 3.1 × 1013 cm−2 s−1 (sample diameter = 6 mm).
A copper sample-holder was designed to host each single sample vertically disposed. The KBr substrate (with high infrared transparency), which was the basis for the deposition of the glycine films, was placed into the UHV chamber at the sample-holder that was thermally connected to an He cryogenic head device (JANIS CCS-UHV/204) through two temperature stages (Fig. 2). The rotation of the sample-holder by 90°—from the position in which the electron beam irradiation was done—placed the sample aligned for IR analysis (Fig. 2).
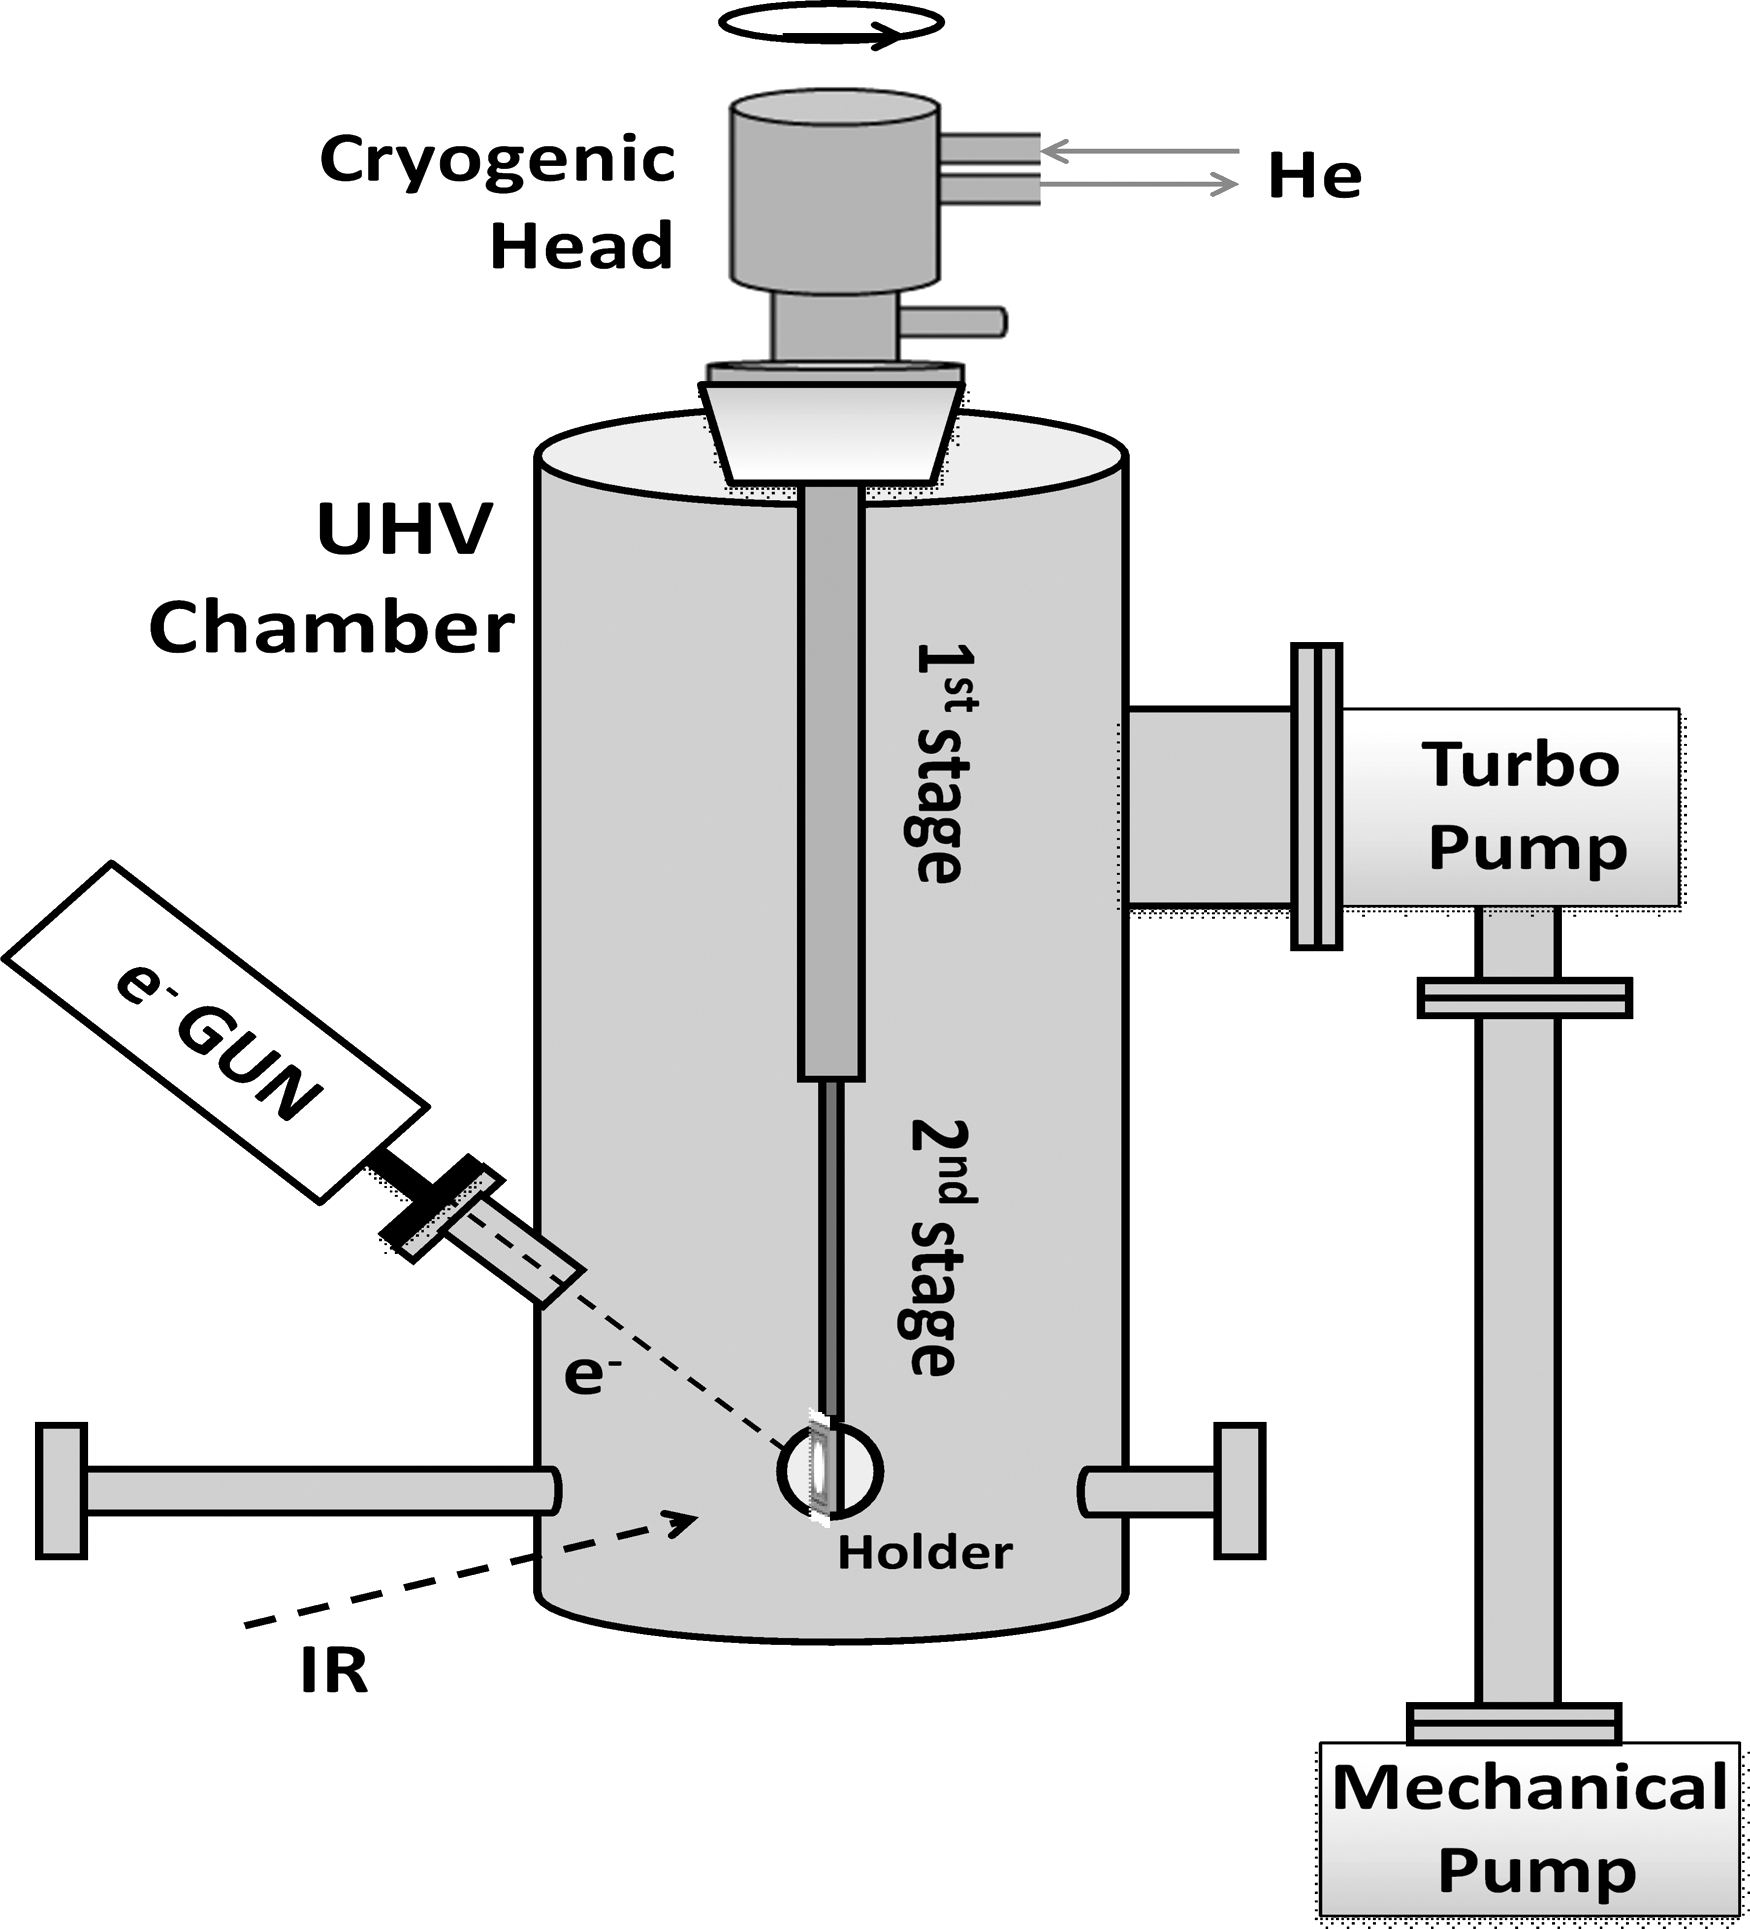
Depiction of the main experimental setup.
2.3. X-ray diffraction
The XRD technique is a useful tool to identify the crystalline structural form of the glycine sample whose film layer has grown on the KBr substrate during the sublimation process (Section 2.1). A glycine diffractogram was obtained through a Bruker AXS-spectrometer (Section 4.1).
2.4. Fourier-transform infrared
The IR analysis was performed by an FTIR spectrometer (JASCO FTIR-4100). FTIR spectra were acquired in the 3500–750 cm−1 spectral region (Section 4.2) as a function of irradiation time. Selecting 3.5 mm as slit aperture, absorbance spectra were recorded with 2.0 cm−1 resolution by averaging 100 scans. The spectrometer infrared beam impinged the analyzed sample at normal incidence. As background measurement, a pure KBr substrate spectrum was acquired before and after each irradiation run; in particular, due to this procedure, H2O band, as well as other contaminants, could be adequately subtracted from the glycine sample spectra.
3. Theoretical Model
3.1. Irradiation characteristics and cross-section definitions
In the first-order approach, the molecular destruction cross-section corresponding to the electron beam irradiation is measured by analyzing the dependence of the column density of the sample molecule on fluence. The number of projectiles impinging in the target per area unit and in a time dt is the electron beam fluence dF = Φbeam dt, where Φbeam is the beam current flux.
Considering V as the sample volume in which molecules can be destroyed by the electron projectiles, the dN number of molecules (per area unit) destroyed by dF electron projectiles after bombardment with fluence F(dN) is given by:
where σ d (F) is defined as the destruction cross-section of the sample molecule at fluence F, and N(F) is the column density of the survived molecules at fluence F located only in the volume V. Solving Equation 1:
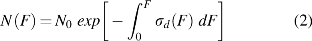
where N 0 is the initial number of the sample molecules in the volume V.
3.1.1. Constant cross-section
Behind the cross-section definition given by Equation 1, there is the assumption that each projectile interacts with the target through a series of similar single collisions; σ d represents then the average molecular area resulting in fragmentation due to many single collisions. This is, indeed, the case for thin samples, when the projectile traverses the target with velocity that is approximately constant, that is, exiting the film after losing just a small fraction of its initial kinetic energy: Even if a cascade of collisions occurs, σ d should be approximately constant along the projectile track.
Another consideration is whether σ
d
does not depend on F, in which case, Equation 2 states:
The parameter λ = Φbeam σ d is called radiolysis dissociation rate. This equation is the one usually employed for determining σ d or λ.
3.1.2. Energy-integrated cross-section
As described in the previous section, the σ d constant assumption—correct when projectiles are MeV ions traversing thin layers—may not be appropriate for keV electron interaction in solids. Two phenomena should be considered for cross-section variations inside solids: (i) after some fluence, the fragments of the dissociated precursor molecule start to interact significantly with the projectile, and (ii) electron projectiles slow down “completely” inside the sample (electron-atom ionization cross-section varies with the projectile kinetic energy, imposing a significant stopping power variation along the projectile track). These two facts make more difficult the extraction of the σ d value from Equation 3, as well as the comparison among σ d results obtained under different circumstances (such as different initial beam energies or sample temperatures); the reinterpretation of the destruction cross-section from that defined for binary collisions becomes necessary.
Indeed, along the cascade of electron-molecule collisions inside the solid, each new collision occurs with a relatively large decrease of the projectile kinetic energy and significant change of the projectile direction. This obliges that: (i) the total number of destructed precursors per projectile (destruction yield) be determined by the sum of those produced in each collision along the cascade and (ii) the quantity N(F) in Equation 1 is not anymore related with sample thickness but instead with the average projectile track length. If the latter point is not taken into account, the obtained σ d value should represent the integrated cross-sections of the binary collisions—from the first encounter with the initial energy E 0 till the last inelastic one; for a thick target, this quantity will always increase with the initial projectile energy. According to the Bethe theory (Bethe and Ashkin, 1953), a key parameter to characterize the molecular collision is EI, the average excitation/ionization energy; after a certain number of collisions, the transferred energy from the projectile becomes smaller than the molecular dissociation energy and fragmentation ceases. Further, if a layer of products is progressively formed near the sample surface, the electron projectile loses energy to traverse it, which, in turn, causes a decrease in the average collision energy of the subsequent collisions with precursors.
Following de Barros et al. (2011), we have kept the cross-section determination based on Equation 3, but the obtained σ
d
is reinterpreted as an average cross-section, not only on fluence but also on all projectile energies inside the solid, integrated from E
0 to E > EI
. To avoid ambiguity, in this work this quantity is called energy-integrated destruction (
According to this reasoning, for a long enough bombardment on thick samples, the non-irradiated region should be eliminated from the analysis once the measured N(F) levels off at N ∞ ≡ N (F → ∞). This is done by defining the initial molecule column density (species i) in the sample as N 0i = N 0 + N ∞. Equation 3 changes into:

where the energy-integrated destruction cross-section is defined as:
The parameters N
∞, N
0i, and
In first order, the column density evolution of the daughter molecule j (Nj ) is found by solving the expression:

where
Similar to Equation 6, the evolution of the number of granddaughter molecules of species k (Nk ) is obtained by solving:
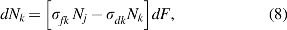
where

3.2. Infrared analysis in transmission mode
In transmission mode, IR light completely traverses the sample, being absorbed in both irradiated and nonirradiated regions. To transform column densities N(F) into infrared absorbance S(F), the Beer-Lambert law can be invoked:
Here, Av
represents the band strength (A-value). For precursor molecules i, Equation 4 can be rewritten as:
where Si
(F) represents the absorbance over the total thickness of the sample at a specific fluence F; S
∞ is the absorbance at very high fluence and corresponds to the absorption, any time, in the region not processed by the electron beam. Note that S
∞ + S
0i
is the initial (F = 0 cm−2 or t = 0 min) absorption band area throughout the sample. If the sample thickness is about the electron range itself, the precursor material vanishes completely at high fluences, corresponding to S
∞ ∼ 0, so that:
In the same sense, for daughter molecules j, Equation 6 can be transformed into:
where S
0j
= S
0i
(Avj
/Avi
); Avi
and Avj
are the A-values of the precursor i and product j, respectively. This expression yields Sj
(F) ≅ S
0j
For granddaughter molecules k, Equation 9 is changed into:
where S 0k = S 0i (Avk /Avi ); Avk is the A-value of the granddaughter molecule.
If the by-product k decays very slowly, then
Defining by convenience the constant parameter
3.3. Compaction and amorphization phenomena
Crystalline structures of solid samples depend on how they are prepared. During the irradiation, besides the radiolysis process, amorphization and compaction also occur due to molecular reorganization (Rothard et al., 2017). The produced phase change in the solids modifies the vibration of chemical bonds, transforming their band strengths. This means that A-values are fluence dependent and have to be analyzed simultaneously with the radiolysis.
For the nonirradiated sample (porous-amorphous and/or crystalline), its initial absorbance should be written as Si
(F = 0) =
Assuming that Ni
(F) does not change in phase transitions, Beer's Law (Eq. 10) implies that, in particular for F = 0:
For porous samples, it has been shown empirically that the Avi(F) dependence on fluence is (Mejía et al., 2015; de Barros et al., 2016):
where σ
ci
is the compaction cross-section and ζ is the relative porosity defined as (Mejía et al., 2015):
Considering Equations 4, 16, 17, and 18, and assuming N
∞ ∼ 0, the absorbance Si
(F) is written as (Mejía et al., 2015; de Barros et al., 2016):
Or, by assuming
Here, ζ > 0 implies that a fast increasing of the absorbance band should be observed at the very beginning of irradiation (Mejía et al., 2015). Inversely, for ζ < 0, a rapid decreasing should be noted (Leto and Baratta, 2003; Mejía et al., 2015), in case of which the second term of Equations 19a and 19b becomes positive.
4. Results
4.1. Crystallographic analysis
The glycine deposited on KBr substrate was examined by the XRD technique (Fig. 3), aiming at the identification of the polymorphic structure of the sublimate of the glycine. The peaks at 2θ about 24°, 29.3°, 29.9°, and 35.4° correspond to the glycine in α-form (Albrecht and Corey, 1939; Ferrari et al., 2003), whereas the ones at 23.3°, 27.0°, 38°, and 38.6° are due to the KBr reflections. The main crystallographic planes corresponding to reflections in the KBr were published by Rai et al. (2016).
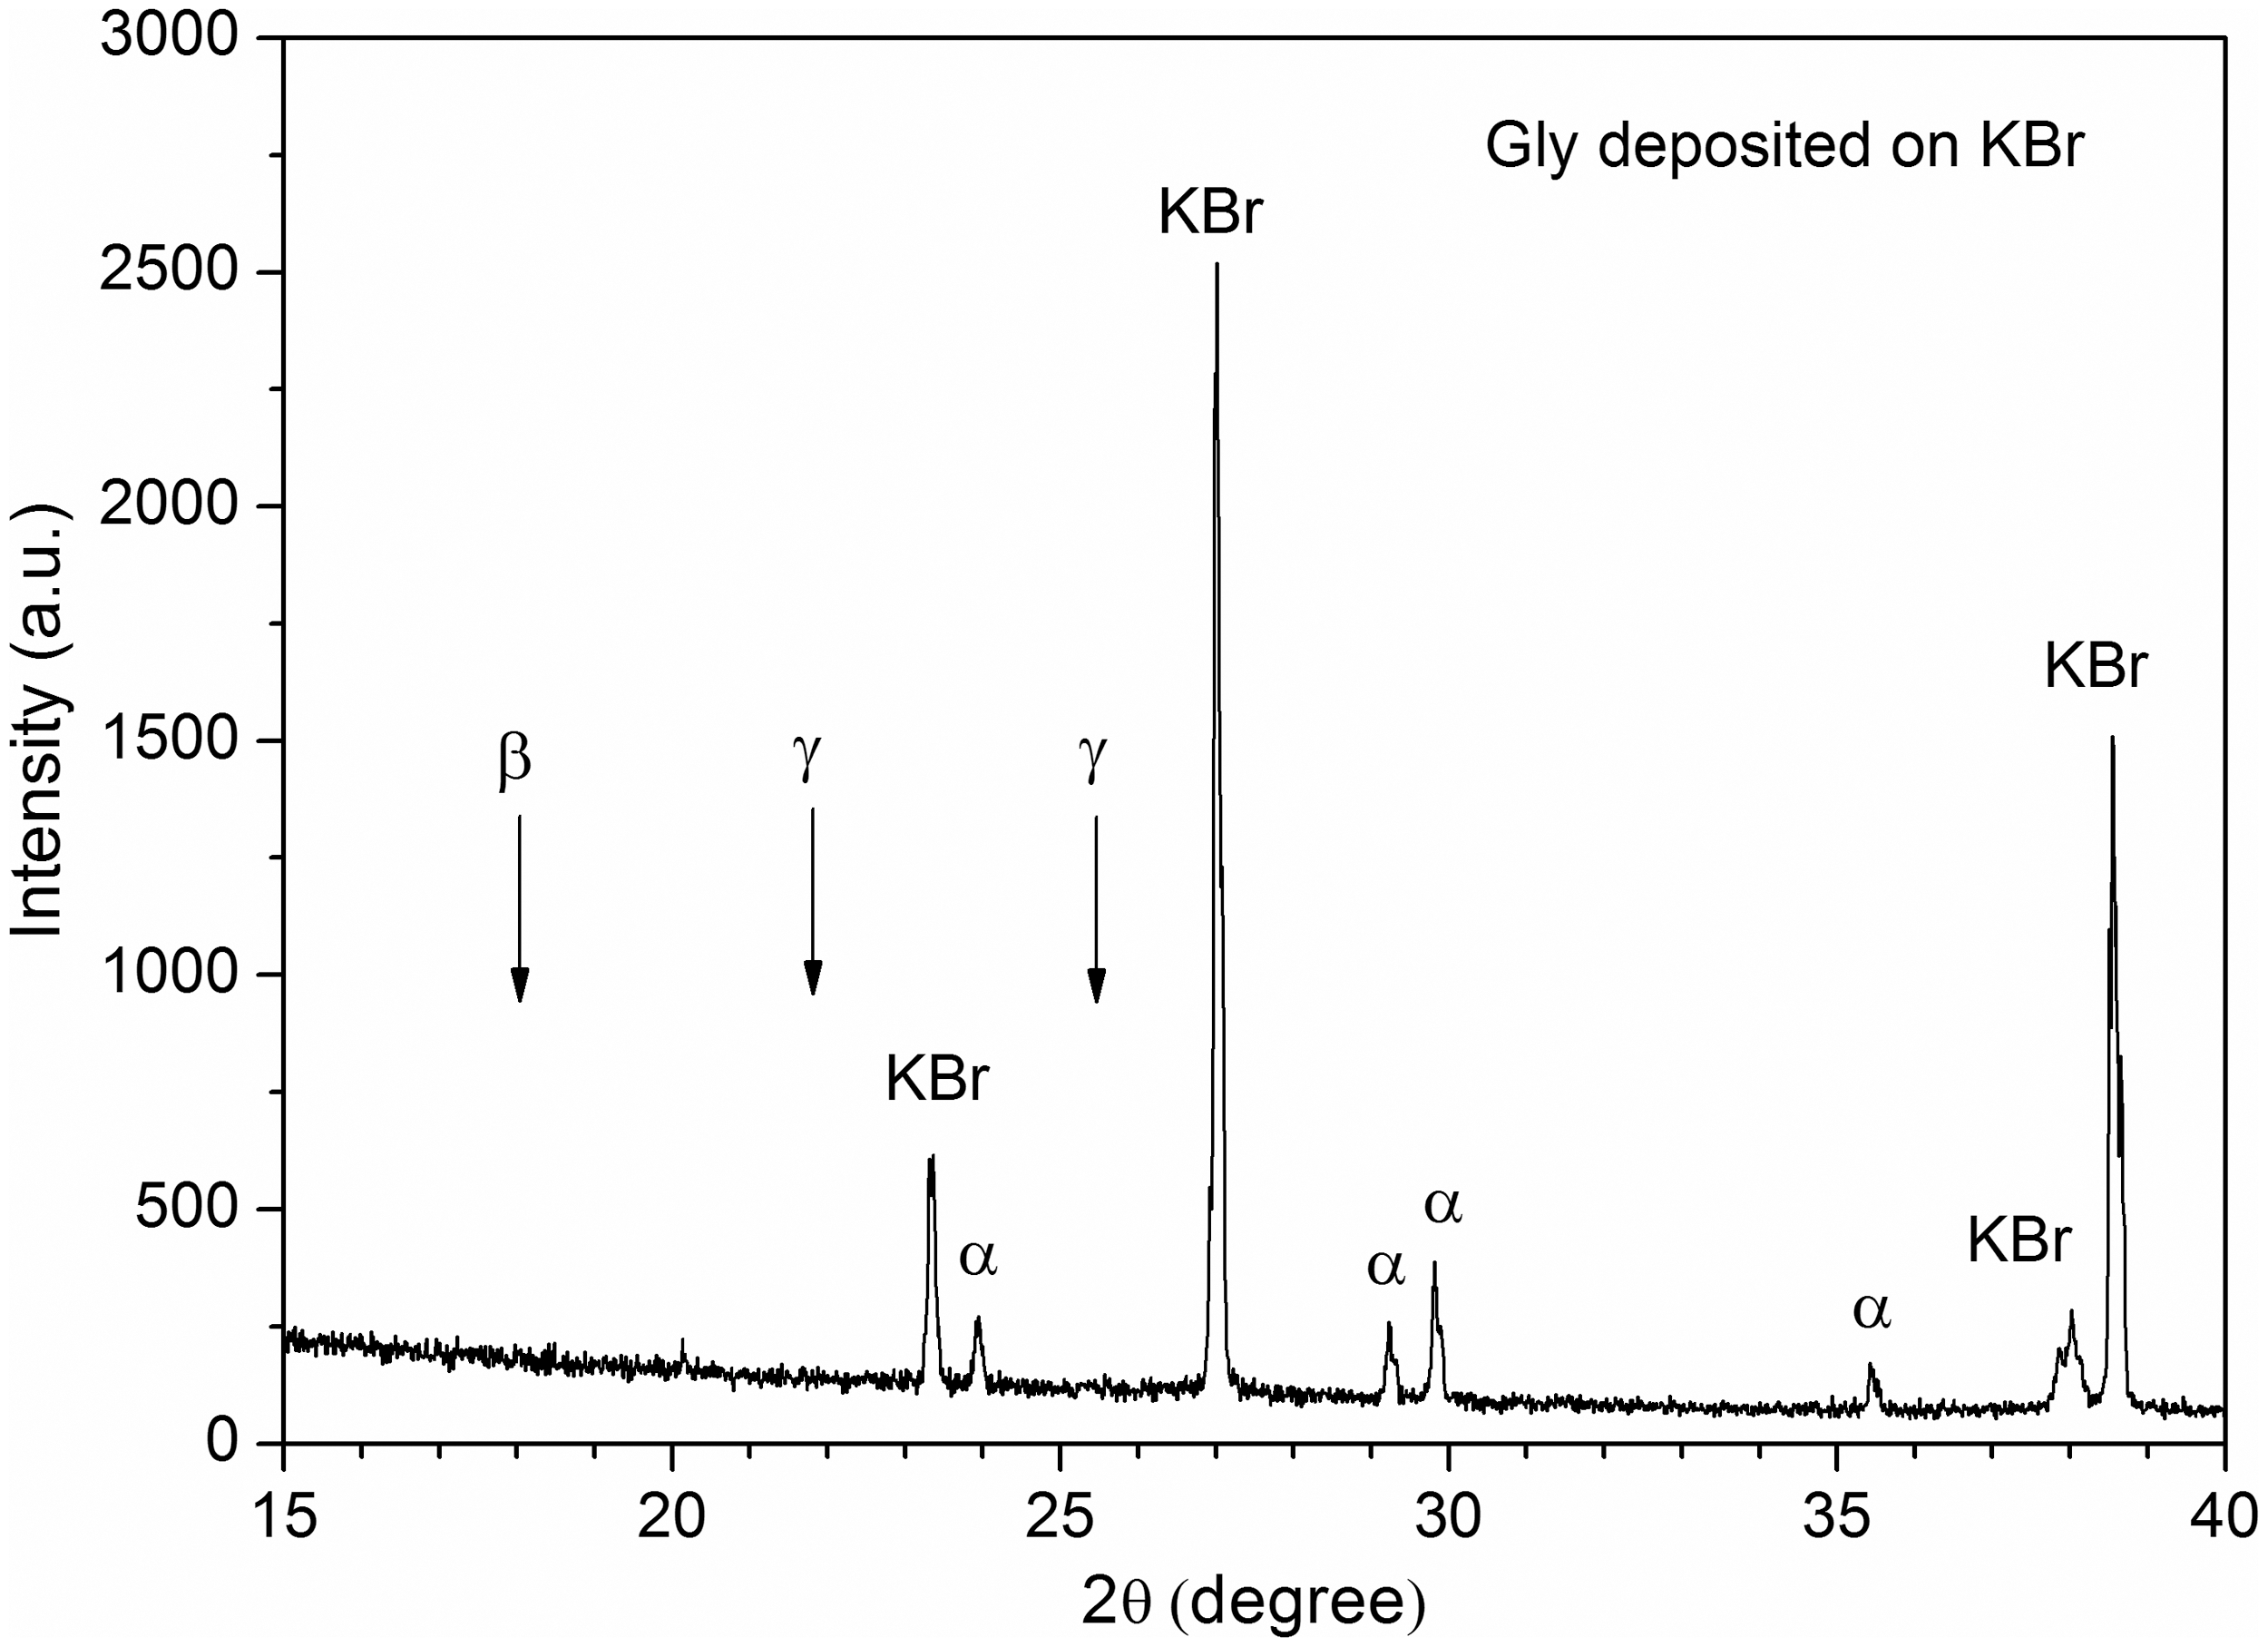
XRD spectrum for the glycine deposited on KBr substrate. Only peaks of the α-form are observed in the sublimated of glycine. XRD, X-ray diffraction.
Clearly, peaks generated by β- and γ-forms are not observed in this sample. The peaks due to glycine in β-form are given by Ferrari et al. (2003) and Iitaka (1960); the dominant peak, observed at 2θ ∼ 18°, corresponds to the assignment of the (001) reflection of the β-polymorph. On the other hand, the peaks at around 25.5° and 21.8° are correlated to the glycine in γ-form (Iitaka, 1961).
According to Liu et al. (2008), the sublimation process of the glycine in α- or γ-form would result in β-GLY. In a specific case, glycine in γ-form was used as the starting material by Liu et al. (2008). At that configuration, β-GLY was obtained via the sublimation process; the deposition has happened on glass. However, in this work, after the sublimation of a powder glycine composed by a mixture of α-GLY (∼94%) and γ-GLY (∼6%) as the original substance, the structure of the sublimate resulted in pure α-form on KBr substrate, not in the β-form. The reason for this is unclear, but the different substrate material could contribute to that.
Temperature, moisture, and even milling activity are parameters that strongly impact the glycine crystal arrangements (Perlovich et al., 2001; Boldyreva et al., 2003a, 2003b). As KBr is a hydrophilic material, some moisture on its surface could contribute toward changing the sublimate structural properties. In our case, supposing that at first β-form was, indeed, deposited on KBr, the existence of any moisture amount could easily lead the glycine to transform into its α-form, since β-GLY is metastable at any temperature in the presence of moisture (Perlovich et al., 2001; Boldyreva et al., 2003a).
4.2. Infrared spectra
The IR spectrum of the nonirradiated α-glycine (3500–750 cm−1) as a function of temperature is shown in Fig. 4. Table 1 summarizes all the glycine characteristic band assignments for the FTIR spectrum for each temperature configuration. The obtained spectra show typically the same bands. It is observed in Fig. 4 that as the sample is cooled down, the spectrum band lines tend to be narrower, improving the spectral resolution; some bands show an inversion of intensities for specific peak positions as in the 3250–2000, 1650–1200, and 980–750 cm−1 spectral regions. This fact reinforces that band strengths are changing as the glycine is cooling down, and vice versa.
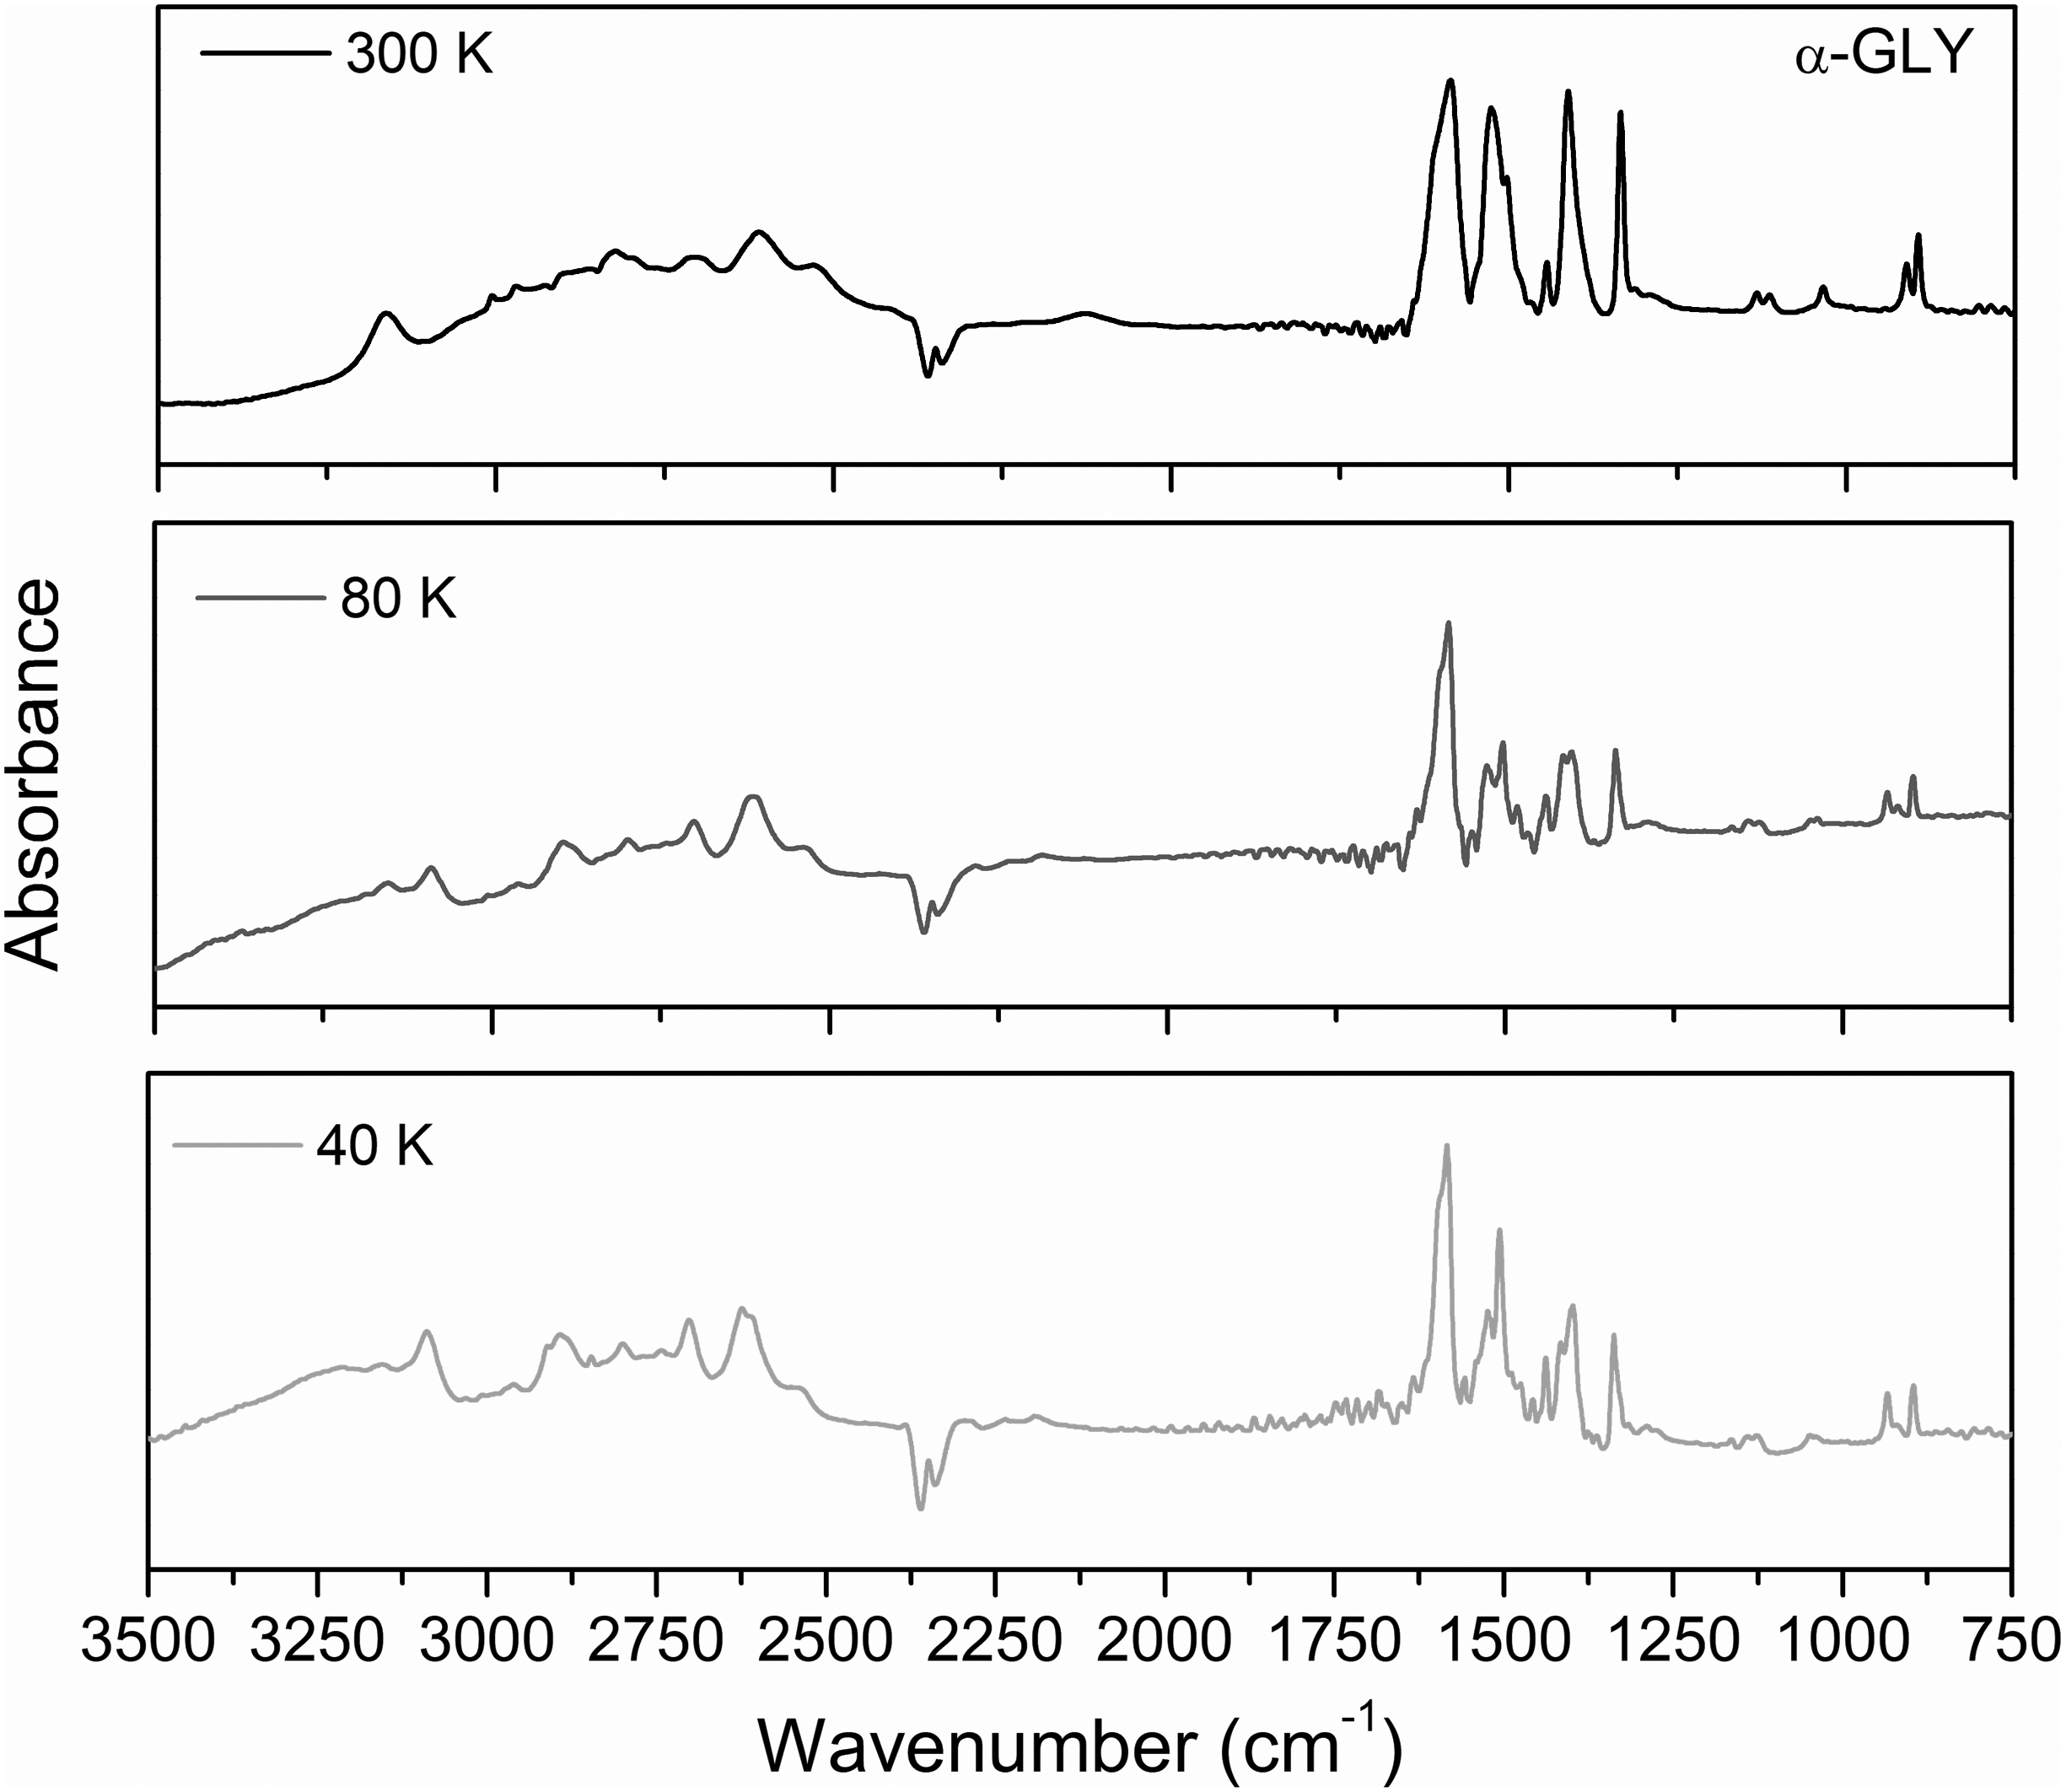
FTIR absorbance spectra of the unprocessed sublimated glycine on KBr substrate at 40 K, 80 K, and 300 K. FTIR, Fourier-transform infrared.
Band Assignments of the α-Glycine Infrared Spectrum for Different Temperatures
Maté et al. (2011).
Guan et al. (2010).
Holtom et al. (2005).
Glycine in zwitterionic form Guan (et al., 2010).
Gerakines et al. (2012).
Blout and Linsley (1952).
ν = stretch, δ = bend, ω = wag, τ = torsion, ρ = rock, s = symmetric, as = asymmetric.
In general, the overlapping bands between 3500 and 2000 cm−1 correspond typically to the NH3, CH2, and CN stretching vibrations (Holtom et al., 2005; Guan et al., 2010; Maté et al., 2011). Moreover, the presence of a set of bands at about 2825, 2720, and 2530 cm−1 evidences that glycine films are in zwitterionic form (Guan et al., 2010). The NH3 + bending vibrations are assigned at ∼1525 and ∼1505 cm−1 bands (Holtom et al., 2005; Guan et al., 2010; Maté et al., 2011). The COO− stretching vibrations are mostly related to ∼1590 and ∼1410 cm−1 bands (Holtom et al., 2005; Guan et al., 2010; Maté et al., 2011; Gerakines et al., 2012), although the NH2 bending vibration may also be associated to ∼1590 cm−1 band as well (Gerakines et al., 2012). At ∼1440, ∼1330, and ∼910 cm−1, the spectral signatures of CH2 deformation and scissor modes are observed (Blout and Linsley, 1952; Holtom et al., 2005; Guan et al., 2010; Maté et al., 2011; Gerakines et al., 2012; Kaiser et al., 2013). The faint intensity lines at ∼1130 and ∼1110 cm−1 are correlated to NH3 + rocking vibrations (Holtom et al., 2005; Guan et al., 2010; Maté et al., 2011). The CN stretching vibrations could be linked to ∼1035 cm−1 band (Holtom et al., 2005; Maté et al., 2011; Gerakines et al., 2012) and even to ∼1130 cm−1 band (Gerakines et al., 2012). Finally, the CC stretching vibration is seen at ∼895 cm−1 (Holtom et al., 2005; Maté et al., 2011).
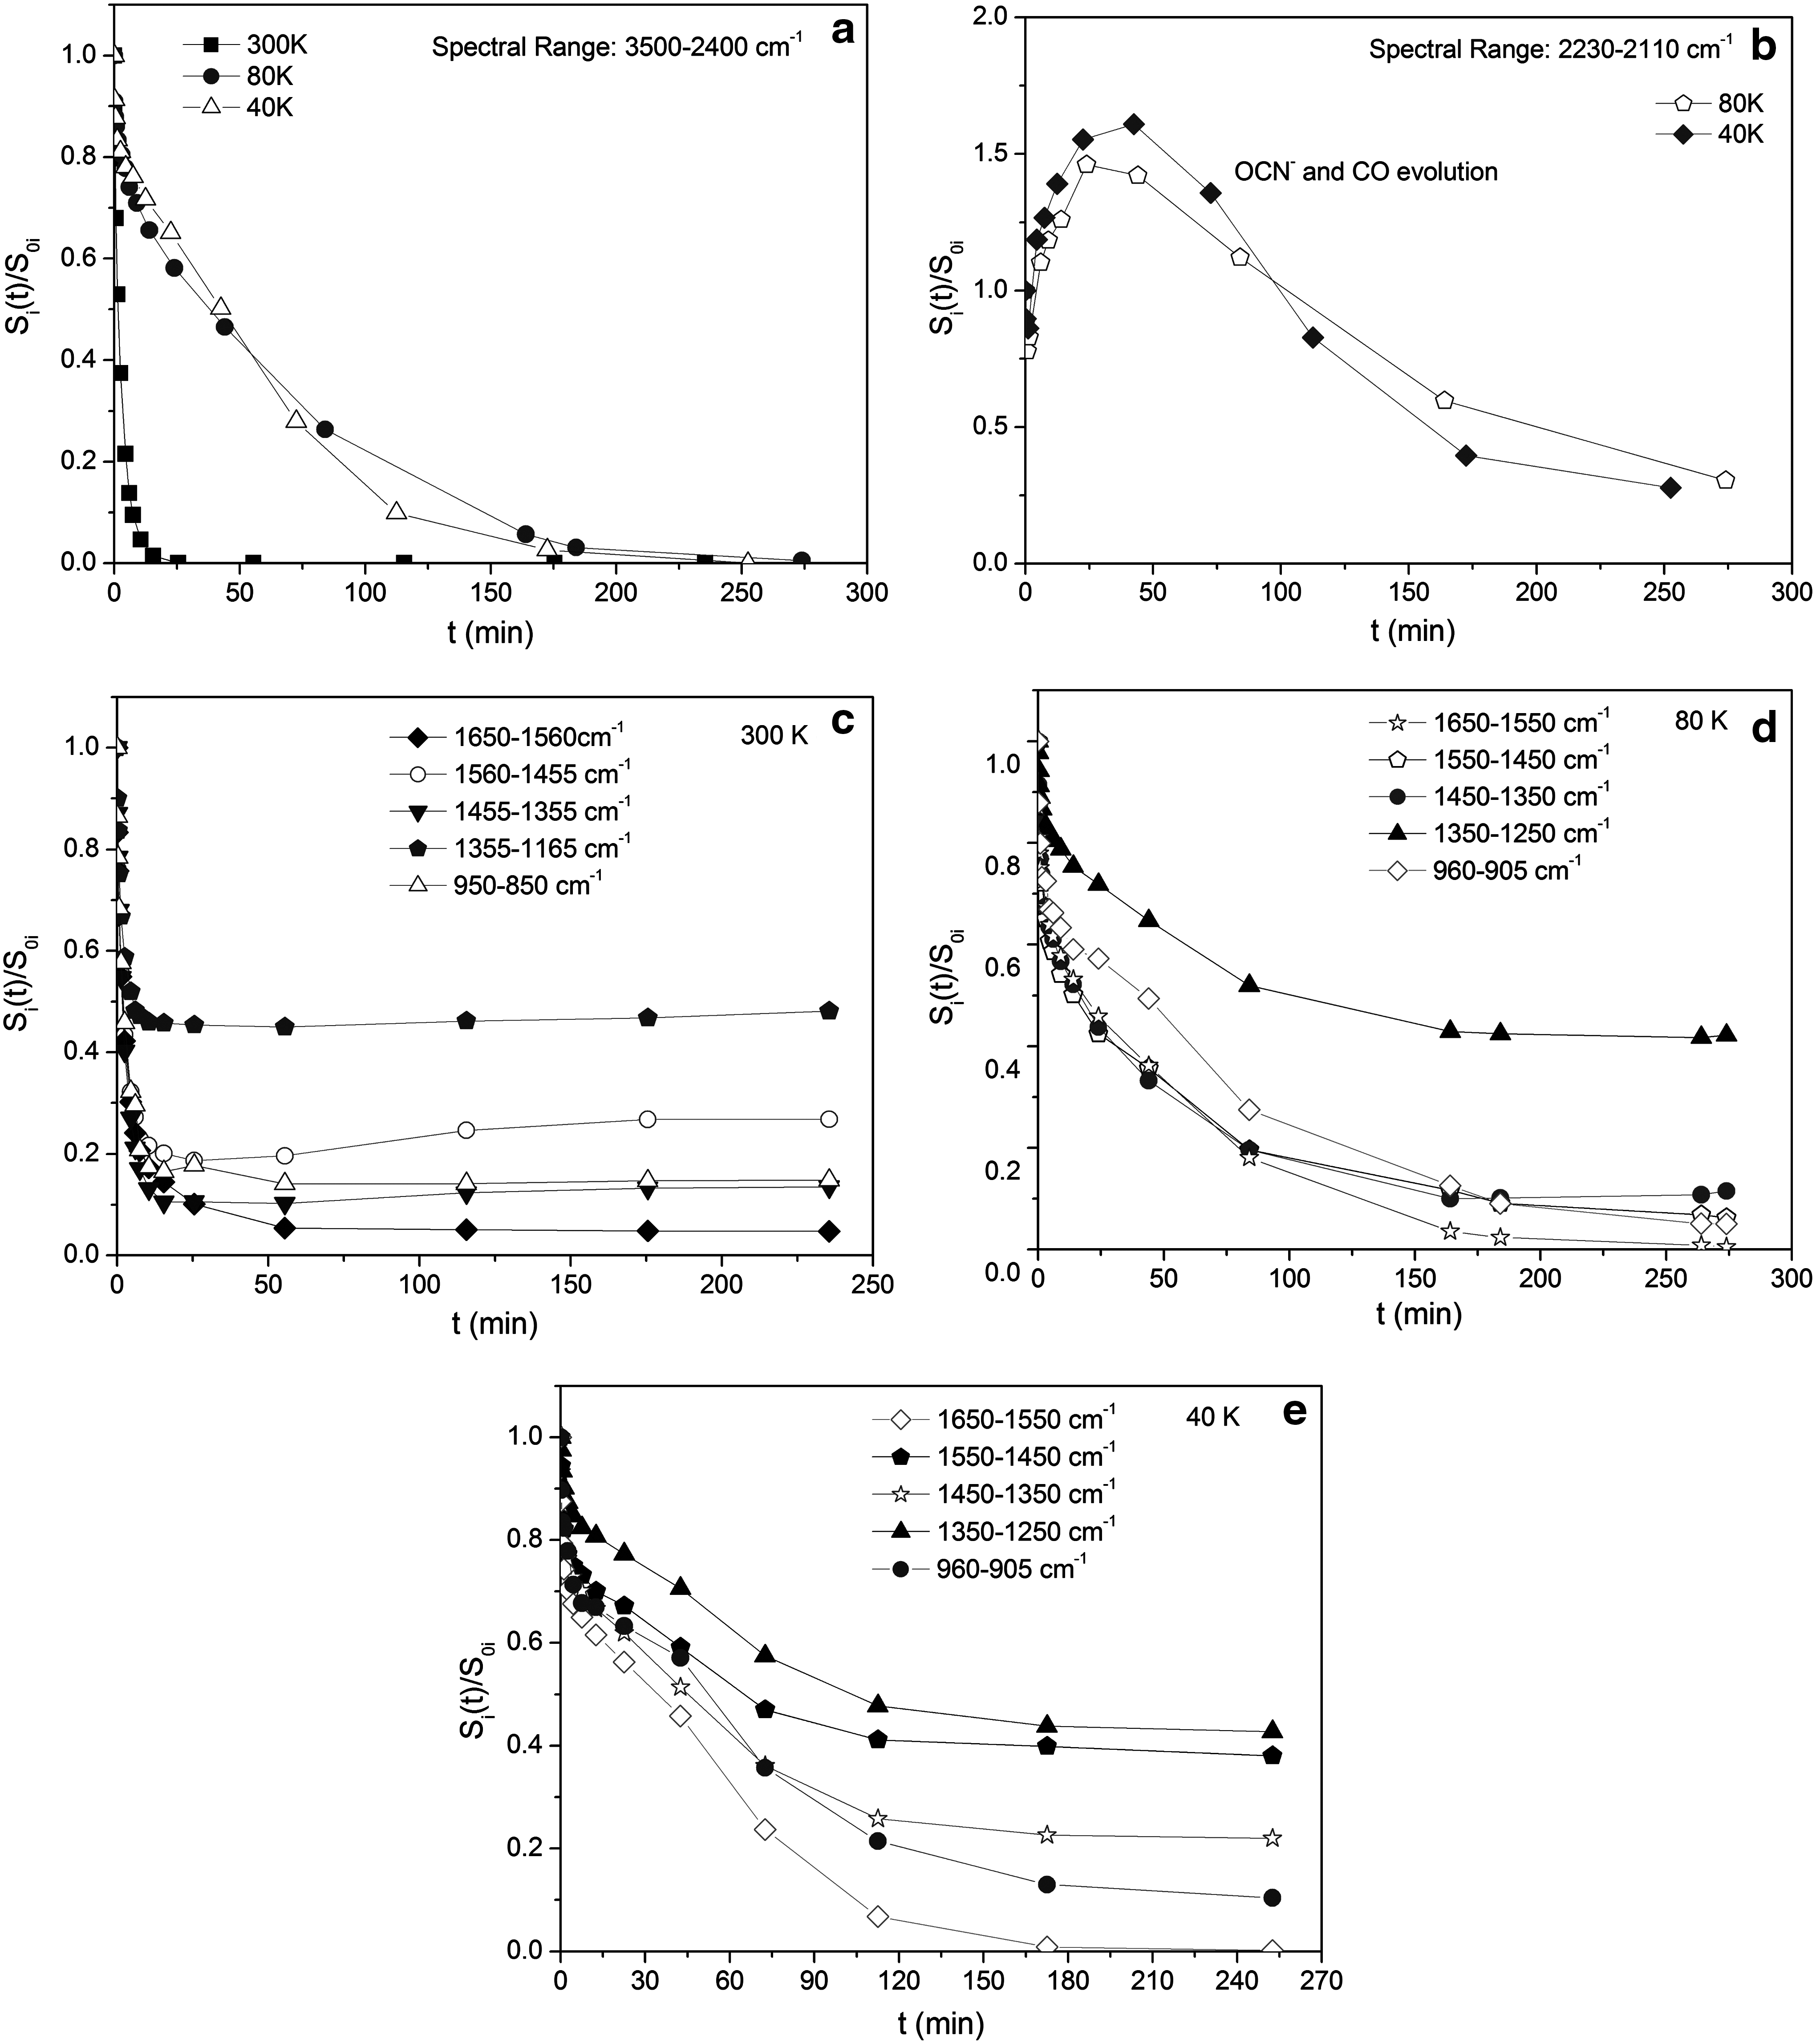
Figure 5a to 5e show the evolution of glycine normalized absorbance areas decay for a set of different bands as a function of irradiation time and sample temperatures for 1.0 keV electron beam bombardment. For all temperatures, the glycine band absorbances at 3500–2400 cm−1 have disappeared completely: after ∼15 min at 300 K; beyond ∼250 and ∼270 min at 40 K and 80 K, respectively, as could be observed in Fig. 5a. At room temperature, Fig. 5a shows that glycine decays faster than at low temperatures. There is great similarity between glycine depletion at 40 K and 80 K.
Normalized absorbance decays as a function of time:
However, the band absorbance evolution in the ranges of 2230–2100, 1650–1200, and 980–800 cm−1 suggests that some shielding layer stopped the electron beam processing in the sense that the bands do not vanish completely, indicating the formation of by-products (daughter and granddaughter molecules) (Fig. 5b–e). This is not the case for the bands in the range of 1650–1550 cm−1 at 40 K and 80 K, which present negligible absorbance ahead of 180 min and 250 min irradiation, respectively.
Moreover, a significant absorbance increase was observed at 40 K and 80 K, mostly in 2230–2100 cm−1 (Fig. 5b). In addition, at 300 K, there are also bands with growing absorbance in specific spectral ranges: 1560–1455, 1455–1355, and 1355–1165 cm−1. At room temperature, a remarkable absorbance enhancement was seen in 1560–1455 cm−1 range after ∼15 min of irradiation (Fig. 5c). In this sense, a more detailed study was done showing peak bands growing specifically at 2165 and 2136 cm−1 (40 K and 80 K), as well as at 1510 cm−1 (300 K).
Figure 6a presents the spectrum evolution as a function of time in the 2230–2100 cm−1 region at 40 K and 80 K. It is observed that after 2.5 min for 40 K and 4.5 min for 80 K absorbance peaks are appearing at 2165 and 2136 cm−1 that are associated to OCN− (Schutte and Greenberg, 1997; Hudson et al., 2001; Park and Woon, 2004; Maté et al., 2014, 2015) and CO (Maté et al., 2014, 2015) bands, respectively. During the electron radiolysis, both bands tend to increase, but after long time of irradiation these bands have also tended to vanish.

On the other hand, Fig. 6b shows the last spectrum acquired, for each temperature sample irradiation, ending in the range of 1650–1200 cm−1. Amide II (1600–1500 cm−1) and Amide III (1350–1200 cm−1) bands are present in all spectra. In addition, the region between 1480 and 1370 cm−1 is characterized by the presence of CH3 asymmetric deformation and CH2 scissor bands (Kaiser et al., 2013; Maté et al., 2015). At 300 K, the formation of these bands could be directly associated with the formation of tholin (solid residue, i.e., a structural rearrangement of glycine), since any volatile by-product produced in the sample at room temperature evaporates. In the case of irradiation at 300 K, a reddish residue was observed on the KBr substrate, which is attributed to tholins. On the other hand, at 40 K and 80 K, there was no such visual observation of tholin formation. Thus, in this last case, these new bands observed must be a consequence of the deposition of volatilized materials that have been added to the substrate due to the low temperatures.
As alleged earlier, the analysis around the 1600–1440 cm−1 spectral region at 300 K, collected from ∼15 min up to ∼235 min of irradiation (Fig. 7), shows the presence of a by-product band peak growing at a 1510 cm−1. This peak is associated to the Amide II band group, which is major characterized for bending vibrations of N-H bounds strongly coupled to C-N stretching vibrations (Singh et al., 1993; Suchkova and Maklakov, 2009). The presence of Amide II band assignments has been observed when the dimerization of glycine units occurs (Kaiser et al., 2013; Cruz-López et al., 2017) for specific ice mixtures irradiation.
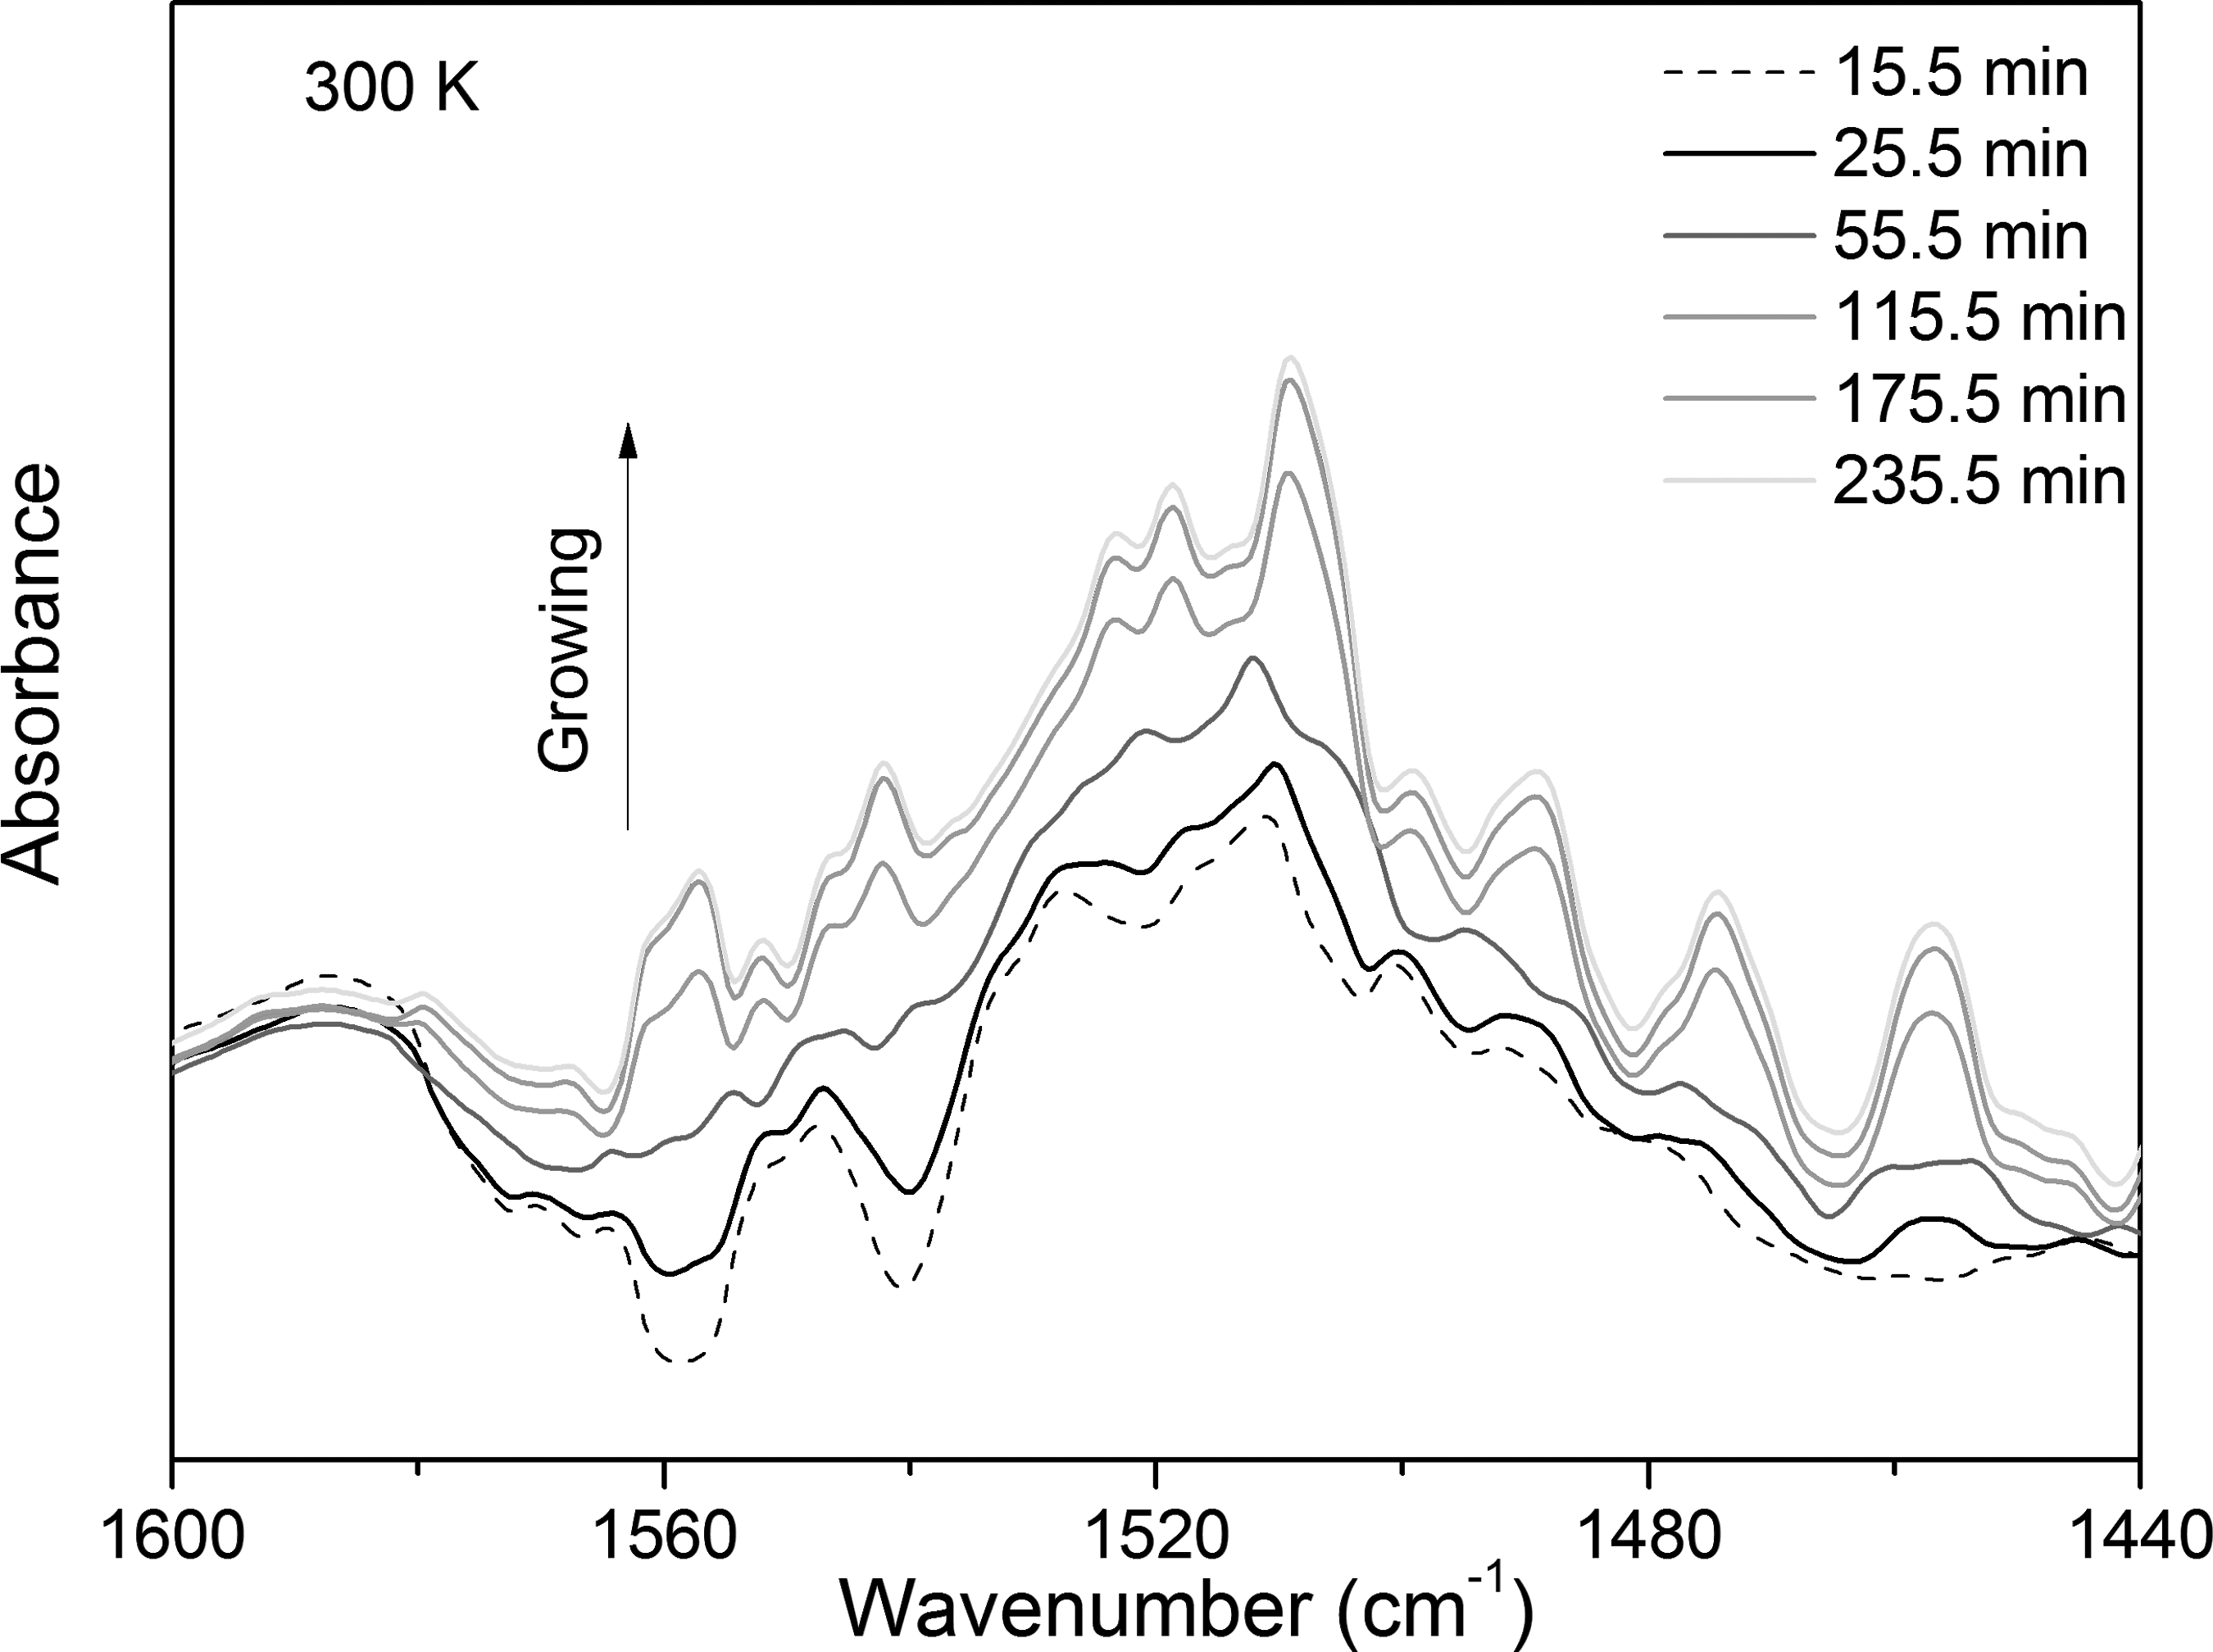
FTIR 1600–1440 cm−1 absorbance spectra of sublimated glycine as a function of irradiation time at 300 K.
Despite the fact that tholin families are generally composed by C-N-H arrangements (Sagan and Khare, 1979), the association of the N-H distortion to some tholin N-H bound is reasonable. Figure 7 shows that the absorbance band at 1510 cm−1 grows after ∼15 min of treatment, when α-GLY has already been completely depleted. In fact, the growing rise of the 1510 cm−1 feature may be attributed to the tholin fragmentation due to the electron impact (i.e., glycine granddaughter molecule), since in the current measurement, no more glycine existed when the 1510 cm−1 band started to increase. This discussion will be developed in Section 4.3.
4.3. Cross-sections
4.3.1. Glycine compaction and destruction
Figure 8a to 8c present, in semi-log scale, the glycine decay seen by its normalized band absorbance [Si (F)/S 0i ] as a function of the fluence for each sample temperature irradiation. As the glycine decay behavior during radiolysis is independent of the selected chemical functional group, the broad spectral region at 3500–2400 cm−1 was chosen to monitor the bands decay (the absorbances of these bands vanish). At the very beginning of the irradiation (low fluences), a rapid decrease in the absorbance is observed, indicating a characteristic compaction process with ζ < 0. This phenomenon is very clear for 40 K and 80 K irradiations, and less evident for the 300 K one. If compaction processes were detected, it means the glycine films are partially crystalline (as described in Section 4.1), and partially amorphous. However, it was not possible to quantify the proportion of crystal/amorphous states.

Normalized absorbance evolution as a function of the electron fluence F. The compaction and destruction cross-sections for glycine were obtained by using the bands in the range of 3500–2400 cm−1 for:
Then, the glycine compaction and energy-integrated destruction cross-sections due to electron beam interaction were determined by fitting the data of Fig. 8a to 8c by Equation 19b, considering ζ < 0 (Table 2). The GLY compaction cross-section increases as the GLY temperature decreases, meaning the compaction is more efficient at low temperatures. On the contrary, for GLY energy-integrated destruction cross-sections, the electron beam efficiency to degrade the GLY is higher at 300 K than at low temperatures (∼20 times larger). In addition, the energy-integrated destruction cross-sections for GLY at 40 K and 80 K are the same, by considering the uncertainties evolved, which corroborates the result obtained by Maté et al. (2015) that concluded that GLY destruction rates by electrons are basically constant between 20 K and 90 K.
α-GLY Compaction (σci) and Energy-Integrated Destruction (σdi int) Cross-Sections at Different Temperatures
Tholin destruction cross-section (σ dj int) at 300 K as well as the relative porosities (ζ) for all temperatures are also shown.
It is also remarkable that GLY compaction is a quicker process compared with electronic radiolysis (Table 2). The “soft” compaction at room temperature is only seven times greater than the destruction cross-section, whereas “strong” compactions are observed at low temperatures that are ∼200 and ∼300 times more efficient than the destruction cross-section for 80 K and 40 K, respectively.
The values of the relative porosity ζ (Table 2) have been determined from the data of Fig. 8a to c; for all temperatures, ζ < 0. It interesting to note that ζ absolute values (|ζ|) diminish as the temperature decreases, corroborating the result obtained for the compaction cross-sections dependence on temperature due to the fact that a sample with more porous (high |ζ|) takes longer to compact, which means that the associated cross-section should be smaller compared with samples with less porous (low |ζ|).
4.3.2. Tholins
The growing absorbance band at 1510 cm−1 (N-H distortion) becomes visible in the spectrum after ∼15 min of irradiation time at 300 K; its absorbance levels off at about 235 min of irradiation (Fig. 9). The reason for the appearance of the N-H deformation at room temperature may be due to the tholin rearrangements during the electron bombardment.

Absorbance evolution of the 1510 cm−1 band as a function of fluence at 300 K. The solid line is a fitting based on Equation 15 prediction. The standard deviations are typically 5%.
Equation 15 has been used for fitting the absorbance evolution as a function of fluence for the 1510 cm−1 band (Fig. 9). This specific N-H distortion growing is considered a granddaughter product obtained from the tholin residue, since the last one was a consequence of the GLY decay (daughter molecule) at 300 K.
Applying Equation 15 on the data contained in Fig. 9, by considering
5. Discussion
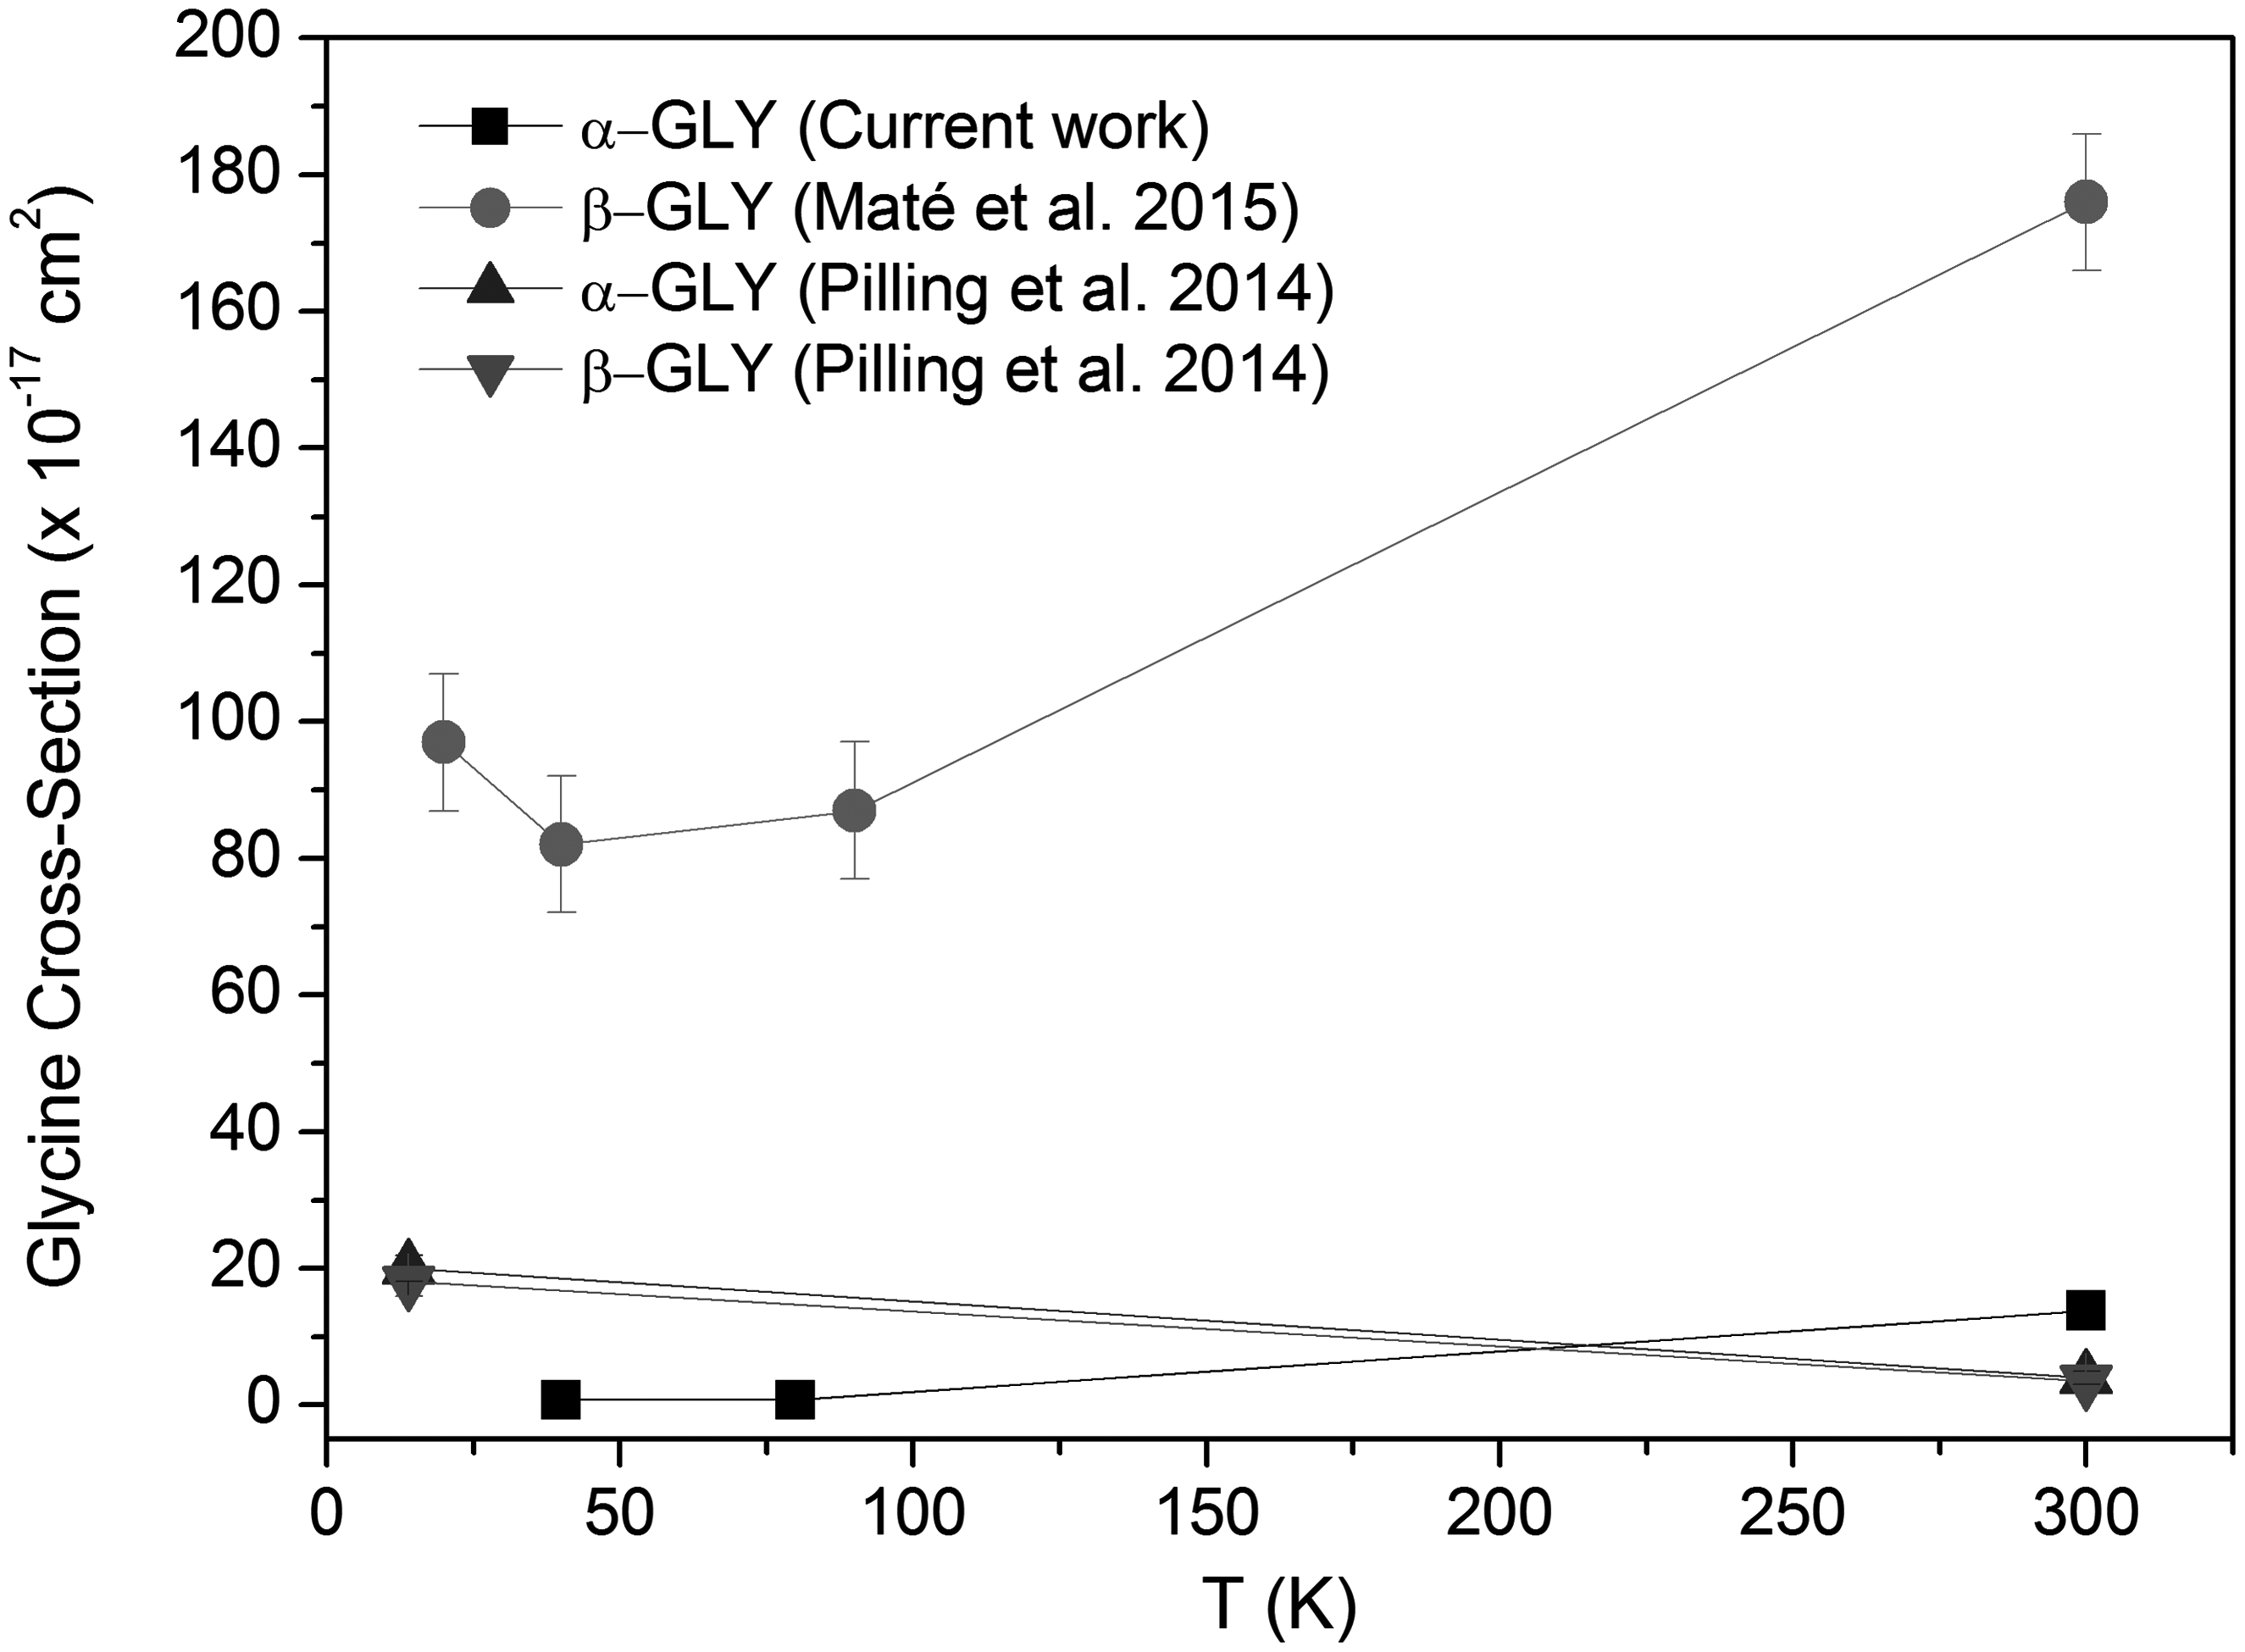
Glycine destruction cross-sections by 2.0 keV electron beam have already been determined by different authors (Pilling et al., 2014; Maté et al., 2015). The values found by Pilling et al. (2014) for α- and β-glycine at 14 K and 300 K are practically the same (Fig. 10). They have found for both temperatures that the cross-section is higher at low temperature compared with the one for room temperature.
Destruction cross-sections dependence on sample temperature.
On the contrary, Maté et al. (2015) have obtained a much greater cross-section for β-glycine in the opposite way of Pilling et al. (2014). They found that the greater is the temperature, the higher is the cross-section, in agreement with cross-section dependence on temperature derived in this work (Fig. 10); The present destruction cross-sections for α-glycine are ∼13 times (300 K) and ∼120 times (40 K and 80 K) lower in comparison to the destruction cross-sections for glycine in β-form derived by Maté et al. (2015) at the same temperature sets. Moreover, Maté et al. (2015) have shown that between 90 K and 20 K the cross-sections are about the same, whose result agrees for low temperatures with the current findings (Fig. 10).
In addition, based on the graphic of Fig. 3 of Pilling et al. (2014), it seems that these authors did not consider the compaction effect in their analysis; indeed, an additional destruction was associated to their lower slope data, but without fitting. In this sense, they have considered the stronger slope as the representative data for determining the glycine destruction cross-section. This fact may justify the inverse behavior of the destruction cross-section dependence on temperature samples.
On the other hand, the approach of Maté et al. (2015), even ignoring the compaction effect and taking into account only radiolysis, is reasonable since compaction is a much faster process compared with radiolysis.
Some other divergent results should be highlighted. A consequence of the electron collision cascade in the solid is its energy-integrated destruction cross-sections that are geometry sensitive (since the penetration depth and the density of molecular fragments change with the incidence angle); the current result for α-glycine corresponds to 40° incident beam whereas the two others were obtained at normal incidence. Another experimental difference among the setups is the electron gun work distance (i.e., the beam divergence) and the target preparation, as mentioned in Section 2.
Related to irradiation products, Maté et al. (2015) have observed broad bands at about 1665 (Amide I), 1574 (Amide II), and 1318 cm−1 (Amide III) at low temperature (<90 K). In the present experiment, only Amide II and III were detected at both low and room temperature measurements. According to Kaiser et al. (2013), the residues associated to glycine dimers could be formed by nonvolatile molecules, such as the Amide II band at the range of 1650–1510 cm−1. However, the N-H distortion growing observed in this work at room temperature is strongly correlated to the tholin residue that might have suffered some rearrangement during the radiolysis process, since there was no more GLY available when this specific band started to increase. Moreover, at 300 K, Maté et al. (2015) noticed that the totality of the glycine sample was destroyed after irradiation (as it was in the current experiment), but they did not mention any by-product nonvolatilized at room temperature.
The OCN− and CO bands formation was observed at 2165 and 2136 cm−1, respectively, for 40 K and 80 K. These bands appear at the beginning of the irradiation and tend to vanish along the process. The formation cross-section of each glycine product (daughter molecules) depends on how “easy” the precursor molecule breaks into particular fragments. However, once they are formed, their abundances depend also on their molecular fragility to radiolysis or chemical reactivity, which means on their destruction cross-section. OCN− is a radical, therefore extremely reactive. At the same time, CO is stable; so its disappearance should be explained differently, for instance by its diffusion to the sample surface and then desorption. At low temperatures, the CO diffusion is expected to be quenched.
The absence of CO2 band formation in low temperature samples during the irradiation process may be due to the relatively high electron beam current or due to the IR contamination at 2340 cm−1 by the atmospheric CO2 inside the FTIR equipment and around the UHV camera.
5.1. Astrophysical insights
The main results of this work are related to glycine compaction and destruction cross-sections obtained for different temperatures (40 K, 80 K, and 300 K) that have implications in astrophysical terms. Many authors have estimated the half-life of organic compounds, such as amino acids and nitrogenous bases, to check how energetic radiations may destroy any organic molecule (in solid state) located in specific outer space environments of the solar system or interstellar molecular clouds (Evans et al., 2011; Gerakines et al., 2012; Maté et al., 2015). In terms of compaction effect, only astrophysical analog ice studies were performed (Dartois et al., 2013; Mejía et al., 2015).
Based on real data, the typical decay half-life of organic materials does not allow that these compounds survive within the inner or outer solar system; at least these materials are shielded by ice layers, for example (Evans et al., 2011; Gerakines et al., 2012; Maté et al., 2015). However, some authors conclude that these organic compounds are able to live on, although with low probability, during the presolar dense interstellar cloud formation up to the current solar system (Evans et al., 2011; Maté et al., 2015). In terms of compaction phenomena in astrophysical ices, the typical ion compaction rates determine that the ices are compacted within about 105–106 years in the interstellar molecular clouds; whereas for ices contained in the solar system, the compaction process depends on the distance between the Sun and the considered ice (Mejía et al., 2015).
In addition, from the energetic point of view, many authors discuss whether there is or not efficiency equivalence in the irradiation by UV photons, MeV protons, and keV electrons regarding: (i) the destruction of organic compounds and (ii) the processing of ice analogs to form organic materials (Holtom et al., 2005; Kaiser et al., 2013; Maté et al., 2014, 2015). For example, for the destruction of glycine, an evaluation study indicated that MeV protons are more efficient than UV photons, and these are more efficient than keV electrons (Maté et al., 2014). On the contrary, there are evidences supporting that keV electrons and MeV ions produce similar effects on a specific sample as a whole (Holtom et al., 2005; Kaiser et al., 2013; Maté et al., 2015).
Evans et al. (2011) have scaled 5 keV electron destruction cross-sections to effective destruction cross-sections for the MeV protons to determine the half-life of organic compounds, in particular for adenine. So the present data base shall be useful to do the same from 1 keV electrons to estimate the real decay of glycine in outer space, although the compaction effects should also be taken into account.
Conclusion
The glycine film prepared by vacuum deposition on KBr substrate appears in its α-form (and not in β-form); this result was obtained by the XRD technique. The α-GLY sample was irradiated in several temperatures (40 K, 80 K, and 300 K) by 1.0 keV electron beam at 40° incidence angle. Compaction cross-sections are determined for three sample temperatures. The results have shown that the compaction cross-session increases as the sample temperature decreases. The relative porosity for each temperature was estimated, indicating that the higher the temperature the greater the porosity of the sample. This result reflects on the fact that the efficiency to compact the glycine film goes in the opposite way. It was also found that compaction cross-sections are greater than the destruction ones about one or two orders of magnitude, depending on the α-GLY sample temperature. The energy-integrated destruction cross-section for the α-GLY is found to be (13.8 ± 0.2) × 10−17 cm2 at 300 K, whereas for low temperatures (40 K and 80 K) the destruction cross-sections are similar to each other (∼0.7 × 10⁻¹⁷ cm2). The tholin destruction cross-section is estimated to be (1.30 ± 0.05) × 10−17 cm2, indicating that the reaction rate of the glycine depletion process is ∼90% greater than that associated to the tholin decay at room temperature. The product of daughter and granddaughter energy-integrated formation cross-sections is determined for 300 K case:
Footnotes
Acknowledgments
The authors would like to thank FAPERJ (E-26/201.769/2017) and CNPq (118349/2017-1) for the PhD financial support at PUC-Rio during this partial research development. They are grateful for the collaboration of Dr. R. Avillez and Dr. S. Letichevsky for the data acquisition and analysis of the XRD spectra performed in this work.
Author Disclosure Statement
No competing financial interests exist.
Associate Editor: Petra Rettberg