




Abstract
Terrestrial simulations for crewed missions are critically important for testing technologies and improving methods and procedures for future robotic and human planetary exploration. In February 2018, AMADEE-18 simulated a mission to Mars in the Dhofar region of Oman. During the mission, a field crew coordinated by the Österreichisches Weltraum Forum (OeWF) accomplished several experiments in the fields of astrobiology, space physiology and medicine, geology, and geophysics. Within the scientific payload of AMADEE-18, ScanMars provided geophysical radar imaging of the subsurface at the simulated landing site and was operated by analog astronauts wearing spacesuits during extra-vehicular activities. The analog astronauts were trained to operate a ground-penetrating radar instrument that transmits and then collects radio waves carrying information about the geological setting of the first few meters of the subsurface. The data presented in this work show signal returns from structures down to 4 m depth, associated with the geology of the investigated rocks. Integrating radar data and the analog astronauts' observations of the geology at the surface, it was possible to identify the contact between shallow sediments and bedrock, the local occurrence of conductive soils, and the presence of pebbly materials in the shallow subsurface, which together describe the geology of recent loose sediments overlying an older deformed bedrock. The results obtained by ScanMars confirm that subsurface radar sounding at martian landing sites is key for the geological characterization at shallow depths. The geologic model of the subsurface can be used as the basis for reconstructing palaeoenvironments and paleo-habitats, thus assisting scientific investigations looking for traces of present or past life on the Red Planet.
Highlights
The ScanMars experiment brings a ground-penetrating radar to the AMADEE-18 simulated Mars mission.
The ScanMars radar was operated following procedures and training developed before the mission.
Approximately 2000 m of radar data profiles have been acquired during the analog mission.
Combining the results for ScanMars, orbital remote sensing data, and first-person observation in the field while wearing spacesuits (analog astronauts), it was possible to generate a geological model at the AMADEE-18 study site.
1. Introduction
Human exploration of Solar System bodies will include experiments and observations that are currently impossible to implement with orbital remote sensing or robotic missions. Astronauts will have direct contact with a planetary surface, outcrops, and habitats where potential traces of present or past life may exist, operative possibilities that are unreachable through any robotic mission. Currently, most of the very shallow subsurface (first few meters) of Mars remains unexplored, and as has been proven by human missions to the Moon, access to the subsurface by direct sampling and geophysical investigation is critical to understanding the material and sequence of processes involved in the evolution of an extra-terrestrial body (Schmitt, 1973). The nature of rocks and geologic processes throughout time are of primary importance for astrobiological investigations and subsequent sample return missions to Mars.
For this reason, simulated planetary missions that involve fieldwork on terrestrial analog sites (Farr et al., 2002; Osinski et al., 2006; Preston et al., 2014) represent an important activity to prepare and improve the scientific observations and enable us to better understand surface processes on Mars and other planetary bodies (Preston and Dartnell, 2014; Martins et al., 2017; Cavalazzi et al., 2019). In this context, the roles of geological and geophysical studies are fundamental in the following ways: (1) selection of a landing site, (2) assistance in scientific targeting, and (3) a focus on subsurface field campaigns, which, in the case of Mars, is relevant for astrobiological studies as the subsurface is shielded from oxidants and UV and ionizing radiation (Abrevaya et al., 2016; Rossi and van Gasselt, 2018). Survey methods needed for planetary missions should be tested during terrestrial analog exercises (Stoker et al., 2007; Boisson et al., 2011; Hamran et al., 2015), and forthcoming missions to Mars include geophysical imaging and in situ subsurface exploration (e.g., Mars 2020, Williford et al., 2018; ExoMars 2022, Vago et al., 2017; De Sanctis et al., 2017; Ferrari et al., 2018).
Fieldwork in hostile environments offers an important opportunity to build experience in terms of protocols, workflows, instrumental performance, and problem-solving techniques, all of which will enrich our knowledge and help to improve the design, operation, scientific analysis, and outcome of future missions (Snook and Mendell, 2004; Cannon et al., 2007; Groemer, 2014; Losiak et al., 2014a, 2014b). Several simulated missions have been developed in the past decade, such as the NASA DESERT-RATS (Abercromby et al., 2013), the NASA HI-SEAS (Binsted et al., 2013; Binsted et al., 2015; Häuplik-Meusburger et al., 2017), the ESA CAVES (Bessone et al., 2015), MOONWALK (Imhof et al., 2015; Vögele, 2016), MARS-500 (Poláčková Šolcová et al., 2016), and others (West et al., 2010; Steele et al., 2011). Recent analog field campaigns include MARS 160 (Knightly et al., 2018), BASALT (Beaton et al., 2018), PANGEA (Sauro et al., 2018; ESA, 2019), FELDSPAR (Stockton et al., 2017), CANMARS (Caudill et al., 2019; Osinski et al., 2019), and D-MARS (Rubinstein et al., 2019).
AMADEE is a research program handled by the Österreichisches Weltraum Forum (OeWF) and is scheduled between 2018 and 2028. AMADEE-18 (Groemer, 2018; Gruber et al., 2019) follows the OeWF's PolAres program, which included 11 missions simulating the conditions of the Red Planet. PolAres simulations have been under operation since 2006 in diverse terrestrial sites and environments (Groemer et al., 2007, 2014, 2016; Orgel et al., 2014; Dorizon et al., 2016) and were mainly focused on geoscience and astrobiology, with some of them featuring subsurface radar sounding experiments (Groemer et al., 2014, 2016). All of these simulations are aimed toward the reconstruction of geological evolution, astrobiological features, and the assessment of the habitability of martian environments.
The field experiments at Earth analog sites are part of the AMADEE-18 analog mission and support the success of AMADEE program as a whole, with an improvement in understanding the potential of the methods, techniques, and results, such as those presented in this work that describe the ScanMars experiment onboard AMADEE-18 simulated mission in Oman (Groemer et al., 2020 this issue).
1.1. Subsurface radar sounding
The use of electromagnetic waves for geophysical imaging of the subsurface has been under development since the 1970s (Annan, 2002). Similar to seismic imaging, radar echoing returned by impinged signal reveals geological structures beneath the topographic surface. This technique has evolved under the name of ground penetrating radar (GPR) and has been applied to a broad range of studies, including glaciology (Annan and Davis, 1976; Arcone, 1996; Arcone et al., 2005; Bradford et al., 2009a, 2009b; Forte et al., 2013; Godio et al., 2015; Colucci et al., 2016; Del Gobbo et al., 2016; Godio and Rege, 2016; Santin et al., 2019), structural and sedimentary geology (Grasmueck, 1996; Bristow and Jol, 2003; Pipan et al., 2003; Neal, 2004; Ercoli et al., 2012), paleoenvironmental reconstructions (Pellicer et al., 2012; Tillmann and Wunderlich, 2014; Liu et al., 2019), seismotectonics (Liner, 1997; McClymont et al., 2008; Ercoli et al., 2014; Cinti et al., 2015), geotechnical engineering (Liu and Xie, 2013), and archaeology (Daniels, 2004; Jol, 2009; Solla et al., 2011; Ercoli et al., 2016; Kowalczyk et al., 2017; Casas et al., 2018). The GPR represents a powerful noninvasive imaging technique that is capable of collecting data from the subsurface with high spatial resolution in a relatively short time.
1.2. Radars in planetary exploration
Radar sounders, in their orbiting form, have already been successfully deployed to some bodies of the Solar System. In the Apollo era, the Lunar Sounder Experiment was part of the payload of the Apollo 17 mission to the Moon (Porcello et al., 1974). In the 2000s, Italian radar experiments were part of the ESA Mars Express and NASA Mars Reconnaissance Orbiter (MRO) missions to Mars. The Mars Advanced Radar for Subsurface and Ionosphere Sounding (MARSIS) and the Shallow Subsurface Radar (SHARAD) have characterized the geology of the martian icy layers (Picardi et al., 2005; Plaut et al., 2007; Seu et al., 2007; Phillips et al., 2008; Orosei et al., 2018). SELENE's Lunar Radar Sounder onboard the Japanese Kaguya mission to the Moon has been used for characterizing the lunar regolith (Ono et al., 2008). The CONSERT experiment onboard the ROSETTA mission to comet 67P/Churyumov-Gerasimenko was a bistatic radar used for probing the nucleus of the comet (Kofman et al., 2015). Radar sounders are also planned in future missions. The Radar for Icy Moon Exploration (RIME) (Bruzzone et al., 2013) onboard the JUpiter ICy moons Explorer (JUICE) mission will provide orbital subsurface sounding for the icy crusts of Ganymede, Europa, and Callisto. Since the 1990s, GPR has been studied as a possible part of a scientific payload on a planetary robotic mission (Grant and Schultz, 1992; Grant et al., 2003). The Chang'e-3 robotic mission accomplished the first GPR survey on the Moon (Fang et al., 2014; Su et al., 2014; Ding et al., 2020).
NASA's Mars 2020 and ESA's ExoMars 2022 will be the first two robotic missions operating GPR experiments at the surface of Mars. The data returned by Radar Imager for Mars' Subsurface Exploration (RIMFAX, Hamran et al., 2016) and Water Ice and Subsurface Deposit Observation on Mars (WISDOM, Ciarletti et al., 2017) will be critical for knowledge of the first few meters of the martian subsurface, which is protected from damaging radiation and thus the ideal target to preserve past and/or present traces of life (Abrevaya et al., 2016).
2. The ScanMars Experiment
ScanMars was proposed in response to the announcement of opportunity launched by OeWF in the summer of 2017. The submitted idea aimed at accomplishing shallow subsurface geophysical imaging of arid environments at the analog landing site by including a GPR experiment into the scientific payload of AMADEE-18. In contrast to common GPR campaigns, where experts operate and have direct access to the instruments, ScanMars experiment will train the analog astronauts, who are not field geophysicists, to operate the radar when wearing spacesuits during the extra-vehicular activities planned for the mission. Data collected by ScanMars offer the opportunity to extract information on the geological setting, including the presence of water or structures related to past or current activity, similarly to the subsurface investigations on Mars made at the global scale by the orbital planetary subsurface radar sounders MARSIS and SHARAD (Seu et al., 2004; Picardi et al., 2005; Plaut et al., 2007, 2009; Stuurman et al., 2016; Orosei et al., 2015). Orbital subsurface-penetrating radars offer global coverage and a penetration depth of several hundred meters with a resolution of tens of meters, whereas surface GPR returns data from the first few meters of the subsurface with a spatial resolution that is capable of imaging geological structures and layers down to a few centimeters. In this perspective, GPR experiments are well suited for the scale of observations that are common in robotic and human landed missions.
In July 2017, ScanMars was selected to be part of the AMADEE-18 mission, which is scheduled for February 2018 in the Dhofar region of Oman. The experiment includes the instrument, training of the analog astronauts, and planning the observations from available remote-sensing data. These single elements were put together to run the ScanMars experiment. The instrument used for the ScanMars experiment consists of a commercial GPR Zond-12e manufactured by Radsys, Latvia. Among the commonly used antennae operating from tenths of megahertz to a few gigahertz, we chose an operative frequency of 500 MHz as a good compromise between spatial resolution, penetration depth, and maneuvrability of the antenna on the field. Lower frequencies would penetrate deeper in low-loss media at the expense of lower spatial resolution. In addition, the larger physical dimensions of the antenna would be impractical for the astronauts in spacesuits. On the other hand, higher operative frequencies up to 1–2 GHz offer a very compact antenna system and higher spatial resolution, but the reduced penetration of the signal (∼50 cm; Annan, 2001) would preclude the detection of geologic structures and layers beneath the soil.
With the selection of a 500 MHz antenna for ScanMars, we expected a penetration depth up to 10 m with a vertical resolution of a few centimeters, which enables the detection of features that would be impossible to identify from surface observations. An odometer was applied to the antenna sled, and the wheel was programmed to trigger the data acquisition every 2 cm along the antenna path, setting the horizontal spatial resolution of the survey.
The pre-mission phase involved the production of procedures and their testing during the training rehearsal with the analog astronauts and the field crew. A few weeks before the mission, we had access to remote-sensing data of the landing site and started planning possible observation targets. The available remote-sensing data comprised an image mosaic in the visible range at a resolution of 0.5 m per pixel and a 5 m per pixel Digital Terrain Model (DTM). Geospatial data were served through an internet connection by the OeWF geospatial server offering Open GIS Consortium interoperable web services and accessed remotely by the Geographic Information System software QGIS (QGIS Development Team, 2020). Accessing these datasets over the internet, it was possible to quickly select scientific targets and plan possible ScanMars profiles (transects), which were then submitted to the science operations team and included in the mission schedule.
During the mission phase, the field crew acquired data following instructions from the mission support room. At the end of each day of extra-vehicular activity (EVA) ScanMars operations, data were saved at the base station and transmitted back to the mission control at OeWF in Innsbruck and archived as raw data. As soon as the raw data were made available on the mission server, a cycle of processing and interpretation by the scientific team transmitted feedback on the data quality and contents to the base station, so the field crew was able to proceed with the program.
In the post-mission phase, data were processed more accurately and re-interpreted and archived.
Figure 1 shows the timeline of the experiment, from the selection of the experiment to the deployment of the mission. The whole process lasted ∼1 year, which allowed the program to keep its very high rhythm of mission cycles, of one AMADEE expedition approximately every 2 years.

The ScanMars on AMADEE-18 lifecycle and timeline. After the selection of the experiment, the scientific team produced the Standard Experiment Information document (SEIF, see Fig. 2) describing the operational aspect of the experiment, and has been included in the field-crew training material. The face-to-face training offered the opportunity to review the procedures and to operate the instrument in first person by the field-crew supported by the field geophysicists. After the simulated mission in Oman, the publication of the results starts about one year after the selection process.
2.1. The development of procedures and training
The AMADEE-18 field crew did not include a field geologist or an expert in GPR data acquisition. In this scenario, the procedure and training of mission personnel becomes a critical part of the ScanMars experiment, which was operated in the field by personnel without previous experience in geophysical field data acquisition. Figure 2 shows the first page of the Standard Experiment Information Form (SEIF), which includes information about the instrument and operational procedures, from hardware setup to software operations. After an iteration of incremental revisions, the final SEIF document was delivered to the AMADEE-18 field crew, including the ScanMars instructions in their main training program. Technical terminology for GPR surveying needed to be explained and simplified as much as possible to make the SEIF usable by the crew. The training phase was then concluded at the OeWF headquarters in Innsbruck, where a face-to-face meeting was conducted to review topics related to radar principles, share questions, and review the procedures together with the field crew. During the training at OeWF, the field-crew team faced practical aspects of experiment deployment, for example, instrument assembly while wearing spacesuit gloves as shown in Fig. 3 or learning the correct force and speed to be applied to the antenna sled during the data acquisition. The field crew and the analog astronauts directly experienced the acquisition of radar data on the ScanMars display and were taught how to set up the main instrument parameters required to operate the radar correctly during EVAs. Examples of data acquisition cases that showed acceptable to very bad or no data acquisition, or data artefacts, were given to the crew to facilitate the detection of possible problems in the field.
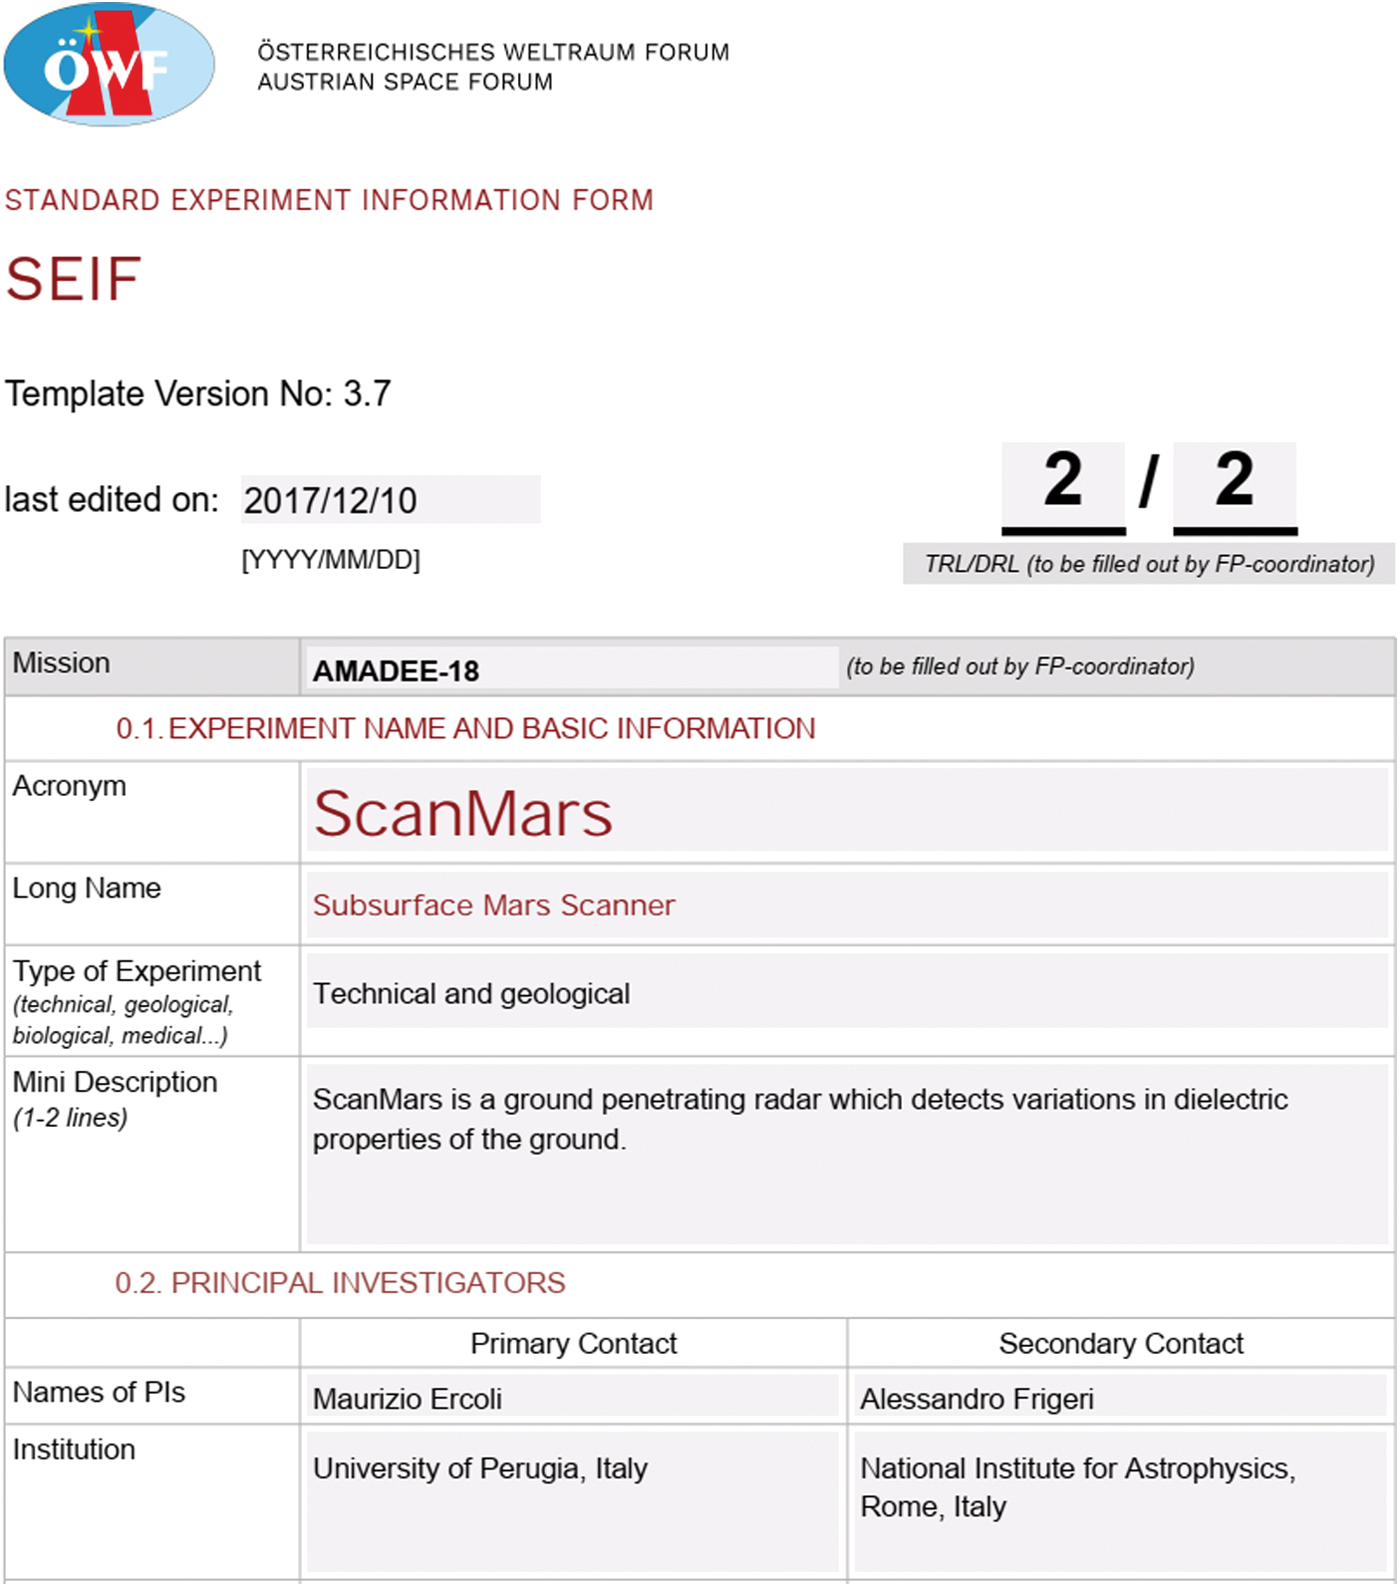
The title page of the Standard Experiment Information Form (SEIF) document for the ScanMars experiment, which includes the description of the radar equipment and its components, the step-by-step assembly and disassembly and operative instructions. This document has been the base for preparing the training and has been the reference manual during the simulated mission in Oman. Color images are available online.

ScanMars training. The analog astronaut trainee is testing operative procedures during the training at OeWF headquarters in Innsbruck, Austria. A commonly simple task like the assembly of the odometer on the antenna sled becomes challenging when it has to be done with spacesuits' gloves. The face-to-face training offered the opportunity to enrich the operational procedures with first person experience on the instrument hardware. Color images are available online.
2.2. Survey design and planning
The landing site of AMADEE-18 is in south Oman. The astronauts surveyed a desert area where dry riverbeds alternate with erosive surfaces and ancient marine sediments. The flat surfaces are part of the Shuram Formation, in the form of siliciclastic cohesive surfaces (Searle, 2019). The Shuram Formation was deposited in the shallow water of a marine platform and dates between Late Precambrian and Early Cambrian (Gorin et al., 1982). The geology of the area is characterized by the alternation between old marine units and more recent continental water-related deposits and structures. We planned observations that would cross dry fluvial sediments in search of water-related geologic features. A more extensive geology review and a reference geological map of the study site are available in the mission overview and laboratory analysis contributions of this issue (Groemer et al., 2020; Lalla et al., 2020).
2.3. Data acquisition
The AMADEE-18 experiments were deployed after the simulated mission began in February 2018. ScanMars was operated during EVA by two astronauts, one pulling the antenna system and the other holding the radar processing unit with a display that showed the operative parameters and a preview of the data being acquired (Fig. 4). The location of the planned transects stored in the mission's Geographic Information System (GIS) was converted into coordinates that the astronauts were able to follow by using GPS. The astronauts were commanded by the flight-control room and driven to target locations. The analog astronauts acquired ScanMars data over five different designated areas for a total of ∼2000 m of profiles collected during the whole mission. A total number of 22 bidimensional GPR profiles, corresponding to about 85,000 radar traces, were recorded and archived. Each trace comprises 1024 samples, spaced by 0.195 nanoseconds. Profile elevation along the ScanMars transects was extracted from the DTM (5 m per pixel resolution, available from the mission's GIS), from the start/end GPS coordinates of each transect. The scientific team had access to the data on a daily basis to check its quality and communicate or discuss any anomalies with the remote science support team, giving an opportunity to update the procedures between sessions when needed.
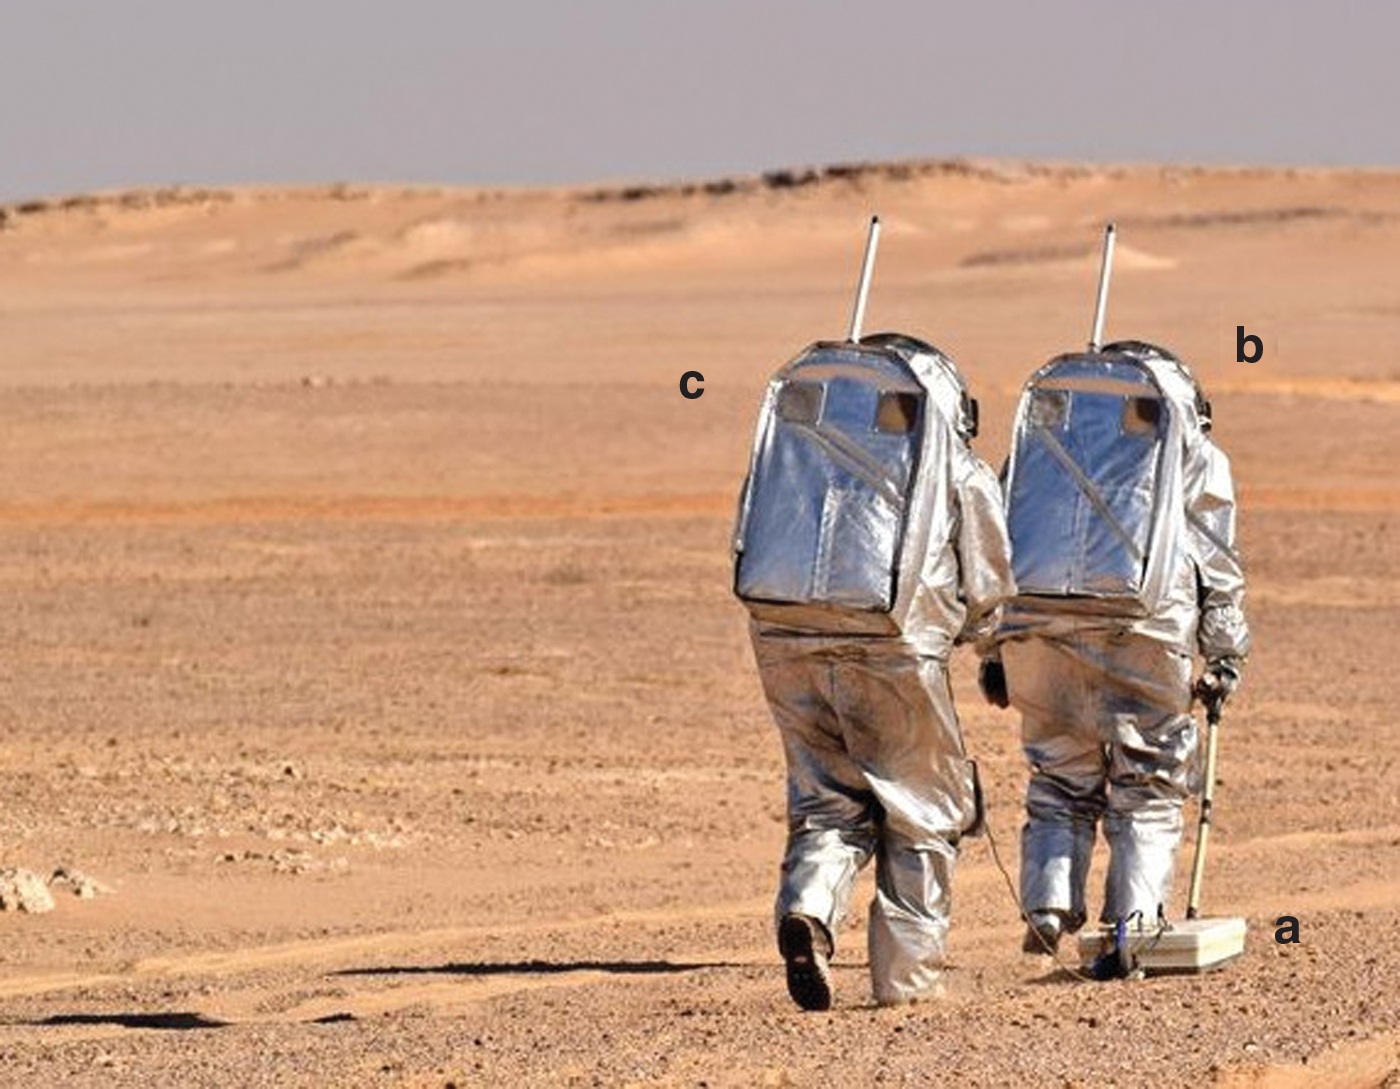
ScanMars operations during an Extra Vehicular Activity (EVA). The radar antenna sled
2.4. Processing flow
GPR is a high-resolution geophysics imaging technique that requires a processing strategy commonly dictated by the survey goal and the nature and complexity of the terrain being investigated; therefore, it is not possible to identify a standard processing pipeline.
For our processing of ScanMars data, we used the ReflexW software to design and save a customized processing flow (Jol, 2009). This also improved the signal-to-noise ratio of the data (e.g., removing unwanted noise components) and restored a reliable geometry to the reflections (e.g., real dip of reflectors and collapse of hyperbolic diffractions; Davis and Annan, 1989; Fisher et al., 1992). The processing flow we chose for ScanMars data is composed of 12 steps, which are applied in sequence:
This processing pipeline has been applied to all the ScanMars data acquired during the mission.
3. Results
We report here the results of our data analysis on two ScanMars profiles, n. 30 and n. 31. Measurements were made over one of the scientific target areas suggested in the planning phase, located at the contact between alluvial deposits and massive rocks that form the relief. Figure 5 shows imagery and topography of the study area with the location of the traces along which ScanMars radar profiles have been acquired. Profile n. 30 passes across the gently sloping alluvium deposits in the south-western sector of the site (Fig. 5, point a), whereas profile n. 31 starts in the alluvium, crosses profile n. 30, and ramps upslope across a bright outcrop (Fig. 5, point b), ending on the plateau at an elevation of about 6 m above the floodplain. The lengths of profiles n. 30 and n. 31 are 130 and 200 m, respectively.

Context map of the AMADEE-18 scientific target site presented in this work, showing the location of ScanMars profiles 30 and 31. Arrows indicate the direction of acquisition along the trace. Base-map is the 0.5 meters per pixel satellite image showing color variations of the terrain, while topography is represented by elevation isolines at 1-meter interval (data from National Survey Authority, Sultanate of Oman). From the analog astronaut's communication log we extracted the description of surface given at point
Figure 6 shows the data collected along profile n. 30. GPR echo returns acquired along profiles are commonly represented side by side in the form of a radargram, where the horizontal scale indicates the trace number or the distance along the profile, and the vertical scale is twice the travel time, which corresponds to the depth, given an average propagation speed (we used 0.1 m/ns). This visualization gives an opportunity to observe a vertical bi-dimensional variation of reflections and diffraction patterns of radar echoes, or radar facies (Huggenberger, 1993; Beres et al., 1999), which can be associated with different geological terrains and structures.

ScanMars data acquired along profile n°30 (see map in Fig. 5). Radar traces have been processed as described in the text and displayed in greyscale as amplitude (
In this work, we display the amplitude of the signals with the classic grayscale (Fig. 6a) and with their absolute value, or envelope, which enhances the strongest reflections (Fig. 6b) (Taner et al., 1979; Chopra and Marfurt, 2008; Forte et al., 2012; Zhao et al., 2013; Ercoli et al., 2015). ScanMars profile n. 30 crosses the sandy deposits that cover alluvial terrains, from south-east to north-west. Penetration depth along profile n. 30 reaches 2 m. Two strong reflections are evident on the first half and second half of the profile (Fig. 6a, respectively frame I and frame II). Radar reflections are generated by the contrast of the dielectric properties of the terrains, which may correspond to a change in the composition of rocks/deposits, a change of the geometric setting of the materials, or a combination of both. In this case, we relate the very bright reflections of Fig. 6a panel I and II to the contact between the shallow loose deposits and the bedrock. The latter is exposed at the surface in the hilly terrain and, from remote sensing imagery, appears brighter than the other materials (see Fig. 5, point b). The lack of a distinct reflection in the central portion of this profile may be related to signal attenuation due to the presence of conductive minerals in the sediments, for example, an enrichment in clays. Another reason for the missing reflection from the bedrock in the central part of the radargram may be due to an increase of sediment thickness that resulted in attenuation of the detectable signal under the noise level.
Figures 7 and 8 show ScanMars data from profile n. 31. For this radar profile, it was possible to associate analog astronauts' observations reported from the field during the geophysical data acquisition, describing the type of terrains at the surface. From the astronauts' communications log, it was possible to describe the surface at location “a” of Fig. 5 as follows: “a flat surface made by sandy soil, with some sparse poorly sorted rock pebbles concentrated in the first part of the profile,” whereas the bright material at point b is reported as “a totally rocky part at the beginning of the hill.” Figure 7 shows a detail of the raw data with its diffraction pattern, or radar facies, which is typically originated by small rocks at the surface and shallow subsurface (down to a depth of 1 m) correlated to the description of the surface at site “a” next to the base of the sloping terrain.
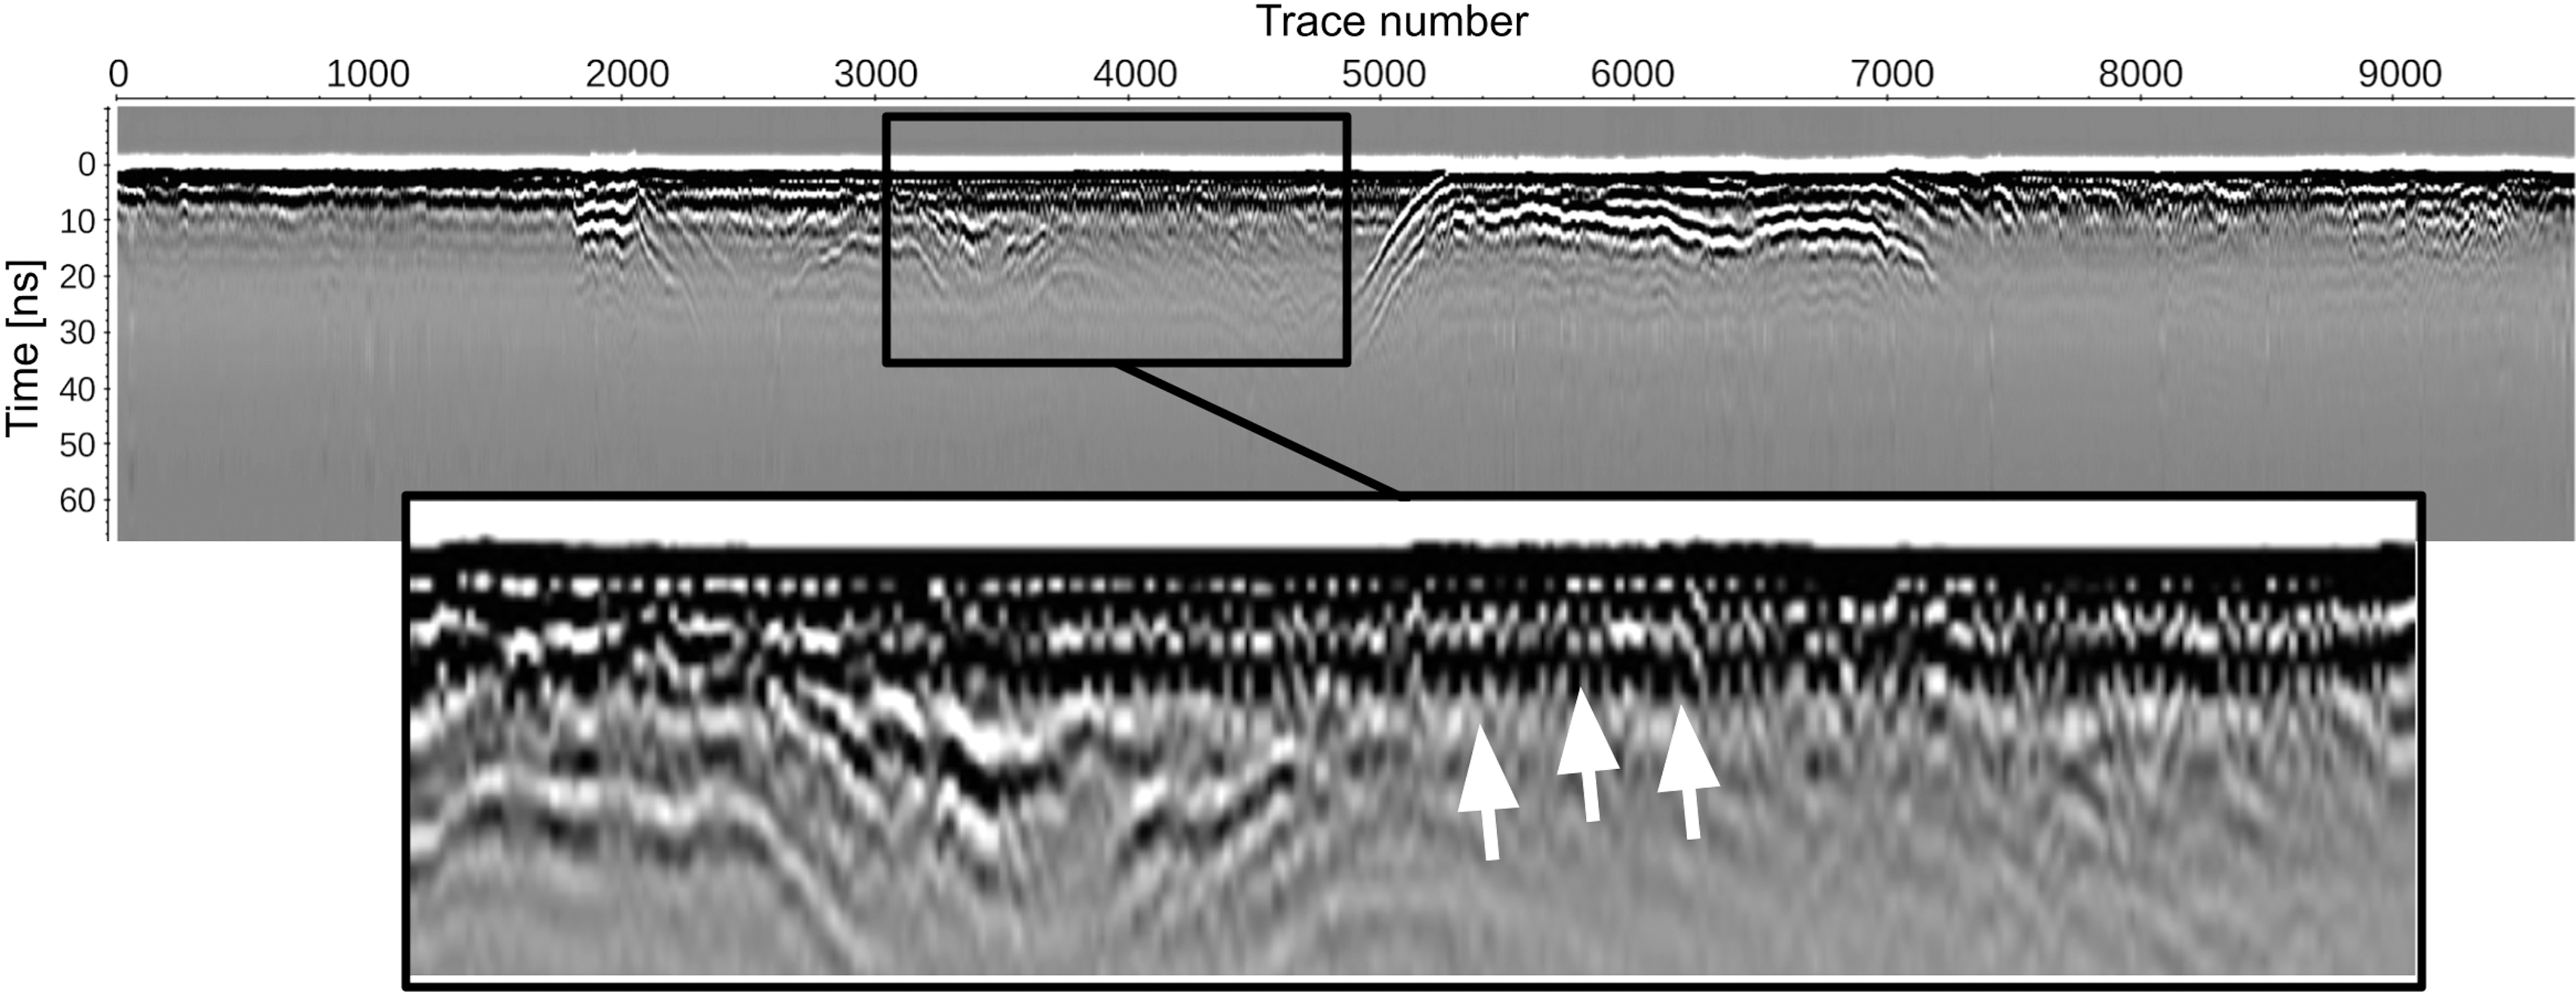
ScanMars data acquired along profile n°31 (see context map of Fig. 5). The horizontal axis reports the trace number and the vertical axis is the Two-Way-Travel time (TWT) of the radar echoes. The black frame indicates the extent of the magnified part of the radargram showing the radar facie associated with the presence of rocks within the loose sediments in the shallow subsurface.

Processed profile n°31, reported in distance versus depth.
Figure 8 reports the processed profile n. 31, shown in grayscale (Fig. 8a) and with the envelope attribute (Fig. 8b). Panel I shows a detail of the radargram that corresponds to outcrop “b” described in the astronauts' communication log. In this zone, the radargram shows curved reflectors following the concave topography and continuing under the surface reflection. These radar data are correlated with a rocky antiform structure exposed along the topographic profile, being covered by layered sediments at the brake of the slope indicated by the white arrow in Fig. 8, panel I. Panel II shows a curved reflector and a dense pattern of shallow reflections, typically generated by small pebbles in the shallow subsurface (also detectable as dense small diffractions in unmigrated profiles), similar to the same radar facies observed in profile n. 30. The curved reflector in panel II is very likely generated by the contact between the bedrock and the overlying pebbly terrain, but in this case the bedrock is not outcropping.
Figure 9 reports the geological cross-section created by the combined interpretation of the radar data, field notes, photographs taken in the field by the analog astronauts, and satellite remote-sensing imagery. The geologic cross-section shows three different units, their boundaries, and their stratigraphic relationship. The lowermost unit is the layered rocky bedrock that shows the major antiform structure outcropping along the profile and minor buried structures in the first part of the profile. An angular unconformity separates the sandy-pebbly sediments (Fig. 9, photo 2) from the underlying bedrock (from 40 to 100 m and from 140 to 160 along the cross-section of Fig. 9). The sharp edges of the pebbles shown in the photographs suggests that they have been generated locally from the erosion of bedrock material or some other rocky unit topographically more elevated and emplaced by gravitational deposition or rapid flooding. The uppermost unit is made by sand (Fig. 9, photo 1), which occurs at the base of the slope. The contact between the sand and the pebbly terrain is not clearly detectable from radar data or documented in the field, but these sediments are probably the most recent of the three.
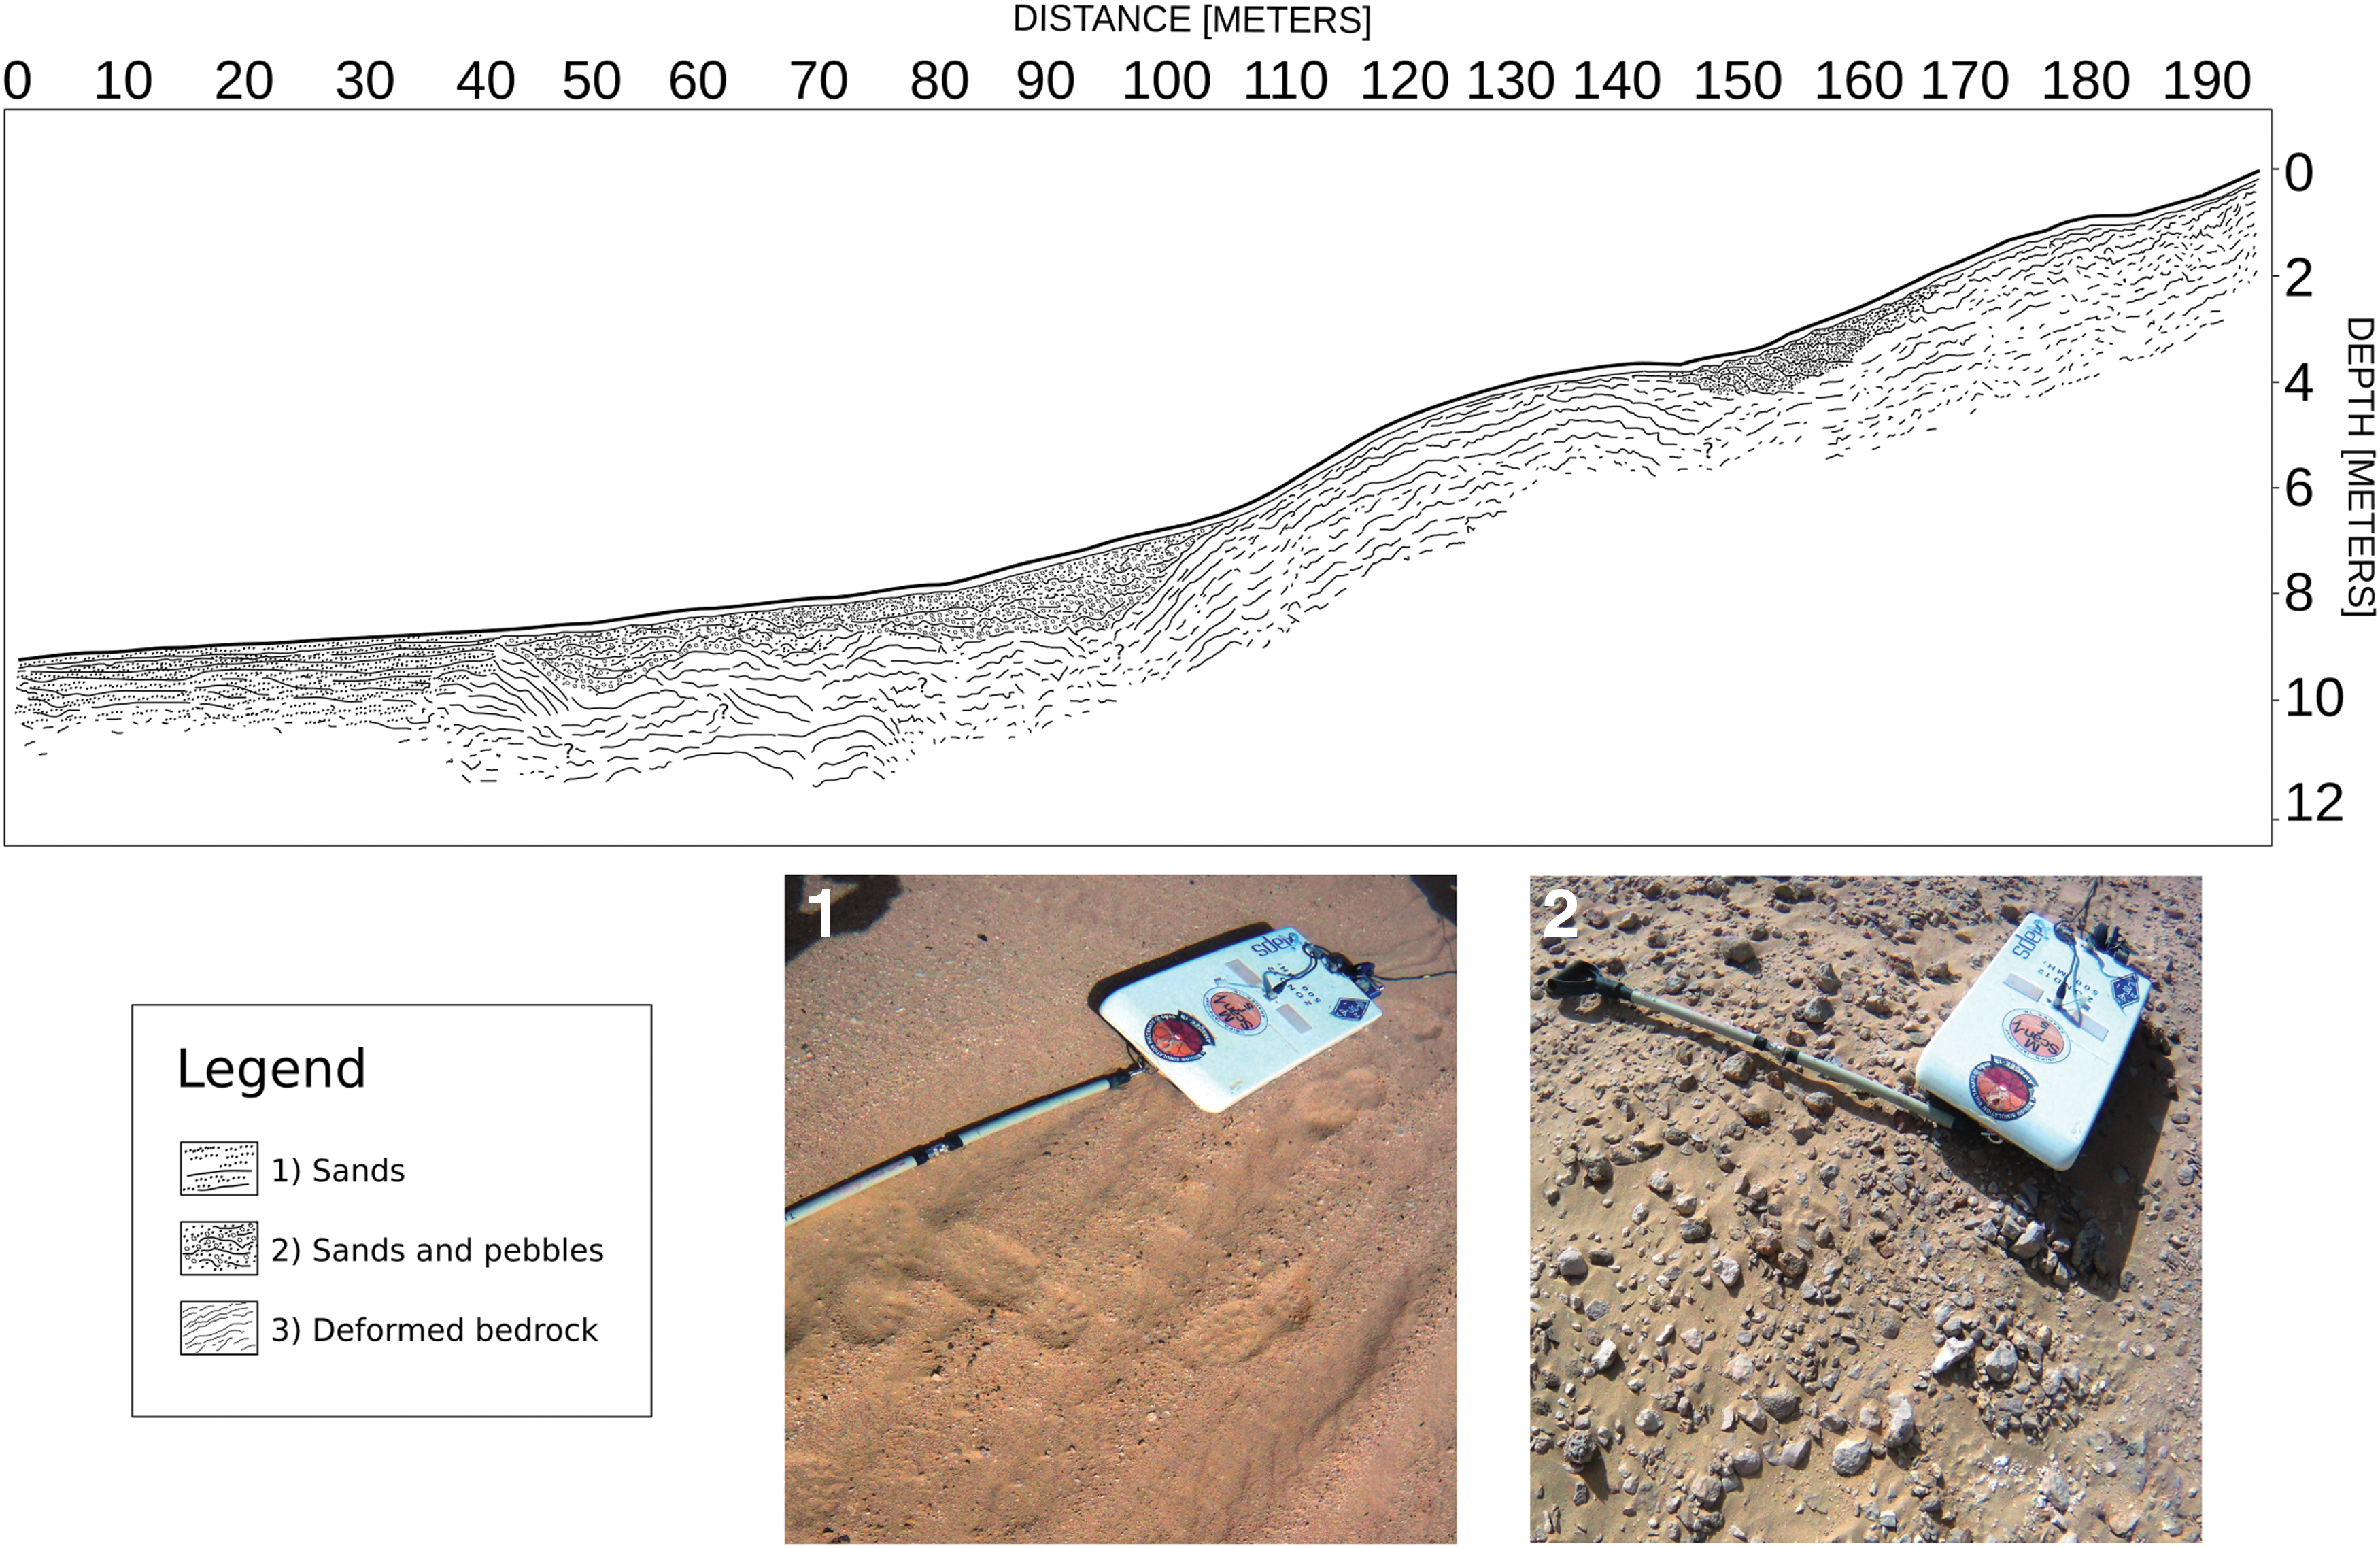
Geologic cross-section produced from the combined interpretation of radar data, remote sensing data (see Fig. 5) and astronaut observations from the surface along the profile. Pictures
The geological processes associated with the emplacements of the units described earlier are, in sequence: (1) the compressive deformation of the bedrock, (2) the gravity- or flash flood-driven deposition of the pebbly sands, and (3) the aeolian deposition of sands at the base of the slope.
The morphology shown by remote-sensing data in Fig. 5 suggests that water had an important role in shaping the landscape of this area. Although we did not find evidence of signals generated from the water table, we cannot rule out its presence below the investigation depth of our survey.
The geometric setting and spatial relationship between the signals of the two radar profiles can be visualized in a three-dimensional environment. Figure 10 reports a visualization seen from the north-west of the two ScanMars profiles and their crossing point, showing the geometries of the signals associated with the subsurface geology, including the antiform outcropping along the topographic profile, the loose infills at the base of the scarp, and the layers at the intersection of the profile.

ScanMars data of profiles n. 30 and 31 visualized in three dimensions. Color scale indicates the amplitude of the radar signals, approximate spatial scale is reported (5 times vertical exaggeration). The view is oriented from the top left corner to the bottom left corner of the context map of Figure 5 (NW to SE). The curved reflections associated with the antiform can be followed along the profile, dipping under the radar facie associated with the loose sediments, onlapping over the bedrock at the base of the slope. Visualizing the two radar data profiles in three-dimension allows to observe aspects which are impossible to render in two dimensions, as for example the attitude of the signal associated with the bedrock reflections at the crossing of the two radargrams. Color images are available online.
4. Discussion
The dataset returned from the ScanMars experiment presented in this work explored the subsurface of one of the AMADEE-18 scientific target sites down to a depth of 4 meters, showing a wide range of different signal returns. The interpretation of GPR facies applied in our work provides a way to classify different sedimentary terrains and structures, and their geometrical relationships within the volume of the rocks explored by the survey.
The data show several GPR facies, including (1) high-amplitude low-frequency reflectors, (2) lower amplitude high-frequency reflectors, (3) attenuated areas, and (4) diffraction patterns. We interpret these data to be related to specific geological features as follows: (1) sedimentary layering, (2) bedrock layers, (3) presence of conductive soils (compositional changes), and (4) presence of pebbly materials in the shallow subsurface (change in terrain texture). The spatial relationship of these facies is the result of the sequence of geological processes that occurred throughout the geological history in this region.
The capability of locating shallow subsurface structures by GPR has significant relevance to astrobiology studies, particularly those that search for habitable past environments on Mars.
Since the surface of Mars is hostile to life, with radiation, cold temperatures, and oxidative chemistry destroying organic matter, GPR experiments open a view into the shielded shallow subsurface. Buried geological structures and their relative emplacement processes, when indicating habitable conditions, may be linked to the potential evolution of life on the planet, or possibly host biomass. Moreover, it is also possible that the shallow subsurface of Mars hosts ice, liquid water, and oxygen (Stamenkovic et al., 2018).
As a noninvasive geophysical method, radar sounding offers an indirect measurement of the geological setting of subsurface structures, requiring the conversion of echo returns from time to depths with an estimate of the propagation speed of waves in the subsurface. Coupling a radar with an in situ investigation, such as an explorative drilling campaign, will provide direct access to subsurface rocks, thereby enabling the validation of radar data (Tillmann and Wunderlich, 2014).
Such procedures have been planned for the ESA-Roscosmos ExoMars 2022 mission, where the WISDOM radar and Ma_MISS spectrometer within the drill will coordinate noninvasive radar and in situ compositional observations to depths of 2 m in the subsurface of the ancient terrains of Oxia Planum (Ciarletti et al., 2017; De Sanctis et al., 2017; Vago et al., 2017). After the drilling, the spectrometer will detect the composition of the rocks being investigated. From the composition of the different layers, it will be possible to improve the quality of radar data processing, deriving a more accurate model of propagation of the electromagnetic waves in the ground. Moreover, GPR data will be critical for the selection of the drilling site, targeting interesting reflectors, or indicating where drilling could be cumbersome, as in the case of the presence of boulders in the terrain, hampering continuous drilling to depth. This is also true in the case of a mission that will prepare samples to be returned to Earth, for example, NASA Mars 2020, where the radar will assist the selection of the best location for extracting unweathered samples.
Using ScanMars in the selection of a drilling site for astrobiology purposes would avoid explorative drilling where the dense diffraction pattern of radar signals suggests the presence of buried boulders in the shallow subsurface (Fig. 7). A possible target for drilling could be the layered bedrock at the outcrop along the slope (Fig. 8) or just over the onlapping layers (Fig. 8, panel I, white arrow) so that the drilling would investigate or sample more terrains down to 1–1.5 m, for example, the recent layered deposits, their contact with the bedrock and the layered rock, which potentially host traces of present or past life. Compositional data obtained from this explorative drilling could then be applied to the processing of radar data for more accurate depth-converted profiles.
Another feature of the radar technique relevant to astrobiology is its capability to detect interfaces between materials with very high dielectric contrasts, such as the interface between rock and water or air (Annan, 2002), enabling the mapping of the water table or cavities, such as lava tubes or ice caves (Clifford, 1993; Cushing et al., 2007; Williams et al., 2010).
Results from our ScanMars and forthcoming experiments onboard Mars2020 and ExoMars 2022 support the idea that GPR is a key instrument for current and future landed planetary missions focused on the search for signs of present or past life on Mars, sample return, and human exploration.
Our experiment has successfully operated thanks to the enthusiastic effort of all the personnel of the mission, from the field crew to the operations and science teams.
Working on the definition of procedures for the operation of ScanMars by nonspecialized personnel in a limited timeslot of a few months has been shown to be particularly challenging. To keep operations practicable by the analog astronauts, we had to preselect the operating modes for the radar (spatiotemporal resolution, setup of sampling time window); however, these are usually optimized by experts in the field depending on the particular terrain. Ideally, having a trained field geophysicist in the field would minimize the risk of losing precious time during the analog campaign by selecting the acquisition strategy on site. Moreover, the presence of a field geologist would also support the scientific experiments through observation of the geologic context at the surface, which in our work was shown to be fundamental in interpreting the data with confidence (see interpretation of profile n. 31).
The typical AMADEE mission lifecycle lasts ∼2 years, which is extremely quick compared with actual missions, where just the landing site selection itself takes more than 5 years (Golombek et al., 2012). This represents an opportunity to accomplish a complete analog mission project within a relatively short timeline, which gives the opportunity to improve the general technical and procedural aspects over subsequent mission cycles.
From our experience within this tight schedule, we have found that there is still space to optimize the time devoted to the geoscientific characterization of the analog landing area. To improve future AMADEE missions, it would be advisable to allocate more time for scientific familiarization with the simulated landing site, starting as soon as possible in the mission timeline, which would allow the mission team to discuss the scientific campaign. The geoscientific knowledge of the landing site from remote sensing has been an essential aspect since the beginning of planetary exploration. Being a time-consuming, iterative, and interpretative task, the sooner the scientific reconnaissance of the landing site begins, the more time will be available for the planning of the scientific campaign. Possible enhancement of future AMADEE missions might involve organizing a single or multiday scientific workshop focused on the geoscientific characterization of the simulated landing site or region as soon as the field-study area is known.
AMADEE-18 excelled in design, planning, and the deployment of the remote sensing data distribution to the team. Remote-sensing data were made available as soon as possible by the OeWF team, and the dissemination of data through interoperable GIS web-services was invaluable and facilitated planning and communicating ScanMars transect location seamlessly with the whole mission team.
Another aspect for improvement that arose during ScanMars was the difficulty in operating instruments that are not customized for use in an analog space mission. The use of off-the-shelf commercial equipment introduced certain complexities during operation by analog astronauts in bulky space suits, such as difficulties in assembly, handling the hardware, and the physical operation of the instrument. Building a specific instrument for an analog mission would introduce unmanageable budget costs and would be impossible to realize in the timeframe proposed by the AMADEE mission model. A viable solution would be to study this aspect in detail, for example by a dedicated task or activity that locates critical aspects with the intent to develop possible modifications to commercial hardware, and improve the ergonomics for use by analog astronauts in spacesuits.
The AMADEE-18 ScanMars experiment gathered a wide pool of experience from the beginning to the end of the mission and added to similar experiments (Groemer et al., 2014, 2016) and improved aspects related to the compactness of instruments, pre-mission training, and remote science support operations during the mission.
The new scientific data and technical knowledge gained during the mission have increased our research and operational competence and will improve the quality and effectiveness of future surveys.
5. Conclusions
This work describes the ScanMars experiment onboard AMADEE-18 analog mission, held in Oman in February 2018. The ScanMars scientific field campaign returned radar data from ∼2000 m of profiles acquired over several target sites. We provided procedures and trained analogue astronauts, who, without previous experience in this field, were able to run the experiment along the planned transects in their spacesuits at the simulated landing site. The day-by-day analysis of the collected data allowed us to improve the procedures and the tuning of the instrument during the simulated mission. Herein, we presented the results from one of the sites explored, where the radar imaged the subsurface down to 4 m in depth, showing signals that allowed for the detection of folded layered rocks, alluvial deposits, and shallow debris, and describing the geology of relatively recent loose terrains emplaced over an older deformed bedrock. We successfully demonstrated that GPR techniques are important tools for paleogeographic reconstructions, which is relevant to astrobiological studies where paleo-surfaces unexposed to space radiation represent potential scientific targets for biosignature searches.
The AMADEE timeline model represents an interesting opportunity to accomplish a complete analog mission within a time frame of around 2 years from mission to mission, requiring and stimulating cooperativeness among the mission team.
The experience gained from the experiment revealed some aspects of the project that could be improved in the future, specifically the need for a longer preliminary geoscientific study of the landing site, the presence of a geoscientist in the astronaut crew or a longer and more geoscience-focused training program, and the introduction of a study devoted to increase the ergonomics of the instruments by the use of personnel in spacesuits.
The experiment successfully fulfilled its main task of bringing an astronaut-operated GPR to an analog landing site, thereby assisting the characterization of the subsurface geology of the target area.
ScanMars adds to a growing list of analog mission experiments that contribute to the design of future planetary surface exploration programs, the search for signs of present or past life, preparation for sample return, and human space exploration.
Footnotes
Acknowledgments
We are grateful to Barbara Cavalazzi and Keyron Hickman-Lewis for their comments and discussions on the astrobiological aspects of this research. We thank Trent Hare for edits and suggestions.
Author Disclosure Statement
No competing financial interests exist.
Funding Information
No specific funding has been received for this research.