
Abstract
Astrobiology is an ideal context to engage students with the processes of science. However, there is a problem in measuring the effectiveness of engaging students with astrobiology where the learning outcome is aimed at improving student views of science. Most studies suggest little to no change in students' views of science, especially in short experiences of hours or days. These studies mostly use quantitative methods, such as numerical scores derived from survey rating scales and responses. We propose that hidden in those figures, the words of students in written survey responses are telling us about the effectiveness of astrobiology outreach at improving understanding of science. We sampled 483 students from multiple high schools involved in an established astrobiology outreach program in Australia, using pre- and postintervention data collected from an open- and closed-form survey to identify the impacts of the program on students' views of science. We applied both conventional quantitative score analysis methods and computer-based qualitative analysis methods—NVivo and Linguistic Inquiry and Word Count (LIWC) programs. While there was little difference in postsurvey scores, there is evidence in the qualitative data that the astrobiology program creates cognitive conflict in students, a trigger to the learning process that can open students to the first steps in understanding the creative, subjective, and tentative nature of science.
1. Introduction
How students view the Nature of Science (NOS), or how science is practiced, is considered essential to understanding science altogether (Lederman, 1992; Lederman et al., 2002, 2013). However, the NOS is an aspect of science that schools struggle to deliver in the formal classroom environment (Windschitl et al., 2008; Fernandes et al., 2018). As an emerging and multidisciplinary field, astrobiology provides an ideal setting to engage students in the process of science. It is a window—a window into the NOS and into how students view and interpret scientific methodology, the role of creativity and imagination in science, the influence of personal, cultural, and societal factors on science, and the tentative nature of scientific knowledge.
The fundamental problem with astrobiology outreach is that studies where learning impacts are measured mostly reveal little to no change, and in some cases, even a slight decrease, in students' views of NOS after participation in the programs (Oliver, 2008; Fergusson et al., 2012; Kingsley et al., 2017). This problem especially applies to the most commonly shorter outreach experiences, but even in extended programs lasting multiple months, there are puzzling instances of a decrease in comprehension of aspects of NOS (Oliver, 2008; Fergusson et al., 2012; Kingsley et al., 2017). The question is why are these decreases—even small ones—detected in survey results?
Most evaluation research uses quantitative survey tools that utilize rating systems, such as Likert scales, where respondents rate the extent to which they “agree” or “disagree” with statements (Deng et al., 2011; Metcalfe et al., 2012). Quantitative methods are useful for statistical analysis and hypothesis testing (Leung, 2018). However, this article demonstrates that by compressing complex and multidimensional constructs—such as student views of NOS—into simple numerical values, many of the learning outcomes may remain obscured. Access to these learning outcomes could inform the design of effective education programs (Deng et al., 2011).
Qualitative data, for example, in the form of written content, can provide more nuanced insights than available in quantitative data (Deng et al., 2011). Words, in particular, can provide rich information about people's beliefs, motivations, and cognitive processes (Pennebaker et al., 2015c; Shapiro et al., 2017). Astrobiology outreach evaluation rarely uses qualitative data because researchers perceive the analysis process as difficult, resource intensive, and lacking in rigor (Welsh, 2002). However, new enhancements in computer-based qualitative analysis methods may open up new ways for researchers to use qualitative data to conduct both rigorous and in-depth investigations on the effects of astrobiology programs by exploring the words students use when asked about the NOS.
1.1. Aim of the study
The primary aim of this study was to explore how to better measure and detect changes in student views of NOS after participating in an astrobiology education program. We took two approaches. In the first, we applied conventional quantitative analysis methods to numerical survey response scores. In the second, we used two different computer-based qualitative analysis programs to analyze students' written responses to open-ended questions: (1) we used the software program NVivo to uncover thematic trends in written responses, and (2) we used the software program Linguistic Inquiry and Word Count (LIWC) to explore the psycholinguistic features within written responses. We formulated the following hypothesis: H1: Qualitative data, encoded in written responses to open-ended questions, can provide richer insights into the effectiveness of astrobiology education programs than available in quantitative data.
The related research questions are as follows:
RQ1: Does standard pre- and postsurvey data reveal useful information in short experience astrobiology education programs?
RQ2: Can the use of the computer-based qualitative analysis programs NVivo and LIWC provide new insights into the effectiveness of an astrobiology education program?
2. Background
2.1. Views of the NOS
How students view the NOS is considered fundamental to shaping their frame of reference for making sense of scientific knowledge, practice, and implications (Lederman, 1992; Lederman et al., 2013). Saunders (1955) even described it as the “most important purpose of science teaching” (p. 12). For decades, science curricula around the world have focused on developing adequate conceptions of NOS in students [American Association for the Advancement of Science, 1993, 2009; National Research Council, 1996; Council of Ministers of Education (Canada), 1997; Australian Curriculum Assessment and Reporting Authority, 2018]. NOS most commonly refers to the epistemology of science, of how scientific knowledge develops, and of science as a way of knowing (Lederman, 1992; American Association for the Advancement of Science, 1993, 2009; Lederman et al., 2013). The generally accepted characteristics of NOS are as follows: Scientific knowledge is tentative (subject to change in light of new evidence or reconceptualization of existing evidence), empirically based (based on observations of the natural world), and subjective (science aims to be objective and precise but is influenced by the state of scientific knowledge and researchers' personal background and societal factors). Science involves human inference, imagination, and creativity (scientific knowledge is created from scientists' imagination and logical reasoning). Science is socially and culturally embedded (society and culture determine what and how science is conducted, interpreted, and accepted). Science uses various methods (scientists do not all follow a single, universal, step-by-step scientific method) (American Association for the Advancement of Science, 1993, 2009; National Research Council, 1996; Lederman et al., 2013).
Despite the curricular focus on NOS, a common question posed in the literature is why do students still consistently demonstrate inadequate conceptions of NOS (Deng et al., 2011; Lederman et al., 2013; OECD, 2016)? One reason put forward is that certain critical elements of NOS are overlooked in school science, in particular, the role of creativity and imagination in scientific practice (Mathewson, 1999). Although curricula state the role of creativity and imagination in their definitions of the NOS [American Association for the Advancement of Science, 1993, 2009; Council of Ministers of Education (Canada), 1997; Australian Curriculum Assessment and Reporting Authority, 2018], the associated curricular learning outcomes do not explicitly address this aspect of NOS.
A second reason put forward is the transmissive, content-focused, rote learning approach to science education is at odds with scientific practice, leaving students with misconceptions of science and the work of scientists (Lederman, 1992; Lederman et al., 2002; Kind et al., 2007; Windschitl et al., 2008; Fernandes et al., 2018). Lectures, worksheets, and laboratory experiments that use a recipe-like method—the scientific method—result in students viewing science as rigid, linear, absolute, and uncreative (Lederman, 1992; Lederman et al., 2002; Kind et al., 2007; Windschitl et al., 2008; Fernandes et al., 2018). These misconceptions are durable and shape how students think about science (Lederman, 1992; Windschitl et al., 2008).
2.2. Cognitive conflict and learning
Although changing misconceptions is difficult, change can occur when students engage in experiences that expose them to new information and create cognitive conflict (Kowalski and Taylor, 2009). Cognitive conflict is a psychological state involving a discrepancy between existing knowledge and new information to be learned (Waxer and Morton, 2012).
The learning process involves integrating new information into existing knowledge structures—that is, the way information and knowledge about a topic are mentally organized into an interrelated collection of concepts (Adcock, 2012). When students are presented with new information that contradicts their existing knowledge structure, it triggers cognitive conflict. As an example, imagine presenting students with evidence that scientists use creativity and imagination in interpreting research results when their present understanding is that scientists do not use creativity because it can interfere with objectivity. Piaget (1976) proposed that this conflict, or “disequilibrium,” is essential to learning as it triggers the process of accommodation (i.e., adaptation or alteration) and assimilation (i.e., integration) of the new information into the existing knowledge structure.
This study investigates whether an astrobiology program that exposes students to the nature and processes of science can introduce cognitive conflict—the first step to changing misconceptions. Are there detectable changes related to students' views of NOS in their written responses to open-ended questions?
We examined the Mission to Mars program at the Victorian Space Science Education Centre in Melbourne, Australia, where the objective is to improve student comprehension of NOS by exposing students to how science is actually done. The Mission to Mars program consists of a full-day astrobiology excursion supported by pre and post excursion classroom activities that focus on engaging students in authentic astrobiology investigations that mirror the work that scientists do.
2.3. Measuring the impact of astrobiology outreach
2.3.1. Conventional quantitative research methods
Conventional methods of program evaluation mainly rely on quantitative data derived from closed-form survey responses, such as Likert scales (Deng et al., 2011; Metcalfe et al., 2012). A particularly common method of measuring change resulting from an intervention involves using pre- and postintervention surveys and statistically computing differences in scores (Dimitrov and Rumrill, 2003). Some problems exist with using quantitative research methods to measure learning impacts.
First, students' actual understanding of NOS may not be adequately represented and assessed based on numerical values (Hofer and Pintrich, 1997; Deng et al., 2011). Second, quantitative methods rely on an “adequate” percentage of response rates—based on the population size and required level of accuracy and confidence—to ensure results are credible, representative, and generalizable to a population (Nulty, 2008). Despite best efforts, it is often difficult for researchers to obtain adequate levels of survey response rates (Nulty, 2008).
Qualitative methods generally require smaller sample sizes because qualitative research is about “deep understanding” of a particular phenomenon from “information-rich cases” rather than making “generalizations to larger populations” from “statistically representative samples” (Sandelowski, 1995, p. 180). Ironically, conventional methods of analyzing qualitative data from open-ended survey questions involve reading written responses and scoring or assigning them to predetermined labels (i.e., “naive” or “informed” views) and statistically computing the frequencies, essentially losing the richness of the qualitative data by converting it into quantitative data (Deng et al., 2011).
2.3.2. Computerized analysis of qualitative data
New enhancements in computer-based qualitative analysis may provide new ways for researchers to conduct both rigorous and in-depth analysis of qualitative data from written responses to open-form survey questions. In this study, we used two computer-based qualitative analysis programs: NVivo (the first software product developed by an Australian computer scientist Tom Richards in 1999) and the LIWC (developed by an American social scientist James W. Pennebaker in the mid-1990s).
2.3.2.1. Content analysis using NVivo
Bringing together qualitative data in a meaningful way can be challenging—finding connections can be difficult, complex, and time-consuming (QSR International, 2018). NVivo is a data analysis computer program used for qualitative and mixed-methods studies to categorize and classify data to uncover themes and relationships (QSR International, 2018).
NVivo has three major components: (1) data sources (i.e., in the form of text, audio, video, e-mails, images, spreadsheets, and web content), (2) indexical features or coding systems to organize data (i.e., cases, nodes, and classifications), and (3) interrogational features to analyze data (i.e., query tools, search tools, and visualization tools). These three components enable researchers first to organize data using the indexical features, and then use the interrogational features to mix, match, juxtapose, and reposition data and indexes to uncover relationships and develop new meaning (Davidson, 2018). NVivo provides a “robust and pragmatic way” to rigorously and systematically analyze qualitative data to enhance the trustworthiness of the findings (Houghton et al., 2016, p. 879), while also facilitating an accurate and transparent analysis process, which is an element often absent and criticized in qualitative research (Welsh, 2002).
A range of qualitative and mixed-methods educational studies have used NVivo; from studies on individual children and teachers to schools and governmental policy (Davidson, 2018). For example, a recent study by Shapiro et al. (2017) examined students' motivations for and barriers to course engagement in Massive Open Online Courses (MOOCs). Using NVivo, the authors analyzed 36 student interview transcripts and found that the greatest motivators for students to engage in MOOCs were the desire to gain knowledge, convenience, work, and personal interest and that the greatest barrier was lack of time. The authors stated that using NVivo highlighted the “authentic voice” of the students and allowed the researchers to make “more in-depth inferences” on the motivations and barriers that affect student success in their courses (p. 41).
2.3.2.2. Linguistic analysis using LIWC
Language is the most reliable method we have to translate our thoughts and emotions to others (Tausczik and Pennebaker, 2010). The ways people use words and language reflect a lot about who they are, their thoughts, beliefs, and cognitive processes (Pennebaker et al., 2015b). Developments in computer sciences and computational statistics have generated new ways for researchers to study the psychological features of language (Tausczik and Pennebaker, 2010).
The LIWC is a computer program that uses the psychometrics of language to analyze text. It uses an internal dictionary, statistical methods, and algorithms to classify words into 95 linguistic and psychological categories (Pennebaker et al., 2015b). For example, for the LIWC summary dimension “Analytical thinking,” the authors studied how the use of function words can reflect thinking style and in turn, predict academic performance in college admission essays. They found that greater article use (i.e., a, an, the) is associated with abstract thinking, and greater proposition use (i.e., to, with, above) is associated with cognitive complexity (Pennebaker et al., 2014). The authors proposed that people who use more articles and prepositions reflect a more formal, logical, and hierarchical style of thinking, which is linked to academic performance.
Other studies have shown that the use of motion words (i.e., walk, go) and negative emotion (i.e., hate, ugly) can predict if a person is deceitful or truthful (Newman et al., 2003); the use of tentative words (e.g., maybe and perhaps) can indicate the extent to which a person has cognitively processed information and conceived it into knowledge (Pasupathi, 2007; Tausczik and Pennebaker, 2010); and the use of discrepancy words (i.e., should, would, could) signals that a person holds inconsistent or conflicting thoughts or ideas about a topic (Pennebaker and King, 1999). Overall, the authors of these studies agree that the words people use can provide useful psychological information because they reflect not only what people think but how they think as well (Kacewicz et al., 2013; Pennebaker et al., 2014, 2015b).
LIWC has been developed and refined over many years (Pennebaker et al., 2001, 2007, 2015a). It captures more than 86% of words in a text (Pennebaker et al., 2015b) and has been found to be valid in hundreds of studies (Tausczik and Pennebaker, 2010; Pennebaker et al., 2015b). One recent study by Smith-Keiling et al. (2018) used LIWC to assess the science cognitions of Asian English language learners (Asian ELLs) in a biochemistry course. Given that Asian ELLs may struggle to communicate their understanding of advanced science concepts in English, the authors used LIWC to measure underlying analytic and cognitive features of the students' writing to assess scientific understanding. The authors found that LIWC was effective in assessing students' cognitive and analytical thinking skills, pre- and postcourse, and purposed that the LIWC analysis could be useful in complementing other means of assessment to determine the underlying understanding of science.
This study aimed to examine if the use of computer-based qualitative analysis methods could provide new insights into the effects of a short experience astrobiology program (Mission to Mars) on student views of NOS (RQ2) from standard pre- and postsurvey data (RQ1). We applied conventional quantitative score analysis methods as well as computer-based qualitative analysis methods to pre- and postsurvey responses. For the computer-based qualitative analysis, we used NVivo to analyze the content of written responses to open-ended questions and identify thematic trends in students' views of the NOS and LIWC to analyze the psycholinguistic features of written responses to uncover students' thoughts and feelings about the topic. Essentially, we used NVivo to examine what students said about how science is done and LIWC to examine how students think about how science is done.
3. Methods
3.1. Sample
Our sample consisted of 483 students from 25 school groups in years (grades), 7–10, who participated in the Mission to Mars program at the Victorian Space Science Education Centre between May and September 2018. A total of 143 students completed the online presurvey (30% response rate), and 76 of the 143 students completed the postsurvey (53% response rate). The final data set included 189 groups (i.e., paired and unpaired sets of pre/post measures) with 219 pre- and postobservations. The students were 60% female and 40% male. On average, the students were in year/grade 8 (63%), placing them between the ages of 12–14 years.
3.2. Ethical considerations
This research was approved by the Human Research Ethics Committee at the University of New South Wales, Sydney. The study was designed to respect the rights and needs of study participants, including minimizing the risk of harm, maintaining confidentiality, and securing informed consent from participants. Written consent was obtained from all teachers and students and their parents/guardians who took part in this research study to ensure that they were aware of the nature, purpose, risks, and benefits of the research.
The procedure for recruitment of participants was as follows. We obtained details about upcoming school bookings for the Mission to Mars program, then contacted individual teachers by e-mail to seek written permission to conduct research with the students who would be attending the program. Following acceptance by the individual teachers, we arranged for the distribution of information and consent forms to the students and their parents/guardians. When permissions had been obtained, the class teacher was requested to arrange for students to complete the pre- and postvisit surveys.
3.3. Experimental design
Given that the objective of the research was to understand the effect of the astrobiology program on student participants, the study used a quasiexperimental design with purposive sampling and no control group. Quasiexperimental designs are commonly used when random assignment is impractical or not possible (Gribbons and Herman, 1997). Purposive sampling is a nonrandom assignment technique where participants are selected based on specific criteria that are tied to the objective of the study (Etikan et al., 2016)—in this case, participation in the Mission to Mars education program.
This type of sampling relied on the recruitment of study participants through teachers booking to attend the program and on the written informed consent of the teachers and students and their parents/guardians to be involved in the study (voluntary response sample). Although this method includes bias (i.e., in selecting study subjects) and results are not generalizable beyond the particular group (Etikan et al., 2016), it concentrates on subjects who have the highest potential to contribute unique and rich information of value to the study (Palys, 2008). The use of a control group would have improved the results of this study; however, finding a group of students who were not exposed to the program and matched the program participants in every other way proved impossible.
We used a mixed-methods one-group pretest/posttest design. A one-group pretest/posttest design was used to determine the effect of the single intervention (i.e., program) on all subjects (i.e., one-group design) by calculating the difference between the pretest and posttest scores (Cranmer, 2017). A mixed-method design was chosen to gather different but complementary qualitative and quantitative data to validate findings across data types (Plano Clark and Ivankova, 2016). In this case, the pretest and posttest contained the same blend of Likert-type items and related open-ended questions.
3.4. Instrument
We developed a survey instrument for this study based on two existing questionnaires that have been tested for validity and reliability. The first item derives from the National Science Board (NSB) Science and Engineering Indicators (National Science Board, 2018) and has been regularly used around the world to measure understanding of scientific process since 1957 (Miller, 2016). This NSB item is an open-ended question that asks respondents to explain “what it means to study something scientifically” (i.e., formulation of theories/test hypothesis, experiments/control group, or rigorous/systematic comparison) (National Science Board, 2018).
The second set of items derives from the Student Understanding of Science and Scientific Inquiry (SUSSI) questionnaire (Liang et al., 2008). The SUSSI questionnaire was developed and tested for reliability and validity over many years (Liang et al., 2006, 2008). The SUSSI items target six NOS themes, which represent noncontroversial aspects of science within the body of literature: Observations and Inferences, Tentative Nature of Science, Scientific Laws vs. Theories, Social and Cultural Influence on Science, Imagination and Creativity, and Methodology in Scientific Investigations.
Each theme consists of four 5-point Likert items, where respondents rate their level of agreement with a statement, and an open-ended follow-up question. An example Likert statement is: “Scientists use their imagination and creativity when they analyze and interpret data.” (strongly agree—agree—unsure—disagree—strongly disagree). An example open-ended question is: “With examples, explain how and when scientists use imagination and creativity OR do not use imagination and creativity.” The SUSSI instrument was chosen for its high efficacy in providing multiple sources of data from both closed (Likert)- and open-ended items to facilitate triangulation (i.e., validation of data through cross-verification from two or more sources) (Liang et al., 2008). The presurvey also included demographic questions about respondents' gender, age, year (grade) level, and type of school.
3.5. Scoring
We scored both types of survey responses—written responses to open-ended questions and responses to Likert items. The written responses to the NSB scientific process question “what does it mean to study something scientifically?” were scored by using a method developed by Oliver (2008) based on Jon D. Miller's coding (Miller, 1983), which relies on counting the presence of particular scientific terms, such as “experiment,” “hypothesis,” and “unbiased.” The presence of a particular scientific term is counted only once (i.e., present = 1; not present = 0). Under this method, we classified a count of three or more scientific terms as “scientifically literate” and two or less as “scientifically illiterate” (Oliver, 2008).
The written responses to the SUSSI open-ended questions were scored manually by three researchers using the SUSSI scoring rubric. The primary author provided training to the three researchers, and then each researcher individually scored responses on five completed surveys. The individual scores from the three researchers achieved a Krippendorff's alpha coefficient of 0.87, indicating strong inter-rater agreement (Sun, 2018). The researchers scored the written responses as demonstrating naive views (score = 1), transitional views (score = 2), informed views (score = 3), or as not classifiable (NC).
The responses to the SUSSI Likert items were scored with “strongly disagree” worth one point and “strongly agree” worth five points. We scored all reverse-coded items (identified with a minus sign in Liang et al. 2006) in reverse, with “strongly disagree” worth five points and “strongly agree” worth one point. We then classified the respondents' views as naive views (score = 1) if none of the four responses within each theme received a score greater than three and as informed views (score = 3) if all four responses within each theme received a score higher than 3.
We analyzed the two types of scores—written response scores and Likert scores—by calculating the mean scores and the statistical significance of the differences between pre- and posttest scores using a statistical package (see Section 3.6.3).
3.6. Data analysis
3.6.1. Content analysis of written responses
We used qualitative data analysis software, NVivo, to uncover themes and relationships in student written responses (Davidson, 2018). Using NVivo indexical features, we identified and indexed, or “coded,” the thematic ideas emerging from the responses into 44 thematic groups called “nodes” (i.e., “creativity and imagination” or “bias”). The coding involved reading through responses and manually coding whole or parts of responses to nodes, as well as running simple queries to help identify thematic ideas. For example, the following student response “The only time scientists should be using their creativity and imagination is when they are thinking of experiments to conduct, otherwise, their results will be biased” was coded into the following thematic nodes: creativity and imagination; and testing; and bias.
Then, to uncover further themes and explore trends within the collective set of all student responses, we used interrogative features, such as queries using Boolean logic, to cross-tabulate the coding intersections between nodes. The query results are output as a matrix of the percentage of text references coded at the intersection of each node. For instance, the cross-tabulation revealed that the intersection of nodes “experimentation and testing” × “use creativity and imagination” contained 25% of the coded responses, while “bias” × “creativity and imagination” contained only 3% of the coded responses. In other words, students who mentioned creativity and imagination were more likely also to mention experimentation and testing than the term bias, suggesting that more students viewed creativity and imagination as an aspect of science than as a feature contributing to bias in science.
To identify the most prominent trends in responses, we used queries to cross-tabulate the coding intersections between each of the 44 nodes and the seven open-ended survey questions. The percentage values for each node intersection were then ranked from highest to lowest for each of the seven survey questions. The differences in pre- and postrank were calculated in Microsoft Excel to identify differences in trends between pre- and postresponses (see example in Section 4.2).
3.6.2. Linguistic analysis of written responses
We used LIWC, a computerized text analysis program, to analyze the psycholinguistic features of student written responses. The LIWC program analyzes text by going through each word in a file and comparing it with a dictionary file containing almost 6400 words and word stems. Each dictionary entry is assigned to one or more psycholinguistic categories (Pennebaker et al., 2015b). For example, if LIWC were analyzing the sentence “It cried a lot,” the program would look at the first word “it” and see if “it” is in the dictionary. “It” is in the dictionary and coded as a function word, a pronoun, and an impersonal pronoun. These three LIWC categories would be quantified. Then, the word “cried” would be checked and found to be associated with the categories: sadness, negative emotion, overall affect, verbs, and past focus. Once every word has been checked, LIWC calculates the percentage of each category and outputs a list of all categories and their associated rates for a given text file. For instance, the output might show that 3.21% of all the words in the text file were impersonal pronouns and 2.57% were verbs.
Ninety-five output categories cover a multitude of linguistic dimensions (i.e., pronouns, articles, and prepositions) and psychological processes such as affective processes (i.e., positive emotion, anger, and sadness) and cognitive processes (i.e., tentative, insight, and discrepancy) (Pennebaker et al., 2015a). There are also four summary dimensions: Analytical thinking, Authenticity, Clout, and Emotional tone. Unlike the other categories, the summary dimensions are standardized composites of other categories and not represented as the percentage of words in the text that belong to that category, but rather as a score between 0 and 100 computed using a proprietary algorithm (Pennebaker et al., 2015b). The output also includes the total word count.
We selected eight categories that were considered to be relevant to the aims of this study. The categories included the following: summary dimension “Analytic thinking,” “Articles,” “Prepositions,” and “Cognitive process” and its relevant subcategories “Insight,” “Discrepancy,” “Tentative,” and “Differentiation.” These categories were selected because they are associated with the extent to which a person has processed, organized, and integrated information (Cohn et al., 2004; Tausczik and Pennebaker, 2010) and have been shown to be effective at assessing students' scientific understanding (Smith-Keiling et al., 2018).
We ran the written responses to the pretest and the posttest separately through the LIWC program and calculated the statistical significance of the differences in pre- and posttest rates for each category using a statistical package (see Section 3.6.3).
3.6.3. Statistical analysis of pre/post score differences
To test the statistical significance of the pre/post differences in SUSSI Likert and written response scores, a mixed model was implemented using the R package nlme (Pinheiro et al., 2018). This model was used to include all data, even those observations with a missing posttest measure. The independent variable was the treatment (astrobiology program), and the dependent variables were the pretest and posttest scores. We used a random effect for “participant” to account for the fact that multiple responses from the same participant are more similar than responses from different participants.
For the NSB question scores (scientific terms counted), we used a generalized linear mixed model with Poisson distributions and a random effect for “participant” using the R package lme4 (Bates et al., 2015) to test the statistical significance of the pre/post differences in scores. Poisson regression is used where nonzero cases are rare (Kremelberg, 2011).
For the LIWC word rates, we tested the statistical significance of the pre/post differences in rates for each LIWC category using a generalized linear mixed model with binomial distributions and a random effect for “participant” also using the R package lme4 (Bates et al., 2015). Given that LIWC word rates represent the percentage of words in the text that belong to that category, we used a “weights” argument for total word count to account for the fact that different participant responses have different total word counts. The significance of the treatment effect (astrobiology program) was assessed by using Wald tests with the summary function in R.
4. Results
The results are organized in Sections 4.1, 4.2, and 4.3.
4.1. Results of the analysis of quantitative data
The results of the statistical analysis of scored written responses to the scientific process item (NSB) and the scored Likert items and written responses to the nature of science questionnaire (SUSSI) are outlined and compared in the following sections.
4.1.1. Pre/post differences in scientific process scores
Table 1 shows the results of the written responses to the National Science Board (2018) question: “What does it mean to study something scientifically?” The results of the mixed-model analysis show that the mean score dropped from 0.56 in the pretest to 0.47 in the posttest. However, the estimated difference in posttest scores of −0.09 (p = 0.36) was not significant. Based on the score classification system (Oliver, 2008), the percentage of students classified as “scientifically literate” dropped from 14% in the pretest to 11% in the posttest.
Raw Percent and Mean Score Differences for the National Science Board Scientific Process Question: “What Does It Mean to Study Something Scientifically?”
The significance level for p-value is 0.05. A negative value for estimated difference represents a decrease in the posttest mean score.
Classified scientifically literate if score ≥3; scientifically illiterate if score <3 (Oliver 2008).
4.1.2. Pre/post differences in NOS Likert scores
Student Likert scores decreased slightly from pre to post in five of the six NOS themes. For the “Observations and Inferences” theme, the estimated difference of −0.28 is a significant difference (p = 0.002) such that scores decreased posttest (refer to Table 2). For the “Society and Culture” theme, the results show a marginally significant decrease in posttest scores with an estimated difference of −0.15 (p = 0.047). The only increase in posttest scores across all themes was observed for the “Creativity and Imagination” theme; however, the estimated difference of 0.05 (p = 0.556) was not statistically significant.
Mean Score Differences for Nature of Science Likert Items by Theme
The scale is a 3-point scale from 1 (naive views) to 3 (informed views). The significance level for p-value is 0.05. Significant p-values are in bold. A negative value for Estimated Difference represents a decrease in the posttest mean score, while a positive value represents an increase in the posttest mean score.
We note that the size of the mean differences was small and that the overall quality of the responses remained relatively consistent across pre- and posttests. The box plot in Fig. 1 compares the distributions of the pre and post overall Likert scores—that is, the average of all six theme scores—in terms of median and quartiles. Although the median did not change from pre to post (1.67), the overall posttest scores were more variable, with an increase in the distribution of the lower quartile toward lower scores.
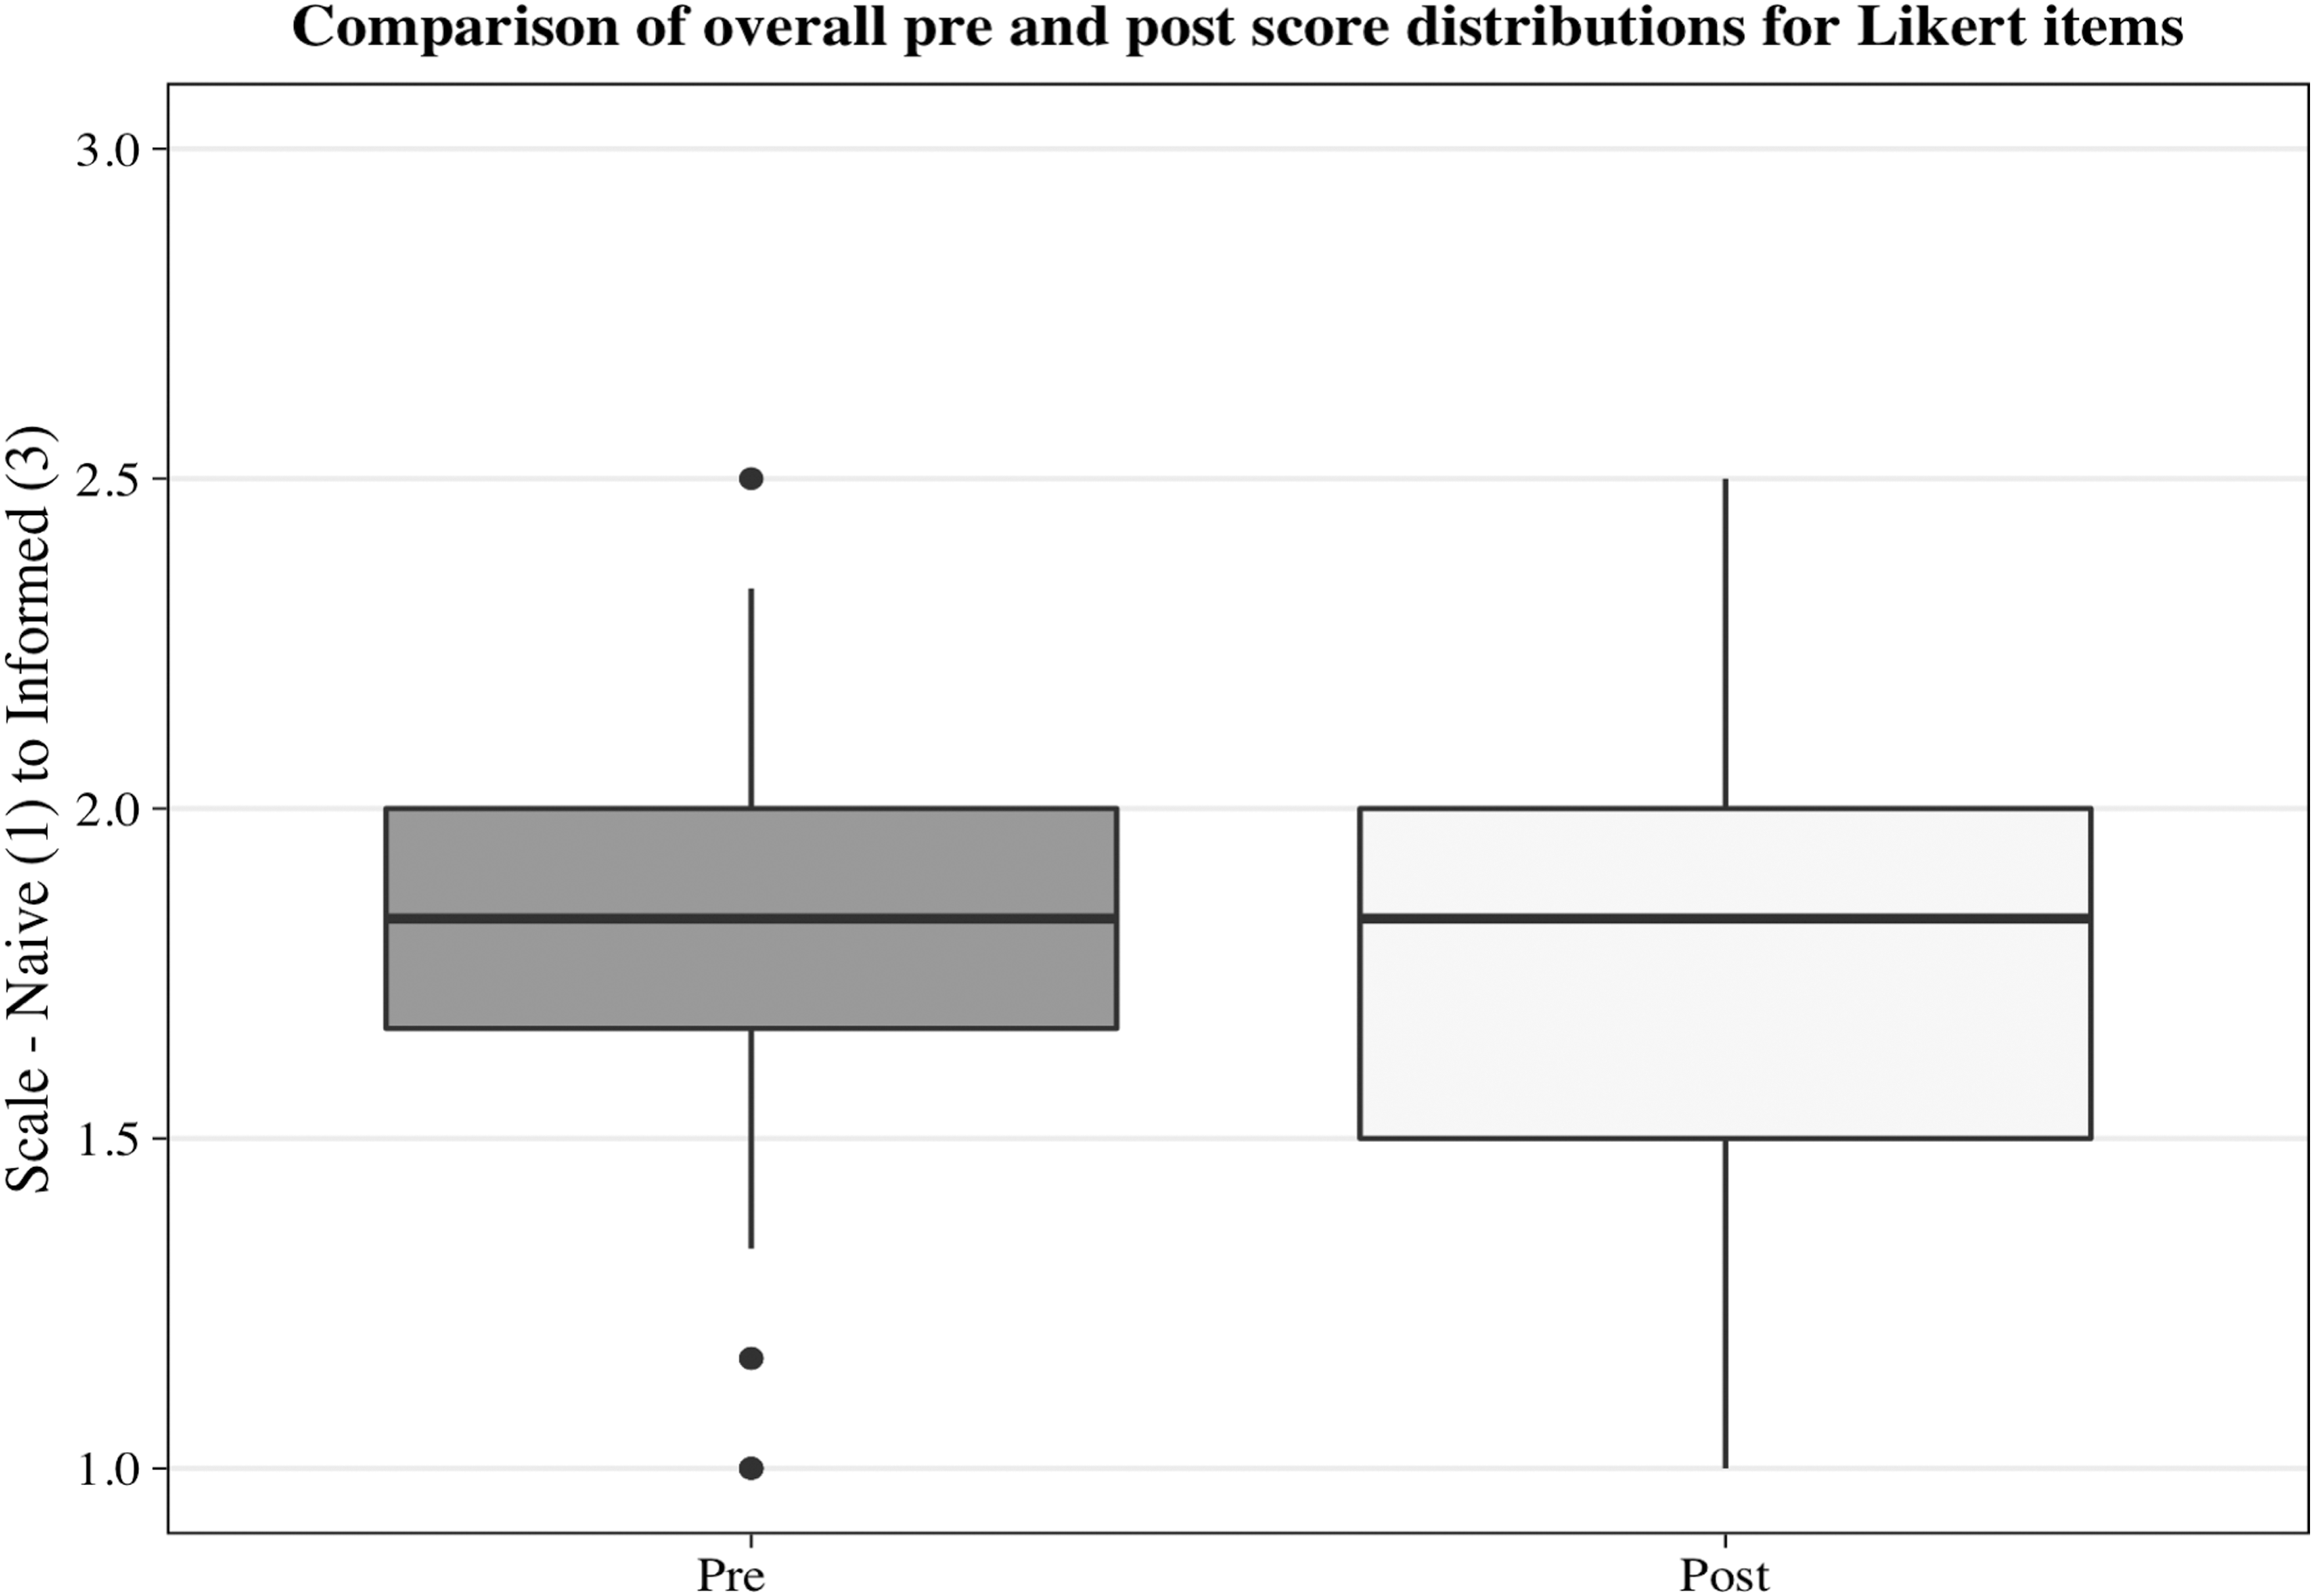
Box plot comparing pre- and postdistribution of overall scores (average of all six theme scores) for Likert items. Although the median did not change from pre to post (1.67), the variance is greater in posttest scores toward lower scores, indicating an overall decrease in scores. Dots represent outliers.
4.1.3. Pre/post differences in NOS written response scores
The results of the mixed-model analysis of written response scores outlined in Table 3 show that, compared with the Likert scores, there were more increases in the posttest written response scores. Posttest scores slightly increased for the themes of “Tentativeness,” “Creativity and Imagination,” and “Scientific Methods”; however, none of the positive estimated differences were significant.
Significant Results for Nature of Science Written Responses by Theme
The scale is a 3-point scale from 1 (naive views) to 3 (informed views). The significance level for p-value is 0.05. Significant p-values are in bold. A negative value for Estimated Difference represents a decrease in the posttest mean score, while a positive value represents an increase in the posttest mean score.
Similarly to the Likert results, the “Observations and Inferences” theme had a significant estimated difference of −0.27 (p = 0.013), showing a decrease in posttest scores. The negative estimated differences of 0.08 (p = 0.225) for the “Society and Culture” theme and of −0.04 (p = 0.527) for the “Laws and Theories” theme were not significant. Across both Likert items and written responses, “Observations and Inferences” is the only theme that showed a statistically significant decrease in posttest scores, while “Creativity and Imagination” is the only theme that showed an increase in posttest scores, although this increase was nonsignificant.
Once again, the mean differences in written response scores were small, and the pre/post responses remained relatively consistent. The box plot in Fig. 2 compares the distributions of the overall pre- and postscores for the written responses. The plot shows that the posttest median decreased (pre = 1.75, post = 1.67) and there was slightly less variability among the posttest scores.

Box plot comparing pre- and postdistribution of overall scores for written responses. The posttest median decreased slightly (pre = 1.75, post = 1.67) and the box plot is narrower indicating that there was an overall slight decrease in posttest scores with less score variability than the overall Likert scores (Fig. 1). Dot represents outlier.
4.2. Results of the content analysis of qualitative data
The NVivo analysis revealed 44 thematic nodes. As explained in Section 3.6.1, we calculated pre/post node reference percentages and ranking differences for each open-ended survey question to compare between pre- and posttest trends. An example of a comparison table for the question “what does it mean to study something scientifically?” is presented in Table 4. To visually represent differences in pre- to postrank—that is, the themes mentioned most in the pretest compared with the themes mentioned most in the posttest—we applied a 2-color scale to the “Rank Diff.” column where the intensity of the cell's color reflects the magnitude of a theme's shift in rank, from small (light gray) to large (dark gray) shifts in rank.
Sample Table Showing the Pre- to Posttest Differences in Thematic Trends in Student Written Responses to the Nature of Science Scientific Process Question: “What Does It Mean to Study Something Scientifically?”
The columns under the heading Pre show the themes within the pretest responses in rank order from most referenced to least referenced (i.e., ranked first is theme “Experimentation and Testing,” which was referenced in 20% of written responses to the scientific process question). The columns under the heading Post show the themes within the posttest responses in rank order as well as the difference in rank placement from pretest to posttest (i.e., In the posttest, the theme “Experimentation and testing” remained first in rank [Rank Diff. = 0], but the theme “Bias” moved up 17 places in the posttest, from 25th in rank to eighth [Rank Diff. = 17]). Positive Rank Diff. values represent a shift toward the top of the ranking order (most referenced), while a negative value represents a shift toward the bottom of the ranking order (least referenced). The intensity of the Rank Diff. cell color reflects the magnitude of a theme's shift in rank, from small (light gray) to large (dark gray) shifts in rank. This table shows only the top 10 and the bottom ranked themes.
The NVivo analysis identified the following common misconceptions in student written responses: observations are facts, but interpretations are influenced by researchers' knowledge, experience, and social background; theories can change because they are unproven, but laws cannot because they have been proven; theories become laws; scientists use imagination and creativity only when designing experiments but not in the data collection, analysis, and interpretation phases because it can interfere with objectivity; there is a universal, linear, step-by-step scientific method that all scientists follow to ensure valid, accurate results; and experiments are the primary method of developing scientific knowledge.
The differences in pre- to postresponses show contradicting trends relating to objectivity and interpretation in scientific practice. The trends show that posttest responses contained more mention of objectivity and bias, particularly concerning observations and the process of science. Examples include: “To study something scientifically is to study something objectively without opinions only facts”; “Scientists should be unbiased to anything they do and only report the facts”; “They [observations] should be the same otherwise it could become biased.” The trends also show that posttest responses contained more mention of interpretation—particularly regarding the role of creativity and imagination in interpreting data, and in the role of interpretation in changing theories. For example, students stated: “scientific theories would change because new evidence and new observations or interpretations can come to light,” “a scientist may use imagination to find new ways to interperet (sic) markings on a rock,” “I think that scientists use a mix of creativity and prior knowledge to interpret data.”
4.3. Results of the linguistic analysis of qualitative data
LIWC results show a general decrease in posttest rates for the psychometric categories. The general mixed-model analysis of the pre- and posttest word rates, outlined in Table 5, shows that the summary dimension “Analytic thinking” had a strong statistically significant decrease of −0.11 (p < 0.001) in posttest word rates. The category “Proposition” also shows a strong significant pre/post decrease in the rate of prepositions (b = −0.02, p < 0.001). The “Cognitive process” category and its associated subcategory “Differentiation” showed statistically significant decreases, with estimated changes of −0.03 (p = 0.02) and −0.01 (p = 0.03), respectively.
Significant Results for Linguistic Inquiry and Word Count Differences in Pre- to Posttest Word Rates of Psychometric Categories
Pre- and postrate columns represent the mean percentage of words in the written responses belonging to each category, with the exception of the summary dimension “Analytic thinking,” which represents the mean score between 0 and 100 computed using a proprietary algorithm (Pennebaker et al., 2015b). A negative value for Estimated Change represents a decrease in the posttest word rates, while a positive value represents an increase in the posttest word rates. The significance level for p-value is 0.05. Significant p-values are in bold.
5. Discussion
5.1. Changing student views of NOS
This study aimed to determine whether participation in an astrobiology education program that exposes students to the true nature and processes of science changes students' views of the NOS. Our study found that the initial common misconceptions that students held—which were in keeping with other research on students' views of NOS (Lederman, 1992; Lederman et al., 2002; Liang et al., 2006)—were not entirely changed, but may have been disrupted as a result of participation in the program. This disruption is known as cognitive conflict (Kowalski and Taylor, 2009).
Collectively, the results of the different analyses point to signs that the astrobiology program may have triggered cognitive conflict in students' views of the NOS. The contradicting views relating to objectivity and subjectivity and the decrease in words associated with “Analytic thinking” and “Cognitive process” observed in their posttest responses suggest that students may have been engaged in the process of assimilation and accommodation of the new information gained from the program into their existing knowledge structures—essentially, the process of “learning.”
However, we cannot speculate on whether, or to what extent, students integrated the new information into their existing knowledge structures. Nevertheless, perhaps being exposed to how science is actually done by actively doing science, as opposed to learning science passively through knowledge transmission, disrupted their prior knowledge by offering new insight into the subjective, creative, and fundamentally human side of scientific endeavor.
The quantitative score analysis of Likert and written responses combined provides clues to students' conflicting views of NOS, in particular concerning the aspect of objectivity. While there was little change detected overall, the statistically significant decrease observed in posttest scores for the themes of “Observations and Inferences” (Likert p = 0.002; written responses p = 0.013) and “Society and Culture” (Likert p = 0.047) suggests that students' comprehension of the influence of personal background and societal factors on scientific practice significantly decreased, while their comprehension of the role of “Creativity and Imagination” throughout scientific investigations increased, although this increase was not statistically significant.
These results align with the findings by Fergusson et al. (2012) who, using the same NOS Likert items used in this study, also observed a statistically significant decrease in students' “Observations and Inferences” scores and a statistically significant increase in “Creativity and Imagination” scores after student participation in a similar astrobiology program.
However, a more in-depth qualitative analysis of the content of the written responses, using NVivo, sheds more light on the score results. For example, the posttest trends in responses revealed an increase in the mention of objectivity or bias-related content—especially concerning observations and the process of science. Students views shifted toward more naive views that scientists are objective and unbiased when making observations and doing research, and that science is based on facts. The trend in objectivity or bias-related content in posttest responses may explain the significant decrease in the posttest scores for “Observations and Inferences.”
Conversely, the posttest trends also highlighted an increase in the mention of interpretation—particularly relating to the role of creativity and imagination in interpreting data, and in the role of interpretation in changing theories. This trend points to a shift in students' views toward a more informed understanding that scientists' interpretations are influenced by their background, experience, and creativity, suggesting a greater awareness of the subjective, tentative, and creative NOS. This trend may explain the slight (nonsignificant) increase observed in the “Creativity and Imagination” posttest scores. The trends in what students think about NOS may not only explain the results of the quantitative score analysis, they also highlight contradictory views in the posttest regarding objectivity and subjectivity in scientific practice.
The psycholinguistic features of students' written responses suggest that these contradictory views of NOS may have disrupted students' existing misconceptions of how science is done by triggering a state of cognitive conflict. Particularly, the results suggest that students may have been demonstrating signs of assimilation (i.e., integration) and accommodation (i.e., adaptation or alteration) of new information into existing knowledge structures.
The LIWC results show a strong statistically significant posttest decrease (p < 0.001) in the summary dimension “Analytic thinking,” which suggests a less logical and hierarchical style of thinking after participation in the astrobiology program (Pennebaker et al., 2015a). “Analytic thinking” is associated with language that references cognitive complexity (Pennebaker et al., 2014)—that is, the extent to which a person can differentiate between multiple ideas and integrate, or assimilate, them into hierarchical knowledge structures (Kovářová and Filip, 2015). The words people use to connect thoughts can reflect cognitive complexity because they can signal when someone is “actively reevaluating” information and the extent to which the information “has already been evaluated” (Tausczik and Pennebaker, 2010, p. 35).
For example, the use of “Prepositions” (to, with, above), “Cognitive process” words (cause, know, ought), and “Differentiation” words (but without, hasn't) are indicators of cognitive complexity (Tausczik and Pennebaker, 2010; Pennebaker et al., 2014) because they indicate a person has more complex and concrete information about a topic (Tausczik and Pennebaker, 2010). The LIWC results show a statistically significant decrease in students' use of “Prepositions” (p < 0.001), “Cognitive process” words (p = 0.02), and “Differentiation” words (p = 0.03), indicating less concrete or established thoughts about NOS in their responses after participating in the program (Pennebaker et al., 2014, 2015a).
These results suggest that students were actively reevaluating their existing ideas of NOS, but that those ideas had not been fully integrated into their knowledge structures. This may be evidence that students were engaged in the process of assimilation and accommodation—that is, adapting or altering their existing knowledge structures to integrate new information gained from the astrobiology experience.
5.2. Quantitative versus qualitative methods to measure learning impact
Another purpose of this study was to examine whether computer-based qualitative analysis could provide new insights into the impacts of astrobiology outreach on students' views of NOS. Previous studies that have used similar survey instruments and quantitative score analysis have generally observed little to no change in the understanding of NOS after participation in astrobiology programs (Oliver, 2008; Fergusson et al., 2012; Kingsley et al., 2017). The results of the quantitative score analysis in this study are in keeping with the previous studies—slight differences in student understanding of different aspects of NOS, few statistically significant.
However, computer-based qualitative analysis has allowed us to extend the findings of previous research by providing more in-depth insights into the impacts of the astrobiology program. For example, the thematic trends in posttest responses, which reflected what students thought about NOS, revealed contradictory conceptions of objectivity and subjectivity in scientific practice. The language and words that students used in their posttest written responses, which reflected how they thought about NOS, revealed signs of cognitive conflict. Perhaps computerized qualitative analysis methods could help researchers assess student learning more accurately than conventional quantitative analysis methods and provide an effective way to conduct both rigorous and in-depth investigations on the impacts of astrobiology programs, or any outreach program, on learning outcomes.
5.3. Limitations
This study provides a detailed examination of the learning impacts of an astrobiology program. However, we must consider some limitations. First, the results of this study are not generalizable beyond this particular group. The sample was small and consisted of students who participated in a specific astrobiology program, which may have led to a bias in statistically significant differences (Etikan et al., 2016). However, given that we were interested in the impacts of astrobiology programs on those who participate in them, the sample represents this audience and contributed information of value to the study (Palys, 2008).
Second, the use of self-report data to measure learning impacts of education programs introduces bias in the results (Schwarz and Oyserman, 2001; Lam and Bengo, 2003). Moreover, the 53% return rate of post surveys, although higher than typical online response rates (Nulty, 2008), may have also biased the results (Sax et al., 2003; Nulty, 2008), although we cannot say how. The self-report data and low response rate highlight common limitations of research studies such as this one and may be a contributing factor to the lack of evidence of the impacts of astrobiology outreach.
Third, although NVivo provides a rigorous, systematic, and transparent method of analyzing qualitative data (Welsh, 2002; Houghton et al., 2016), the analysis of thematic ideas is a fluid and creative process and could contribute to validity and reliability issues (Welsh, 2002). In addition, researchers must understand that the function of NVivo is not to analyze data, but rather to assist researchers in the analysis process (Zamawe, 2015). For example, the automated features for interrogating and indexing content may not retrieve or capture all information in a text—such as multiple synonyms and misspelled words—and should be paired with manual analysis techniques to ensure thorough text interrogation (Welsh, 2002; Zamawe, 2015). Although we applied manual scrutiny techniques to our analysis, we may have nonetheless overlooked some content.
Fourth, although the LIWC program captures 86% of words people use in writing and speech (Pennebaker et al., 2015b), it processes words individually and does not account for subtle patterns in language style that reflect complex language structures such as sarcasm, irony, and idioms, which can lead to some misinterpretation (Tausczik and Pennebaker, 2010).
Fifth, the fact that the program was a short-term experience could explain why we may have only observed signs of cognitive conflict, rather than entirely changed misconceptions. Further research is required on the impacts of longer term interventions in changing students' misconceptions of NOS. Sixth, although measuring the difference between pre- and postintervention scores is a conventional method of measuring change, the observed change does not necessarily mean that the program was effective (Dimitrov and Rumrill, 2003; Lam and Bengo, 2003), particularly since the long-term effect was not measured. Further studies should be performed on the long-term impacts of this intervention.
6. Implications
Astrobiology outreach offers an ideal context to engage students in the process of science and provide them with unique insight into how science is done—something that school science struggles to deliver. However, previous research evaluation efforts of astrobiology programs using quantitative methods have generally found little to no change in students understanding of the NOS. A deeper understanding of the impacts of astrobiology programs can not only help us identify if they are effective but also provide an evidence-based approach to designing future astrobiology education programs.
The primary aim of this study was to explore whether standard pre- and postsurvey data could reveal useful information in short experience programs. The secondary aim was to investigate whether computer-based analysis methods of qualitative data could draw out new insights into the effectiveness of astrobiology programs. We hypothesized that qualitative data provide richer insights into the effectiveness of astrobiology education programs than quantitative data. We applied both conventional quantitative score analysis methods and computer-based qualitative analysis methods to data collected from an open- and closed-form survey to identify pre to post changes in students' views of the NOS.
For the computer-based qualitative analysis, we used NVivo, a data analysis computer program used for qualitative and mixed-methods studies, to examine the thematic trends in students' views. We also used LIWC, a widely used text analysis program based on the psychometrics of language, to examine the psycholinguistic features of student responses. While the quantitative data showed little difference in posttest scores, the results of the qualitative data analyses indicate that the Mission to Mars program may have triggered cognitive conflict in students' views of the NOS. Students demonstrated contradicting views regarding objectivity and subjectivity and signs of decreased cognitive complexity in their posttest responses. These results suggest that students may have been engaged in the process of assimilating and accommodating new information into their existing knowledge structures.
Based on the results, we conclude that astrobiology programs can effect some change in students' views of the NOS and may be useful in helping students to take their first steps toward comprehending how science is done. The results of this study indicate that engaging students in doing authentic science can disrupt their misconceptions of how science is done by creating cognitive conflict—a trigger to the learning process. Therefore, we recommend that astrobiology programs should actively involve students in authentic scientific investigations that mirror the work of scientists and should focus on exposing students to the subjective, creative, and fundamentally human side of scientific endeavor. However, this recommendation is tentative as further research is needed into the long-term effects of such experiences to determine if, and to what extent, cognitive conflict leads to fully changed misconceptions.
Measuring the learning impacts of astrobiology programs should involve analysis methods that go beyond the statistical analysis of numerical scores. Computer-based analysis of qualitative data should be considered by researchers to conduct both rigorous and in-depth evaluation research on the impacts of programs to inform best practice and guide the future direction of astrobiology outreach.
Footnotes
Acknowledgments
The authors acknowledge the Victorian Space Science Education Centre for their access to the Mission to Mars program for data collection. The authors also acknowledge the Stats Central statistical team at the University of New South Wales' Mark Wainwright Analytical Centre for consultation and guidance in the design and analysis of this study.
Author Disclosure Statement
No competing financial interests exist.
Associate Editor: Daniella Scalice