
Abstract
Polygonal features in a ∼250 million-year-old Permian evaporitic deposit were investigated for their geological and organic content to test the hypothesis that they could preserve the signature of ancient habitable conditions and biological activity. Investigations on evaporitic rock were carried out as part of the MIne Analog Research (MINAR) project at Boulby Mine, the United Kingdom. The edges of the polygons have a higher clay content and contain higher abundances of minerals such as quartz and microcline, and clays such as illite and chlorite, compared with the interior of polygons, suggesting that the edges were preferred locations for the accumulation of weathering products during their formation. The mineral content and its strontium isotope ratio suggest that the material is from continental weathering at the borders of the Permian Zechstein Sea. The edges of the polygons contain material with mean δ13C and δ15N values of −20.8 and 5.3, respectively. Lipids, including alkanes and hopanes, were extracted from the interior and edges of the polygons, which are inferred to represent organic material entrained in the evaporites when they were formed. The presence of long-chain alkanes (C20–C35) that lack a carbon preference, low abundances of C23–C29 hopanes, and lack of marine, evaporitic, or thermal maturity indicators show that lipid biomarkers were, at least in part, potentially derived from a continental source and have not undergone significant thermal maturation since deposition. Lipid extractions using weak acids revealed significantly more lipids than those without acid, potentially indicating that encapsulation was not the only type of preservation mechanism occurring in Boulby salts. These data demonstrate the potential for ancient evaporites and their polygons to preserve information on local geological conditions, ancient habitability, and evidence of life. The data show that analogous martian evaporitic deposits are good targets for future life detection missions and the investigation of ancient martian habitability.
1. Introduction
Salt deposits usually represent the evaporative products of ancient water bodies and are thereby linked directly to environments that are potentially suitable for life. They can preserve records of ancient biological activity (McGenity et al., 2000; Barbieri et al., 2006; Griffith et al., 2008; Schopf et al., 2012; Allwood et al., 2013; Pierre et al., 2015), especially lipid biomarkers (e.g., Barbe et al., 1990), and thereby enhance the preservation potential for the remains of life by rapidly removing biogenic material from the environment (e.g., Baranger and Disnar, 1988), including preservation in fluid inclusions (Norton and Grant, 1988; Fish et al., 2002; Schubert et al., 2009). In particular, sodium chloride brines are known to sustain diverse forms of life and, once crystallized, can preserve organic remains in fluid inclusions (Norton and Grant, 1988; Fish et al., 2002; Schubert et al., 2009).
Lipid biomarkers are typically well preserved in ancient salt deposits, recording the presence and/or activity of the organisms that existed in the water body from which the salt formed (e.g., Hofmann et al., 1993), or the microbial inhabitants of the evaporitic system (e.g., Zhonghong et al., 2013).
Evaporites have been considered low-priority targets for testing for evidence of past life on Mars because of dissolution processes (Farmer and DesMarais, 1999). However, evaporites are widespread on Mars, with more than ∼650 discrete sodium chloride (halite) deposits suggested on the planet in addition to numerous sulfate deposits (Gendrin et al., 2005; Osterloo et al., 2008, 2010; Viviano-Beck et al., 2014). Some of the most extensive halite deposits are found in the Terra Sirenum region in the southern hemisphere, where the salts are associated with Noachian phyllosilicates (Glotch et al., 2010). The location of many of these deposits suggests that they have formed from water ponding in topographic lows or upwelling from the subsurface. Groundwater upwelling and at least two to three “recharge events” took place in the Karatepe section of the Burns Formation (McLennan et al., 2005; Perl et al., 2008) dissolving soluble minerals.
Some salt deposits may represent the last vestiges of sustained liquid water on the martian surface, and thus the most recent aqueous deposits in which to seek biosignatures (Hynek et al., 2015). Chloride deposits observed near Meridian Planum are ∼4 m thick and formed from water bodies that are about 8% as saline as Earth's oceans (Hynek et al., 2015). By terrestrial standards, however, these deposits are ancient and have a maximum age of ∼3.6 Ga.
One conspicuous feature of large evaporitic deposits on Mars is the presence of polygonal features (Hynek et al., 2015). In Meridiani Planum, images taken by the High-Resolution Imaging Science Experiment (HiRISE) on the Mars Reconnaissance Orbiter show conspicuous polygons of ∼10-m width across the deposit (Hynek et al., 2015). Similar self-organized features are also recognized in salt deposits on Earth, for example in Triassic salt sequences in England (Tucker, 1981), which host irregular polygons that are up to 14 m wide. Proposed explanations include desiccation shrinkage, thermal contraction, and cyclic evaporation and salt precipitation (Neal et al., 1968; Tucker, 1981; Goehring and Fourrière, 2014). Regardless of the mechanism of their formation, polygons are conspicuous in terrestrial ancient salt deposits owing to the generally darker brown/black coloration of their edges.
Here, we focus on abundant polygonal features observed in the Permian salt deposits of the Boulby Mine, North Yorkshire, the United Kingdom. We tested the hypothesis that these deposits contain a record of ancient geological and biological conditions from the time of formation and we discuss the implications of these findings for the potential of evaporite deposits on other planetary bodies as records of past geological/geochemical conditions, habitability, and biological activity.
2. Methods
2.1. Site location
The Boulby Mine (54°33′18″N, 0°49′19″W) operates in the Zechstein evaporite deposit, ∼1 km below the surface of north Yorkshire, the United Kingdom. The mine is run by Israel Chemicals Limited (ICL). The Zechstein sequence is the product of a ∼250 million-year-old (Permian) epeiric sea that once stretched from the shoreline of the modern UK to Eastern Europe (Taylor, 1998; Zhang et al., 2013). The salts mined at Boulby formed near the edge of this sea. The sequence contains a number of repeating evaporite mineral horizons, including both chloride and sulfate salts, including halite (NaCl), sylvite (KCl), sylvinite (a mixture of NaCl and KCl), and polyhalite [K2Ca2Mg(SO4)4·2H2O].
The salt minerals contain a variety of clays and other impurities. Brine flows of varying compositions intersect the mine at certain locations. These originate from the dehydration of gypsum within the sequence, or from connections to the overlying aquifer (Bottrell et al., 1996).
The mine has been used in recent years as an analog site for planetary science and technology testing in the deep subsurface (Cockell et al., 2013, 2018; Woolman et al., 2015; Payler et al., 2016, 2019). The MIne Analog Research (MINAR) program was designed to use the deep subsurface environment to test new equipment, answer fundamental science questions, and create a direct link between extraterrestrial analog research and the improvement of economic mining. The study presented in this article was conducted under MINAR IV (July 18–20, 2016) (Cockell et al., 2018).
2.2. Sample collection
Samples were collected from a rectanguloid cavern in halite exposing polygonal structures on its flat walls and ceilings (Fig. 1). The sample collection area is a mine face that cuts sideways into the salt sequence. Thus, the polygonal features shown are a lateral cross-section of polygons, essentially a depth profile into the polygons. They are not necessarily a single time point and if the polygons were laid down over a protracted period, lower samples could potentially represent older samples, although it is not possible to put temporal constraints on the material.
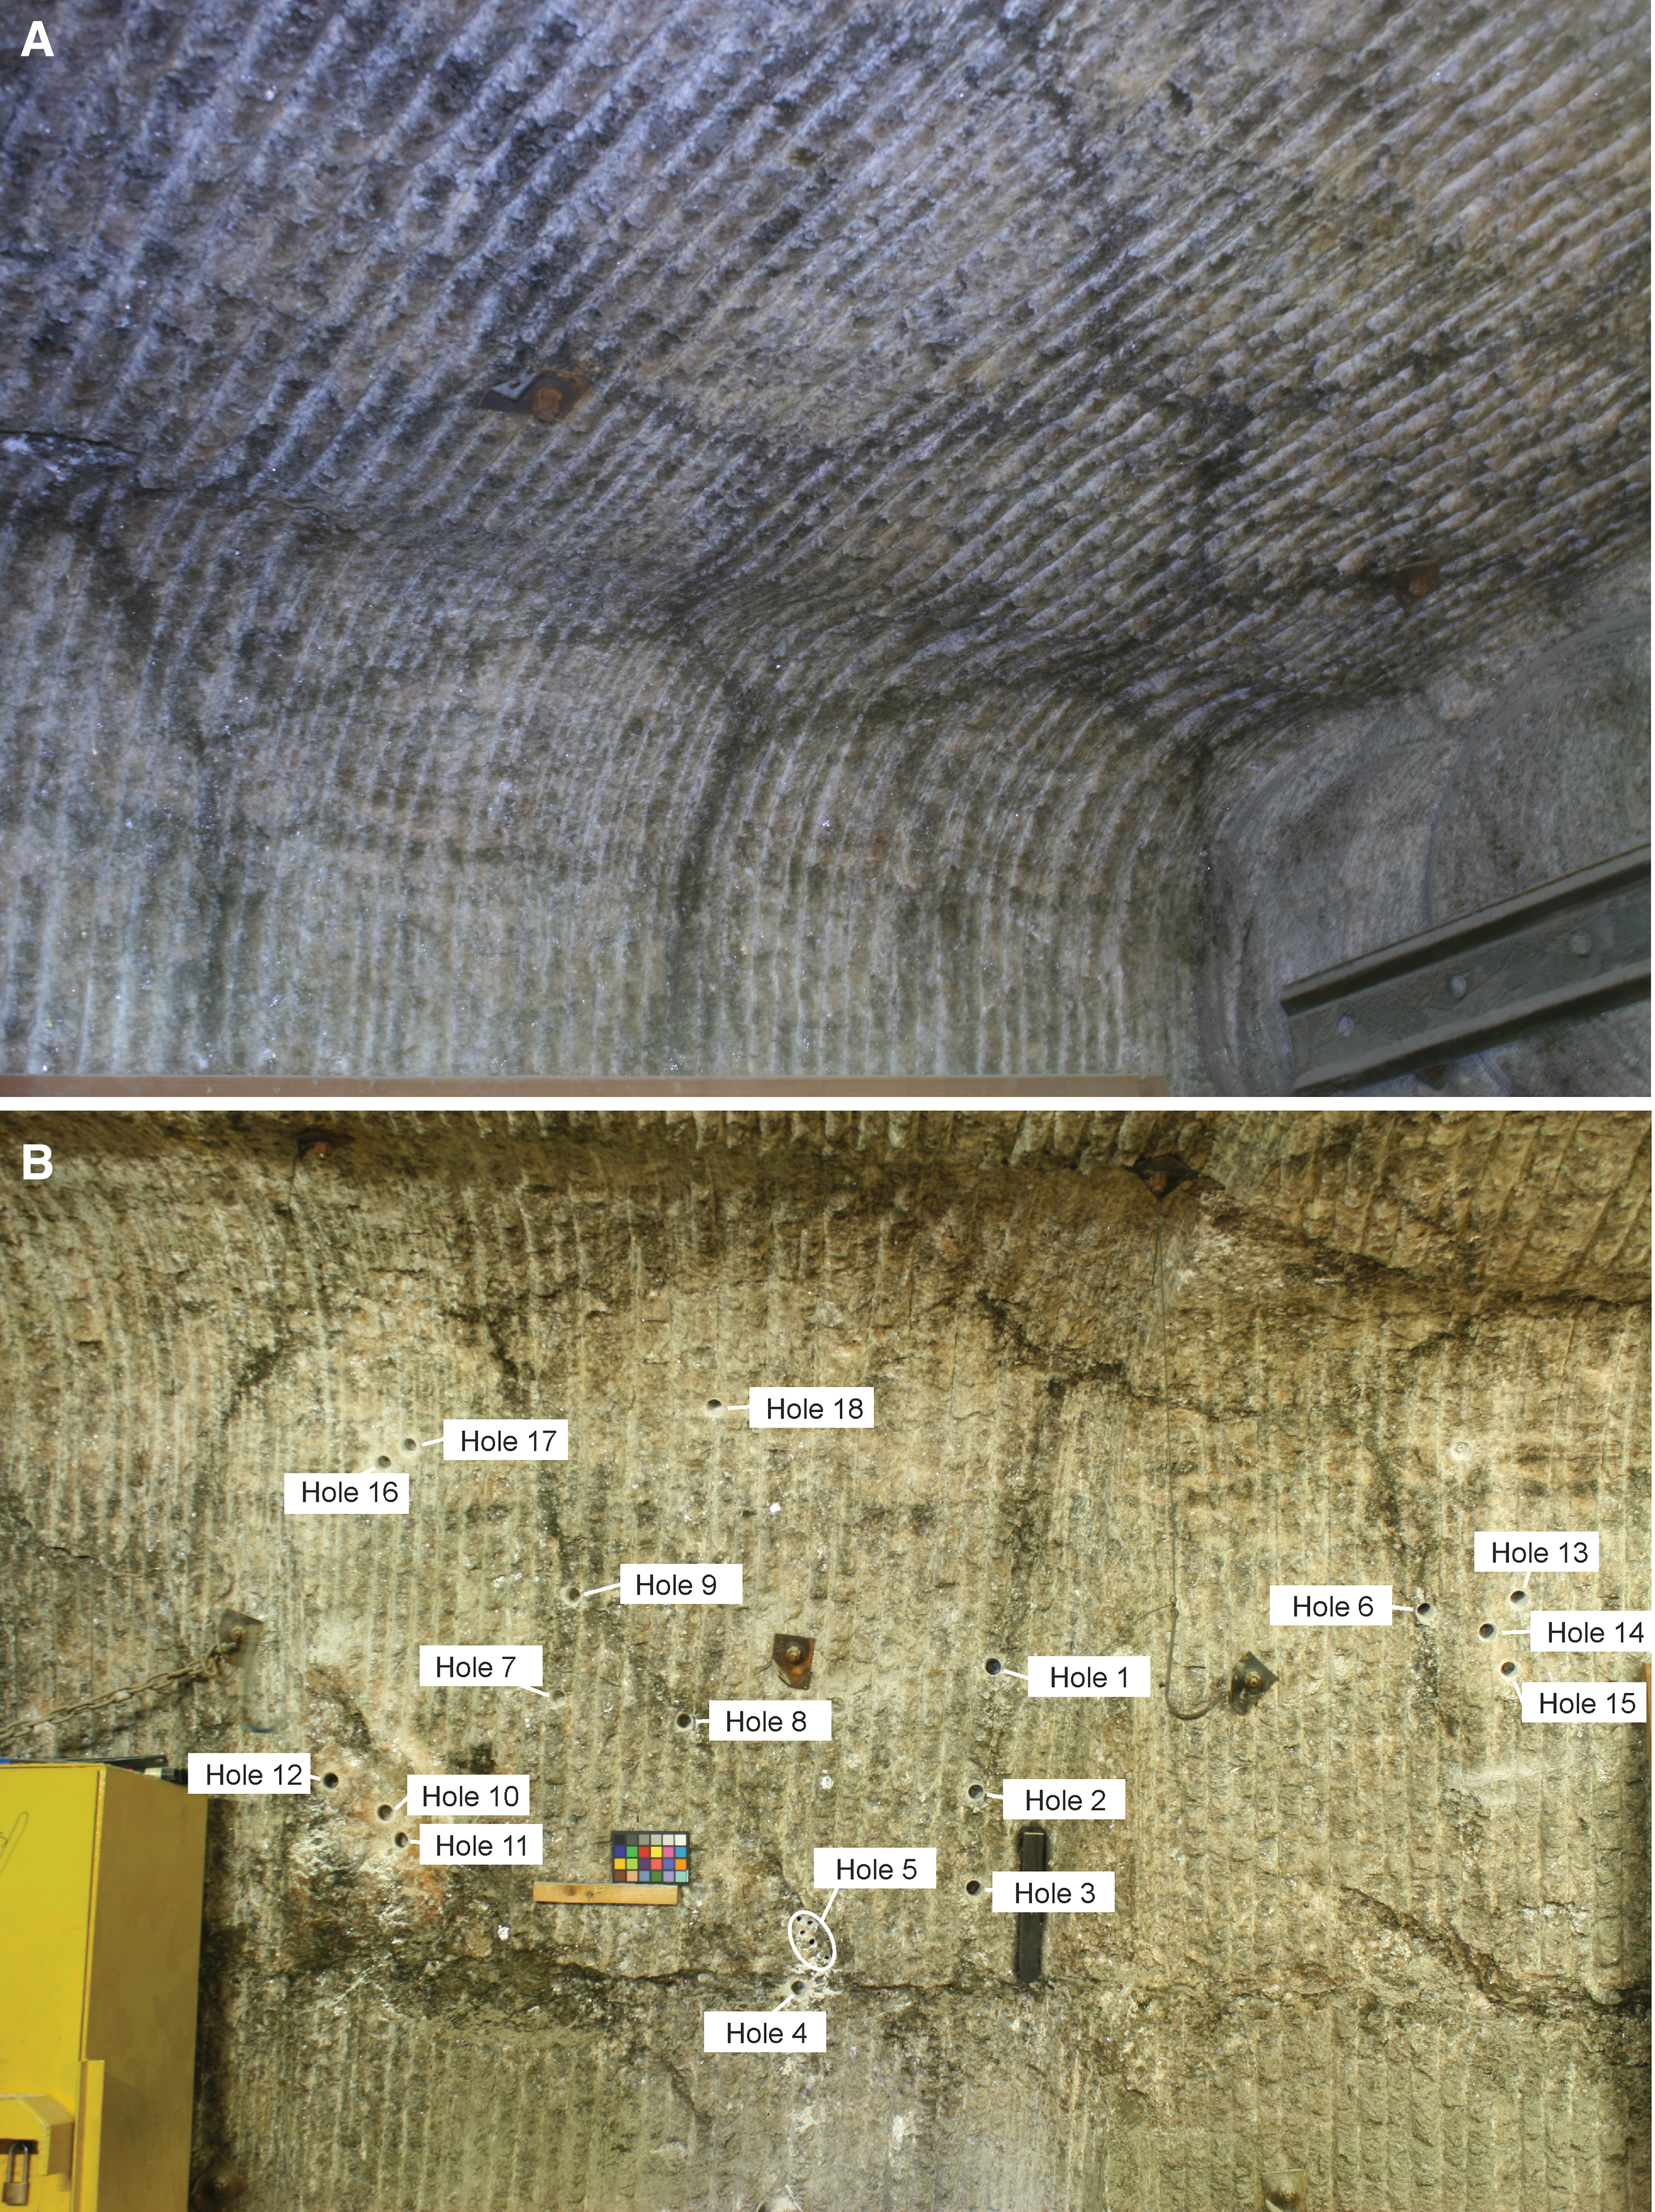
Sample Identification of Material Drilled from Edges and Interior of Polygons with Reference to Locations Shown in Fig. 1
Sample collection points were identified at the edges and interiors of polygons (Fig. 1), with three samples obtained from each point. Each set of triplicates was pooled. Three sets of triplicates were obtained from the edges and interiors of polygons (Table 1).
Samples were obtained with an Erbauer Diamond Core Drill Bit (38 mm core diameter). Drill bits were baked at 450°C for 9 h in aluminum foil to remove organic contamination. Separate corers were used for interior and polygon edge samples. A separate corer was used to remove the top ∼5 cm of material from the face of the sampling site to minimize contamination from the mine environment. Fresh samples were then drilled from below this depth to ∼30-cm depth. Core material was collected either directly into glass bottles baked at 450°C for 4 h or onto aluminum foil similarly baked. After collection in glass bottles, samples were immediately sealed with baked aluminum foil and enclosed by using a PTFE lid. Sample bottles were maintained at ambient temperatures before return to the laboratory. From this point on, all samples were handled in a laminar flow hood under aseptic conditions.
In addition to drilled samples, two other samples were collected. “Edge selected” was a sample made up of chunks of dark polygon edge material collected with a 1-cm-wide steel chisel baked at 450°C for 4 h. This sample was intended as an end-member sample of the darkest material that we could identify to be associated with the edges of polygons. “Interior selected” was a sample made up of fragments of clear halite in interior polygon material free of inclusions. This sample was intended as an end-member sample of translucent material associated with the interior of polygons.
Approximately 100 g of each sample was collected.
In addition to the samples shown in Table 1, an additional “edge extract” sample was prepared by dissolving 5 g of “edge selected” sample in 10 mL dd H2O overnight, removing the water and repeating the process a total of three times to yield a sample of the mineral and clay mix from the polygon edges in which there were no macroscopically observed salt crystals. The purpose of this sample was to remove the halite matrix and allow for a more accurate determination of the non-halite mineral and clay composition, and the isotopic composition of C, N, and S in the mineral and clay material. The sample was dried for 48 h in a desiccator containing silica gel to yield the final “edge extract” sample for XRD (X-ray diffraction), XRF (X-ray fluorescence), and isotopic analysis. This procedure would potentially remove dissolved organic carbon; thus, isotope values are those associated with the non-dissolvable recalcitrant material.
2.3. X-ray diffraction and fluorescence
Samples were analyzed by using X-ray diffraction and fluorescence at the School of Geosciences, University of Edinburgh (laboratory analysis). Samples were gently crushed in a mortar and pestle into a powder. The powder (∼1 g) was mounted on clean plastic slides. Care was taken to use as little compressional force as possible to minimize preferred mineral grain orientation, particularly since the samples contain anisotropic mineral grains such as clays. The samples were fed into a Bruker D8-Advance X-ray diffractometer, using a 2-theta configuration in which the X-rays were generated by a Cu-anode X-ray tube operating at 40 kV and a tube current of 40 mA. Diffracted X-rays were detected with a sodium iodide scintillation detector. The samples were scanned from 2° to 60° two theta with a scan rate of 0.02° per second. Resultant diffractograms were compared with the International Centre for Diffraction Data (ICDD) diffractogram database library (2012 issue) by using the EVA analysis package. Typically, this procedure gives a detection limit for crystalline phases of ∼1 wt %. To quantify mineral abundances in the samples, the diffractograms were subject to Rietveld analysis with the TOPAS software package. This involved identifying the mineral assemblage present by comparing peak positions and heights with those in the powder diffraction database. The TOPAS program then generated a “model” diffraction pattern, calculated from an initial estimated mineral assemblage. The differences between the two are reduced iteratively, which typically takes around 100 iterations, until the model and observed patterns converge, revealing the amounts of the minerals in wt %.
2.4. Carbon, sulfur, and nitrogen total and isotope analysis
Samples were analyzed by Isoanalytical Ltd to obtain values for the total abundance of carbon, sulfur, and nitrogen and their isotopic values. For each sample, 40 mg of powdered homogenized material was examined.
Raw drilled samples or prepared edge samples were acidified with 1 M hydrochloric acid and left overnight to allow inorganic carbon to be liberated as CO2. The samples were then neutralized by repetitively washing with distilled water and subsequently oven dried at 60°C in readiness for δ13C isotope analysis. Carbon isotope analysis was undertaken by elemental analyzer–isotope ratio mass spectrometry (EA-IRMS).
Tin capsules containing sample or reference material were loaded into an auto-sampler on a Europa Scientific elemental analyzer. From there, they were dropped in sequence into a furnace held at 1000°C and combusted in an oxygen-rich environment, raising the temperature in the region of the sample to ∼1700°C. The gases produced on combustion were swept in a helium stream over combustion catalyst (Cr2O3), copper oxide wires to oxidize hydrocarbons, and silver wool to remove sulfur and halides. The resultant gases, N2, NOx, H2O, O2, and CO2 were swept through a reduction stage of pure copper wires held at 600°C. This step removes O2 and converts NOx species to N2. A magnesium perchlorate chemical trap removed water. Carbon dioxide was separated from nitrogen by a packed column gas chromatograph held at an isothermal temperature of 100°C. The resultant CO2 chromatographic peak entered the ion source of the Europa Scientific 20-20 IRMS, where it was ionized and accelerated. Gas species of different mass were separated in a magnetic field and then simultaneously measured with a Faraday cup collector array to measure the isotopomers of CO2 at m/z (mass-to-charge ratio) 44, 45, and 46. Both references and samples were converted and analyzed in this manner.
The reference material used during δ13C analysis was IA-R001 (wheat flour, δ13CV-PDB = of −26.43‰). For quality control purposes, samples of IA-R001, IA-R005 (beet sugar, δ13CV-PDB = −26.03‰), and IA-R006 (cane sugar, δ13CV-PDB = −11.64‰) were analyzed. IA-R001, IA-R005, and IA-R006 were calibrated against, and traceable to, IAEA-CH-6 (sucrose, δ13CV-PDB = −10.43‰). IAEA-CH-6 is an inter-laboratory comparison standard distributed by the International Atomic Energy Agency (IAEA, Vienna, Austria).
For nitrogen isotope analysis, a carbosorb trap was used to remove CO2. Nitrogen was resolved by using a packed column gas chromatograph held at an isothermal temperature of 100°C. The resultant chromatographic peak for N2 entered the ion source of the IRMS, where it was ionized and accelerated. Isotopomers of N2 at m/z 28, 29, and 30 were measured.
The reference material used during δ15N analysis was IA-R001 (wheat flour, δ15NAIR = 2.55‰). For quality control purposes, samples of IA-R001, IA-R045 (ammonium sulfate, δ15NAIR = −4.71‰), and IA-R046 (ammonium sulfate, δ15NAIR = 22.04‰) were analyzed. IA-R001, IA-R045, and IA-R046 are calibrated against, and traceable to, IAEA-N-1 (ammonium sulfate, δ15NAIR = 0.4‰). IAEA-N-1 is an inter-laboratory comparison standard distributed by the IAEA.
For sulfur isotope analysis, tin capsules containing reference or sample material plus vanadium pentoxide catalyst were loaded into the autosampler. They were dropped in sequence into a furnace held at 1080°C and combusted in an oxygen-rich environment, raising the temperature in the region of the sample to ∼1700°C. The gases produced on combustion were swept in a helium stream over combustion catalysts (tungstic oxide/zirconium oxide) and through a reduction stage of high-purity copper wires to produce SO2, N2, CO2, and water. Water was removed by using a Nafion™ membrane. Sulfur dioxide was resolved from N2 and CO2 on a packed gas chromatography (GC) column at a temperature of 32°C. The resultant SO2 peak entered the ion source of the IRMS, where upon it was ionized and accelerated. Analysis was based on monitoring of m/z 48, 49, and 50 of SO+ produced from SO2 in the ion source. Both references and samples were converted to SO2 and analyzed by using this method.
The reference material used for sulfur isotope analysis was IA-R061 (barium sulfate, δ34SV-CDT = +20.33‰). IA-R061, IA-R025 (barium sulfate, δ34SV-CDT = +8.53‰), and IA-R026 (silver sulfide, δ34SV-CDT = +3.96‰) were used for calibration and correction of the 18O contribution to the SO+ ion beam. IA-R061, IA-R025, and IA-R026 are calibrated against, and traceable to, NBS-127 (barium sulfate, δ34SCDT = +20.3‰) and IAEA-S-1 (silver sulfide, δ34SV-CDT = −0.3‰). NBS-127 and IAEA-S-1 are inter-laboratory comparison standards distributed by the IAEA. For quality control purposes, test samples of IA-R061 and IAEA-SO-5 (barium sulfate, δ34SV-CDT = +0.50‰) were measured as quality control checks. IAEA-SO-5 is an inter-laboratory comparison standard distributed by the IAEA.
2.5. Strontium isotope analysis
A sample of “edge extract” was soaked overnight in 25 mL milli-Q water in a 125 mL Teflon beaker. The water was then extracted from the beaker with a plastic syringe and passed through a 0.25-μm filter to remove particulate matter. The water sample was evaporated in a drying oven at 60°C. The solid residue was dissolved with 10 mL of 7 M nitric acid. The dissolved solution was passed over an Eichrom Sr ion exchange resin. The resin was rinsed with 5 mL of 5 M nitric acid, and the Sr was eluted from the column by passing 10 mL of milli-Q water over the resin bed. The collected sample was evaporated under a heat lamp to dryness.
From that sample, ∼1 μg was loaded onto a rhenium filament and ionized by a Thermo-Finnegan Triton thermal ionization mass spectrometer (TIMS) to quantify the relative abundance of 86Sr and 87Sr. Three filaments were loaded with NIST987 (87Sr/86Sr = 0.710245 2σ̅ ± 0.000015) standard reference material, which was used to correct the unknown sample data against a material with a known value for 87Sr/86Sr. The variance of the NIST987 results for the three filaments were used with the standard deviation of the unknown sample's 87Sr/86Sr result to calculate the 2ɛ.
A repeat measurement was carried out on a second filament to demonstrate reproducibility.
2.6. ICP-MS/OES (inductively coupled plasma-mass spectrometry/optical emission spectrometry) analysis of water extractions
Samples were analyzed by ICP-MS using an Agilent 7500ce (with octopole reaction system), employing an RF (radio frequency) forward power of 1540 W and a reflected power of 1 W, with argon gas flows of 0.81 and 0.20 L/min for carrier and makeup flows, respectively. Sample solutions were taken up into the Micro mist nebulizer by a peristaltic pump at a rate of ∼1.2 mL/min. Skimmer and sample cones were made of nickel.
The instrument was operated in spectrum multi-tune acquisition mode, and three replicate runs per sample were employed. Each mass was analyzed in fully quant mode with three points per unit mass. 85Rb, 88Sr, 89Y, 139La, 140Ce, 146Nd, 208Pb, and 238U were analyzed in “nogas” mode; then, 50V was analyzed in Helium mode to remove any polyatomic interferences (e.g., ClO at mass 50).
A range of multi-element calibration standards containing each element were prepared with single-element 1000 mg/L standards diluted with 2% v/v HNO3. An NIST standard reference material, SRM1640a, was employed as a reference standard for some of the elements.
The samples were analyzed by ICP-OES using a Perkin Elmer Optima 5300 DV, employing an RF forward power of 1400 W, with argon gas flows of 15, 0.2, and 0.75 L/min for plasma, auxiliary, and nebulizer flows, respectively. By using a peristaltic pump, sample solutions were taken up into a Gem Tip Cross-Flow nebulizer and Scotts spray chamber at a rate of 1.50 mL/min.
The instrument was operated in axial mode for all elements. A range of calibration standards for each element were prepared with either single-element 1000 mg/L standards (Fisher Scientific UK Ltd., Loughborough, United Kingdom; S, P), diluted with 2% HNO3 or Merk ICP Multi element standard solution VI CertiPUR® (Ba, Ca, Mg, Fe, K, Na, and Sr). A 10-fold dilution of Merk ICP multi-element standard solution VI CertiPUR was employed as a reference standard for each of the elements.
The selected wavelengths for each element were analyzed in fully quant mode (three points per unit wavelength). Three replicate runs per sample were employed. Initially, several wavelengths were selected for each element. After the analysis was completed, the following wavelengths were selected for reporting results based on the shape of the peaks at that wavelength, background interferences, wavelength sensitivity, and linearity of the calibration lines: (wavelength in nm) K (766.49), Na (330.24), Ca (315.89), Mg (279.08), Ba (233.53), Fe (234.35), S (180.67), and P (178.22).
2.7. Lipid extractions and analysis
Glass jars containing samples were removed from the −20°C freezer and kept for 30 min to 1 h at room temperature to prevent condensation of moisture onto the sample. Samples were not lyophilized to reduce the exposure time to the laboratory environment and minimize contamination risk. Sixty to eighty grams of sample were removed from the glass jars and then homogeneously powdered with a different ceramic mortar and pestle that had been previously combusted (550°C, 12 h).
Given that halite comprised the majority of the sample, each sample was extracted by using a modified Bligh and Dyer protocol, which contains a water portion to solubilize the salt (Bligh and Dyer, 1959; Jahnke et al., 1992). The protocol was modified primarily to minimize transfer steps and contamination, loss of biomass during extraction, and allow for extraction from ∼100 g of sample (Wilhelm et al., 2017). Given the previously unknown lipid content of the sample, and limited amount of sample we had, we chose not to add an exogenous standard to the sample before extraction. To obtain the “freely extractable” lipid component, three extractions were performed on powdered sample: 40 mL of HPLC (high performance liquid chromatography)-grade water, 100 mL of pesticide-grade methanol, and 50 mL of pesticide grade-methylene chloride (DCM). After the addition of solvents, the resultant slurry was sonicated (1 h), stirred (2 h), and left to settle until the solvent became mostly clear, at which point it was poured into a new previously combusted flask and the residue was re-extracted. To obtain the “acid extractable” lipid component, the same aforementioned protocol was used, but with 1 N hydrochloric acid in the 40-mL water component.
Solvent extracts were then added to a solvent-washed Teflon separatory funnel with 180 mL of extract and 47 mL of DCM and inverted two times to mix. Water (47 mL) was then added to drive the methanol into the aqueous phase, and the mixture was gravimetrically separated. The DCM layer was slowly drained into a new flask; the methanol and water phase was discarded. The resulting extract was evaporated under a gentle stream of N2 at 20°C and transferred into smaller previously combusted vials until 40 μL remained. Care was taken to minimize the number of containers used in the evaporation process and to thoroughly rinse and sonicate the sides of all vessels after draining to recover any lipid left behind. This evaporation process concentrated the extract by roughly three orders of magnitude.
The entire amount (100%) of the total lipid extract (TLE) was used for analysis by gas chromatography-mass spectrometry (GC-MS). A 5α-Cholestan-3β-ol standard (Sigma-Aldrich) was then added to the TLE for a mass of 13.6 ng standard per 1 μL injection into the GC-MS. The final volume of the TLE in DCM was 40 μL. Then, 1/40th of this volume was injected into the GC-MS. The GC-MS of lipids was performed on an Agilent 7890B GC-5977A MSD system equipped with an Agilent DB-5MS column (60 m × 250 μm × 0.25 μm; Agilent, Santa Clara, CA) with high-purity helium as carrier gas at 1 mL/min. The inlet temperature was 280°C. Initial oven temperature was 50°C, ramped to 120°C at 10°C/min, increased from 120°C to 320°C at 4°C/min, and held at this temperature for 5 min. The MS source temperature was 280°C. The instrument limit of detection is 1 pg of a C23 fatty acid methyl ester standard, and the limit of quantitation is ∼3 pg when using the same 60 m DB-5MS column and heating protocol as was used in analysis. The lipids were quantified by comparing peak areas relative to the internal standard. Peaks were identified by their mass fragmentation pattern and retention time.
3. Results
3.1. X-ray diffraction and fluorescence
To determine the composition of the distinctive dark material that comprises the edge of the polygons, samples were analyzed by XRD.
Results of XRD analysis are shown in Table 2.
XRD Analysis of Major Mineral Components (%) of Samples
The edge extract also contained: Na-feldspar, 1.4%; Kaolinite, 3.7%; Biotite, 2.1%.
To obtain further information on the elements that are contained in the dark material around the edges of the polygons, the “edge extract” samples were analyzed by XRF for major and trace elements. Results for this analysis are shown in Tables 3 and 4.
Major Element XRF Analysis of Polygon “Edge Extract” Sample
Sample described in Methods section.
LOI, Loss on Ignition.
Minor Element XRF Analysis of “Edge Extract” Sample
Sample described in Methods section.
3.2. Carbon, sulfur, and nitrogen total and isotope analysis
The values in percent (total) and isotope values for C, S, and N are shown in Table 5.
Total (%) and Isotope Values (‰) for C, N, and S
Em dashes denote unobtainable values (concentrations too low for either percent or isotopic determination).
3.3. Strontium isotope analysis
The edge extract sample analysis gave a value of 87Sr/86Sr of 0.707375 (2ɛ = 0.000015).
3.4. ICP-MS/OES analysis of water extractions
The values of major elements and rare earth elements obtained from the dissolution of samples in dd H2O are shown in Tables 6 and 7.
ICP-OES Data for Elements in Edge and Interior Polygon Samples (mg/L) Unless Otherwise Stated
ICP-MS Data for Selected, Measurable Trace Elements and Rare Earth Elements in Edge and Interior Polygon Samples (μg/L)
3.5. Lipid results
3.5.1. Free fatty acids
C14:0, C16:0, C18:0, and free fatty acids were found to be present in only 3 of the 12 samples analyzed (interior 14, edge 2, edge 9). There was approximately 4–63 ng of free fatty acid per gram of sample in these three samples.
3.5.2. n-Alkanes
n-Alkanes were present in all samples and were the most abundant class of lipid biomarkers present in samples. Neither acid extracted nor freely extracted n-alkanes exhibited a strong even or odd carbon chain length preference.
The freely extractable alkanes generally show maxima at C24 (Fig. 2A). Except for the “edge 2” polygon sample that was about three times more concentrated and had a maximum abundance at C20, there were no major differences between interior and edge polygon samples.
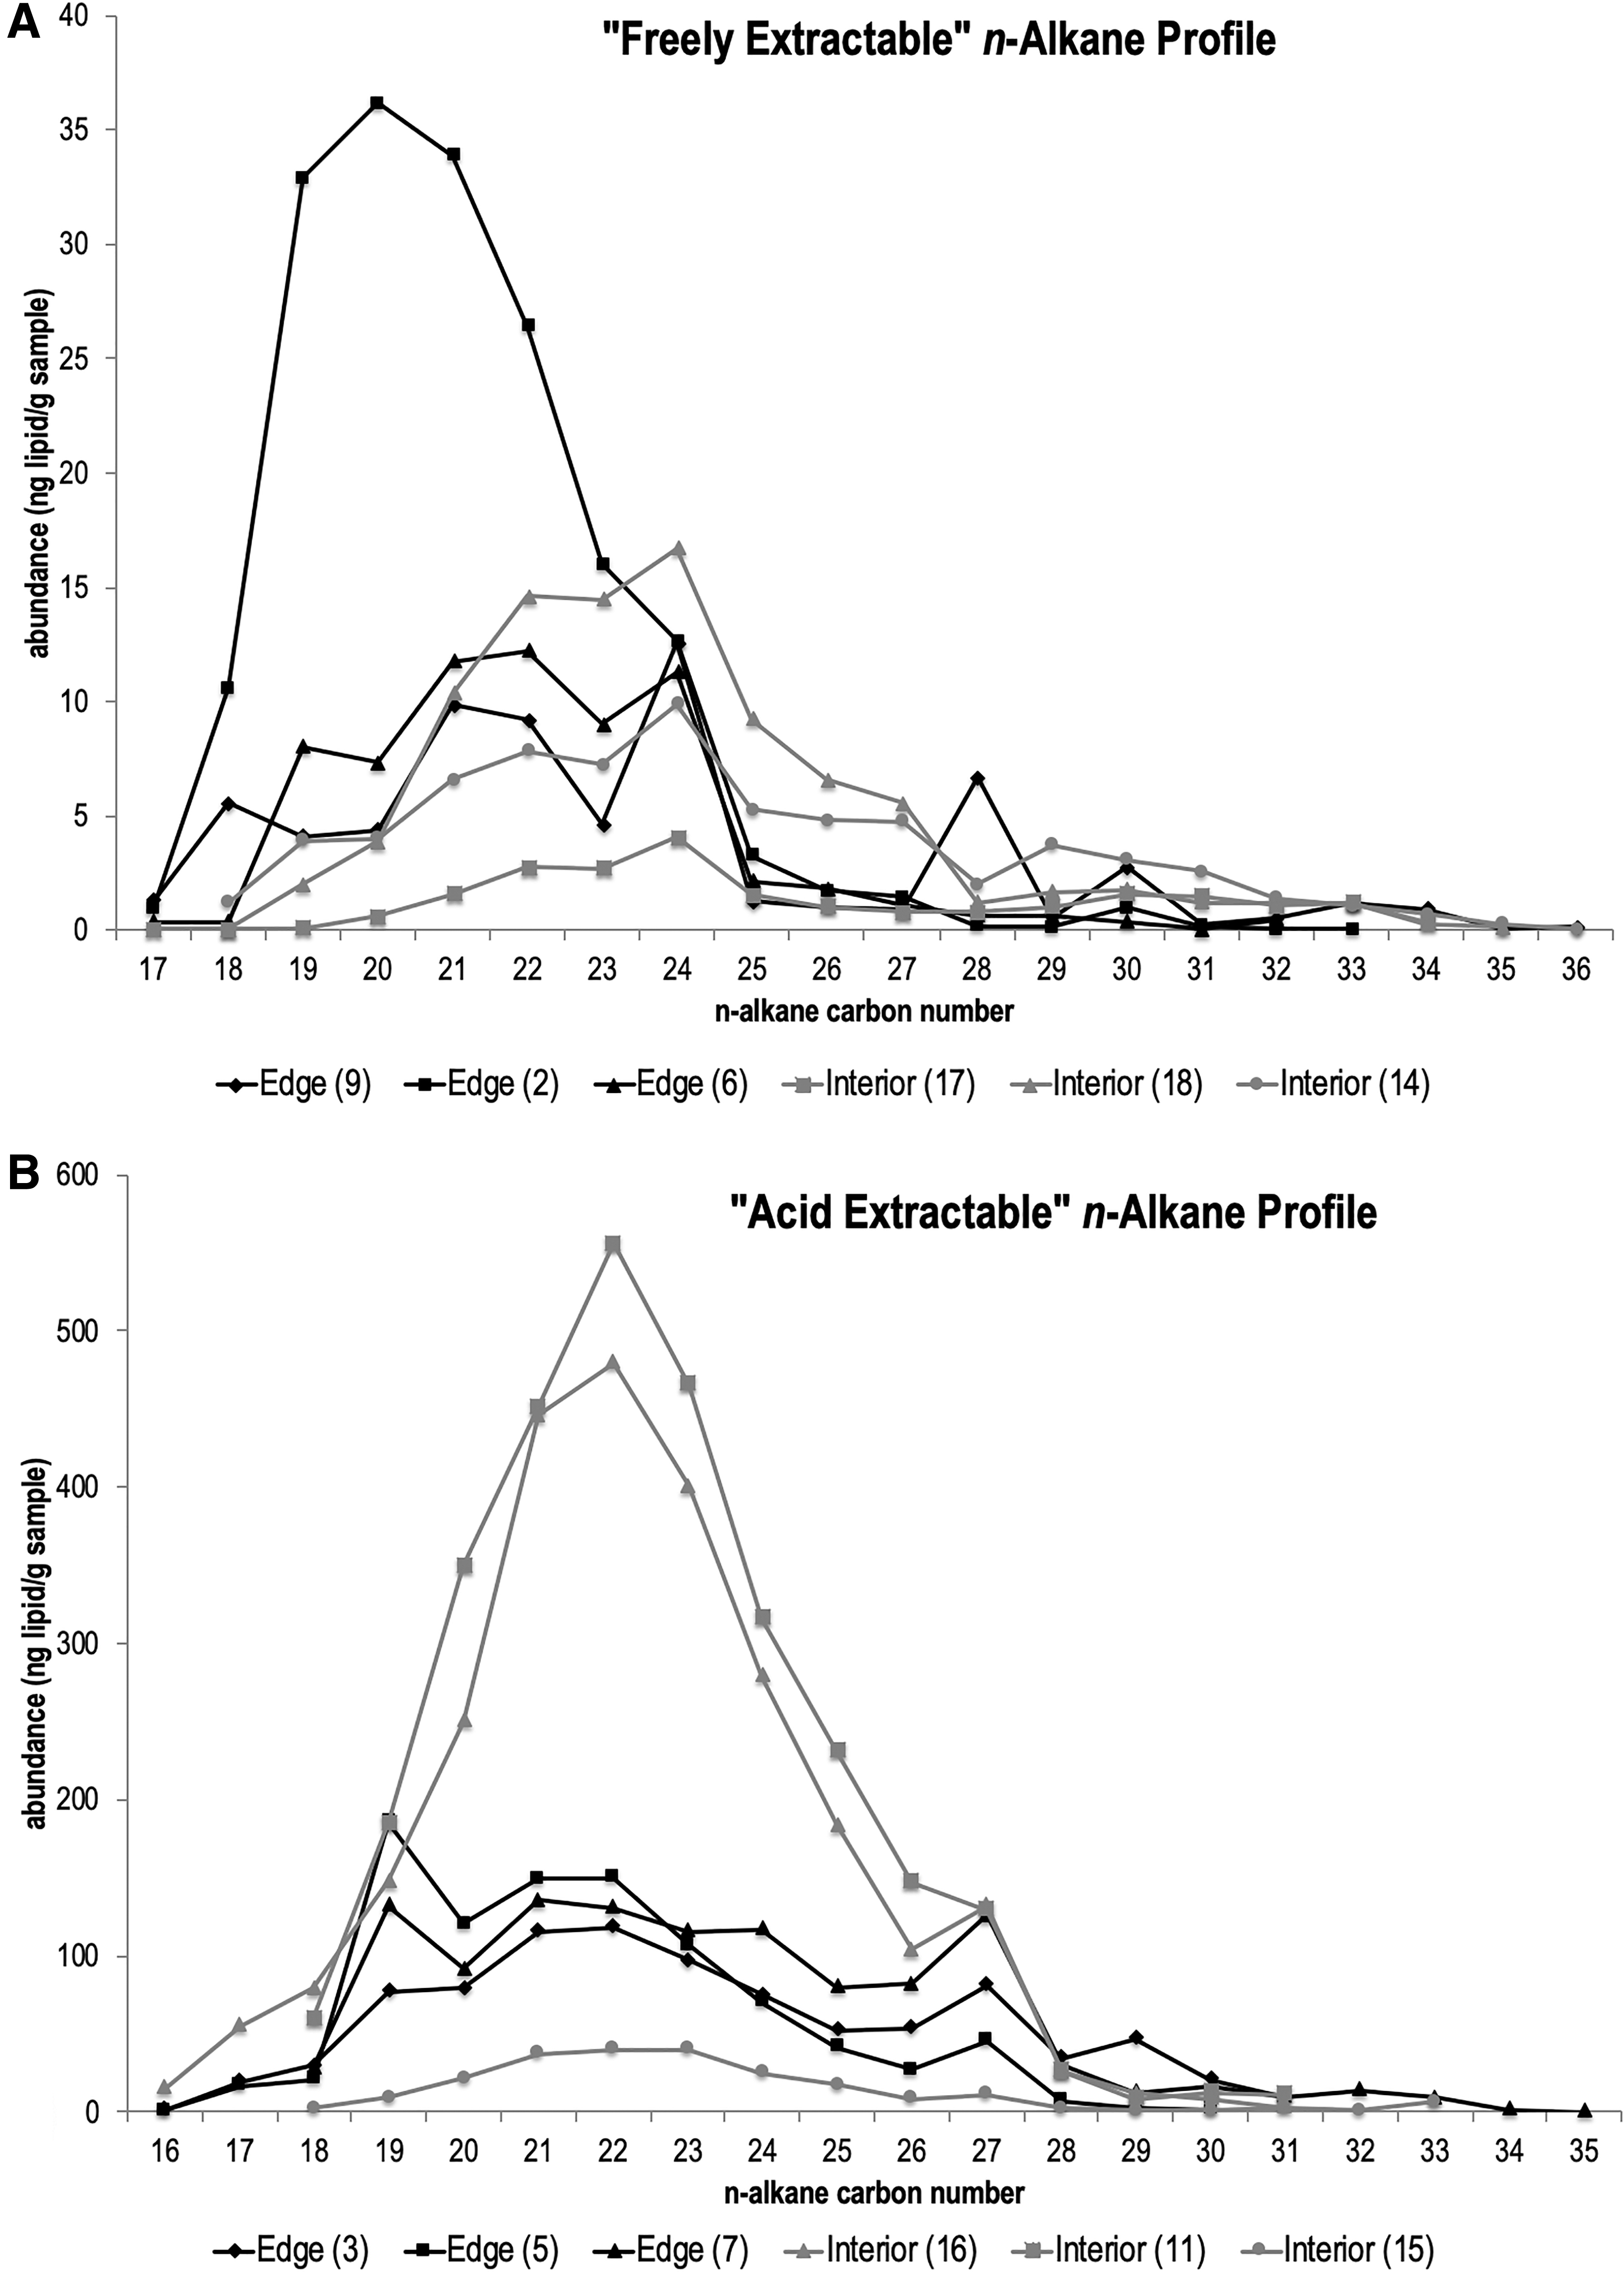
Free
Acid-extractable n-alkanes generally have maxima at C22 (Fig. 2B). Two of the three acid-extracted interior polygon samples had about three times the concentration of n-alkanes as compared with edge polygon samples. The three edge polygon samples had comparable concentrations and carbon number preferences.
3.5.3. Hopanes
Mass chromatograms of the m/z = 191 ion reveal similar identities of hopanes in both the edge and interior polygon samples in the C27–C32 range (Fig. 3). The most abundant hopane is the 17a, 21B(H) 30-hopane and secondarily 17a, 21B(H) 29-hopane. There were seven major hopanes identified. Acid extraction of polygon interior and edge samples revealed more than an order of magnitude more hopane than what was detected in the freely extractable portion. All three interior acid-extractable polygon samples contained more hopane than the edge acid-extractable polygon samples (Fig. 4).
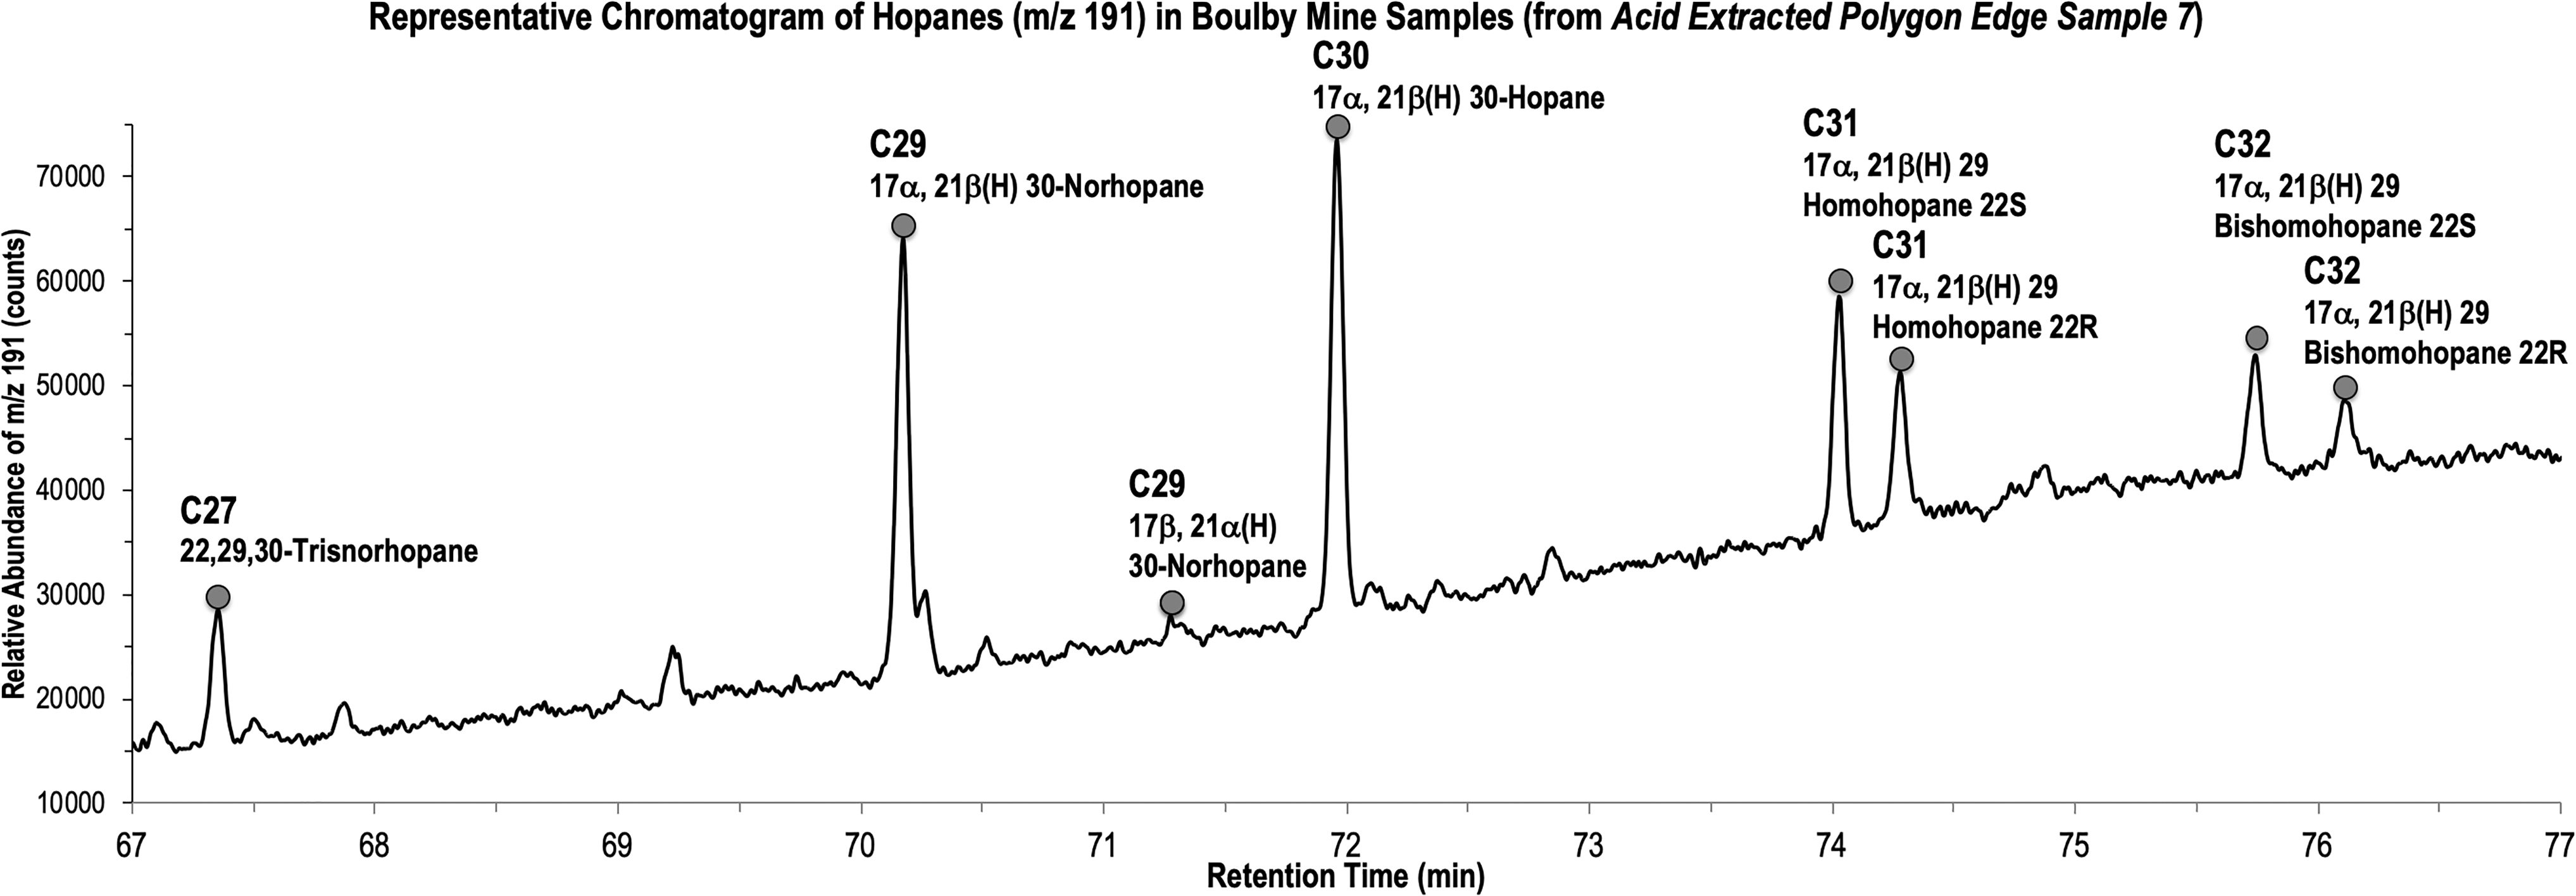
Representative chromatogram of hopanes (m/z 191). Lipids extracted from polygon edge, sample 7. m/z, mass-to-charge ratio.
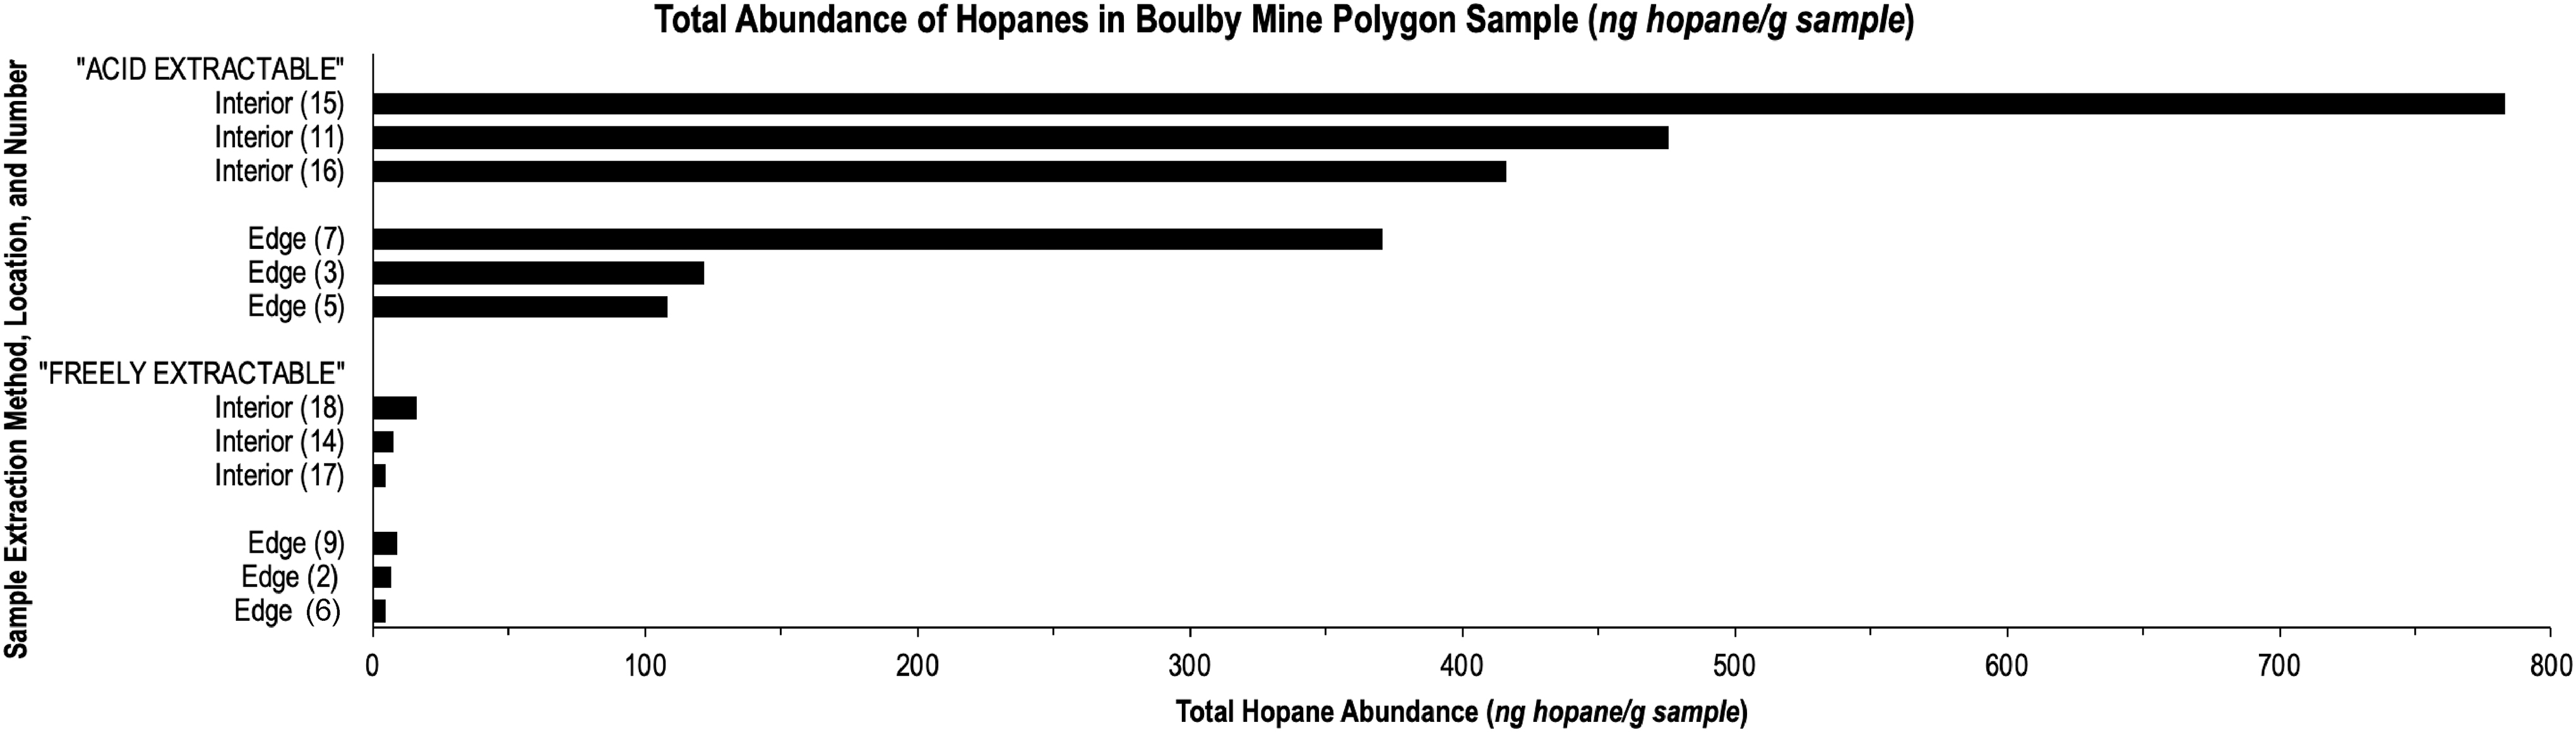
Total abundance of hopanes in Boulby polygon samples.
3.5.4. Steranes
Steranes were detected in all six of the acid-extracted samples and two of the six freely extracted samples analyzed (edge 2, 3, 5, 7, interior 11, 14, 15, 16). The m/z 217 chromatograms reveal approximately six major peaks.
3.5.5. Isoprenoids
No isoprenoidal lipids (e.g., phytane or pristane) were detected in any of the samples analyzed.
4. Discussion
4.1. Nature and content of evaporitic polygonal structures
One conspicuous feature of evaporitic basins and salt flats is the presence of polygonal structures. In addition to their observed presence on the surface of modern-day salt flats, polygonal features have also been observed in Triassic evaporite sequences (Tucker, 1981). They are conspicuous by their dark colored edges compared with their interiors. Halite polygonal structures are observed in salt sequences in the ∼0.25 Ga Permian Zechstein Sea salt sequences and are conspicuous in roadways and tunnels associated with the ∼1-km-deep Boulby Mine, the United Kingdom. In this investigation, we sought to test the hypothesis that the polygonal features would contain remnant materials and signatures of past geological and biological activity.
Our analyses showed that the edges of polygonal features were preferential sites of mineral and clay accumulation. XRD analysis showed that the edges contained minerals such as quartz, microcline, orthoclase, and halite and clays including illite and chlorite. Removal of the halite, which dominated the spectra, also revealed Na-feldspar, biotite, and kaolinite. The overall mineral assemblage suggests that the source of the material is the continental weathering of either granitic or sedimentary rocks around the edge of the Zechstein Sea. If the polygons originated by shrinkage cracking (as proposed by Neal et al., 1968), the mineral material would have been transported as wind-blown dust across the exposed and desiccated polygons and accumulated in cracks, which would have eventually sealed. If the polygons formed by evaporation/precipitation (Goehring and Fourrière, 2014) or by thermal expansion (Tucker, 1981), the edges of the polygons would have been defined by protrusions rather than cracks, as observed in modern salt flats. Wind-blown material would be intercepted and would collect around the protrusions. However, regardless of the model for the formation of the polygons, our data demonstrate that the edges of the polygons act as a physical mechanism to trap material, accounting for the high mineral and clay content of polygon edges. The clays we observed may either have been deposited with the other minerals or have been produced by their post-depositional alteration. We exclude the possibility that all the minerals are post-depositional, because there is no mechanism to bring so much material into the salt sequences and deposit them evenly around the edges of polygonal structures. These data show that the edges of polygons can act as a repository of ancient minerals and can provide geological information on the setting and context of salt deposits.
The XRD data, in conjunction with the strontium ratio data, suggest that the material at the edges of the polygons is primarily sedimentary. The 87Sr/86Sr ratio that we obtained from the edge material (0.707375) is lower than typical ocean crust (0.716) (Capo et al., 1998), but within the range for continental sedimentary or volcanic rocks (Wierzbowski, 2013). The value is similar to those derived for Permian seawater, which lie between continental crust and oceanic crust values (Capo et al., 1998), although the evaporitic material was removed from the minerals before the analysis. However, a contribution from Sr leached from the evaporite into the mineral and clay matrix cannot be discounted.
The organic carbon content of the edge material was sufficient to yield a mean δ13C value of −20.8‰. Given the wide range of values reported for different kinds of metabolism, it is difficult to assign this value to particular metabolic processes. The value is higher than that measured in the bulk organic carbon of hypersaline microbial mats, but similar to values found in the lipid component (Wieland et al., 2008). It is also similar to values reported in near-surface marine sediments (Ogrinc et al., 2005). The generally low total organic carbon (TOC) values put bulk isotope measurement at the limits of detectability such that two of the interior polygon samples were below the limits of detection and returned no TOC or C isotope value.
No nitrogen isotope values were recorded in the interior of polygons or in edge samples except for the edge sample material selected from end-member dark material and the sample in which minerals and clays were extracted from the salt. These values were 5.33‰ and 5.74‰, respectively. Nitrogen isotope values are known to fractionate at different points through the nitrogen cycle, so assigning these values to specific processes is problematic. They fall within the range for modern day semi-arid and arid soils in Northern China (Liu et al., 2017) and just below values for particulate matter in the hypersaline Mono Lake, California. They are similar to recalcitrant marine sedimentary organic nitrogen (∼5‰ δ15N; Tesdal et al., 2013). Although they are also similar to the modern-day mean oceanic nitrate value (Sigman et al., 1997, 1999), we do not know the value for Permian sea water and we did not measure any value in the polygon interiors, suggesting that the signature is from mineral and clay material at the edges of the polygons and not from the halite deposits themselves.
We measured a sulfur isotope signature in all samples. In edge samples, the mean value was 8.25‰ and in the interior of the polygons it was 9.77‰. Although it was not detected by XRD, the halite in Boulby is known to contain small quantities of anhydrite and barite (unpublished data), which may contribute an S isotopic value to the material. Alternatively, the S is associated with amorphous material or recalcitrant organic carbon. These values are similar to those measured in Permian evaporites by Strauss (1997) and Kampschulte and Strauss (2004), that is, between ∼8‰ and 22‰. The bulk values we measured are likely dominated by the sulfate evaporitic component of the salt, particularly as they are found in the interior of polygons. Significantly, in the edge-selected material in which the halite component was minimized, the value dropped to 2.4‰. In the extracted samples in which the clay and mineral fraction was separated from the dissolvable salt, the S isotope value was lower still, at −1.67‰, potentially suggesting a residual biologically derived value. This interpretation would be consistent with the observation that although the interior of the polygons contained a mean S content of 0.13%, the edges contained 0.51% S, showing that the mineral and clay material are associated with their own sulfur component.
These data show that the polygons record the geological context of the environment in which they were laid down in the form of trapped minerals and they potentially record a biological signature in the form of a bulk carbon isotope signature at their edges.
The minerals also preserve some information on habitability. None of the minerals within the edges of the polygons contain elements or compounds known to be toxic to a microbiota. Potentially toxic elements such as Cu, Ni, Pb etc. examined by ICP-MS and XRF were not found at anomalously high concentrations, for instance. These data show that the edges of the polygons preserve evidence for minerals that originate from potentially habitable environments. The data also show that the edges of the polygons, provided with major and trace elements from the entrained minerals, could be habitats themselves when they were formed, or if they were inundated with water at any time since their formation.
Similar polygonal features in halite deposits on Mars (Hynek et al., 2015) likely preserve information on the geological and mineralogical depositional environment of ancient saline water bodies on Mars and their habitability, and they may represent the last vestiges of habitable environments in persistent surface water bodies on Mars. The edges of polygons, which trap minerals and clays and can form habitats, represent locations to test for the presence of habitability and life. The study of hypersaline polygons and their edges should be high-priority sites for investigation by robotic and human explorers.
4.2. Origin and maturity of lipid biomarkers in Boulby salts
The lipid biomarker features observed in Boulby samples include an overall low abundance of biomass dominated by long-chain alkanes, a relatively small number and abundance of hopanes and steranes, and a lack of isoprenoidal lipids. These features are attributable both to depositional effects (i.e., how the salts precipitated and what biomass was present during deposition, whether from the parent water body and/or from organisms inhabiting an evaporite) (e.g., Barbe et al., 1990) and to degradational effects (i.e., the post-depositional microbial and/or physicochemical conditions that lead to the destruction or alteration of deposited biomass, migrations of secondary solutions that are resealed by crystallization, or increased temperatures over time that led to changes in the lipid structures; i.e., thermal maturity) (e.g., Toboła, 2018).
Although there is uncertainty about whether primary crystallization of the salts in Boulby has remained, given the scale of the Boulby deposit, it is unlikely that fluids have pervaded the entirety of the salt deposited, particularly the polygon interiors. In addition, there is no evidence for significant deformation of the contiguous Boulby salt deposit aside from small (decimeter-scale) fractures that resemble the polygon edges (Fig. 1 and unpublished observations). The migration of hydrocarbons through evaporites is rare (Zhuo et al., 2014). Therefore, it is most probable that the biomass patterns observed, particularly in polygon interiors, reflect the lipids present and/or degraded remains of the population of microbes and biomolecules present before crystallization of the salts that comprise the polygons, and not fluids that later migrated into the deposit.
The low TOC values and low abundances of lipid biomarkers detected in Boulby are typical of high-salinity deposits, as TOC in gypsum, halite, and other high salts is typically lower than shales or carbonates, for comparison (Hofmann et al., 1993). This is because, generally, TOC is related to the rate of deposition, and salts with relatively high sedimentation rates such as halite dilute the organic matter content of a sample, even if primary productivity is high (Barbe et al., 1990; Grice et al., 1998; McGenity et al., 2000). The TOC in halites seldom exceeds 0.3%, with the majority <0.01% (Anders and Hite, 1990). The low TOC observed in Boulby samples is comparable to other halite deposits precipitated from coastal evaporitic systems (e.g., Barbe et al., 1990).
Boulby salts lack lipid biomarkers that are typically found in both marine and evaporitic settings. For example, typical marine input indicators (e.g., pristane, phytane, and moretane) (e.g., Hofmann et al., 1993) were not observed. Neither were common evaporitic system lipid biomarkers and lipid patterns such as nC17 alkane, >nC24 alkanes, gammacerane, presence of isoprenoids (e.g., Peters et al., 2005; Chairi et al., 2010; Chen, 2013; Elfadly et al., 2017), although if isoprenoids, namely bound archaeal lipids, were present in Boulby samples, they could have been destroyed by early-stage diagenesis (Grice et al., 1998). This potentially indicates a predominately non-marine or evaporitic source for organic material contained in Boulby salts, consistent with our interpretation of XRD and 87Sr/86Sr data. In addition, the observed low abundances of C23–C29 hopanes are suggestive of non-marine input (e.g., Hunt, 1996).
Long-chain alkanes (n-C20–C35) could indicate a contribution from terrestrial plants (e.g., Volkman, 2006), or could have been contributed by algae (Liu and Liu, 2016). The lack of carbon number preference in n-alkanes (Fig. 2) could be a sign of thermal maturity (e.g., Jiamo et al., 1986; Baranger and Disnar, 1988), bacterial diagenesis (Baranger and Disnar, 1988), and/or an indicator of hypersaline environments (Jiamo et al., 1986; Ten Haven et al., 1985). However, the lack of detectable aromatics and alkenes in Boulby salts indicates that organics have a low thermal maturity (Tissot and Welte, 2012). It is noteworthy that the Boulby evaporites were at the edge of the Zechstein Basin (Taylor, 1998; Zhang et al., 2013), and thus a non-marine input is plausible.
Finally, physical fractures and morphological deformities are known to concentrate organic matter during crystallization (e.g., Pasteris et al., 2006). Physical fractures, such as brittle faulting observed previously in evaporites, may impact taphonomic processes by exposing organic compounds preserved in these physical fractures to migrating fluids or water from high-pressure-induced dehydration minerals (Zhuo et al., 2014). However, in the Boulby samples analyzed, we did not observe a significant difference between the lipid biomarker content in interior versus edge polygon samples. The formation mechanism of the Boulby polygons is not known. However, whatever the mechanism, it likely did not significantly impact the distribution of lipid biomarkers in Boulby salts.
In summary, the lipid biomarkers contained in Boulby salts were most likely deposited uniformly (i.e., independent of location within the polygon structure), relatively rapidly, and have not undergone significant thermal maturation since deposition.
4.3. Implications for preservation and detectability of molecular biosignatures in martian salts
Although the Boulby deposit has experienced some thermal maturation, the time, temperature, and other diagenetic processes experienced by Boulby salts have not obscured the biotic diagnosticity of the preserved lipid biomarkers, meaning that the biomarkers detected still retain hallmarks of the original biologically manufactured compound. In any environment, the fate of biomarkers is selective, favoring the preservation of low-polar molecular species (e.g., lipids) (e.g., Tolosa and Mora, 2001). However, the rapid deposition of salt that subtracts carbonaceous material from the oxidizing environment increases the chances for preservation of lipids (e.g., Baranger and Disnar, 1988). High salinity is known to create favorable conditions for sealing and conservation of hydrocarbons (Chen, 2013). Further, lipid biomarkers have been shown to be longer lived in halite relative to comparably aged deposits of other mineralogies as the typical degradation processes are inhibited (Chen et al., 2011). This taphonomic process, termed salting, could be of great interest to the search for signatures of life on Mars. For example, the halite deposits believed to be on Mars in Meridiani centered at 3.137°S, 8.480°W. (Hynek et al., 2015) could be one of the locations on Mars explored for its exobiological potential.
Although single-celled fossils are rare in halites, with only crude structural features typically preserved (Jaakkola et al., 2016), molecular biosignatures are an ideal target in this type of deposit. Biomarkers, particularly lipids, reflect the cumulative effect of the environmental conditions, deposition, and diagenetic processes leading to preservation over geological timescales in such settings. Further, the lipid biomarker signal preserved at Boulby deposit is not exclusive to the polygon edges nor the polygon interior, indicating that morphological differences may not lead to significant differences in biomarker preservation in halite deposits. These results are perhaps of relevance to considerations for future mission planning to evaporitic systems.
Peculiarly, the acid extractions revealed a few times to an order of magnitude greater abundance of lipid biomarkers in polygon samples than what was freely extractable with a mixture of water, methanol, and dichloromethane with no acid. This indicates that encapsulation in the salt is not the only type of preservation operating in these samples. Potentially, molecular interactions are impeding detection, either from minerals present in the sample (e.g., clays) or from complex associations of biomarkers of interest with other organic molecules (e.g., Keil and Mayer, 2014) as the water used in free extractions would have solubilized any salt that was encapsulating/encasing biomarkers. This result would be more typical of a deposit containing a large proportion of clays, where hydroxyl groups interacting with organics would be disrupted by acid, and is perhaps unexpected for Boulby samples given that any organic molecules encapsulated in the salt would have been released by the water used as part of the extraction that solubilized the majority of the sample analyzed and that clays make up a relatively small percentage of minerals present. Previous studies have found that organic matter in salt minerals was freely extractable (soluble) with water treatment (Jiamo et al., 1986).
It is also possible that the minor fraction of clays present in the samples could have influenced the preservation and therefore the extractability of lipids, as previously found with polycyclic isoprenoids (Baranger and Disnar, 1988). Previously, it was shown that the addition of hydrochloric acid to their solvent mixture during the Bligh and Dyer extraction method increases extraction efficiency by 10–50% (Jensen, 2008). This unexpected result from Boulby demonstrates that when undertaking the first molecular biosignature measurements of a complex, natural sample, it can be difficult to precisely predict the chemical nature and abundance of biomarkers of interest. Therefore, future missions that plan to make detailed observations of lipids and other biomarkers should consider including a sample processing system that is chemically adaptable to maximize chances for detecting native martian biomarkers in salts, especially in samples where low organic abundance and minerals are expected to impede detection.
5. Conclusions
The data reported in this article show that polygonal features in ancient brine environments should be a high priority for Mars exploration. They trap and preserve geological information and information on the habitability of environments in and around a briny water body. The edges of these features, in trapping clays and minerals that provide a range of bioessential elements, may also be some of the last habitats in a desiccating briny surface water body and thus potentially preserve some of the most recent information on the habitability of persistent large bodies of liquid water on Mars.
Our work also provides information on the preservation of biosignatures, and geological information about the conditions of emplacement, in evaporites of great antiquity (0.25 Ga). The order-of-magnitude differences in extraction efficiencies of lipids found with and without acid show that the extractability of an ancient biological record from evaporites is not straightforward, and could depend on deposition conditions, variations in the mineral content of entrained materials such as clays, and/or the chemical complexity of the organic compounds themselves. Therefore, future life-signature detection missions hoping to make measurements of molecular biosignatures may require the capability for flexible extraction and/or analytical methods. Moreover, for sample return missions, the effects of salt inhibition and understanding the potential biogenic yields of markers from given volumes of salt are critical for analyses on return to Earth.
Footnotes
Acknowledgments
The authors thank The Crown Estate, as mineral owner for the part of the mine beneath the seabed, for generous support of the MINAR program. Equally, they thank ICL for extensive logistical support at Boulby. They would like to thank the following people for their kind help at Boulby in carrying out this study and acquiring samples: Louise Yeoman, Emma Meehan, Barbara Suckling, Paul Scovell, and Christopher Toth.
Author Disclosure Statement
No competing financial interests exist.
Funding Information
C.S.C. acknowledges support from Science and Technology Facilities Council grant ST/R000875/1.