
Abstract
Reliable identification of biosignatures, such as amino acids, fatty acids, and peptides, on extraterrestrial ocean worlds is a key prerequisite for space missions that search for life or its emergence on these worlds. One promising approach is the use of high-performance in situ impact ionization mass spectrometers to sample water ice grains emerging from ocean-bearing moons such as Europa or Enceladus. A predecessor of such detectors, the Cosmic Dust Analyzer on board the Cassini spacecraft, has proven to be very successful in analyzing inorganic and organic ocean constituents and with that characterizing the habitability of Enceladus ocean. However, biosignatures have not been definitively identified in extraterrestrial ocean environments so far. Here, we investigate with an analog experiment the spectral appearance of amino acids, fatty acids, and peptides in water ice grains, together with their detection limits, as applicable to spaceborne mass spectrometers. We employ a laboratory-based laser induced liquid beam ion desorption technique, proven to simulate accurately the impact ionization mass spectra of water ice grains over a wide range of impact speeds. The investigated organics produce characteristic mass spectra, with molecular peaks as well as clearly identifiable, distinctive fragments. We find the detection limits of these key biosignatures to be at the μM or nM level, depending on the molecular species and instrument polarity, and infer that impact ionization mass spectrometers are most sensitive to the molecular peaks of these biosignatures at encounter velocities of 4–6 km/s.
1. Introduction
One of the most compelling questions in planetary science is whether life might originate or be sustained on a world other than the Earth. In our own solar system, we may have the opportunity to test this hypothesis by exploring Mars or extraterrestrial ocean worlds such as Enceladus and Europa (Lunine, 2017; Hendrix et al., 2018). These moons of Saturn and Jupiter, respectively, host global, subsurface, liquid water oceans (Khurana et al., 1998; Thomas et al., 2016) with conditions possibly suitable for life or its emergence (Hand et al., 2006; Glein et al., 2018; McKay et al., 2018). The Cassini mission identified and sampled a plume of gas and water ice grains at Enceladus' South Pole via multiple flybys, confirming that the plume material was sourced from the interior ocean (Postberg et al., 2008; Postberg et al., 2009; Waite et al., 2009; Hsu et al., 2015). A similar plume may also be present at Europa (Roth et al., 2014; Sparks et al., 2016; Sparks et al., 2017; Jia et al., 2018). Sampling the icy grains of these plumes may, therefore, be a straightforward and cost-effective means of assessing the composition of the extraterrestrial ocean beneath.
Impact ionization mass spectrometers, such as the Cosmic Dust Analyzer (CDA) (Srama et al., 2004) on the Cassini spacecraft or the Surface Dust Analyzer (SUDA) (Kempf et al., 2014) on board Europa Clipper, can measure the composition of plume ice grains by analyzing the mass spectra of ions generated by high-velocity (>1 km/s) impacts of these grains onto an impact target. The Cassini spacecraft revealed that ∼25% of the ice grains emerging from Enceladus contain detectable organic material (Postberg et al., 2011b, 2018a). Many of these exhibit signs of volatile aliphatic nitrogen- and oxygen-bearing, and aromatic compounds (Khawaja et al., 2019), and 1–4% of the organic-rich ice grains even contain complex organic macromolecules at high (≥0.5 wt %) concentrations (Postberg et al., 2018b). However, it is still unclear whether these organic materials contain biosignatures. This might be difficult to achieve with the limited mass resolution (20–50 m/Δm) and range (usually up to m/z 200) of Cassini's CDA (Srama et al., 2004) but will certainly be possible for SUDA (150–200 m/Δm up to m/z 500) at Europa (Kempf et al., 2014) and mass spectrometers on future Enceladus missions, such as the Enceladus Ice Analyzer (ENIA; ∼2000 m/Δm, up to m/z 2000) (Srama et al., 2015; Reh et al., 2016).
Two classes of organic molecules that have been suggested to be potential biosignatures in extraterrestrial ocean environments are amino acids and fatty acids. Amino acids are found in meteorites (Cronin and Pizzarello, 1983) and can be generated abiotically, such as via Friedel-Crafts reactions during water
Fatty acids can also serve as biosignatures. These molecules are found in the lipid membranes of all known life-forms, and they exhibit something known as the “Lego principle”—biological processes use a selected set of molecules (McKay, 2004). For most organisms, fatty acids are generated biochemically by the addition of two carbon atoms at a time, leading to an excess of fatty acids with an even number of carbon atoms; for Archaea, the addition is via a five-carbon isoprene subunit, leading to a carbon chain pattern divisible by five (Georgiou and Deamer, 2014). In abiotic (Fischer-Tropsch) synthesis, carbons are added one at a time, so no such pattern is observed. Assessment of the fatty acid distribution can, therefore, serve as a discriminator for biosignatures in an extraterrestrial ocean environment (Dorn et al., 2011; Reh et al., 2016; Sherwood, 2016).
The ability to detect and quantify amino acids, peptides, and fatty acids is important to determine the presence of life in an extraterrestrial ocean. In this work, we investigate and, in turn, simulate what the characteristic signals of these biosignatures would be in a spaceborne mass spectrometer if these substances were embedded in ice grains, and we infer the detection limits for these compounds for CDA-, SUDA-, or ENIA-like instruments sampling an Enceladus or Europa plume at hypervelocity.
2. Methods
2.1. Scientific approach
Impact ionization records time-of-flight (TOF) mass spectra of ions generated by high-velocity (≥1 km/s) impacts of individual grains onto a metal target (Postberg et al., 2011a; Srama et al., 2004; Kempf et al., 2014; Reh et al., 2016). The majority of TOF impact ionization mass spectrometers that have so far measured cosmic dust in situ, such as CDA on board Cassini (Srama et al., 2004) or the Dust Impact Mass Analyzer instruments (PUMA 1 and 2) on board the Vega missions (Kissel et al., 1986), are sensitive only to cations. The Cometary and Interstellar Dust Analyzer (CIDA) on Stardust was a notable exception (e.g., Brownlee et al., 2003), capable of producing anion mass spectra, and proposed impact ionization mass spectrometers, such as the SUDA (Kempf et al., 2014) or the ENIA (Mitri et al., 2018; Reh et al., 2016), will also have this capability.
At relevant impact speeds, the impact ionization process almost exclusively creates singly charged ions, and therefore the spectral peak positions (ion arrival times) are only dependent on the masses of the atoms and molecules. Previous work has shown spectral variations introduced by varying ionization conditions due to different impact velocities of ice grains can be precisely reproduced with a laser-based analog experiment (Klenner et al., 2019), as can the effects of varying grain compositions. By comparing laboratory spectra with those recorded in space (Postberg et al., 2009, 2011b, 2018b; Khawaja et al., 2019), the compositions of the ice grains can be investigated in detail, because the compounds and concentrations measured in a water matrix with the analog experiment are well known. In this work, we use the laser-based analog experiment to investigate the mass spectral appearance of various amino acids, fatty acids, and peptides dissolved in H2O to infer characteristic mass peaks, cleavages of the parent molecules, and resulting peak patterns. These laboratory data are archived in the form of an internal database (spectral reference library) and can be compared with results from previous and future space missions.
2.2. Experimental description
The experimental setup utilized in Heidelberg and Leipzig for this work presented here (Fig. 1) is described in detail in the work of Klenner et al. (2019), and, as such, we only provide a brief overview here.
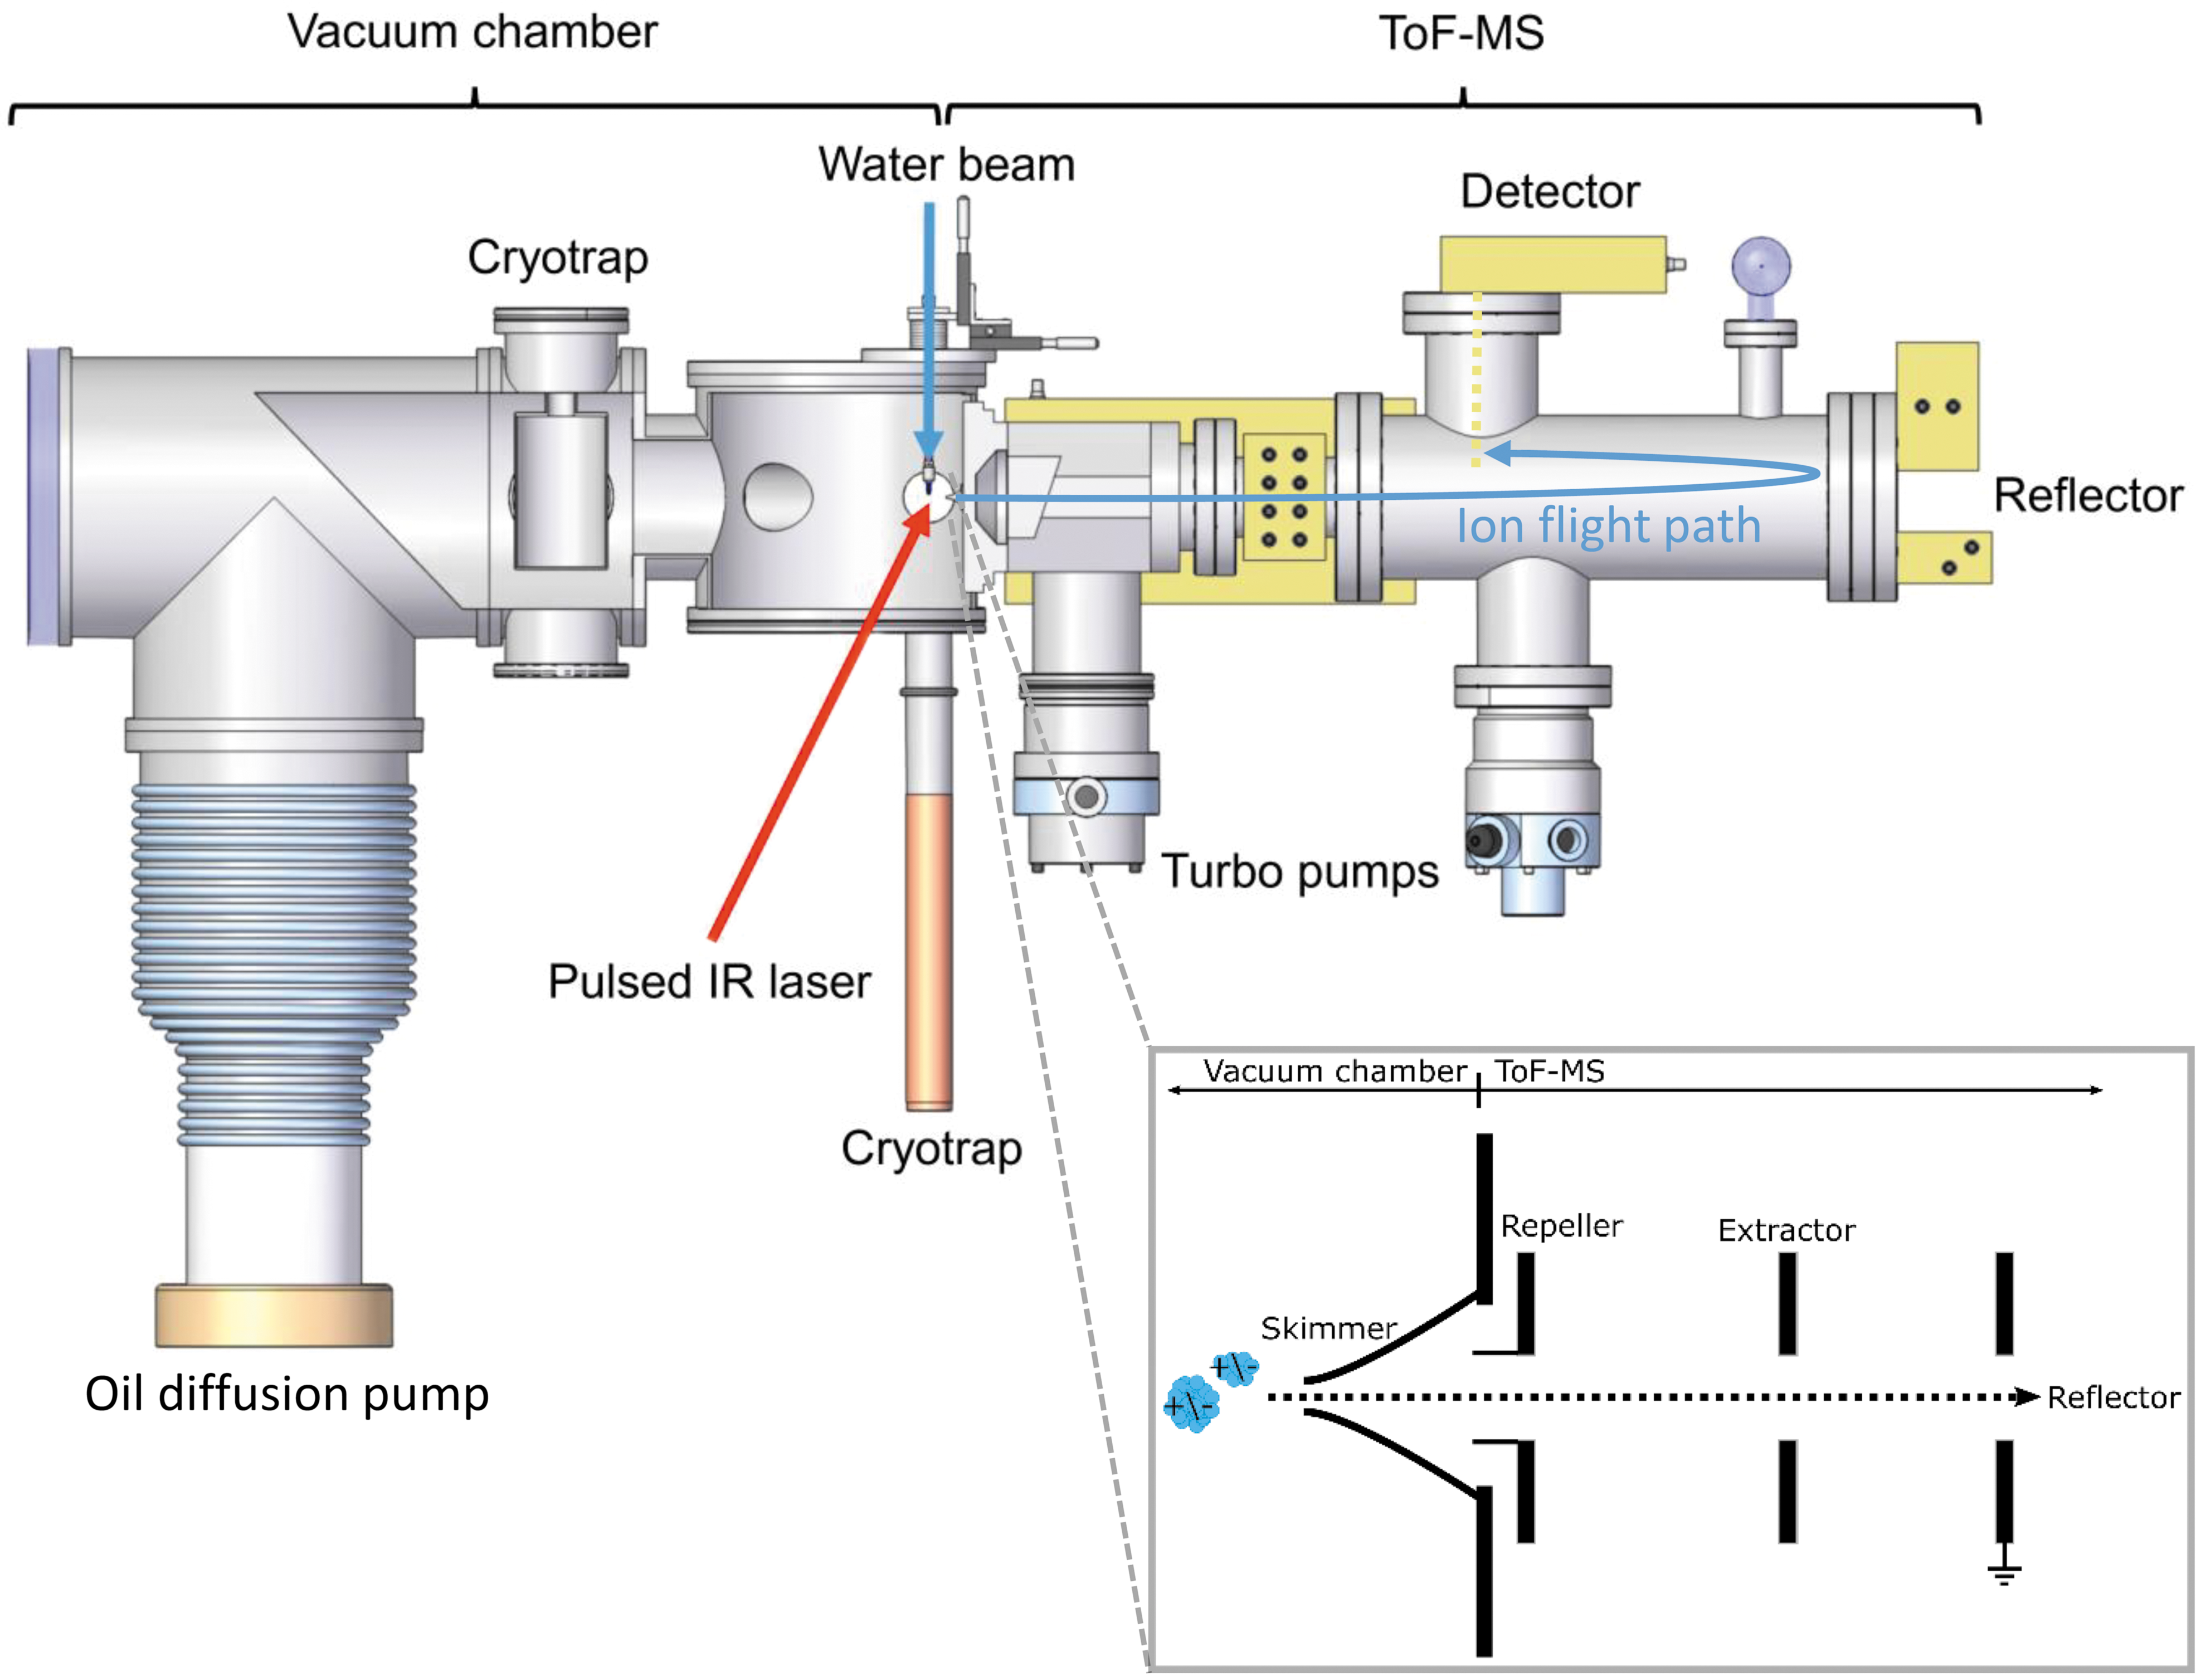
Experimental LILBID-TOF-MS setup for simulating hypervelocity impacts of ice grains onto impact ionization mass spectrometers in space (taken from Klenner et al., 2019; adapted from Postberg et al., 2018b). A water beam is intersected by a pulsed IR laser. The created cations and anions can be detected in a commercial TOF-MS. The inset illustrates the instrument configuration underlying the principle of delayed extraction (Klenner et al., 2019). LILBID, laser induced liquid beam ion desorption; MS, Mass spectrometer; TOF, time-of-flight.
The setup applies a technique known as laser induced liquid beam ion desorption (LILBID; Karas et al., 1988, 1991). The impact ionization process of ice grains is simulated by intersecting a μm-sized water beam with a pulsed infrared (IR) laser (2840 nm, 20 Hz, 7 ns pulse length), which operates at adjustable laser intensities (0–100%). When the water beam absorbs the laser energy, it is heated up and explosively disperses into atomic, molecular, and macroscopic fragments. Cations and anions can then be analyzed in a reflectron TOF-MS with a mass resolution of about 800 m/Δm and a mass range m/z > 10,000, after passing through a field-free drift region. The mass spectrometer uses the principle of delayed extraction (Klenner et al., 2019), in which setting a delay time before ion extraction allows the selection of ions as a function of their initial velocities, forming a gating system. The signals are detected (Photonis Chevron MCP-Set), amplified (Preamp 100, Kaesdorf), digitized (12 bit, Acqiris), and recorded with a LabVIEW controlled computer. Each mass spectrum presented here is the average of at least 500 individual spectra. To ensure reproducible spectra, the experimental setup is calibrated by using a solution of 10−6 M NaCl before every measurement at three different delay times and laser intensities.
2.3. Biosignature solutions
The tested compounds were prepared in aqueous solutions. Nine amino acids (Gly, alanine [Ala], Ser, threonine [Thr], Asp, lysine [Lys], glutamic acid [Glu], histidine [His], Arg, 50 ppmw each) were dissolved together to investigate the overall spectral appearance of a complex amino acid mixture. Aqueous solutions of Asp, Glu, Lys, tyrosine (Tyr), ornithine (Orn), and citrulline (Cit) were also measured individually (Fig. 2 top and Supplementary Figs. S1–S4). These amino acids were selected, because they have side chains covering a wide range of properties (proteinogenic/nonproteinogenic, uncharged/charged, polar/nonpolar, hydrophilic/hydrophobic). All amino acids were measured in the cation mode of the mass spectrometer. Gly, Ser, His, Orn, Asp, Glu, Cit, and Tyr were additionally measured in the anion mode.
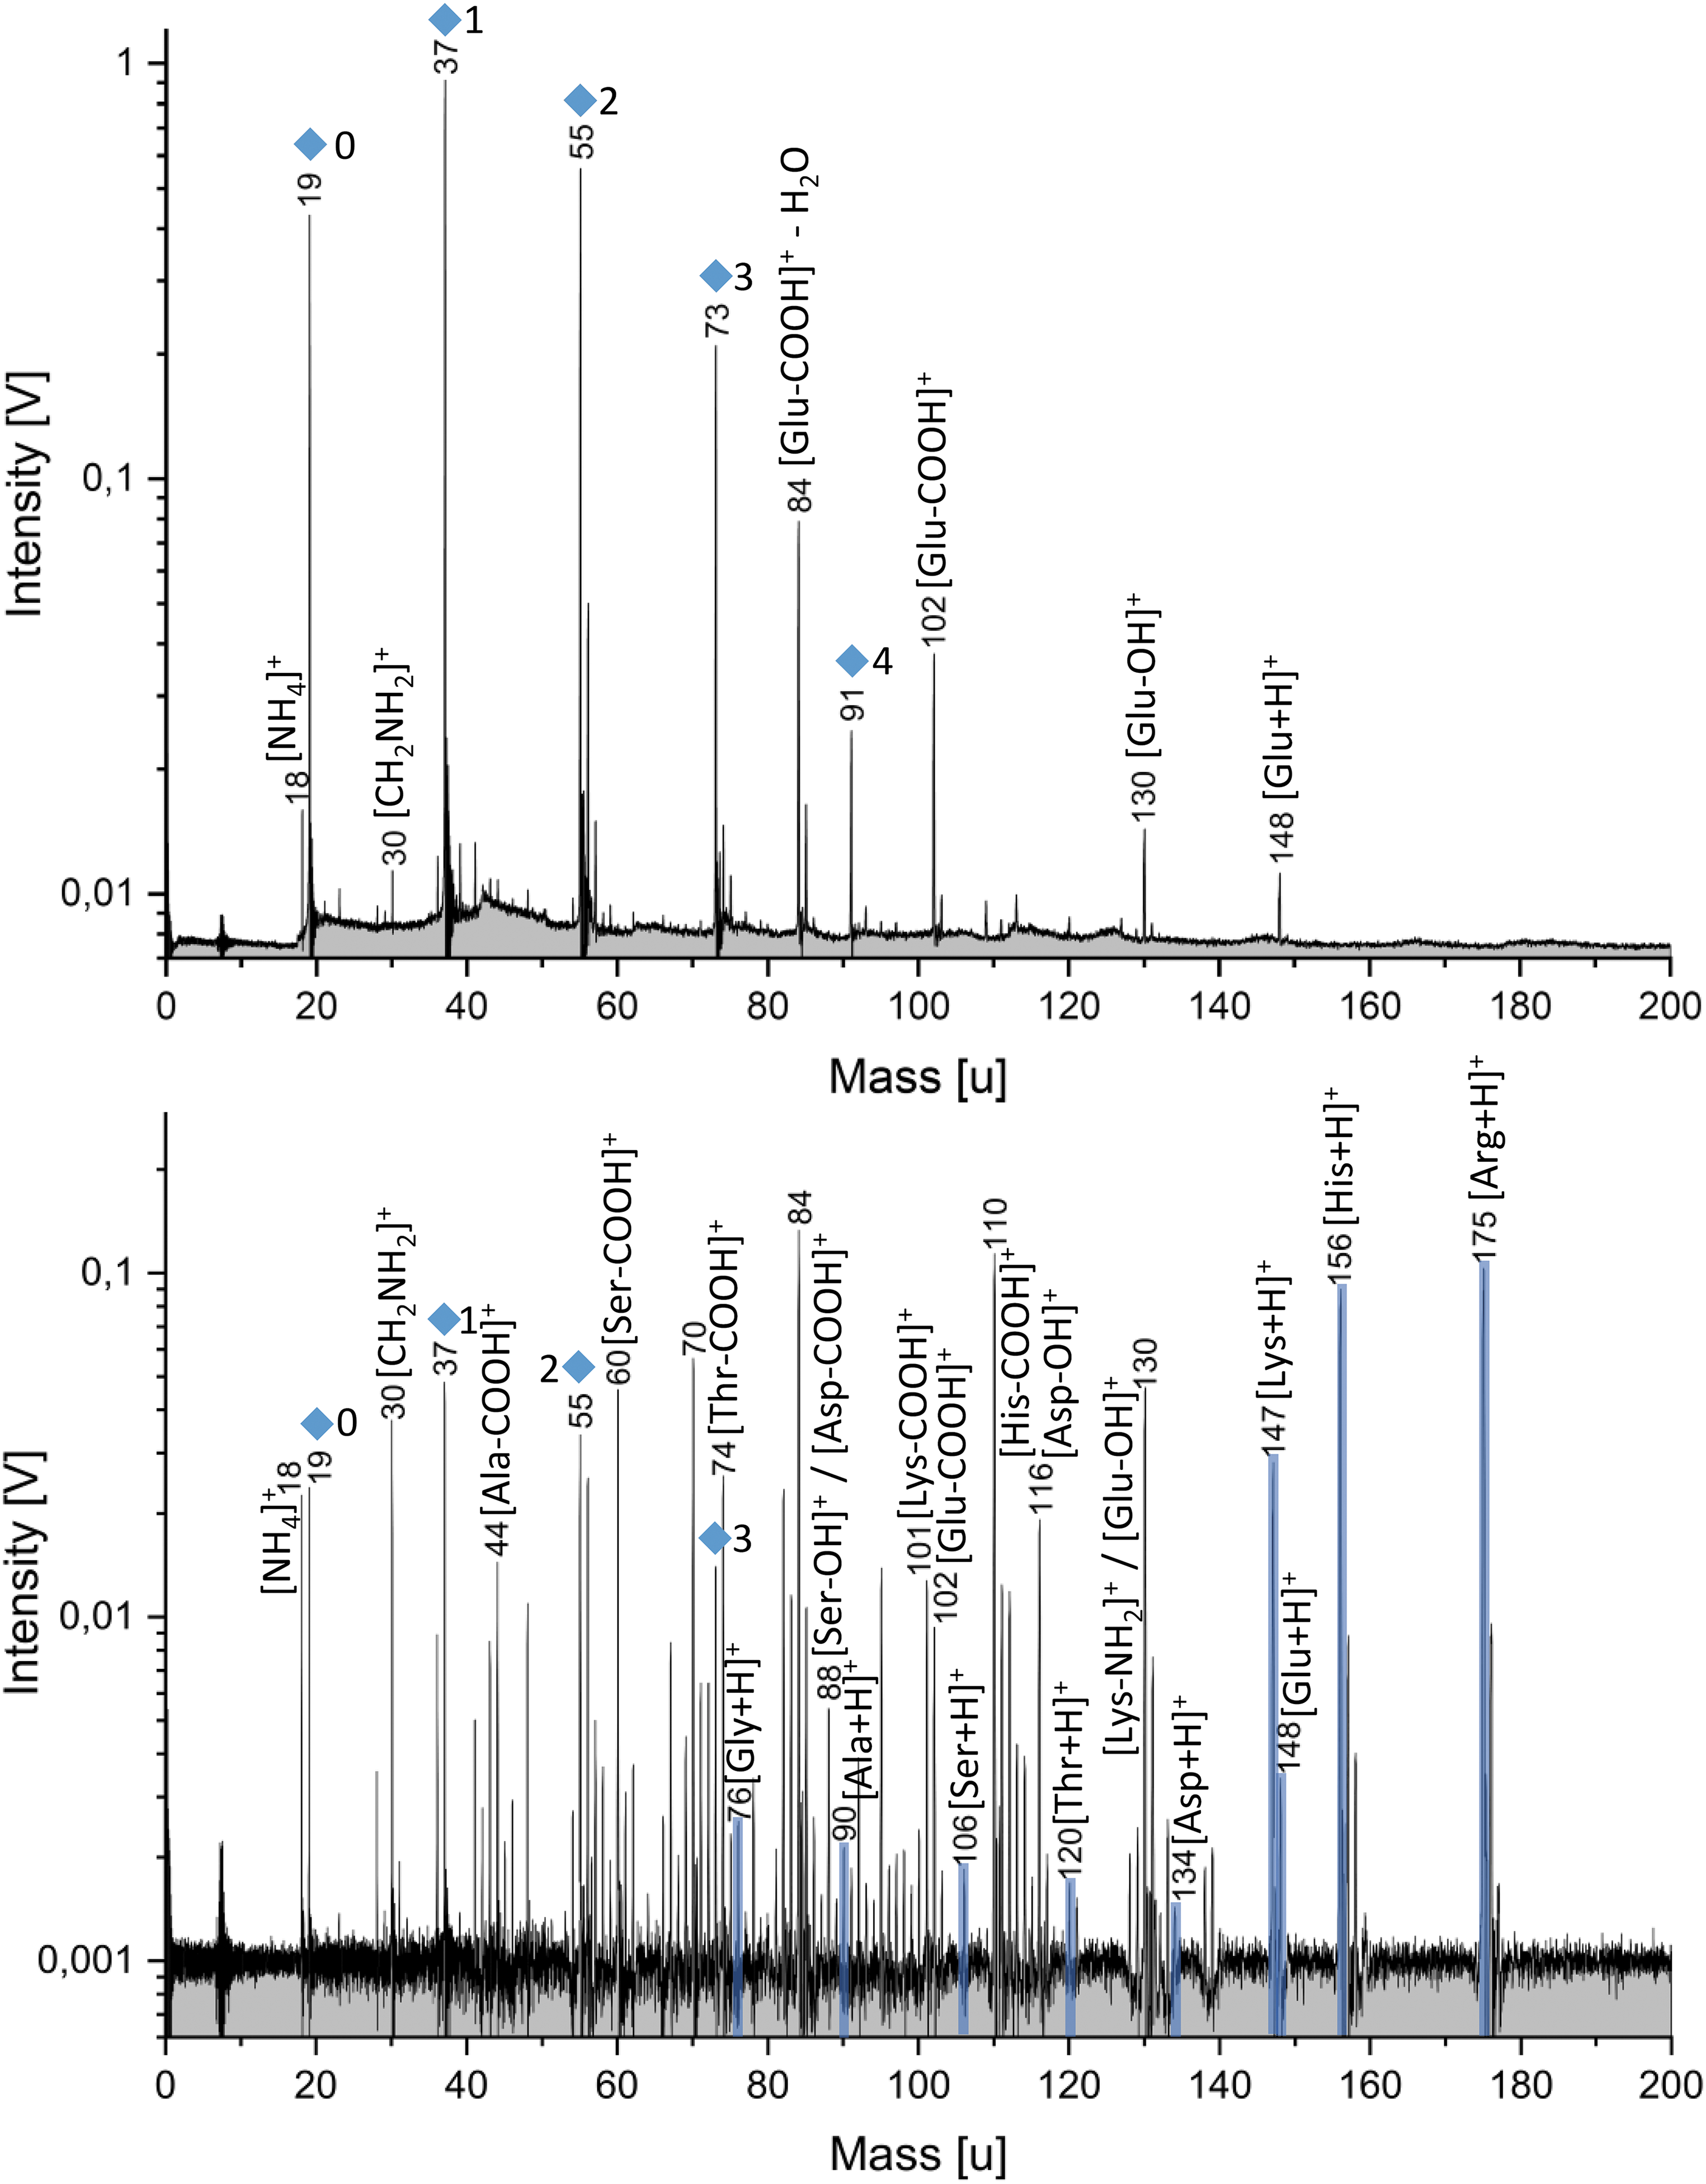
Top: Laboratory mass spectrum (y-axis in logarithmic scale) of 50 ppmw Glu in positive detection mode. Glu fragments due to the loss of OH and COOH are observed. Glu-COOH additionally loses H2O (observed at m/z 84). Bottom: Laboratory mass spectrum (y-axis in logarithmic scale; baseline corrected) of nine amino acids (50 ppmw each) in the positive detection mode. Molar concentrations can be found in Supplementary Table S1. The protonated molecular peaks are highlighted in blue. Peaks, with varying intensities, corresponding to each amino acid can be detected. All amino acids produce [NH4]+ (18 u) and [CH2NH2]+ (30 u) (see also Supplementary Figs. S1–S4). The peak at m/z 84 derives from both Glu-COOH-H2O and Lys-COOH-NH3. The peak at m/z 70 represents [Asp-COOH]+ − H2O as well as different fragments from Ser and Arg (see Supplementary Fig. S5). Mass peaks from the water matrix of the form [(H2O)nH3O]+ are marked by blue diamonds. The corresponding n is labeled beside the peaks. Ala, alanine; Arg, arginine; Asp, aspartic acid; Glu, glutamic acid; Gly, glycine; His, histidine; Lys, lysine; Ser, serine; Thr, threonine.
A mixture of fatty acids was prepared in a water
The following five peptides were investigated in aqueous solutions: Glycine-aspartic acid (Gly-Asp), glycine-glutamic acid (Gly-Glu), histidine-serine (His-Ser), glycine-proline-glutamic acid (Gly-Pro-Glu) all at concentrations of 2000 ppmw, and arginine-glycine-aspartic acid-serine (Arg-Gly-Asp-Ser) at a concentration of 1000 ppmw. The peptides were measured by using both polarity modes of the mass spectrometer.
In the second phase of the experimental campaign, we sequentially lowered the solution concentrations to infer detection limits for a selection of these biosignatures. A characteristic mass peak just exceeding a 3σ signal to noise level was defined as the detection limit.
All substances (p. a.) were purchased from Sigma Aldrich, except the fatty acids' sodium salts, which were purchased from Nu-Check Prep (Elysian, MN). The solutions were freshly prepared with doubly distilled and deionized H2O in 50-mL sample cups. Performing one effective measurement requires a sample volume of ∼0.5 mL. To quantify any contamination from the setup, spectra of pure deionized H2O were recorded before every measurement.
3. Results
Each of the biosignature groups—amino acids, fatty acids, and peptides—was separately measured in a water or water
3.1. Amino acids
Figure 2 shows a cation mass spectrum of one individual amino acid (Glu) at a concentration of 50 ppmw (top) and a cation mass spectrum of nine different amino acids at the same concentration of 50 ppmw (bottom). For further spectra of individual amino acids see Supplementary Figs. S1–S4. Molecular peaks of all amino acids can be clearly resolved without interferences with the water matrix. Amino acids form protonated and deprotonated molecular peaks [M+H]+/[M-H]− in water matrix mass spectra. Most amino acids favor the protonation over deprotonation (Fig. 2). The sensitivity of the method varies; some amino acids show higher peak amplitudes than others for a given concentration. Despite the fact that the molar concentrations in a 50 ppmw solution are higher for low-mass amino acids compared with those with higher masses (Supplementary Table S1), molecular peaks of high mass amino acids generally show higher amplitudes than the low-mass amino acids used here. All amino acids produce [NH4]+ (18 u) and [CH2NH2]+ (30 u) cations (Fig. 2 and Supplementary Figs. S1–S4). Further, fragments due to the loss of COOH are observed for all amino acids. Amino acids containing a carboxyl group and an additional hydroxyl group produce fragments of the form AA-COOH-H2O. Most amino acids also produce fragments due to the loss of OH.
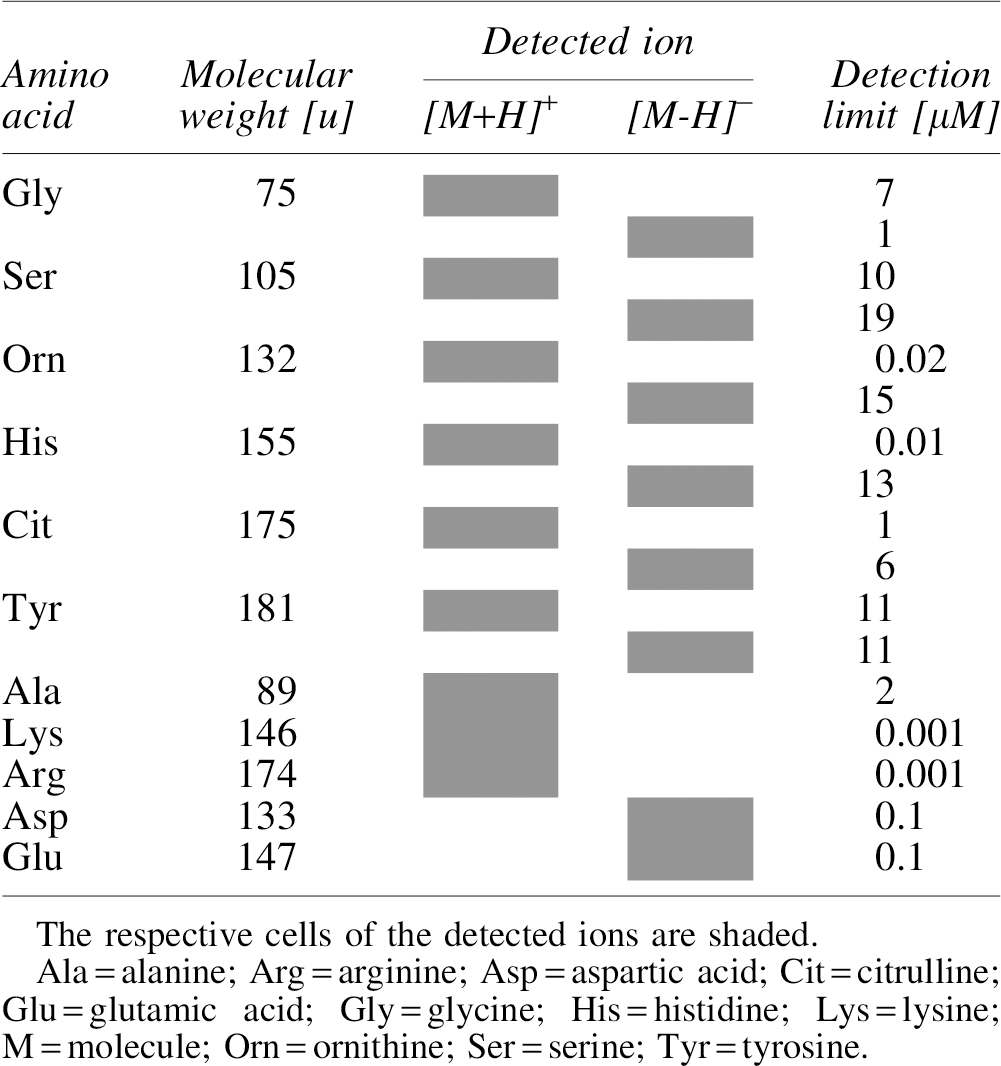
Table 1 shows the detection limits of the investigated amino acids. The method is very sensitive to, for example, Arg and Lys whereas it is less sensitive to Tyr and Ser. Cations of the protonated form of most amino acid molecules are detectable at lower concentrations, with the exception of Gly, Aps, and Glu where the detection limit for the deprotonated anion is lower. Sensitivity to different amino acids also varies with experimental parameters (delay time and laser energy) and, therefore, is expected to vary with the impact speeds of ice grains onto mass spectrometers in space (Klenner et al., 2019; see Discussion section).
Detection Limits of Amino Acids in Water
3.2. Fatty acids
Fatty acids were measured in a water-acetonitrile (50:50 vol) matrix because of their poor solubilities in water. Acetonitrile is unreactive with water and produces no peaks at masses above 70 u that interfere with the fatty acid analytes. The anion mode of the mass spectrometer was utilized, because fatty acids strongly favor forming deprotonated molecular anions [M-H]− over protonated molecular cations [M+H]+ (Fig. 3). We measured one mixture with each fatty acid at a concentration of 5.5 × 10⁻⁶ M. In contrast to the amino acids, there is no sensitivity variation: The deprotonated molecular peaks show very similar amplitudes, reflecting the identical fatty acid concentrations (Fig. 3).
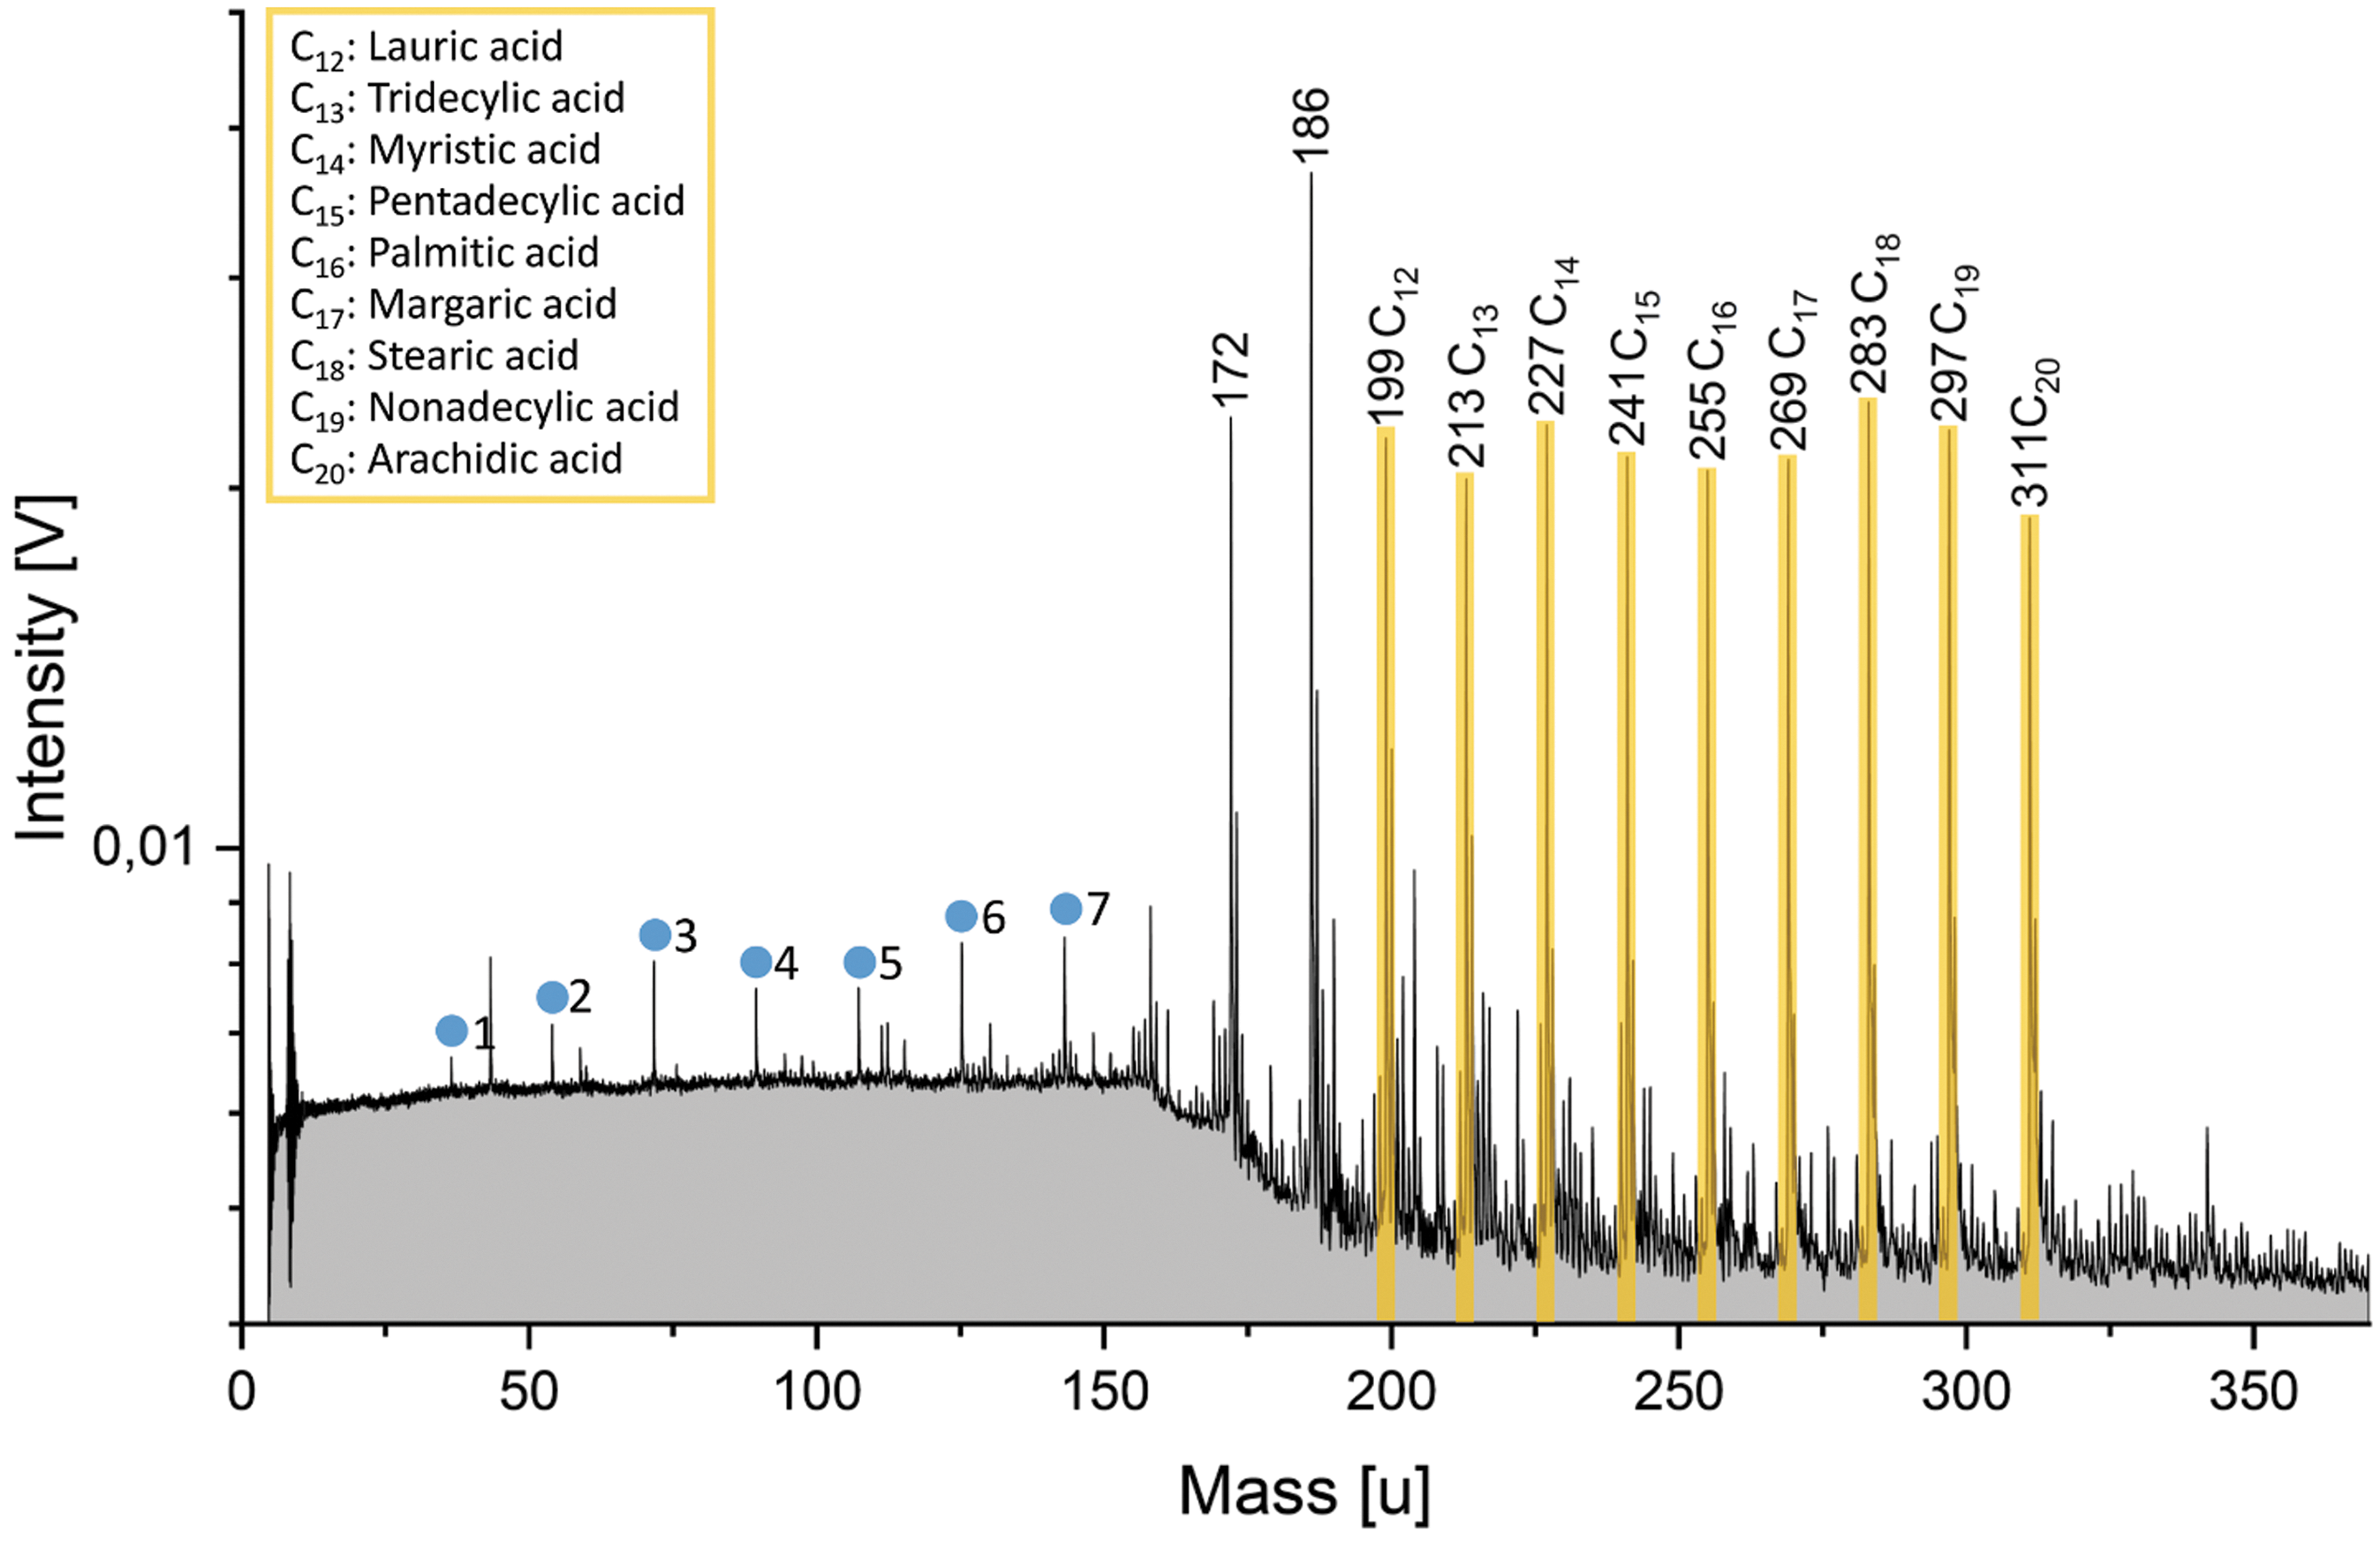
Anion mass spectrum (y-axis in logarithmic scale) of fatty acids in a water-acetonitrile (50:50 vol) matrix. Deprotonated molecular peak intensities (highlighted in yellow) are approximately equal, consistent with the equal fatty acid concentrations of 5.5 × 10⁻⁶ M. Concentrations in ppmw can be found in Supplementary Table S2. Mass peaks from the water matrix of the form [(H2O)nOH]− are marked by blue circles. The corresponding n is labeled beside the peaks. Peaks at m/z 172 and m/z 186 are observed; see text for further explanation.
There are conspicuous peaks at m/z 172 and 186. The exact origin of these two peaks is currently unclear. They are observed in the anion mass spectra of individual fatty acids (e.g., hexadecanoic acid as shown in Supplementary Fig. S6), with the m/z 186 peak typically larger than m/z 172 in the individual fatty acid mass spectra. As these individual mass spectra were obtained from acetonitrile-free solutions, the two peaks do not derive from acetonitrile; instead, they are associated with the fatty acid sodium salts. The two peaks could potentially arise from fragments due to a CnH2n cleavage from the fatty acids in combination with electron-capture ionization. In this process, a neutral molecule attaches to an electron to form a singly negative charged ion with the same integer mass as the neutral molecule (Hunt and Crow, 1978). To give an example, a CH2 cleavage from dodecanoic acid (C12) with a molecular weight of 200 u and subsequent electron capture ionization leads to a fragment with m/z 186, the mass of undecanoic acid (C11). However, this explanation is unsatisfactory, given the absence of further fragmentation, the requirement of electron capture ionization, and the—in the case of dodecanoic acid at least—unusual fragmentation pathway, in which loss of a methyl group is followed by protonation, before electron capture. The two peaks at m/z 172 and m/z 186 may therefore instead either derive from undefined sodium- or sodium-water-complexed species arising from the used sodium salts or, even more likely, they could come from unknown contamination of the supplied fatty acid sodium salts.
Although detection limits have not yet been determined for each specific fatty acid, 0.02 μM (≈5 ppbw) of each fatty acid can be easily detected (i.e., the intensities well exceed a 3σ signal to noise level).
3.3. Peptides
Spectra of peptides in a water matrix show protonated and deprotonated molecular peaks, [M+H]+/[M-H]−. As with the single amino acids (see Results: Amino acids), peptides favor the protonated form. Peptide spectra also show fragment peaks characteristic of their amino acid residues. Example cleavages are shown in Figs. 4 and 5 for the tetrapeptide Arg-Gly-Asp-Ser and occur for all peptides discussed here. For other peptides see Supplementary Figs. S7–S10.

Cation mass spectrum (y-axis in logarithmic scale) of 23 × 10−4 M (1000 ppmw) Arg-Gly-Asp-Ser (top) and the respective structural formula of the peptide (bottom). Important cleavages (arrows) are shown with different colors, and the resulting cation fragments are indicated in the mass spectrum. A prominent peak at m/z 70 is observed, as with the amino acid spectrum shown in Figure 2 (lower panel). Mass peaks, from the water matrix, of the form [(H2O)nH3O]+. are marked by blue diamonds. Peaks are labeled with the corresponding n. Common proteomics peptide sequencing nomenclature (as explained in e.g., Steen and Mann, 2004) is given in brackets, if applicable.
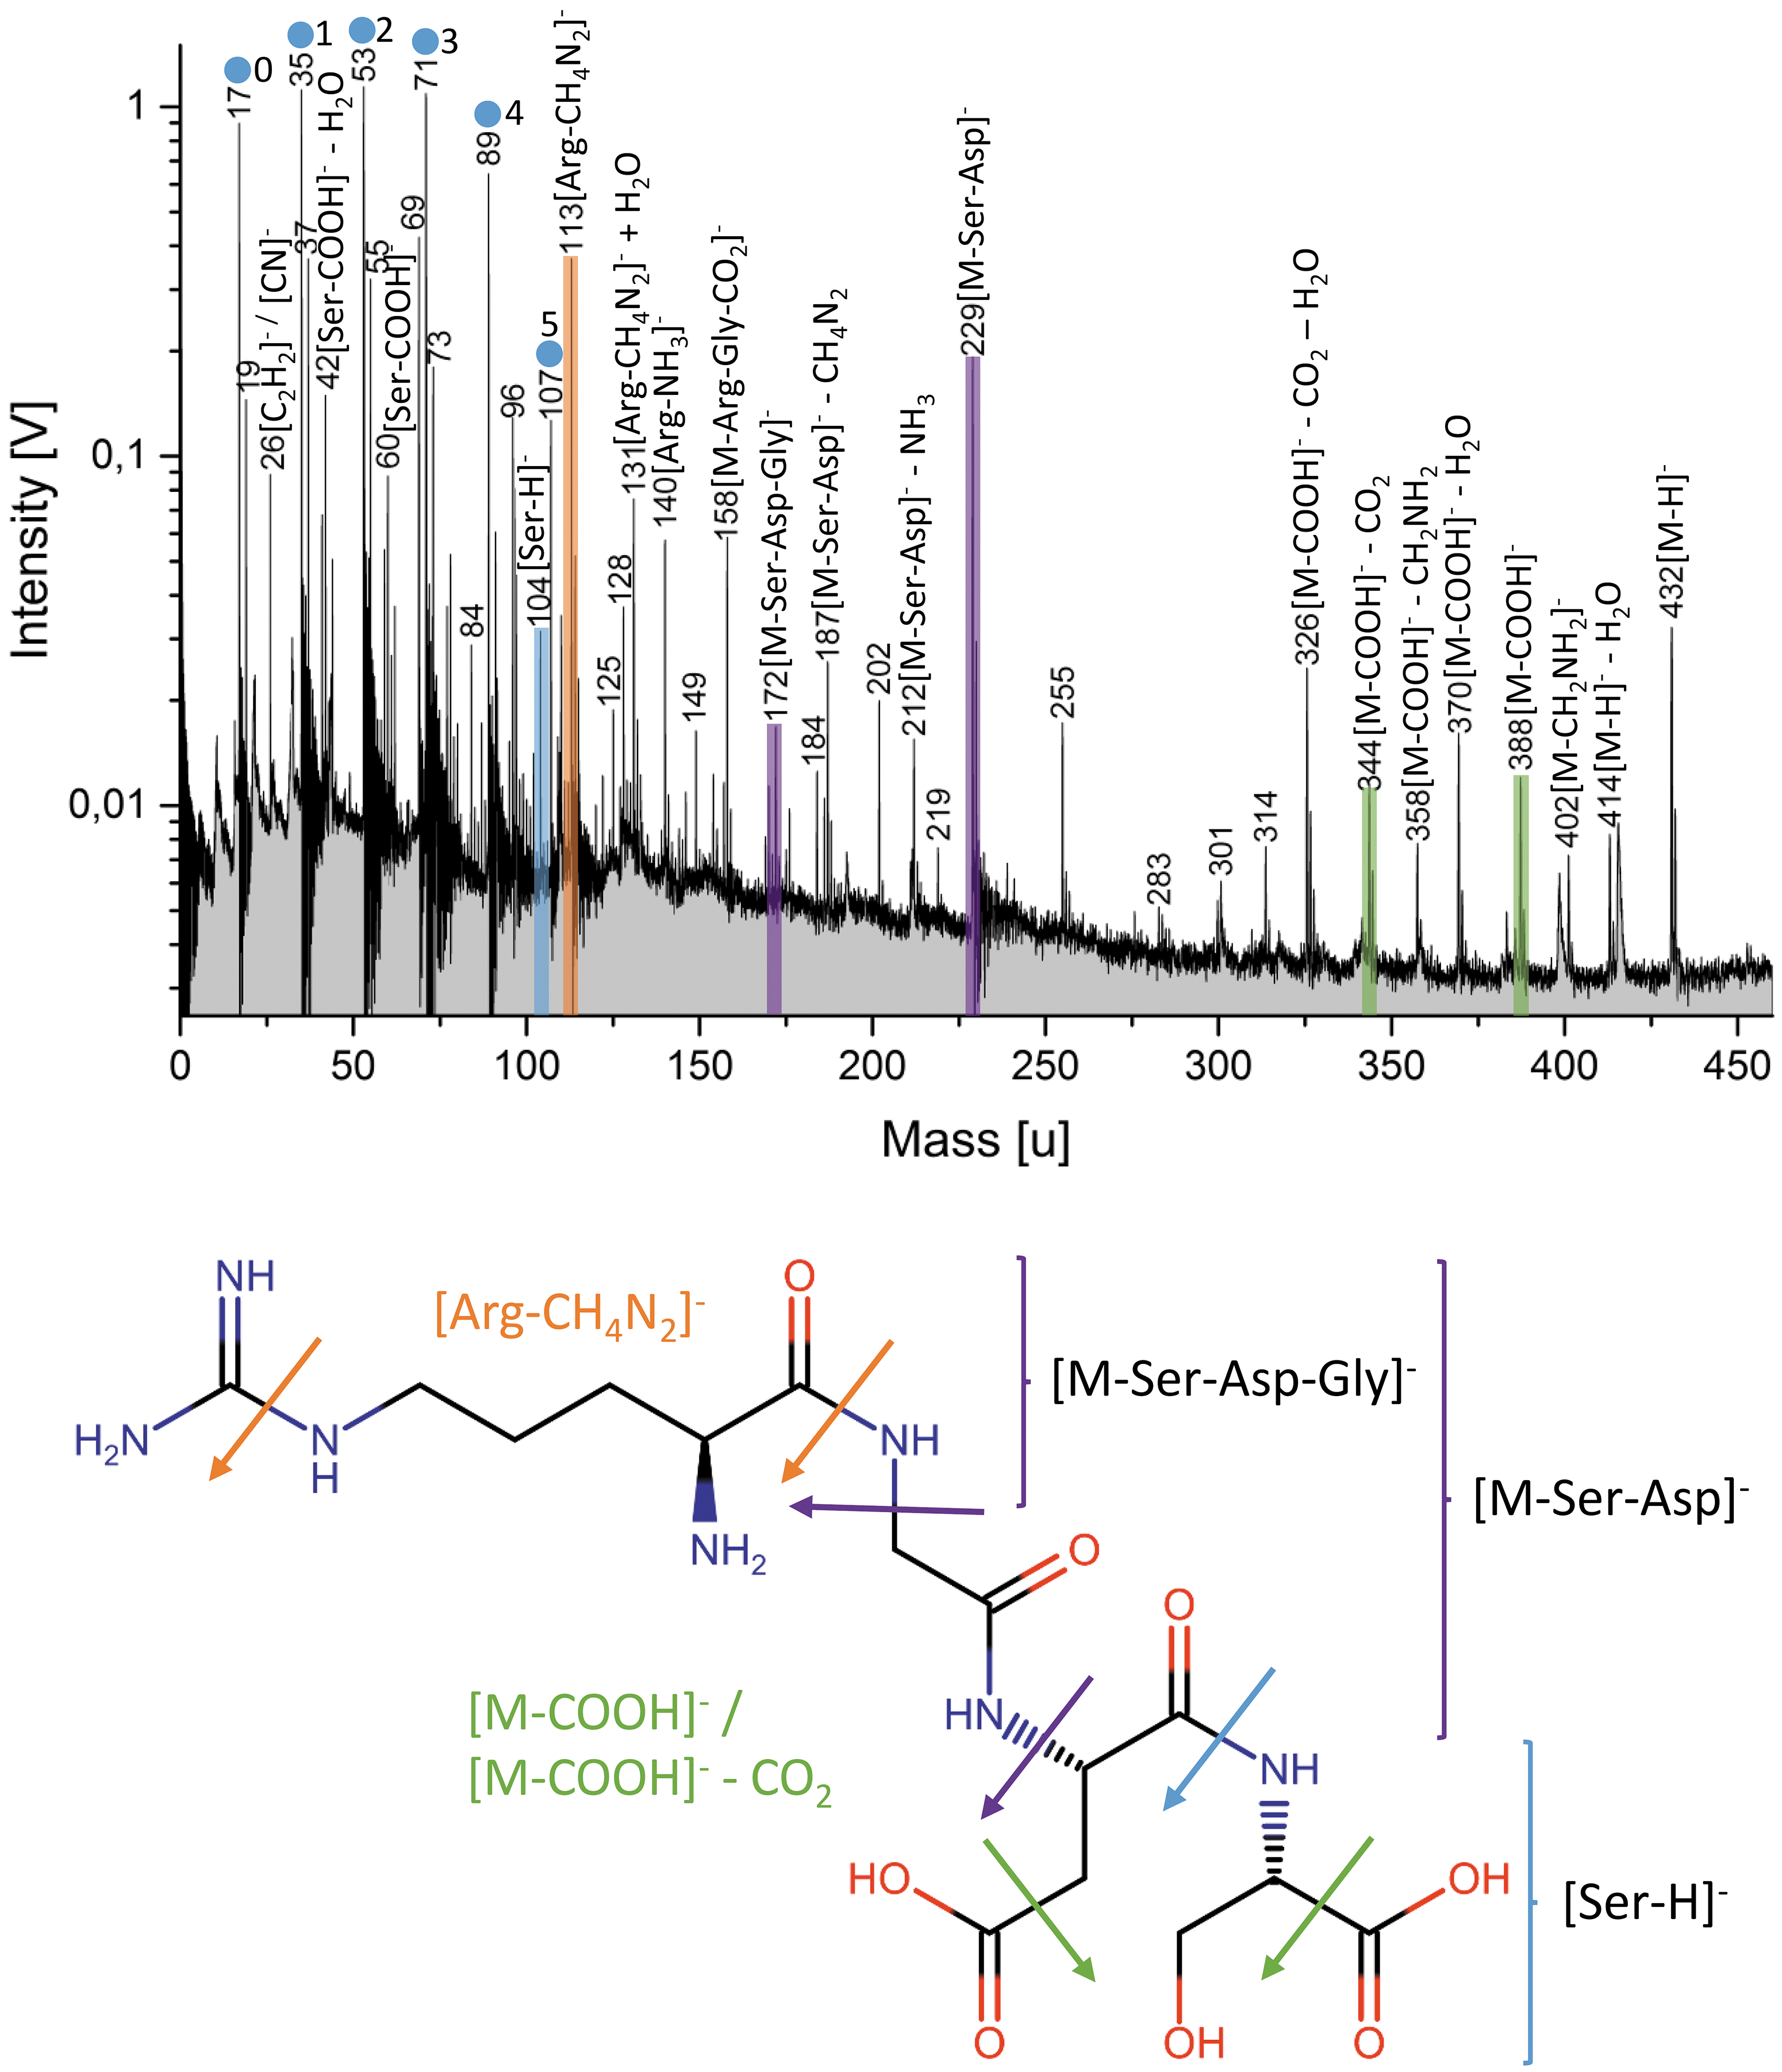
Anion mass spectrum (y-axis in logarithmic scale) of 23 × 10−4 M (1000 ppmw) Arg-Gly-Asp-Ser (top) and the respective structural formula of the peptide (bottom). Important cleavages (arrows) are shown with different colors, and the resulting anion fragments are indicated in the mass spectrum. Mass peaks from the water matrix of the form [(H2O)nOH]− are marked by blue circles, with corresponding n shown by each peak.
Cleavage within the peptide usually occurs at specific bonds (Figs. 4 and 5). Similar to the single amino acids, [NH4]+ (18 u) and [CH2NH2]+ (30 u) are always present. The cationic fragment [M-NH2]+, and anionic fragments of the form [M-(COOH)n]−, produced by cleavage of the carboxyl groups, are also observed. The residual mass can additionally lose water to form [M-(COOH)n-(H2O)]−.
The terminal amino acids of all peptides can be identified. Similarly, cleavages of carbonyl groups next to the peptide bonds are observed for all peptides. From this cleavage, one of the terminal amino acids of the respective peptide regularly shows up as [AAterm1-COOH]+ in cation spectra (Fig. 4). For example, [Arg–COOH]+ is observed in the spectrum of Arg-Gly-Asp-Ser. A cleavage of the terminal peptide bond on the opposite side of the peptide occurs in such a way that the respective terminal amino acid is detected as [AAterm2+H]+ and [AAterm2-H]−, in cation and anion mode, respectively (Figs. 4 and 5). For example, [Ser+H]+ and [Ser-H]− are present in the spectra of Arg-Gly-Asp-Ser. The remaining peptide fragment can be observed as [M-AAterm2]+ in the cation spectrum (Fig. 4).
Table 2 shows the detection limits of Arg-Gly-Asp-Ser and its various fragments. Cationic fragments are generally detectable at 10–20x lower concentrations than anionic fragments.
Detection Limits of the Peptide Arg-Gly-Asp-Ser and Its Fragments
Arg = arginine; Asp = aspartic acid; Gly = glycine; MS = mass spectrometer; Ser = serine.
4. Discussion
The amplitudes of molecular peaks from different amino acids at a given concentration can vary by more than an order of magnitude (Fig. 2). This is because the structures of individual amino acids vary in their side chains as well as in their chain lengths. The different side chains lead to different amplitudes, because the side chains possess a wide range of properties, with the logarithmic acid dissociation constant pKa being the most important (e.g., Wu et al., 1992). The lowest detection limits (0.001 μM) are inferred for the amino acids with basic side chains (Lys and Arg), that is, relatively high pKa values, because these molecules easily and efficiently form ions detectable by a mass spectrometer. In contrast, the molecular peaks of individual fatty acids at a given concentration are equally high (Fig. 3), because the structures of the used fatty acids (C12–C20) vary only in their chain lengths and the fatty acids have very similar pKa values. We conclude that the detection method is equally sensitive to these fatty acids, which are important for life (Georgiou and Deamer, 2014). The fatty acid abundance patterns reflect biosignatures without bias. This is why the dominant presence of even carbon number fatty acids is an even better biosignature than it was considered so far.
All amino acids show strong peaks at m/z 18 ([NH4]+) and m/z 30 ([CH2NH2]+). Interestingly, about 3% of the organic-bearing ice grains emitted by Enceladus' plumes and recorded by CDA show a similarly abundant signature of [NH4]+, together with an unspecified organic peak between m/z 26 and m/z 31 (Khawaja et al., 2019). Khawaja et al. (2019) concluded these to be from aliphatic nitrogen-bearing compounds at the mmol level (possibly amines, amides, or nitriles). Our results show that cation fragments from amino acids are also in agreement with these detected signatures.
In most cases, cationic (protonated) molecular peaks of amino acids and peptides as well as their cationic fragments can be detected at much lower concentrations than their anionic (deprotonated) molecular peaks and anionic fragments (Tables 1, and 2). This is because ion protonation of these organics is more likely than ion deprotonation. In contrast, fatty acid molecular and fragment peaks are more abundant in the anionic form than in the cationic form. This is why it is crucial to detect both cations and anions with future impact ionization instruments, such as the SUDA (Kempf et al., 2014) or the ENIA (Mitri et al., 2018; Reh et al., 2016), visiting ocean worlds.
According to a model by Steel et al. (2017), concentrations of individual amino acids in the Enceladus ocean could be up to 25 μM in an exclusively abiotic scenario. The total abiotic amino acid concentration would be 104 μM in a steady-state ocean and up to 90 μM are expected in a biotic scenario based on methanogens. Similarly, cell (individual cell mass: 2 × 10⁻¹⁴ g) concentrations of ∼8.5 × 10⁷ cells/cm3 in the plume would be expected due to biotic production (Steel et al., 2017). The predicted amino acid concentrations are above the inferred detection limits in this work. Given the ability to accurately reproduce impact ionization mass spectra of water ice grains at different impact speeds from space with our LILBID experiment (Klenner et al., 2019) and the previously derived NaCl salt concentration in the Enceladus ocean by using the LILBID setup (Postberg et al., 2009), we believe that the concentration behavior comparison of the organics is applicable.
A numerical model by Guzman et al. (2018) predicts concentrations of individual amino acids in the Enceladus plume during mean levels of plume activity to be between 30 and 1000 μM in an abiotic scenario and ∼2 μM in a biotic scenario. According to our inferred amino acid detection limits and taking the higher dynamic range and the higher ion efficiency of future spaceborne impact ionization mass spectrometers into account, individual amino acids at the concentrations predicted by Guzman et al (2018) would be detectable on active ocean worlds undergoing similar or greater activity to Enceladus.
Cationic and anionic LILBID mass spectra of the investigated di-, tri-, and tetrapeptides show the peptides' molecular peaks and peaks characteristic of their amino acid residues. The terminal amino acids of the peptides can always be identified, independent of the total number of amino acids within each peptide. Therefore, our results can be extrapolated to longer oligopeptides, and possibly even polypeptides, provided that the mass range of the spaceborne mass spectrometer is sufficient for the respective molecule and its fragments.
Paizs and Suhai (2005) studied fragmentation pathways of protonated peptides and demonstrated that peptides generally show predictable fragmentations and fragmentation pathways. Although we did not investigate fragmentation pathways in detail, some fragments described by Paizs and Suhai (2005) are also observed in our cation LILBID mass spectra, for example, water loss from Ser-containing peptides and ammonia loss from Arg-containing peptides. Ion beam irradiation of peptides that contain up to 25 amino acid residues (Bowie et al., 2002) indicates that peptides show characteristic fragmentation peaks related to their constituent amino acid residues in anion mass spectra. For example, the Ser residue undergoes a characteristic side chain cleavage resulting in a loss of CH2O, converting Ser (molecular weight: 105 u) into Gly (molecular weight: 75 u). This cleavage is also observed in the LILBID anion mass spectra of Ser-containing peptides (Fig. 5 and Supplementary Fig. S9).
The instrument sensitivity to different analytes varies with experimental parameters (delay time and laser energy), which Klenner et al. (2019) showed can be correlated with impact speeds of icy grains onto detectors in space. We can therefore infer, by comparison with the instrument parameters used here, and those required to simulate different speed regimes in space, that sensitivity to amino acids is maximized by using intermediate to high laser intensities and delay times equivalent to impact speeds of 4–10 km/s. The detection of fatty acids is maximized by using intermediate laser intensities and very high delay times, equivalent to impact speeds of 3–6 km/s, and the detection of peptides and their fragments is maximized by using low to intermediate laser intensities and intermediate to high delay times, equivalent to impact speeds of 4–8 km/s (Klenner et al., 2019). These speed ranges cover the expected flyby speeds of the Europa Clipper spacecraft (typically 4–4.5 km/s) and future Enceladus mission concepts such as the Enceladus Life Finder (ELF; 5 km/s; Reh et al., 2016).
5. Conclusion and Outlook
The proven ability of the LILBID experiment to simulate the impact ionization mass spectra of water ice dominated grains (e.g., Postberg et al., 2009, 2011b, 2018b; Khawaja et al., 2019; Klenner et al., 2019) has been applied to the simulation of ice grains containing biosignatures. By generating spectral features arising from amino acids, fatty acids, and peptides in a water, or water-rich, matrix, we show that these constituents, if present at the μM or nM level, respectively, are likely to be readily identifiable in impact ionization mass spectra recorded in space.
Determination of laboratory detection thresholds for both cationic and anionic species, which are then transformed into recommended impact velocity regimes for a dust detector, aids in mission planning for future missions to icy moons such as Europa and Enceladus, such that the chances of detecting and identifying biomarkers within ice grains are maximized. From the settings used in our experiment, we conclude that the sensitivity of impact ionization detectors to the molecular peaks of all three biosignatures investigated here is optimal between 4 and 6 km/s. Therefore, we recommend encounter velocities within this speed range. However, higher velocity impacts are complementary, producing larger amplitude signals from molecular fragments that are often characteristic of their parent molecule and help constrain the overall molecular structure.
If protonated, most amino acids and peptides, as well as their cationic fragments, are generally detectable at lower concentrations than their anionic (deprotonated) counterparts, whereas deprotonated fatty acids are detectable at lower concentrations than their cationic (protonated) counterparts. Future space instruments, thus, ideally need to be capable of detecting both cations and anions to cover the complete range of biosignatures investigated here, that is, amino acids, fatty acids, and peptides.
Further work is underway to understand how the presence of salt and also other organic constituents in ice grains might affect the detection of these biosignatures and whether the abiotic and biotic signatures of organics remain distinguishable (Klenner et al., 2020). A correlation between the organics' concentrations and spectral peak appearances and amplitudes, in other words a quantitative calibration, in the mass spectra will be investigated in the future.
Footnotes
Acknowledgments
The authors thank Sascha Kempf for valuable discussions and Jan de Leeuw for the fruitful discussions about the peaks at m/z 172 and 186 in the fatty acid spectra. Some of this work was carried out at the Jet Propulsion Laboratory, California Institute of Technology, under a contract with the National Aeronautics and Space Administration.
Author Disclosure Statement
No competing financial interests exist.
Funding Information
The research leading to these results received financial support from the German Research Foundation (DFG) projects PO 1015/2-1,/3-1,/4-1, project AB 63/9-1, and ERC Consolidator Grant 724908-Habitat OASIS.
Supplementary Material
Supplementary Figure S1
Supplementary Figure S2
Supplementary Figure S3
Supplementary Figure S4
Supplementary Figure S5
Supplementary Figure S6
Supplementary Figure S7
Supplementary Figure S8
Supplementary Figure S9
Supplementary Figure S10
Supplementary Table S1
Supplementary Table S2
Abbreviations Used
References
Supplementary Material
Please find the following supplemental material available below.
For Open Access articles published under a Creative Commons License, all supplemental material carries the same license as the article it is associated with.
For non-Open Access articles published, all supplemental material carries a non-exclusive license, and permission requests for re-use of supplemental material or any part of supplemental material shall be sent directly to the copyright owner as specified in the copyright notice associated with the article.