
Abstract
The discovery of potentially habitable planets around the ultracool dwarf star Trappist-1 naturally poses the question: could Trappist-1 planets be home to life? These planets orbit very close to the host star and are most susceptible to the UV radiation emitted by the intense and frequent flares of Trappist-1. Here, we calculate the UV spectra (100–450 nm) of a superflare observed on Trappist-1 with the K2 mission. We couple radiative transfer models to this spectra to estimate the UV surface flux on planets in the habitable zone of Trappist-1 (planets e, f, and g), assuming atmospheric scenarios based on a prebiotic and an oxygenic atmosphere. We quantify the impact of the UV radiation on living organisms on the surface and on a hypothetical planet ocean. Finally, we find that for non-oxygenic planets, UV-resistant life-forms would survive on the surface of planets f and g. Nevertheless, more fragile organisms (i.e., Escherichia coli) could be protected from the hazardous UV effects at ocean depths greater than 8 m. If the planets have an ozone layer, any life-forms studied here would survive in the habitable zone planets.
1. Introduction
The Trappist-1 system is a key future target in the search for life. This system contains seven Earth-sized planets orbiting around a M dwarf, with three of them (Trappist-1 e, f, and g) located in the habitable zone (HZ) of the host star, a region with the right conditions to harbor life (Gillon et al., 2017; Wolf, 2017; Grimm et al., 2018; Papaloizou et al., 2018). In particular, Trappist-1e seems to be the most favorable to have a habitable temperature of 279 K under a clear atmosphere (Lincowski et al., 2018). Since M dwarf stars spend ∼1010 years in the main sequence, there is enough time for complex forms of life to develop and evolve (Lineweaver et al., 2004; Scalo et al., 2007). However, a recent study by Vida et al. (2017) using Kepler/K2 data has found frequent flaring of the Trappist-1 star, bringing the habitability of these worlds into question. A total of 42 flares with energy of 1030 to 1033 erg was detected with an average time interval of 28 h between consecutive flares. The strongest flare found released an energy of 1.24 × 1033 erg, a similar energy range to the largest solar flare in history, namely, the “Carrington event” in 1859. These energetic flares are also called superflares and have been found in other M dwarf stars like DG CVn (Drake et al., 2014), AD Leo (Hawley and Pettersen, 1991), and very recently in Proxima Centauri (Howard et al., 2018; Loyd et al., 2018; MacGregor et al., 2018), among others.
Superflares can release a significant amount of ultraviolet radiation in XUV, EUV, and FUV, which affect the planetary atmosphere in many different ways, such as atmospheric mass loss, modification of chemical composition over a wide range of altitude, and instability of various atmospheric layers. Moreover, accelerated energetic protons associated with such strong flares may produce a copious amount of odd nitrogen and odd hydrogen in the upper stratosphere and mesosphere that can potentially destroy the ozone layer (Segura et al., 2010). On Earth, the ozone layer absorbs most of the solar ultraviolet radiation that arrives at our planet. In particular, radiation that is the most threatening for life, such as UVC (100–280 nm), is completely absorbed by the ozone layer, while UVB (280–315 nm) has an absorption of 95%, and UVA (315–400 nm) can reach Earth's surface. Ozone can also absorb the stellar XUV emission, which is particularly important for the Trappist-1 system as the XUV doses received at the top of the atmosphere (TOA) of these planets are higher (∼65 times for planet-e) than those at Earth (Peacock et al., 2019; Yamashiki et al., 2019). Therefore, the ozone layer acts as a shield that would protect potential complex life-forms on the surface of the planet from the harmful ultraviolet radiation. Other molecules, such as H2O and CO2, also absorb wavelengths shorter than 200 nm even in anoxic atmospheres.
For the three HZ planets of Trappist-1 in particular, the effects of strong flares/superflares and associated energetic particle events could be even worse, as they orbit very close to the host star (0.029, 0.037, and 0.0451 AU, respectively). This would likely put the habitability and atmospheric stability of these planets at great risk. On the other hand, if these planets still host an atmosphere, depending on its composition, this atmospheric layer could attenuate the UV radiation from the host star and allow surface life-forms to develop.
However, the composition of the atmosphere of Trappist-1's planets is still not known. An attempt to investigate the atmosphere of these planets was recently performed by de Wit et al. (2018). They claimed that Trappist-1 planets have an atmosphere with a lack of hydrogen, which supports the possibility that these planets are more terrestrial-like, with an exception for Trappist-1g, for which a hydrogen atmosphere cannot be excluded. Therefore, different atmospheric scenarios for these planets can be explored with the intent to analyze the attenuation of the UV radiation. O'Malley-James and Kaltenegger (2017) used different atmospheres to investigate the potential effect of UV radiation on surface habitability of the Trappist-1 HZ planets and found that oxygenic atmospheres are crucial in protecting the surface from UVC, even for a thin oxygen atmosphere (0.1 bar). However, this study did not consider the direct effects of powerful flares. Here, we calculate the temporal evolution of the UV (100–450 nm) spectra for the most complex and energetic superflare observed on Trappist-1 with the K2 mission (Section 2.1). This superflare released an energy of 1.24 × 1033 erg within a total duration of 72 min. The structure of the superflare is very complex, with two impulsive phases: one at ∼1100 s and a second at ∼1850 s after the start of the flare. We use these spectra as an input in a radiative transfer code to analyze the variation of the surface UV radiation for each interval of the superflare. Two atmospheric scenarios are adopted for each planet to facilitate analysis of the attenuation of the UV reaching the surface: a primitive (Archean) and a present-day atmosphere (Section 2.2). The biological impact of the UV radiation is analyzed for two bacteria (Deinococcus radiodurans and Escherichia coli) at the surfaces or the oceans of the planets. The results are shown in Section 3, and the main conclusions are presented in the last section.
2. Methods
2.1. Estimation of approximate UV spectra of Trappist-1 superflare
The observation of the strongest known flare, the so-called “superflare” of Trappist-1, which we consider for our study, is described in the work of Vida et al. (2017). These authors provided integrated lightcurve of the complex flare in the wavelength range of 430–890 nm, as obtained from K2 observation. This integrated lightcurve is in terms of differential magnitude (Δmag), where the first as well as the largest peak of the complex flare profile has a magnitude of 1.78. To obtain the mean lightcurve in a given wavelength from the values of Δmag, we use the following equation described by Vida et al. (2017):
where, I
0+f
(t) is the flare intensity as a function of time and I
0 is the mean quiescent flux or intensity of the star as seen from Earth. We estimated I
0 of the Trappist-1 star using the Phoenix BT-Settle model (Allard et al., 2012), which is a theoretical cloud model for stellar spectra that can reproduce spectra of main sequence stars down to the L-type brown dwarf regime. This allows the input of three main parameters, namely, the effective temperature (T
eff) in kelvin, log gravity (in cm s−2), and metallicity of the star. For Trappist-1, we use as input for those parameters the following values: 2511 K, 5.227, and 0.04, respectively. We normalize the resulting spectrum to obtain the quite time spectrum that should be seen from Earth and then compute I
0 in K2 wavelength range (ΔλK2) with Eq. 2.
The calculated mean flux I 0+f (t) of the complex Trappist-1 superflare in the K2 wavelength range is shown in Fig. 1 (left). We use this lightcurve to find the approximate spectra of the flare, as described in the two following steps.
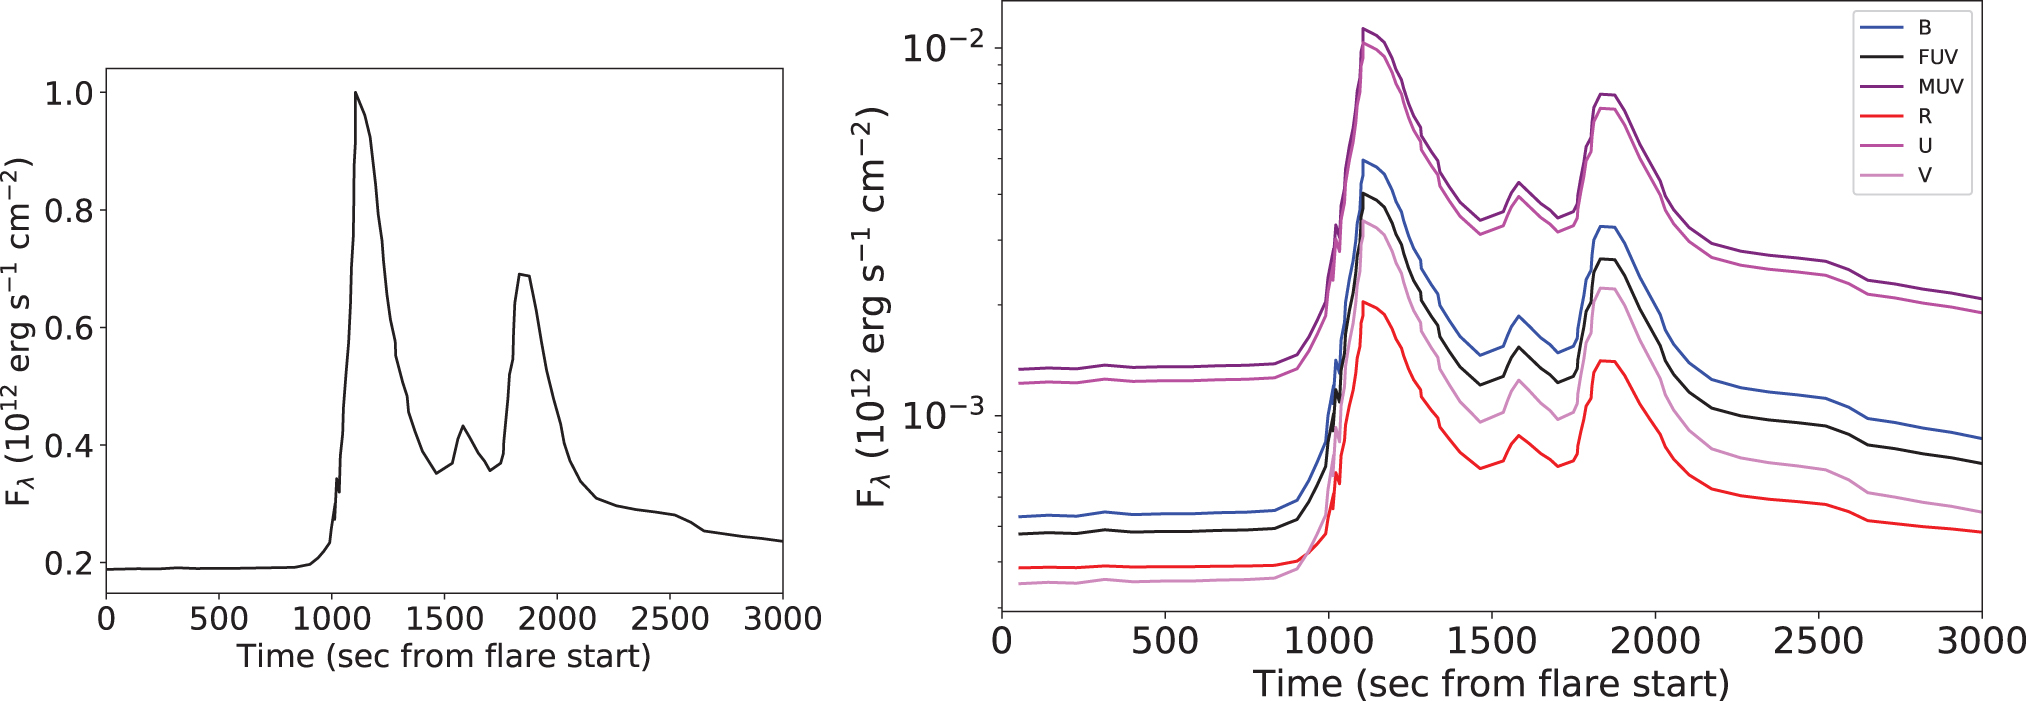
Approximate mean flux (left) of the Trappist-1 flare in K2 wavelength range (observed from Earth), calculated using Eq. 2 and estimated mean fluxes of the Trappist-1 flare in various wavelength ranges (right) are shown in the figure. Color images are available online.
2.1.1. Step 1: Finding the template spectrum and flux values from available AD Leo flare data
The detailed spectroscopic observations of stellar flares in M dwarf stars are rare. Stellar flares are produced due to the same, though not well understood, physical process in all cases, so they should have general trends for their spectral evolution. With the knowledge of lightcurve evolution of the Trappist-1 flare in various spectral ranges, we used the spectral and lightcurve information of another observed superflare on the M dwarf star AD Leo presented by Hawley and Pettersen (1991) to find the approximate spectra of the Trappist-1 flare, obtained by systematic extrapolation following the methods of Segura et al. (2010). Here, the comparison of lightcurves of the Trappist-1 flare with those for the AD Leo one shows that they are not of the same order (even considering the relative distance of those from Earth). Yet we proceed with the assumption that the correlation of the spectral evolution of a strong flare (superflare) with that of mean lightcurve in various wavelength ranges in the UV-visible range for the M dwarf star AD Leo also applies for the superflare of Trappist-1, considered here, so that the Trappist-1 spectral evolution may be considered as a scaled-down version of that in the AD Leo flare. The method deviates in one aspect from that of Segura et al. (2010), that is, in the fact that suitable scaling is also introduced during the calculation. The assumption stated above may seem to a degree crude, but in consideration of the fact that we are not aiming for the minute analysis of spectral and temporal behavior of the Trappist-1 flare and its underlying physics but rather are interested in estimating the gross influence of the flare on the surface environment and habitability only, so the approximation is valid and crucial. Hawley and Pettersen (1991) followed the Johnson photometric system (Johnson, 1955) to calibrate the visible part of the spectra in U, B, V, and R and presented the mean lightcurve (per unit wavelength in the range) of the AD Leo flare in their work. For convenience of calculation, following the usual method of subdivision (into near, middle, and far ultraviolet, NUV, MUV, and FUV, respectively) of the ultraviolet range of spectrum and the above convention for the visible part, we divide the whole range of UV-optical wavelength into six parts, as described in Table 1. Note that the U part of the spectrum (with a mean wavelength at about 365 nm), which corresponds to the Johnson photometric system, almost resembles that of the near ultraviolet (NUV) part of the conventional UV classification.
Sub-division of Ultraviolet and Visible Wavelengths
Our primary interest has been to approximate spectra of the AD Leo flare from the work of Hawley and Pettersen (1991) at a few different times over the course of the whole flare, where a very limited number of disjoint observed spectra at three different ranges are presented, as in Figs. 4 (N(UV) + part Optical), 5 (MUV), and 6 (FUV) of their paper. To calculate the complete spectra over the whole time period of the AD Leo flare, which consists of two peaks, we follow the method described by Segura et al. (2010). For the simplification of the extrapolation method used, these authors approximated the double peaked flare as consisting of a single peak followed by a gradual decline, such that the spectrum at 915 s represented the only peak of the flare. There are no spectral observations in the MUV (∼200–300 nm) any time near that peak of the flare, and the first such spectrum is observed only at 1604 s after the flare starts. To find the approximate MUV part of the spectrum at the adjusted peak (∼915 s), the long wavelength end of the first MUV spectrum at 1604 s, as presented in the work of Hawley and Pettersen (1991) (topmost picture of Fig. 5a of their paper), is scaled by multiplication with a factor of ∼3.6 to combine it with the short wavelength end of the peak NUV+Optical spectrum at 915 s (third picture from top of their Fig. 4a). Then we join it with the FUV spectrum at 900 s (Fig. 6 of Hawley and Pettersen [1991]) to get the complete (FUV+MUV+N(UV) + part optical(B)) spectrum of the adjusted peak for the AD Leo flare.
Given that we have only the mean lightcurve of N(UV), B, V, and R part of the whole AD Leo flare from the work of Hawley and Pettersen (1991), we compute the other parts of the lightcurves, namely, the MUV and FUV parts, of the same flare. To do this, we first normalize the N(UV) and B parts of the calculated peak flare spectrum using the above-mentioned lightcurve of the same ranges to obtain the approximate AD Leo spectra at a few different times during the flare. Then we scale the remaining (FUV + MUV) parts of the peak spectrum to match the N(UV) B part of the spectra at those times. Following, the integration of respective parts of the spectra over those two wavelength intervals (FUV and MUV) and dividing by the corresponding interval, we get the mean light curves of the complex AD Leo flare in FUV and MUV also.
At this point, we have the two parts of the AD Leo flare template, namely, the approximate peak spectrum at ∼915 s and the approximate lightcurves of the same flare at different wavelength ranges (FUV + MUV + N(UV) + B + V + R).
2.1.2. Step 2: Finding the spectra of Trappist-1 flare using the templates
The assumption of applicability of the time correlation of the mean fluxes at different wavelength ranges of the flare of one M dwarf star, namely, AD Leo, to a flare of another M dwarf, that is, Trappist-1, allows us to obtain the fluxes in all other wavelength ranges of the latter. The spectral interval, out of those listed in Table 2, that should best approximate the K2 wavelength range in terms of mean lightcurve is the R (600–720 nm). Mean flux at all other wavelength ranges for the Trappist-1 flare are obtained by interpolation of those for the AD Leo flare using the mean flux information in R (≈ K2 range) of the former. The estimated values of the approximate mean fluxes of the Trappist-1 flare are shown in Fig. 1 (right). Finally, scaling down and normalizing different parts of the template (approximate peak) spectrum of the AD Leo flare with the time-varying mean flux values of Fig. 1 and combining those resultant parts, we find the approximate spectra (Fig. 2) of the Trappist-1 flare, that should be observed from Earth, throughout the time span of the flare.
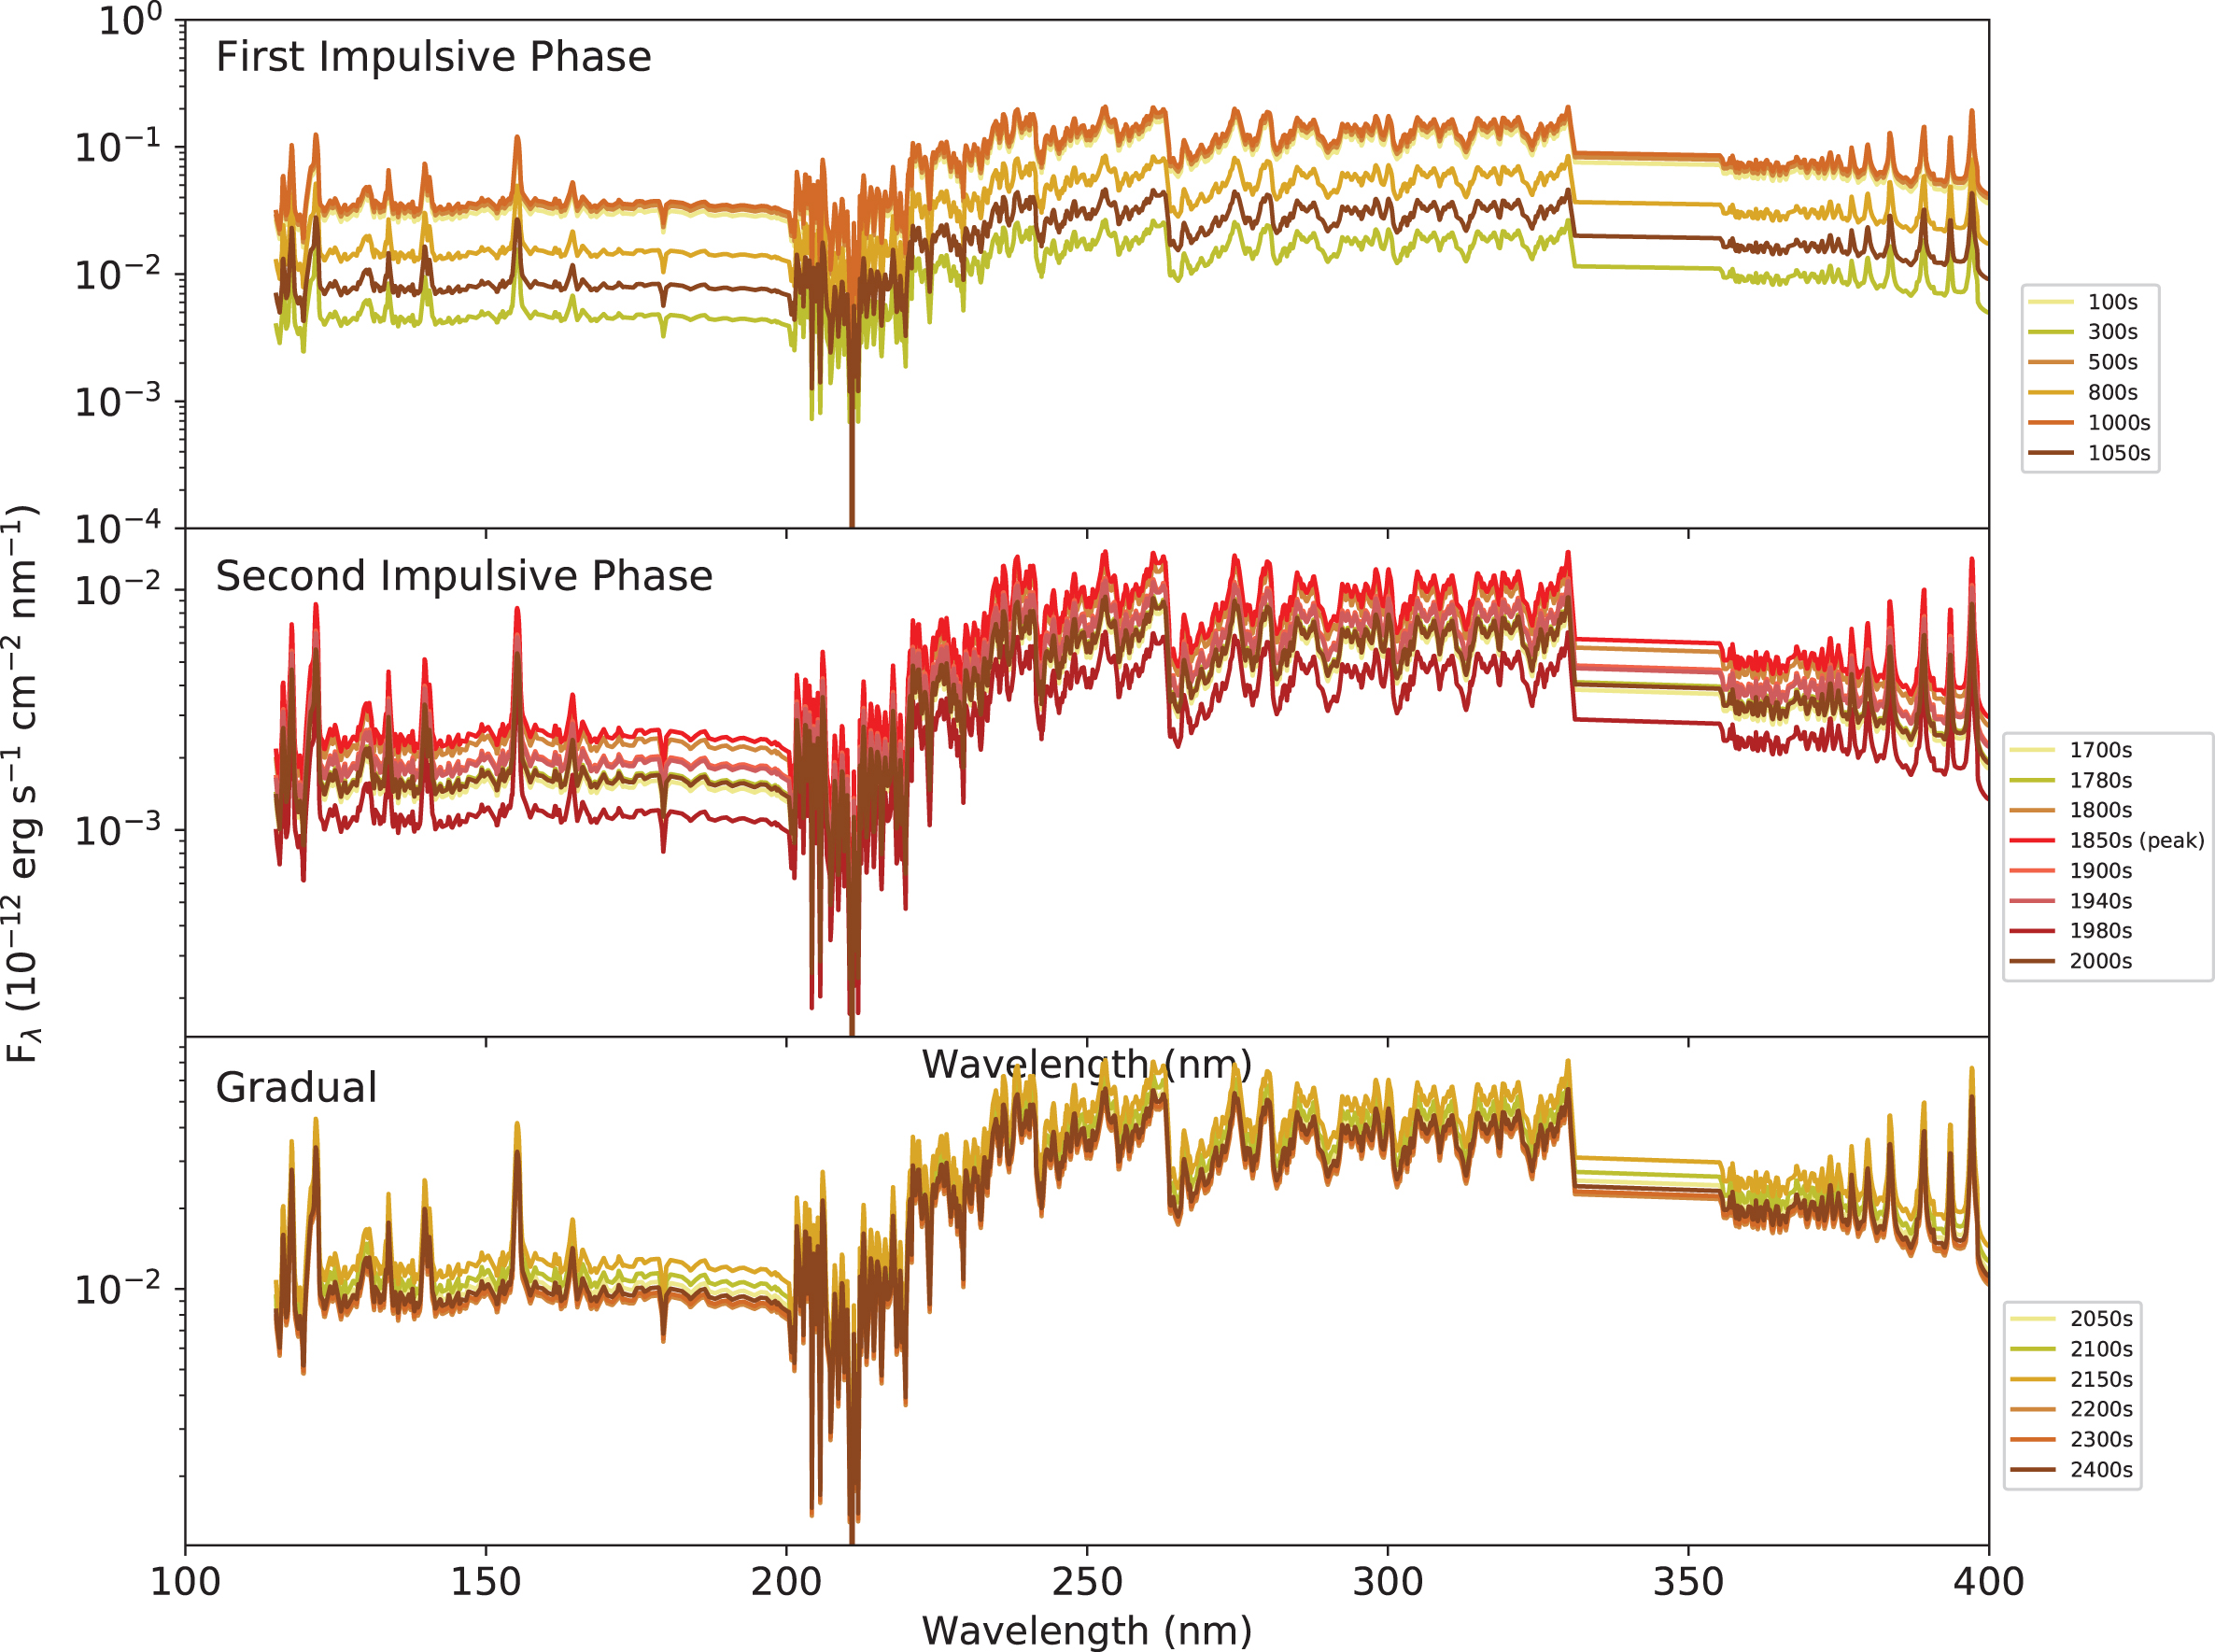
Estimated UV spectra of the strongest flare of Trappist-1 from Vida et al. (2017) for every 5 min during the evolution of the flare. Color images are available online.
Biological Effective Irradiance, E eff (J/m2), Due to the Two Impulsive Phases of the Superflare
To obtain the values in joules, we multiplied the values in watts by the total duration of each peak (146 and 158 s, respectively).
2.2. Atmospheric simulation
To compute the radiative transfer of UV radiation (180–300 nm) through the atmospheres of the Trappist-1 planets, we used a two-stream radiative transfer code from the work of Ranjan et al. (2017). This code computes the UV fluxes and intensities at the TOA and at the surface of the planets orbiting M dwarfs, under specified atmosphere and surface conditions. It follows the treatment of Toon et al. (1989), requiring the partitioning of the atmosphere into N homogeneous layers and the zenith angle of the star. In addition, the code also requires as input the temperature, pressure, and composition (gas molar concentration) as a function of altitude. We partitioned the atmosphere into 55 layers, each having a thickness of 1 km, and two atmospheric scenarios were used as an input to the code: (i) a 1 bar CO2-dominated atmosphere (0.9 bar N2, 0.1 bar CO2), similar to the Archean Earth at 3.9 Gyr and (ii) a modern atmosphere with ozone. For the former, we adopted a prebiotic model already provided by the code. For the latter, we consider an atmosphere composed of N2, O2, CO2, H2O, CH4, O3, and SO2, and we build our own model according to the following steps: We obtained the mixing ratio of trace gases such as H2O, CH4, and N2 for Trappist-1 e, f, and g from the work of O'Malley-James and Kaltenegger (2017). We also used their constant and non-negligible mixing ratio for N2O of 1.5 × 10⁻². In the work of Hu et al. (2012), the mixing ratios of CO2 are found to be constant at all heights, due to the fact that CO2 is well mixed in the atmosphere. Considering this fact, we assumed a constant mixing ratio of CO2 of ∼370 ppm (0.00037 mol/mol), similar to the one of current Earth (Foucher et al., 2011). However, previous studies (Turbet et al., 2018; Hu et al., 2020) have suggested that Trappist-1 f and g could require an abundance of CO2 to be habitable. We adopted the concentrations of O2 and N2 from the MSIS-E-90
1
model for a current Earth. This model gives the concentrations of O, N2, O2, He, Ar, H, and N. However, we excluded the contribution of He, Ar, H, given that the contribution of these species in the total mass density is very small (around 10−2 to 10−3) with respect to O2 and N2 densities. Therefore, we calculate the mixing ratios of N2, O2, O, and N by taking the ratio of concentration of individual species with respect to the total (summed) concentration. Finally, we add the mixing ratios of N and O to those of O2 and N2. For the mixing ratio of SO2, we use the concentration from the work of Rugheimer et al. (2015) for an Earth-like planet orbiting a M8V star (same spectral type as Trappist-1) with an age of 3.9 Gyr. These data are available in the code. Finally, to build the temperature-pressure-density profile, we used the temperature as a function of height from the work of O'Malley-James and Kaltenegger (2017) for a 1 bar atmosphere, and we adopted the same pressure as a function of height as that of current Earth. To obtain the total concentration (molecules cm−3) of the air as a function of height, we have to calculate the concentration of all those species from their mixing ratio values and add them. It is important to note that, given the process involves data from different sources, the final results are very approximate.
The final mixing ratio of the gases for a modern Earth atmosphere is shown in Fig. 3 for each of the Trappist-1 HZ planets.
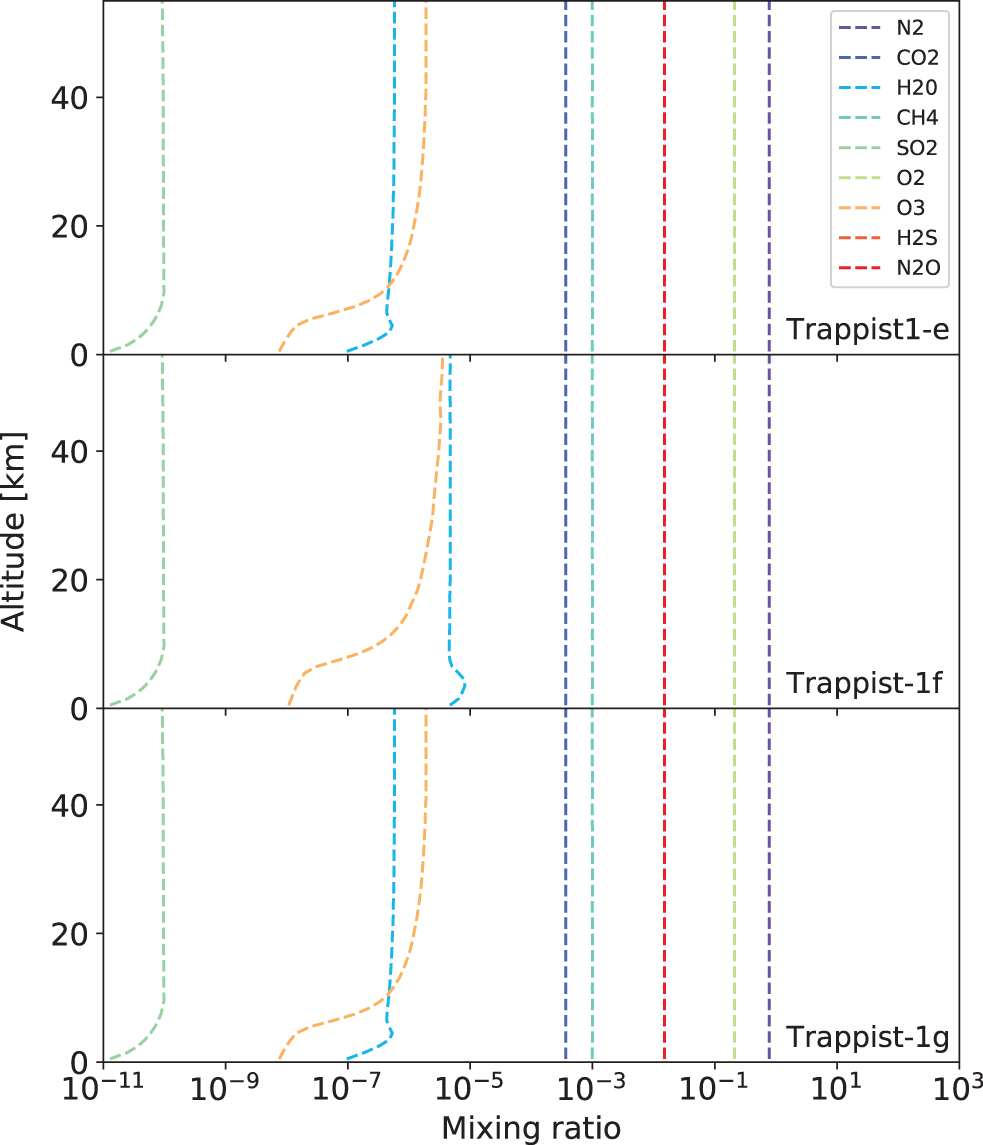
Mixing ratios of the trace gases used as input in the model for the three planets in the HZ of Trappist-1. Color images are available online.
2.3. Biological impact
Superflares significantly increase the UV flux of the star and consequently can affect the conditions for the origin and development of life. Shorter UV wavelengths (10–200 nm) can be absorbed in the upper portion of the atmosphere if the planet has strong absorbers such as N2, CO2, or H2O. UV wavelengths within 200–300 nm (MUV) and 300–400 nm (NUV) can partially reach the surface of the planet, depending on whether the planet possess an ozone layer. The DNA molecules of living beings are mainly damaged by the UVC and UVB range. Therefore, we focus on the probable impact the increase of MUV+NUV+FUV radiation during the impulsive phase of a superflare on Trappist-1 could have on life present either at the surface or in the ocean of the potentially habitable planets of Trappist-1 e, f, and g.
For this study, we chose two bacteria, a very resistant one, Deinococcus radiodurans, and a more common one, Escherichia coli. Since the response of a biological body varies as a function of the wavelength, the effective biological response at different wavelengths has to be estimated. For that, the incident UV flux, F
UV(λ), is weighted by the action spectrum, S(λ) of the microorganisms.
where F inc is the total incident UV flux including the superflare contribution arriving at the planet surface/ocean, S is the action spectra, and λ represents the MUV wavelengths (200–300 nm). The action spectra of the two bacteria are shown in Fig. 4. The UV dosage for 10% survival of D. radiodurans is 553 J/m2, which corresponds to a UV flux (255 nm) of 1.7 W/m2 during 5 min (Ghosal et al., 2005), while for E. coli it is 22 J/m2 (Gascon et al., 1995).

Action spectra, or biological response, for D. radiodurans (left) and E. coli (right) as shown in Estrela and Valio (2018). Color images are available online.
To compute the incident UV flux (F
inc) at various depths z of an ocean, we use the following equation:
where I(λ, z) is the UV spectral irradiance at depth z, I 0(λ) is the UV spectral irradiance with the superflare contribution passing through an Archean atmosphere and reaching the water surface, and K(λ) is the diffuse attenuation coefficient for water given by the sum of the absorption coefficient of water and the scattering coefficient. For further details, we refer the reader to the work of Estrela and Valio (2018), a study in which the same methodology was applied to compute the biological impact by superflares from the solar-type star Kepler-96.
3. Results
3.1. UV surface radiation during the evolution of the superflare
The net UV flux at the top of the atmosphere (dashed lines) and on the surface (solid lines) of the three Trappist-1 HZ planets is shown in Fig. 5 at intervals of 5 min during the occurrence of the superflare. As expected, the flux reaches higher values during the first impulsive phase (∼1 Wm−2 nm−1) but has a considerable increase during the second peak of the flare. On the other hand, our results show that, due to the increase in UV by the superflare, the UV flux at the TOA is 100 times higher than those found in the works of O'Malley-James and Kaltenegger (2017, 2019) for an active Trappist-1. These works use the spectrum of a flaring star based on the MUSCLES survey and Phoenix models; however, they do not specify the energy range of the flare. It is also worth noting that a modern atmosphere with ozone absorbs all the radiation shortward of 280 nm, which is the most dangerous to life, which allows only a small amount of UVB radiation to pass. The UVC and UVB in the TOA of Trappist-1 planets is slightly higher than the TOA of present-day Earth (dashed black line in Fig. 5), while the UVA fluxes are lower. For an Archean atmosphere, only UV wavelengths smaller than 200 nm are absorbed, which means that the planetary surfaces still partially receive some UVB and UVA.

Ultraviolet flux at the TOA (dashed line) and at the surface (solid line) of planets Trappist-1 e (top), Trappist-1 f (middle) and Trappist-1 g (bottom) during the evolution of the flare. The UV flux at the surface is transmitted by two atmosphere models: 1 bar CO2-dominated atmosphere (Archean) and a present-day Earth-like atmosphere with ozone. The quiescent solar UV flux received at the TOA of Earth and the UV flux received at Earth's surface are plotted for comparison (dashed and solid black line, respectively). Color images are available online.
3.2. Impact on life on the surface
Following the work of Estrela and Valio (2018), we determine the survival of two bacteria on the surface of the Trappist-1 HZ planets by calculating the overall effective UV flux (E eff) that falls in a biological body (see Section 2.3), considering the strongest observed flare from the work of Vida et al. (2017). The results for the E eff during the two impulsive phases of the flare are listed in Table 2. The threshold for the E eff was determined by using the maximum UV flux for 10% survival of these bacteria.
We find that under an Archean atmosphere both bacteria would not be able to survive in planet e during the first impulsive phase, but due to the UV resistance of D. radiodurans, this bacteria could survive in any of the other planets. In contrast, the scenario is better for a planet with a present-day atmosphere (with ozone), for which, during the first impulsive phase only, E. coli could not survive on Trappist-1e. However, both bacteria could survive on the other HZ planets under the presence of an ozone layer. It is worth highlighting here that we are analyzing the survival of Earth-like bacteria on a planet with a clear sky; clouds or hazes could possibly absorb this UV radiation, and it is also true that other bacteria might have evolved to survive such that they could endure harsher UV conditions.
3.3. Impact on life in the ocean
Estrela and Valio (2018) showed that an ocean on a hypothetical Earth-like planet orbiting Kepler-96 could protect organisms from the increased UV radiation and allow life to exist in depths within the photic zone (up to 200 m). Grimm et al. (2018) found that the densities of the Trappist-1 planets range from 0.6 to 1 of Earth's density, which implies that planet e has a largely rocky interior, while planets f and g require thick atmospheres, oceans, or ice, with a water mass fraction of less than 5%. Bourrier et al. (2017) used the instrument STIS from the Hubble Space Telescope to measure the ultraviolet radiation of Trappist-1 at Lyman-α and calculated the water loss rates of the planets. They found that the planets in the HZ should have lost less than three Earth-oceans of water, indicating that they could still have some remaining water.
Considering the possibility of the presence of an ocean on these planets, we analyzed whether this could be a favorable condition in protecting the microorganisms (D. radiodurans and E. coli) from the increased UV flux due to superflares, under the lack of an ozone layer. We calculated the effective UV flux received by these bacteria at various ocean depths during the two impulsive phases of the flare, as described in Section 2.3. The values of the UV irradiation that vary with ocean depth are shown in Fig. 6. During the impulsive phases, D. radiodurans could survive at the ocean surface. On the other hand, E. coli could survive approximately at 8, 9, and 11 m below the ocean surface on the three HZ planets, respectively. These ocean depths are within the photic zone of ∼10 m proposed by Heath et al. (1999) for an M dwarf star with temperatures similar to Trappist-1. Kiang et al. (2007) also analyzed the UV impact on life under water based on the plant damage limit. These authors claim that flares of 1033 ergs are at the threshold at which protection under water is necessary. However, they found that the safest ocean depth for a flare with this energy range is at 1.5 m.
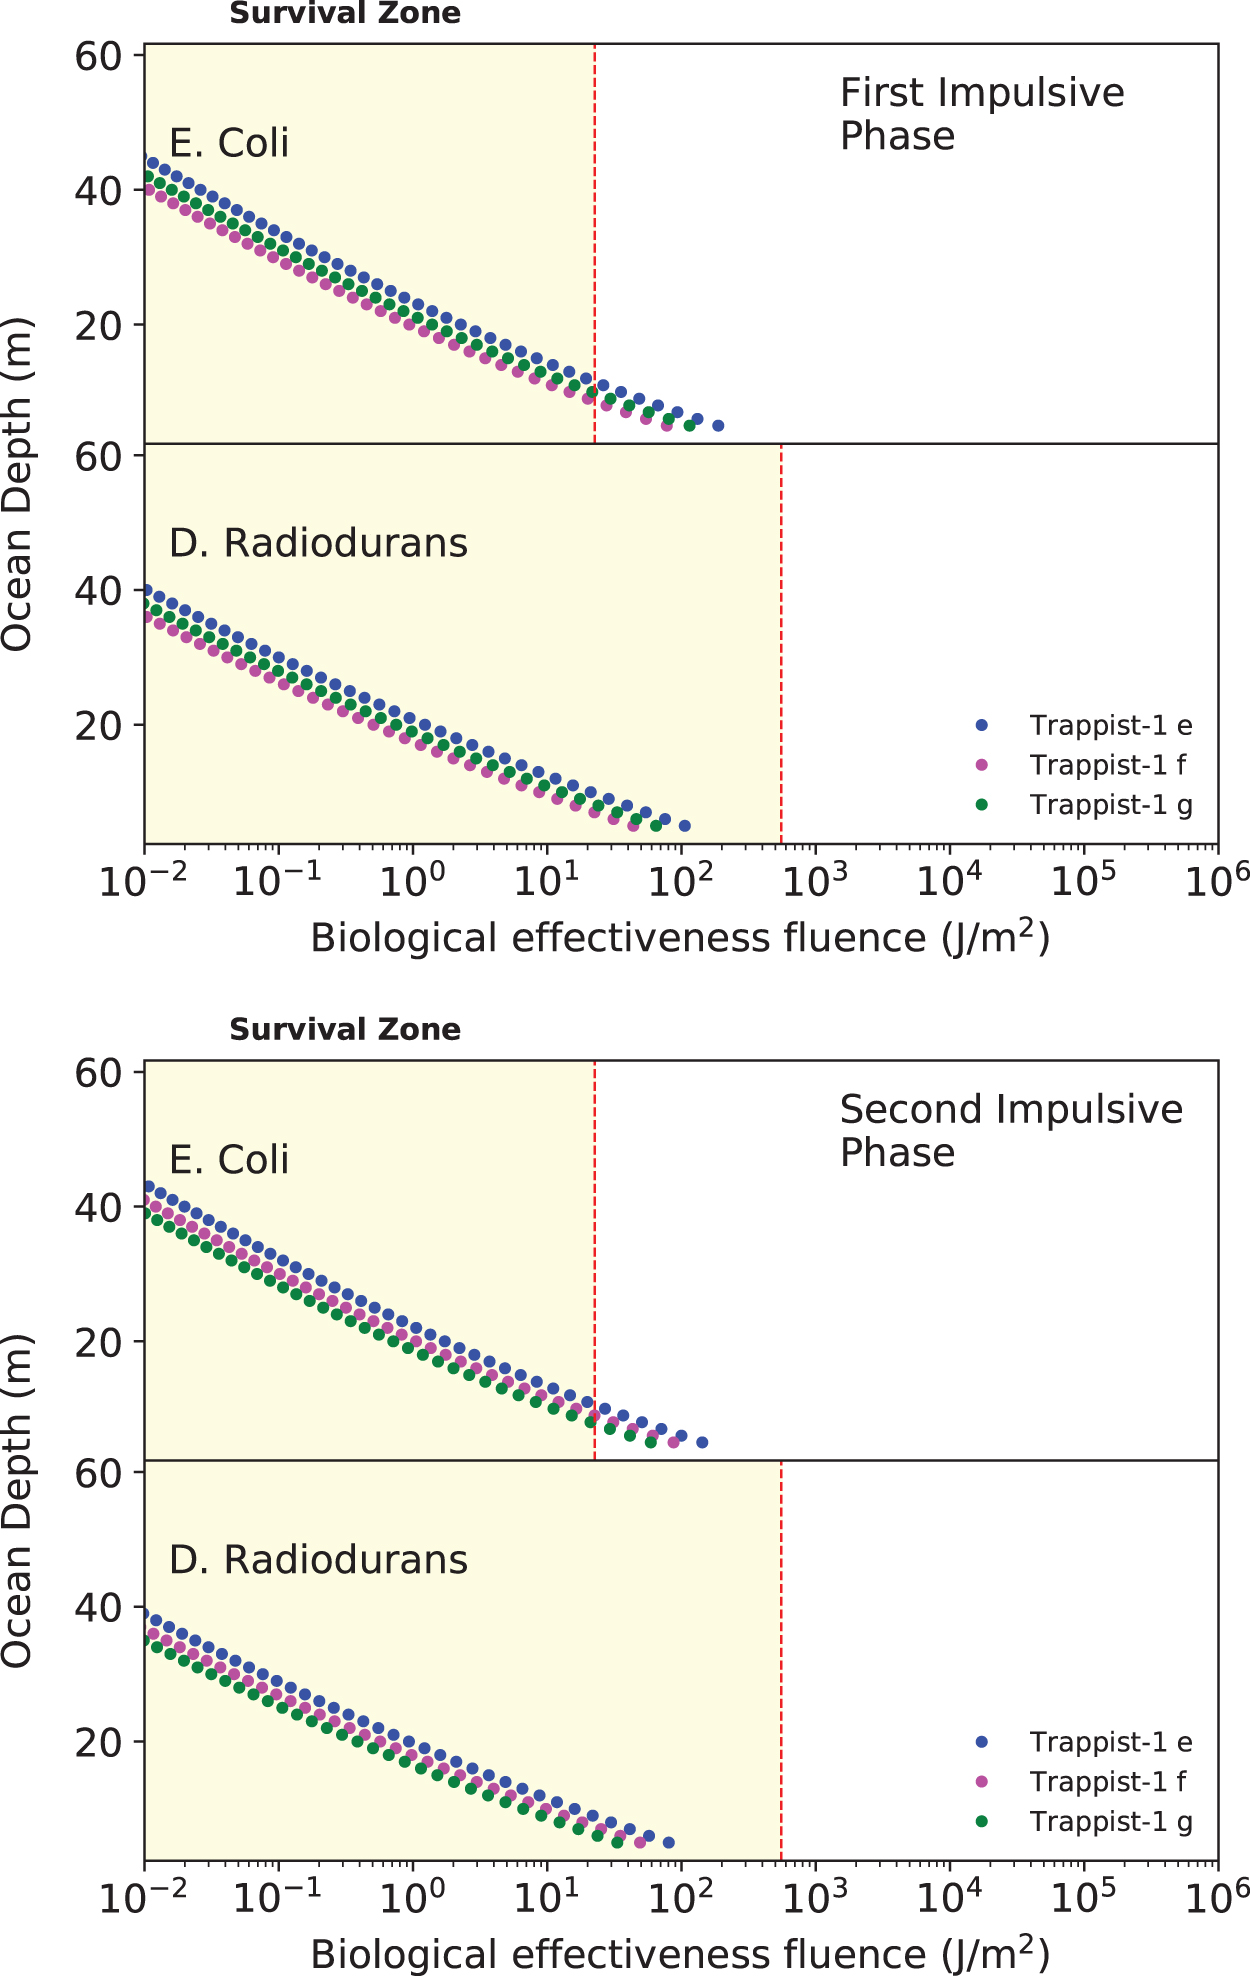
Biologically effective irradiance for E. coli (E eff) with depth in an Archean ocean present in Trappist-1 e, f, and g. The values in joules of the E eff were obtained by multiplying the values in watts with the time duration of the two impulsive phases of the flare. The red vertical line represents the threshold for finding life determined by the maximum UV flux for 10% survival of E. coli and of D. radiodurans. Color images are available online.
4. Discussion
4.1. Impact of consecutive superflares
In the present study, we show that the presence of an ozone layer is crucial for protection of life on the Trappist-1 HZ planets from the harmful UV flux of the strongest superflare observed from Trappist-1. However, we do not consider disturbances in the chemical composition of the atmosphere of the planets by the Trappist-1 flare due to a single flare or consecutive flares. Venot et al. (2016) and Segura et al. (2010) focused on the effects that a flare similar to the observed “great flare” on the active M-dwarf AD Leo could have on the composition of the atmosphere of an Earth-like planet orbiting at 1 AU of this star. Venot et al. (2016) suggested that the atmosphere would return to its steady state after ≈30,000 years post-flare. Moreover, Segura et al. (2010) showed that the recovery of the atmosphere depends on whether the flare is associated with energetic particles. These authors showed that the ozone layer would recover in about 30 h if there is no energetic particle enhancement; otherwise, the ozone layer could be depleted for about 30 years.
Tilley et al. (2019) analyzed the impact of consecutive flares on the ozone layer of an Earth-like planet and found that single lower-energy flares do not significantly impact the ozone column. They also purported that, even under sequential (every 2 h) superflares with 1034 erg, the impact on the ozone column is lower than the impact by a single proton event associated with a flare in this energy range. However, if lower-energy flares (3 × 1030 erg) associated with proton events occur in a frequency higher than once per year, the ozone column can rapidly be eroded.
In the case of Trappist-1, Vida et al. (2017) found a total of 42 flares; only one of them reached 1033 erg, while the others had energy that varied between 1030 and 1032 erg. These flares occurred in a mean interval of 28 h, and it is not known whether they were associated with proton events. If they were, according to the results from Tilley et al. (2019), a 1-day separation between flares of 8 × 1031 erg would deplete the ozone layer for 2.3 years. The removal of the ozone layer would allow the irradiation of harmful UV wavelengths and render the surface of these planets a hostile place for life. Therefore, by not taking into account the UV increase due to consecutive flares and its impact on the ozone layer, our study underestimates the UV radiation and its effects on life.
A strong magnetic field on these exoplanets could also shield the atmosphere from the impacts of the enhanced proton flux associated with such superflares. However, according to Vidotto et al. (2013), to possess a magnetosphere that is able to protect the atmosphere from these eruptions, Trappist-1 HZ planets would need to have strong magnetic fields of order ≈10–103 gauss due to the high magnetic pressure of their host star, whereas Earth's magnetosphere is only about 0.5 gauss.
All these factors can impose difficulties for the development of life at the surfaces of Trappist-1 planets. Therefore, we also analyzed here the possibility of life in an ocean on these planets, in the absence of an ozone layer. As described in Section 3.3, previous studies have indicated the possibility of an ocean on the HZ planets of Trappist-1, which, in turn, could protect life from the harmful effects of the increased UV by the superflares.
4.2. Bacterial recovery between two impulsive phases
Patel et al. (2009) irradiated cultures of D. radiodurans with UV radiation (200–500 nm) for 5 min using a flux of 300 W/m2 (1.2 W/m2/nm). Then they measured the growth rate curve of the bacteria over 24 h by measuring the number of colonies after exposure to the UV irradiation. Their growth curve shows that a population of wild-type D. radiodurans starts growing exponentially after ∼8 h, and in about 23 h the population is completely recovered. The interval between the two main impulsive phases of the superflare is 14 min, and the fluxes per nanometer are 100 times higher than the flux used by Patel et al. (2009). This suggests that this bacteria at the surface of a planet with an ozone layer would not have sufficient time to recover between the first and second impulsive phases of the flare. However, the bacteria could have time to recover before the arrival of a second flare on Trappist-1, as the interval between consecutive flares is 28 h. It should be emphasized that this recovery would apply only to an Earth-like evolution that produced D. radiodurans. Other possible organisms on that planet could have evolved faster regeneration capacities.
4.3. Superflares and the origin of life
In Sections 3.2 and 3.3, we considered how superflares could be lethal for evolved life-forms. However, previous studies (Airapetian et al., 2016; Ranjan et al., 2017) have suggested that high-energy flares could facilitate prebiotic chemistry. UV radiation is a key ingredient for several prebiotic reactions; however, M dwarf stars emit lower in NUV than do solar-type stars. If the prebiotic reactions that are UV dependent could occur at low irradiance levels of UV light, the reaction rates would be very small, and the origin of life could be delayed (Ranjan et al., 2017). M dwarf flares, such as the one analyzed in this work for Trappist-1 and the AD Leo great flare of 1985, can increase the NUV radiation at the surface of the orbiting planets up to 104 W/m2/nm. Depending on the frequency of these flares, they could compensate for the low NUV flux of the M dwarfs. Trappist-1, in particular, has a high-frequency flaring rate, with ∼0.75 cumulative flares per day. However, laboratory studies would be necessary to determine whether the frequency and duration of these flares could provide sufficient fluence to trigger prebiotic chemistry.
5. Summary and Conclusions
The discovery of frequent energetic flares on Trappist-1 by Vida et al. (2017) brings into question the habitability of the terrestrial planets of this system. In this work, we calculated the UV (100–450 nm) spectra during the temporal evolution of the most energetic flare observed on Trappist-1 (1.24 × 1033 ergs) using the well-observed flare of the M4V star Ad Leo (Hawley and Pettersen, 1991) as a template. Moreover, we use two atmospheric models, a primitive (Archean) atmosphere and an atmosphere with ozone, to analyze the attenuated incident UV flux during the interval of the flare and the impact that it could have on life present at the surface or in the ocean of Trappist-1 HZ planets. Our findings are as follows:
The superflare observed at Trappist-1 can increase the TOA flux up to ∼1 Wm−2 nm−1 in the first impulsive phase. The UVC fluxes can be up to 2 times higher than the one received at the TOA of present-day Earth, but the UVA fluxes are lower.
The increase in the UV fluxes due to the flare makes the survival of bacteria more precarious on planet e under a primitive scenario, but UV-resistant microorganisms, such as D. radiodurans, are able to survive the irradiance received, for example, at Trappist planets f ang g in the first and second impulsive phases of the flare. On the other hand, the presence of an ozone layer absorbs most of the harmful UV radiation, which can allow bacterial life-forms to survive at the surface under any atmospheric scenario.
An ocean on these planets could also provide a safe refuge for life-forms under the high UV irradiation of flares. In the case of the bacteria analyzed in this work, D. radiodurans could survive on the ocean surface, while E. coli could survive at about 10 m below the ocean surface of the three HZ planets during the first impulsive phase of the superflare.
Footnotes
Acknowledgments
We would like to thank Jean Pierre Raulin for encouragement in the preparation of this manuscript. Raissa Estrela acknowledges a FAPESP fellowship (#2016/25901-9 and #2018/09984-7). A. This work has been supported by a grant from the MackPesquisa and partial support from FAPESP grant (#2013/09824-6). This research was carried out at Center for Radioastronomy and Astrophysics Mackenzie and at Jet Propulsion Laboratory, California Institute of Technology, under a contract with the National Aeronautics and Space Administration.
Author Disclosure Statement
No competing financial interests exist.