
Abstract
The search for organic molecules at the surface of Mars is a key objective in astrobiology, given that many organic compounds are possible biosignatures and their presence is of interest with regard to the habitability of Mars. Current environmental conditions at the martian surface are harsh and affect the stability of organic molecules. For this reason, and because current and future Mars rovers collect samples from the upper surface layer, it is important to assess the fate of organic molecules under the conditions at the martian surface. Here, we present an experimental study of the evolution of uracil when exposed to UV radiation, pressure, and temperature conditions representative of the surface of Mars. Uracil was selected because it is a nucleobase that composes RNA, and it has been detected in interplanetary bodies that could be the exogenous source of this molecule by meteoritic delivery to the surface of Mars. Our results show that the experimental quantum efficiency of photodecomposition of uracil is 0.16 ± 0.14 molecule/photon. Although these results suggest that uracil is quickly photodegraded when directly exposed to UV light on Mars, such exposure produces dimers that are more stable over time than the monomer. The identified dimers could be targets of interest for current and future Mars space missions.
1. Introduction
The search for organic molecules on Mars is a major goal for the current Mars Science Laboratory (NASA) and the future ExoMars 2022 (ESA) Mars exploration space missions. Geomorphological and mineralogical evidence shows that Mars had large stable expanses of liquid water >3.7 Ga ago. This evidence includes the valley networks as seen in Mariner 9 and Viking Orbiter imagery (Cabrol et al., 1999; Fassett and Head, 2008) and the detection of hydrated minerals such as sulfates (Squyres et al., 2004; Gendrin et al., 2005; Langevin et al., 2005) and phyllosilicates (Wyatt and McSween Jr, 2002; Poulet et al., 2005).
Because liquid water is considered a prerequisite for life to emerge and develop, Mars has become an object of prime interest for astrobiology research. As organic molecules can be of biotic origin, the search for organics on Mars is the core part of the search for evidence of past and/or present life.
The interplanetary medium is also a source of abiotic organic molecules for Mars in that meteoroids and interplanetary dust particles continuously deliver these compounds to its surface (Flynn, 1996; Moores et al., 2012). These include carboxylic acids, alcohols, aldehydes, aliphatic and aromatic hydrocarbons, amino acids, and nucleobases (Stoks and Schwartz, 1979, 1982; Cronin et al., 1993; Ehrenfreund et al., 2001; Botta and Bada, 2002; Botta et al., 2002).
Finally, it is possible that organic molecules are synthesized abiotically in situ and contribute to the total organic matter on Mars. Unlike exogenous sources, endogenous sources such as atmospheric syntheses (Hubbard et al., 1971, 1973; Wong et al., 2004; Trainer et al., 2006), hydrothermal syntheses (Schulze-Makuch et al., 2007; Ehlmann et al., 2010), or even syntheses due to high-velocity impacts of meteoritic material (Goldman et al., 2010; Furukawa et al., 2014, 2015) have not been fully investigated but are potential inputs of organic molecules.
While a great diversity of organic molecules are known to be brought to Mars, in particular by meteoritic influx, only a few organic compounds have been detected to date. Methane has been reported in the martian atmosphere (Formisano et al., 2004; Webster et al., 2018), although such detections are still under debate (Korablev et al., 2019). Chlorinated (dichloroalkanes, chlorobenzene, etc.) and sulfur-bearing (methylthiophene, benzothiophene, etc.) organic molecules have been detected in situ at the surface of Mars (Freissinet et al., 2015; Eigenbrode et al., 2018). Chlorinated hydrocarbons are assumed to be mainly products of reactions that occur during in situ analysis between chloro-oxidants and organic molecules, both of which were found to be present in clays sampled in Gale crater (Freissinet et al., 2015).
Beyond the analytical bias, the main hypothesis that explains the difference between the nature of organics conjectured to have come from exogenous sources and those that have been detected is that organic molecules can evolve under the very harsh environmental conditions at the surface of Mars. Organic molecules would not be preserved, but rather altered and degraded, under martian surface and subsurface conditions. Among the martian parameters likely to alter organic matter, UV radiation is particularly effective. The surface of Mars is exposed to a flux of energetic UV photons in the wavelength range from 190 to 400 nm (Kuhn and Atreya, 1979; Cockell et al., 2000; Patel et al., 2002), which can trigger photochemical reactions. The total irradiance at noon on the planet varies from 2 to 55 W/m2, depending on the latitude, the season, the atmospheric dust opacity, and the ozone level according to numerical models and in situ measurements achieved with the Rover Environmental Monitoring Station instrument onboard Curiosity (Cockell et al., 2000; Patel et al., 2002; Gómez-Elvira et al., 2012; Gomez-Elvira et al., 2013). The martian surface and atmosphere also holds many oxidizing compounds that may be involved in the evolution of organic matter (Lasne et al., 2016). Finally, Mars' magnetic field declined in strength early in the history of Mars, which rendered the atmosphere and surface vulnerable to solar energetic particle (SEP) and galactic cosmic ray (GCR) bombardment (Kminek and Bada, 2006; Dartnell et al., 2007; Pavlov et al., 2012; Ehresmann et al., 2017). Because of UV radiation, oxidants, GCR, and SEP, organic matter is very likely to be altered by the surface environment of Mars.
To increase our understanding of organic matter on Mars, to determine its origin, and to provide useful information for current and future Mars exploration missions, it is of prime importance to study the chemical evolution of organic molecules under the environmental conditions of the martian surface. There has been considerable work using laboratory chambers to simulate the martian environment (temperature, pressure, atmospheric composition, mineral matrices, UV radiation, electron flux) and experimentally determine the evolution of organic compounds under such conditions. Such investigations are needed to (1) understand the low diversity of organic compounds detected to date, (2) identify stable organic compounds/products and their origin under Mars surface conditions that are critical in the search for organic molecules on Mars, (3) understand the contribution of different environmental parameters involved in organic matter evolution, and (4) determine the types of Mars surface environments that are most likely to preserve organic matter and should be targeted by in situ missions. Experimental Mars simulations have shown that most organic molecules degrade into volatile compounds, with a higher degradation rate for nonaromatic molecules (Ten Kate et al., 2005; Schuerger et al., 2008; Stalport et al., 2009; Dartnell et al., 2012; Keppler et al., 2012; Noblet et al., 2012; Poch et al., 2014), and they have indicated that certain compounds evolve toward more stable or metastable organic compounds (Oro and Holzer, 1979; Schuerger et al., 2008; Stalport et al., 2009; Hintze et al., 2010; Stalport et al., 2010). Simulation experiments have also shown that minerals can influence the evolution of organic molecules by preserving them or accelerating their degradation (Shkrob and Chemerisov, 2009; Johnson and Pratt, 2010; Shkrob et al., 2010; Stalport et al., 2010; Fornaro et al., 2013, 2018a, 2018b; Poch et al., 2015; dos Santos et al., 2016; Ertem et al., 2017; Laurent et al., 2019).
In recent years, we have carried out numerous experiments with the Mars Organic Matter Irradiation and Evolution (MOMIE) experimental setup on different chemical families of organic molecules mainly from the interplanetary medium but also those related to terrestrial biological activity. We studied the stability of amino acids (glycine, serine, α-aminoisobutyric acid, alanine), carboxylic acids (mellitic, phthalic, trimesic, and benzoic acids), polycyclic aromatic hydrocarbon (chrysene), and urea (Stalport et al., 2009, 2010, 2019; Poch et al., 2013, 2014, 2015). In the present study, we are interested in uracil (C4H4N2O2), which is involved in terrestrial biochemistry but is also a molecule brought in from the interplanetary medium. Uracil is a pyrimidine nucleobase (Fig. 1) found in carbonaceous chondrites (ppb level) such as the Murchison, Orgueil, and Murray meteorites (Stoks and Schwartz, 1979, 1981; Martins et al., 2008). Furthermore, experimental studies suggest that uracil may form and persist in the interstellar and cometary environments (Nuevo et al., 2009, 2012, 2014). The detection of uracil in carbonaceous chondrites strongly suggests its continuous delivery to Mars.

Molecular structures of uracil (left) and pyrimidines (right).
Previous studies on the evolution of pyrimidine under UV radiation have shown its dimerization when subjected to UV radiation (Wulff and Fraenkel, 1961; Blackburn and Davies, 1966; Setlow, 1966). Isolated or included in nucleosides, nucleotides, oligonucleotides, polynucleotides, and nucleic acids, uracil undergoes photodimerization under UV radiation; most of these experiments have been carried out with low-pressure Hg vapor UV lamps that emit the majority of their light at 254 nm wavelength (Niggli and Rothlisberger, 1988; Cadet and Vigny, 1990; Ruzsicska and Lemaire, 1994; Davies, 1995). Shetlar and Basus (2011) photolyzed uracil in ice using a monochromatic UV radiation (254 and 312 nm), and they showed the formation of anti- and syn-cyclobutane dimers. For these experiments, the UV spectrum for irradiation is not completely representative of the surface of Mars especially for the most energetic photons of the martian UV spectrum (190–254 nm wavelength range). In the present study, uracil was exposed to radiation that more realistically mimics the UV radiation that reaches the martian surface.
2. Materials and Methods
2.1. Uracil sample preparation
Uracil was deposited in the form of a thin and homogenous organic film [about 300 to 800 nm thick according to Saïagh et al. (2015)] by sublimation from solid uracil (Uracil powder, >99%; Sigma-Aldrich) and condensation on optical windows made of magnesium fluoride (MgF2) (Fig. 2). The deposits were prepared by heating the commercial powders of these molecules under secondary vacuum (∼10−5 mbar), which causes the molecules to sublimate and then condense on the window. For this, we used the vacuum sublimation chamber described in the work of Guan et al. (2010). The MgF2 windows were chosen because they do not significantly absorb UV radiation above 180 nm.

Picture of a coating of uracil on a MgF2 window (left) obtained with the sublimation/condensation protocol developed in the laboratory and scheme of the window configuration used during the irradiation experiments (right). The uracil is deposited in a thin layer (white spot) onto a MgF2 optical window. UV photons are not filtered (190–400 nm range) through the optical window before reaching the uracil coating. MgF2, magnesium fluoride.
2.2. UV transmission spectra
UV transmission spectra of the deposit on the MgF2 windows were recorded before simulation with a UV–Vis spectrometer (“Lambda 40”; Perkin–Elmer Instruments) and provided the UV spectrum of the sample in the 200–400 nm wavelength range. Uracil absorbs photons in the 200–280 nm range. These analyses allowed for determination of whether the samples were optically thin (meaning UV transmission is >90% and that almost all the molecules are irradiated at the same time).
2.3. The MOMIE setup
The MOMIE experimental setup allows investigators to irradiate organic samples, within the conditions of the mean temperature (218 ± 2 K) and atmospheric pressure (6 ± 1 mbar) of Mars, with Mars-like UV radiation, and monitors the evolution of their molecular structure as a function of time using Fourier transform infrared spectroscopy (FTIR) (resolution 4 cm−1, 8 scans, spectral domain 4000–800 cm−1). The detailed setup is described by Poch et al. (2013).
The MOMIE experiment consists of a reactor stabilized at Mars' mean surface temperature and pressure, a xenon arc UV lamp (UXL-150SP from LOT-ORIEL) that emits UV photons in the 200 to 400 nm wavelength range, and an FTIR spectrometer (Spectrum 100 from Perkin Elmer). The whole experiment is located inside an N2-purged (≥99.995 vol. % purity from Linde) and overpressurized glove compartment to prevent ozone and water ice formation when running the lamp. For the duration of an experiment, the reactor is maintained at 218 ± 2 K by a cooled fluid circulation. The reactor is connected to a pumping system that maintains a pressure of 6 ± 1 mbar of N2. Ten Kate (2006) showed that the presence a CO2 atmosphere does not impact significantly the evolution of organic molecules.
A typical experiment includes the following: (1) IR and UV absorption spectroscopy to analyze the sample prepared before irradiation to characterize its main molecular functions, assess its capacity to absorb UV radiation in the 200–400 nm wavelength range, and estimate the organic film thickness; (2) irradiation in the MOMIE simulation reactor where a sample can be exposed to UV radiation or monitored by FTIR spectroscopy. A typical experiment alternates UV irradiation with IR spectroscopic monitoring of the same sample, and the sequence is repeated several times. The duration of exposure of the uracil sample is measured, and several FTIR analyses are performed with each experiment. The evolution of the intensity of absorption bands in the IR spectra allows qualitative and quantitative monitoring of the sample. Four samples of pure uracil were studied for total exposure times of 18, 2000, 21,000, and 66,000 min.
2.4. UV lamp flux measurement
It is important to characterize the flux of the UV lamp to determine its similarity to the irradiance on the surface of Mars. Furthermore, these are essential data for the calculation of the kinetic parameters of the reactions that occur during the experiments. We used a radio-calibrated UV spectrometer to measure the lamp irradiance. The detailed method is presented in the work of Poch et al. (2013). The measured irradiance is shown in Fig. 3, compared with two Mars surface irradiance simulations (Cockell et al., 2000; Patel et al., 2002). The flux of the MOMIE UV lamp is relatively close to the estimates that correspond to the irradiance of the surface of Mars at noon in equatorial regions with low dust concentration and no ozone in the atmosphere. The total irradiances in the 200–400 nm wavelength range, calculated for several Mars surface irradiances at noon, vary from 2 to 55 W/m2 depending on the latitude, dust concentration, and ozone concentration in the atmosphere (Cockell et al., 2000; Patel et al., 2002). The REMS instrument onboard the Curiosity rover measured total irradiances from 16 to 22 W/m2 in the range 230–350 nm. The total irradiance (200–400 nm wavelength range) in the MOMIE experiment is 29 ± 3 W/m2. The MOMIE UV lamp is then a good simulation of Mars surface irradiance.
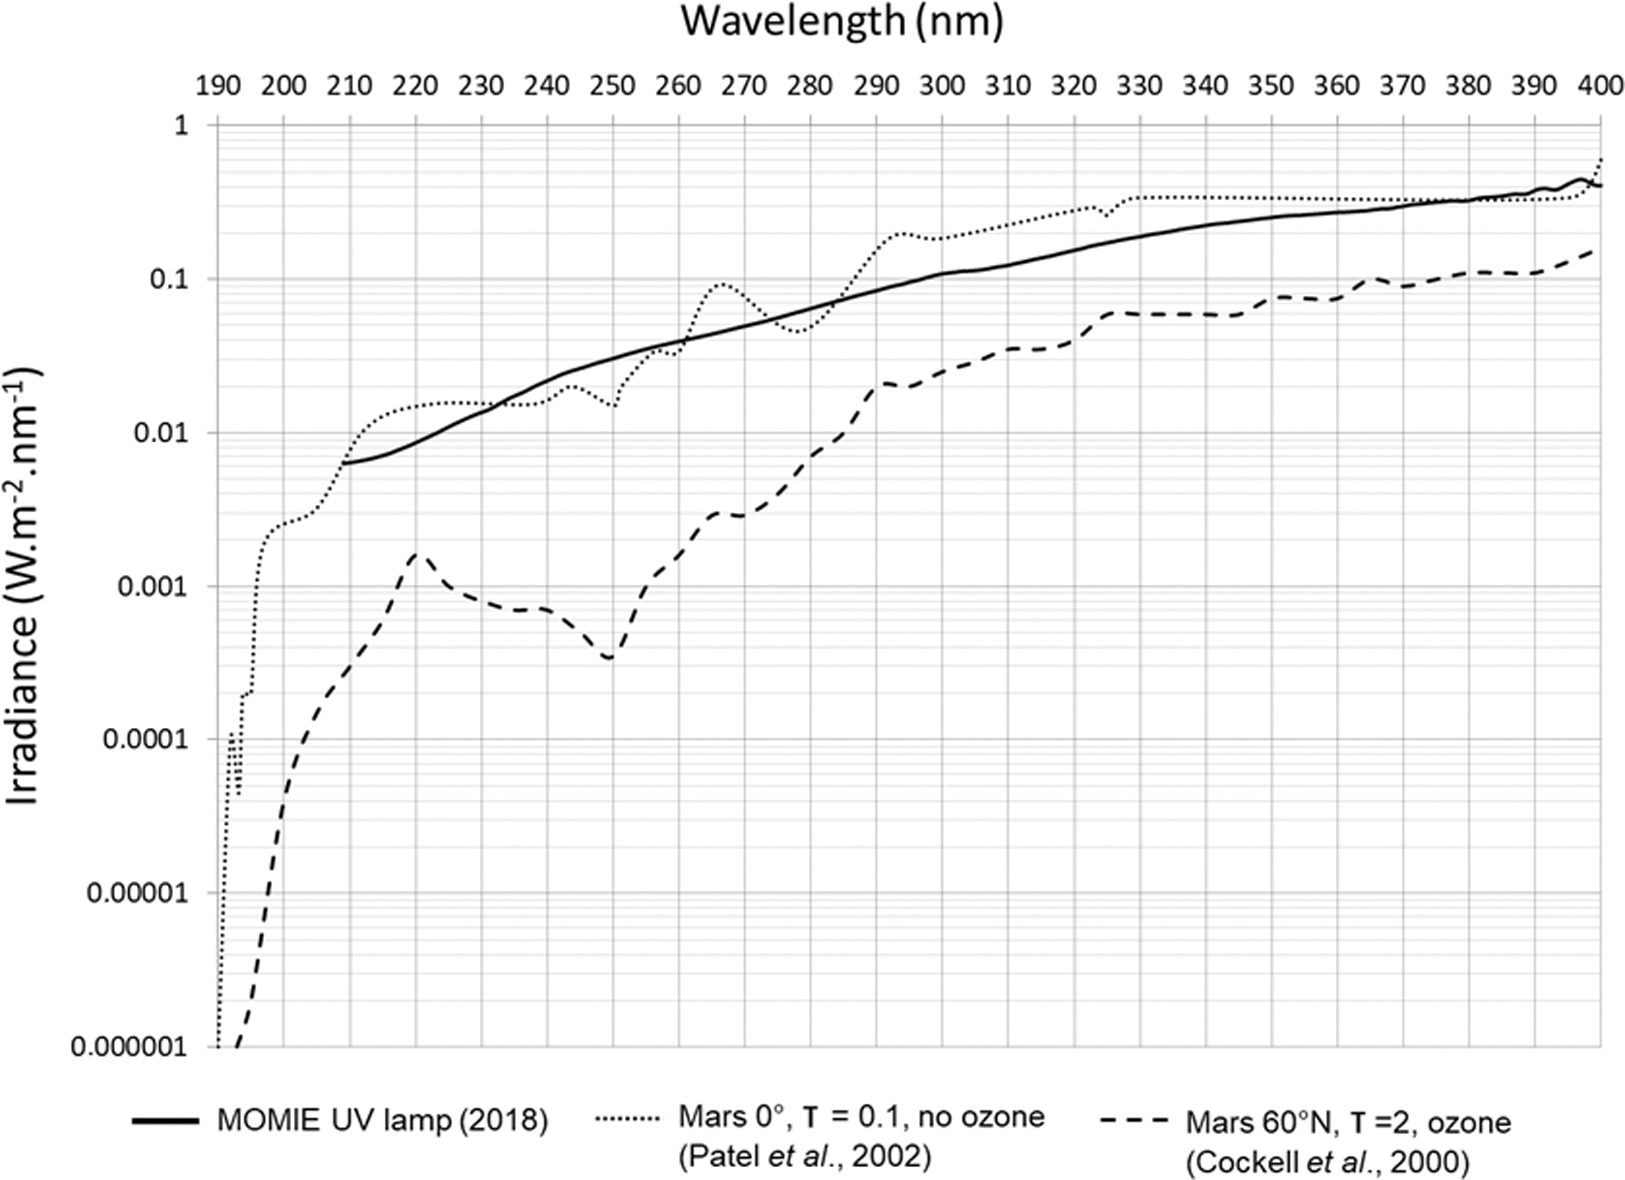
Comparison of the irradiance of the MOMIE UV lamp measured in the laboratory (solid line) and of two theoretical UV irradiance spectra on the surface of Mars (dotted lines) for two extreme scenarios: (1) during the northern summer for a low dust loading (τ = 0.1), at the equator (0°), no ozone, and local noon [taken from Patel et al. (2002)]; (2) in spring (vernal equinox) for a dusty day (τ = 2.0), ozone, at 60°N, and local noon [taken from Cockell et al. (2000)]. MOMIE, Mars Organic Matter Irradiation and Evolution.
2.5. Experimental quantum efficiency of photodecomposition (Φ)
To quantitatively characterize the evolution of uracil under Mars-like radiation conditions, the experimental quantum efficiency of photodecomposition (Φ) was calculated from experimental data. The experimental quantum efficiency of photodecomposition of a photo-induced process is the number of process occurrences per absorbed photons (molecule/photon). They were calculated by using the IR spectra of uracil that were regularly recorded throughout the irradiation experiment, the lamp irradiance, and the UV absorption spectrum of the uracil samples. Since the deposits are not optically thin (meaning UV transmission in the range 200–300 nm is <90% based on the UV transmission spectra), we compared the experimental quantum efficiency of photodecomposition between the samples. If the UV transmission is below 90%, then the molecules of uracil at the top of the sample and directly irradiated will absorb more UV photons compared with the molecules at the bottom of the sample. This shielding effect is responsible for different kinetic values (half-life time for example) depending on the thickness of the sample. To avoid this effect, we chose to work with an experimental quantum efficiency of photodecomposition for quantitative data and comparison between the samples and with other organic molecules we have studied under martian UV irradiation.
The IR spectrum of a solid film of uracil and the corresponding band assignments are presented in Fig. 4 and Table 1. For uracil-specific absorption bands, their integrated absorbance (absorbance/cm) is proportional to the number of uracil molecules present in the sample. We were able to estimate the number of molecules of uracil present in the samples because we measured the thickness of the uracil deposit by interferometric microscopy and optical profilometry as described in the work of Cottin et al. (2012). Knowing the surface of the sample and taking into account the volumetric mass density of uracil (1.32 g/cm3), we determined the number of uracil molecules. Then, we used the method described by Saïagh et al. (2015) to follow the evolution of uracil. They measured infrared bands over a large wavenumber range for several samples of pure uracil with different thicknesses determined by interferometric microscopy and optical profilometry. They observed a linear correlation between the thickness and the infrared absorbance (Saïagh et al., 2015). To follow uracil evolution, we calculated integrated absorbance on the band labeled “m,” the absorption band assigned to the uracil cycle stretching mode (Fig. 4). The integrated absorbance used as reference (A 0) was measured before starting the irradiation of the sample, at Mars' mean temperature (218 ± 2 K) and pressure (6 ± 1 mbar). Several analyses were performed after several irradiation times (t), and the corresponding integrated absorbances were calculated (At ).
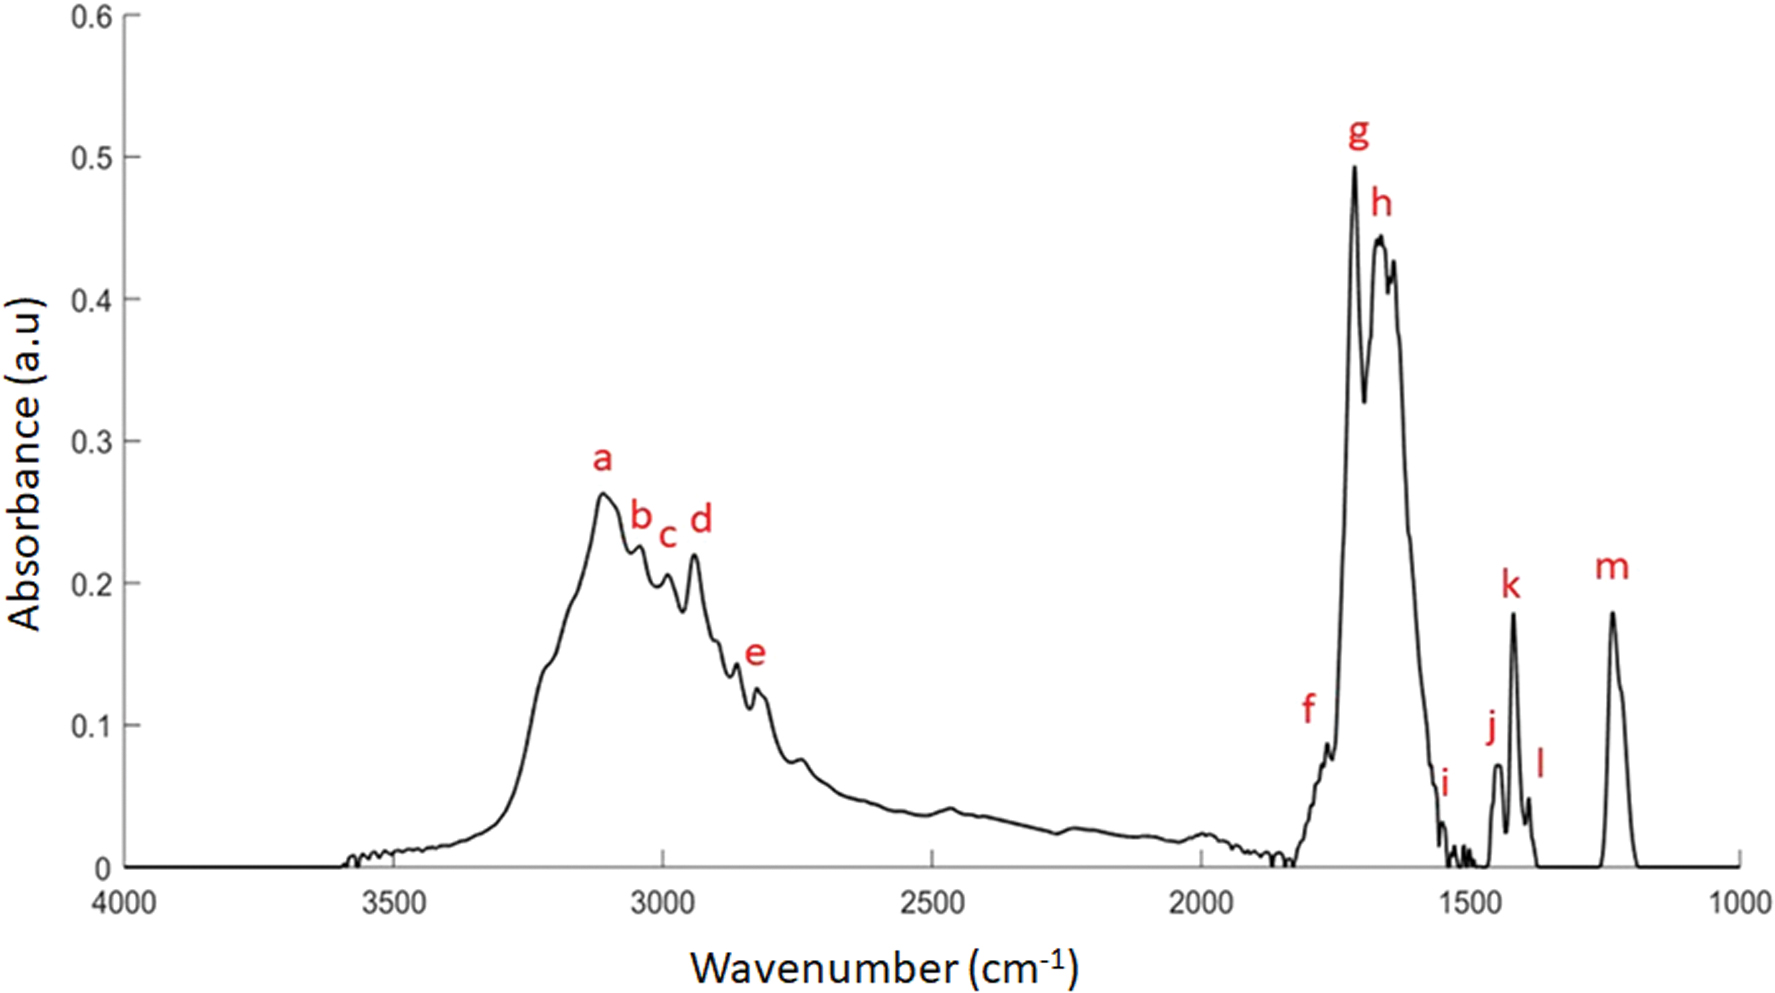
Infrared spectrum of a solid thin film of uracil (4000–1000 cm−1 wave number range, resolution 4 cm−1) before irradiation. The labels are presented in Table 1. a.u., arbitrary unit. Color images are available online.
Spectral Assignments of the Absorption Bands Present in the Infrared Spectrum of Uracil
ν, stretching; δ, bending; s, symmetric; as, asymmetric.
The relative absorbance (At /A 0) of the band labeled “m” is plotted as a function of the sample irradiation time (Fig. 7). The number of transformed uracil molecules can be determined from the sample thickness for all exposure times (t) deduced from the FTIR analysis according to the study of Saïagh et al. (2015).
The number of molecules in the sample (Nt
) is calculated using the following Eq. 1:
where N a is Avogadro constant (mol−1), et is sample thickness (m), r is uracil deposit radius (m), μ ura is uracil volumetric mass density (g/m3), and M ura is uracil molar mass (g/mol).
UV transmission (200–400 nm) was measured for uracil samples. The uracil samples absorb UV in the 200–400 nm wavelength range but mainly photons from 200 to 280 nm. The experimental quantum efficiency of photodecomposition is calculated using the following Eq. 2, assuming that all the photons from 200 to 280 nm are absorbed and able to induce photoreactions.
where Φ exp is experimental quantum efficiency of photodecomposition (molecule/photon), N 0 is number of molecules in the sample before any irradiation, Nt is number of molecules in the sample after an irradiation time t, F 200–280 is photon flux in the range 200–280 nm (photons/s).
2.6. Ultra high-performance liquid chromatography–high-resolution mass spectrometry analyses
The solid samples were analyzed by ultra high-performance liquid chromatography (UHPLC) coupled with high-resolution mass spectrometry (HRMS) to identify the compounds potentially produced during the experiments. Nonexposed and exposed samples were analyzed for comparison.
The samples were completely solubilized in ultrapure H2O and injected automatically by using an UltiMate 3000 RSLC system (Thermo Scientific) either as a simple injector for HRMS analysis in flow injection analysis (FIA) mode or in combination with Acquity UPLC HSS T3 chromatographic columns (2.1 × 100 mm; 1.8 μm) (Waters) to perform a UHPLC separation before analysis by mass spectrometry. HRMS spectra were recorded with a maXis Time-of-Flight mass spectrometer (Bruker) equipped with an Electrospray Ionization source. Reference levels for all analyses were made by using blank MgF2 windows.
3. Results
3.1. FTIR results
For the samples monitored by absorption FTIR spectroscopy, the absorption bands specific to uracil decrease continuously with irradiation time. This indicates that uracil is not stable when directly exposed to Mars-like UV radiation conditions. Moreover, formation and/or increase of other absorption bands are observed, which indicates that new chemical functions and, thus, new compounds were produced. Figure 5 shows the IR absorption spectra of the sample initially and after 15 and 1260 min of irradiation. Table 2 shows their assigned specific chemical functions.
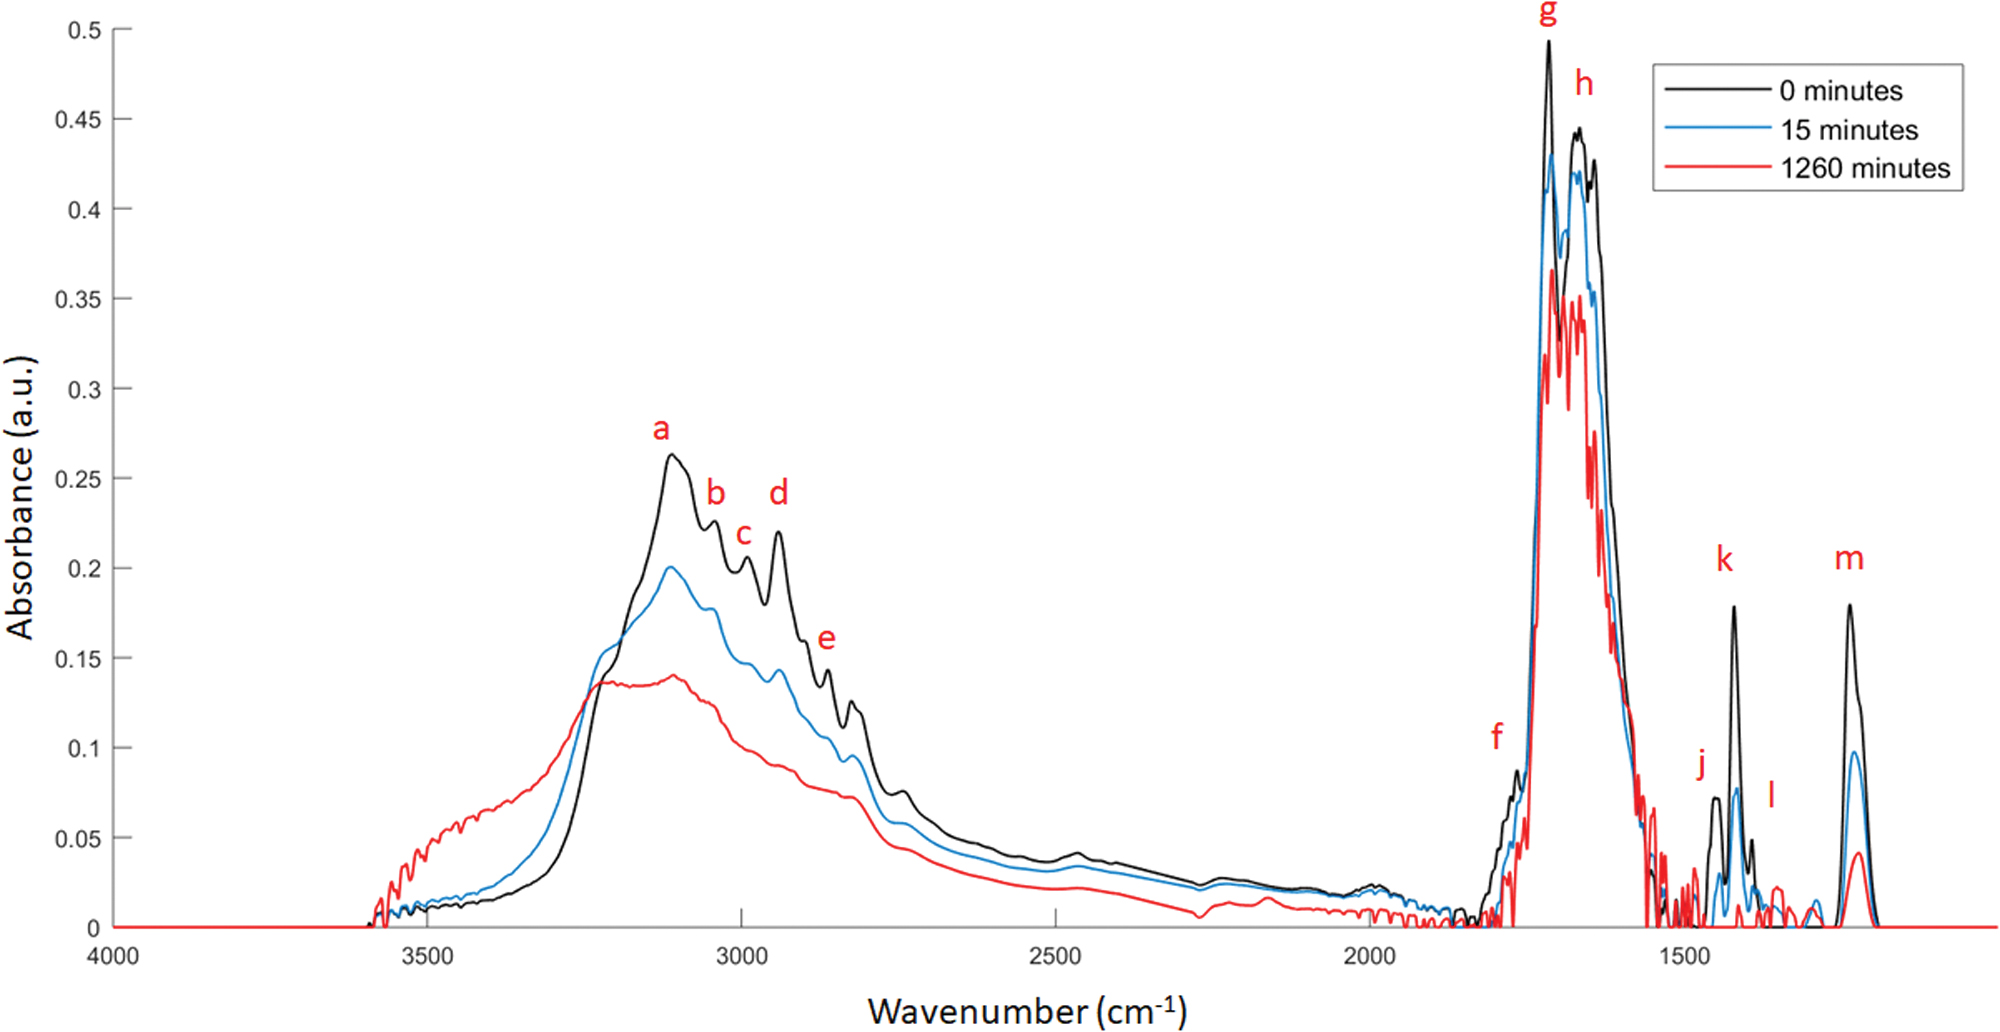
IR spectra of the same sample of uracil as for Fig. 4 (4000–1000 cm−1 wave number range, resolution 4 cm−1) before irradiation (in top) and measured after 15 min (in middle) and 1260 min (in bottom) of the irradiation experiment. The labels are presented in Tables 1 and 2. We have presented only three IR spectra for clarity. IR, infrared. Color images are available online.
Spectral Assignments of the Infrared Absorption Bands of the Products
All uracil-specific absorption bands decrease continuously throughout the time frame of experiment (bands labeled “a” to “m”), which means that uracil molecules were disappearing from the sample. Bands labeled “1” to “10” appear and increase throughout the irradiation of the sample. Bands labeled “1,” “5,” “6,” “7,” and “9,” assigned to O-H, N-H, C-N, and C-H stretching, continuously increase, whereas the band labeled “8,” which is also assigned to C-H and C-N stretching, first increases but then decreases. Bands labeled “2,” “3,” “4,” and “10,” attributed to C-O stretching, first increase and then decrease as well. It seems that compounds with C-O functions were formed in the first minutes of the experiment (0–60 min) and then degraded or transformed. It is possible that they were degraded into compounds with C-H, C-N, and N-H that accumulated, which would explain the constant increase for these bands.
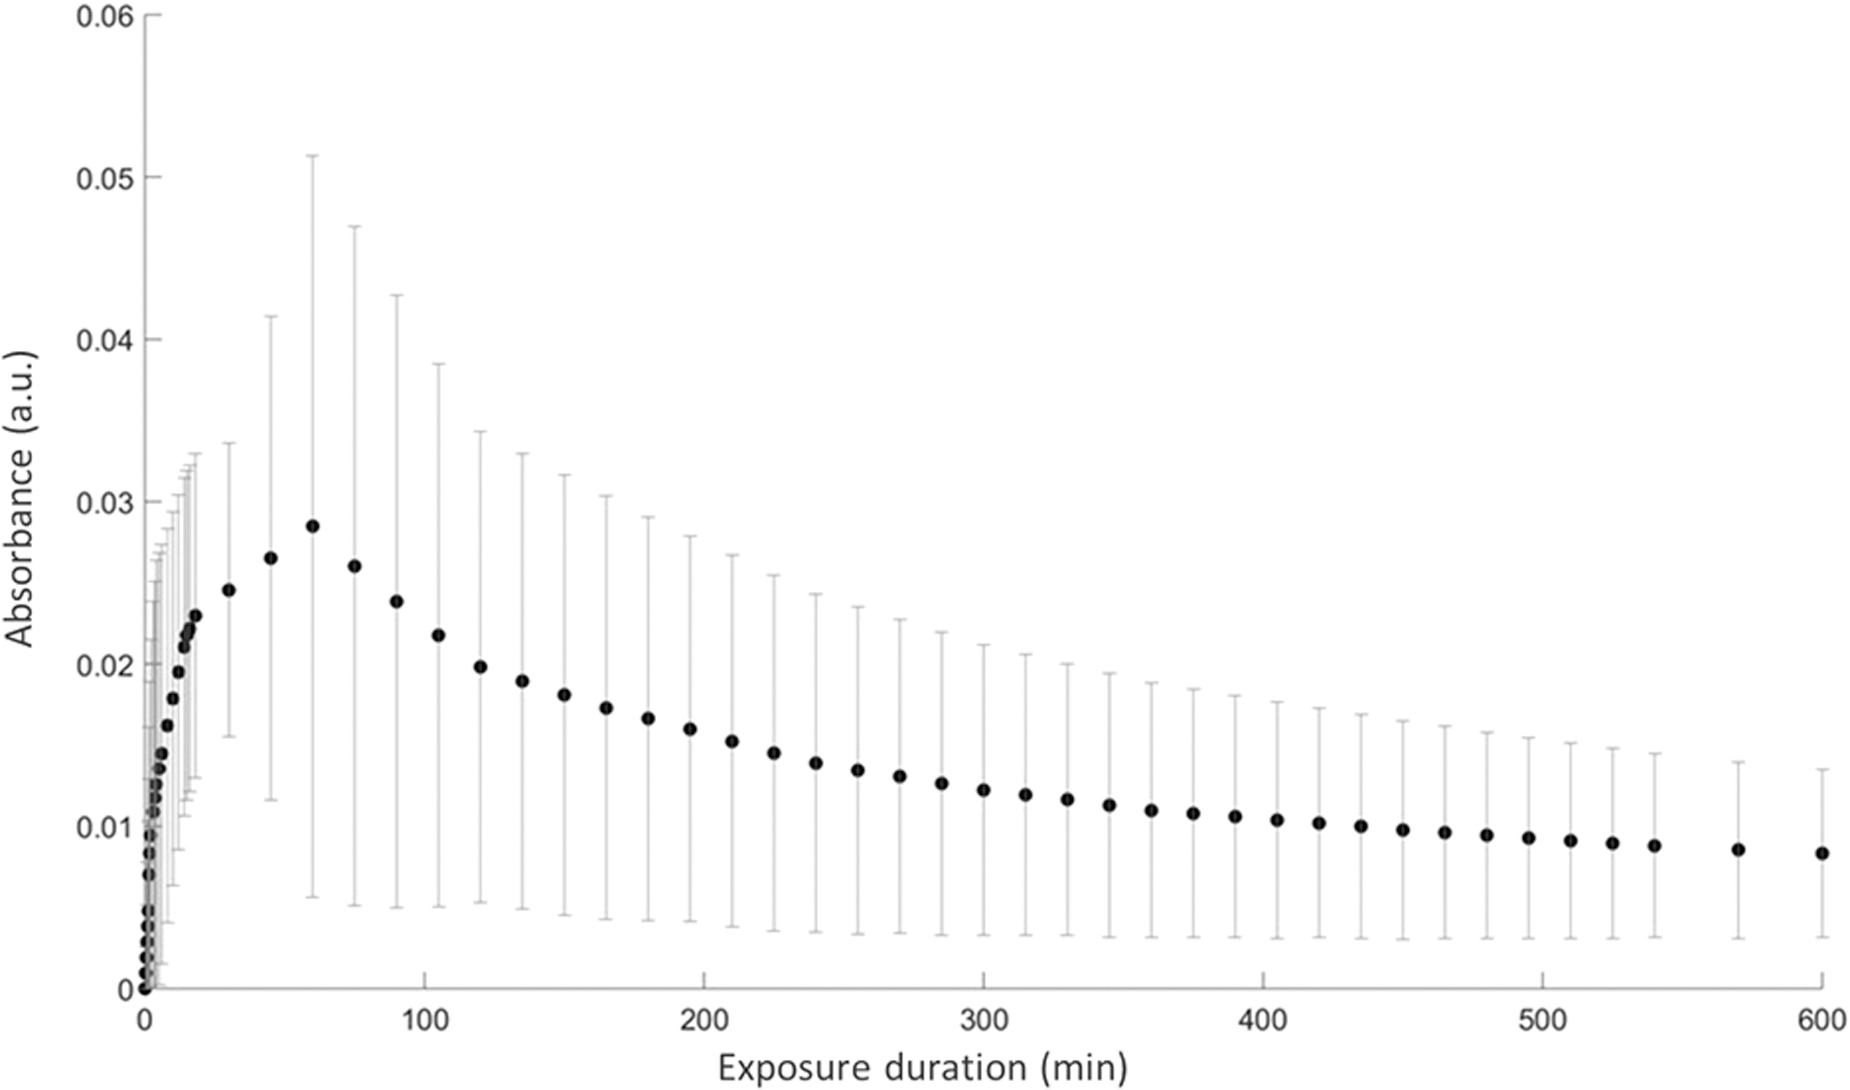
The relative absorption (At /A0) of the band labeled “m,” attributed to the uracil cycle stretching, is plotted as a function of the exposure time (Fig. 6). The relative absorption decreases following two trends: first, quickly from 0 to 50 min, then very slowly from 50 min until the end of the experiments. The first trend shows that uracil quickly transforms into new photoproducts. The subsequent trend shows that these photoproducts (1) may influence the IR absorbance in the range being monitored, which contributes to the absorption of the band labeled “m” and (2) absorb UV photons in the 200–400 wavelength range, which protects the underlying uracil molecules from UV radiation, slowing down its transformation.
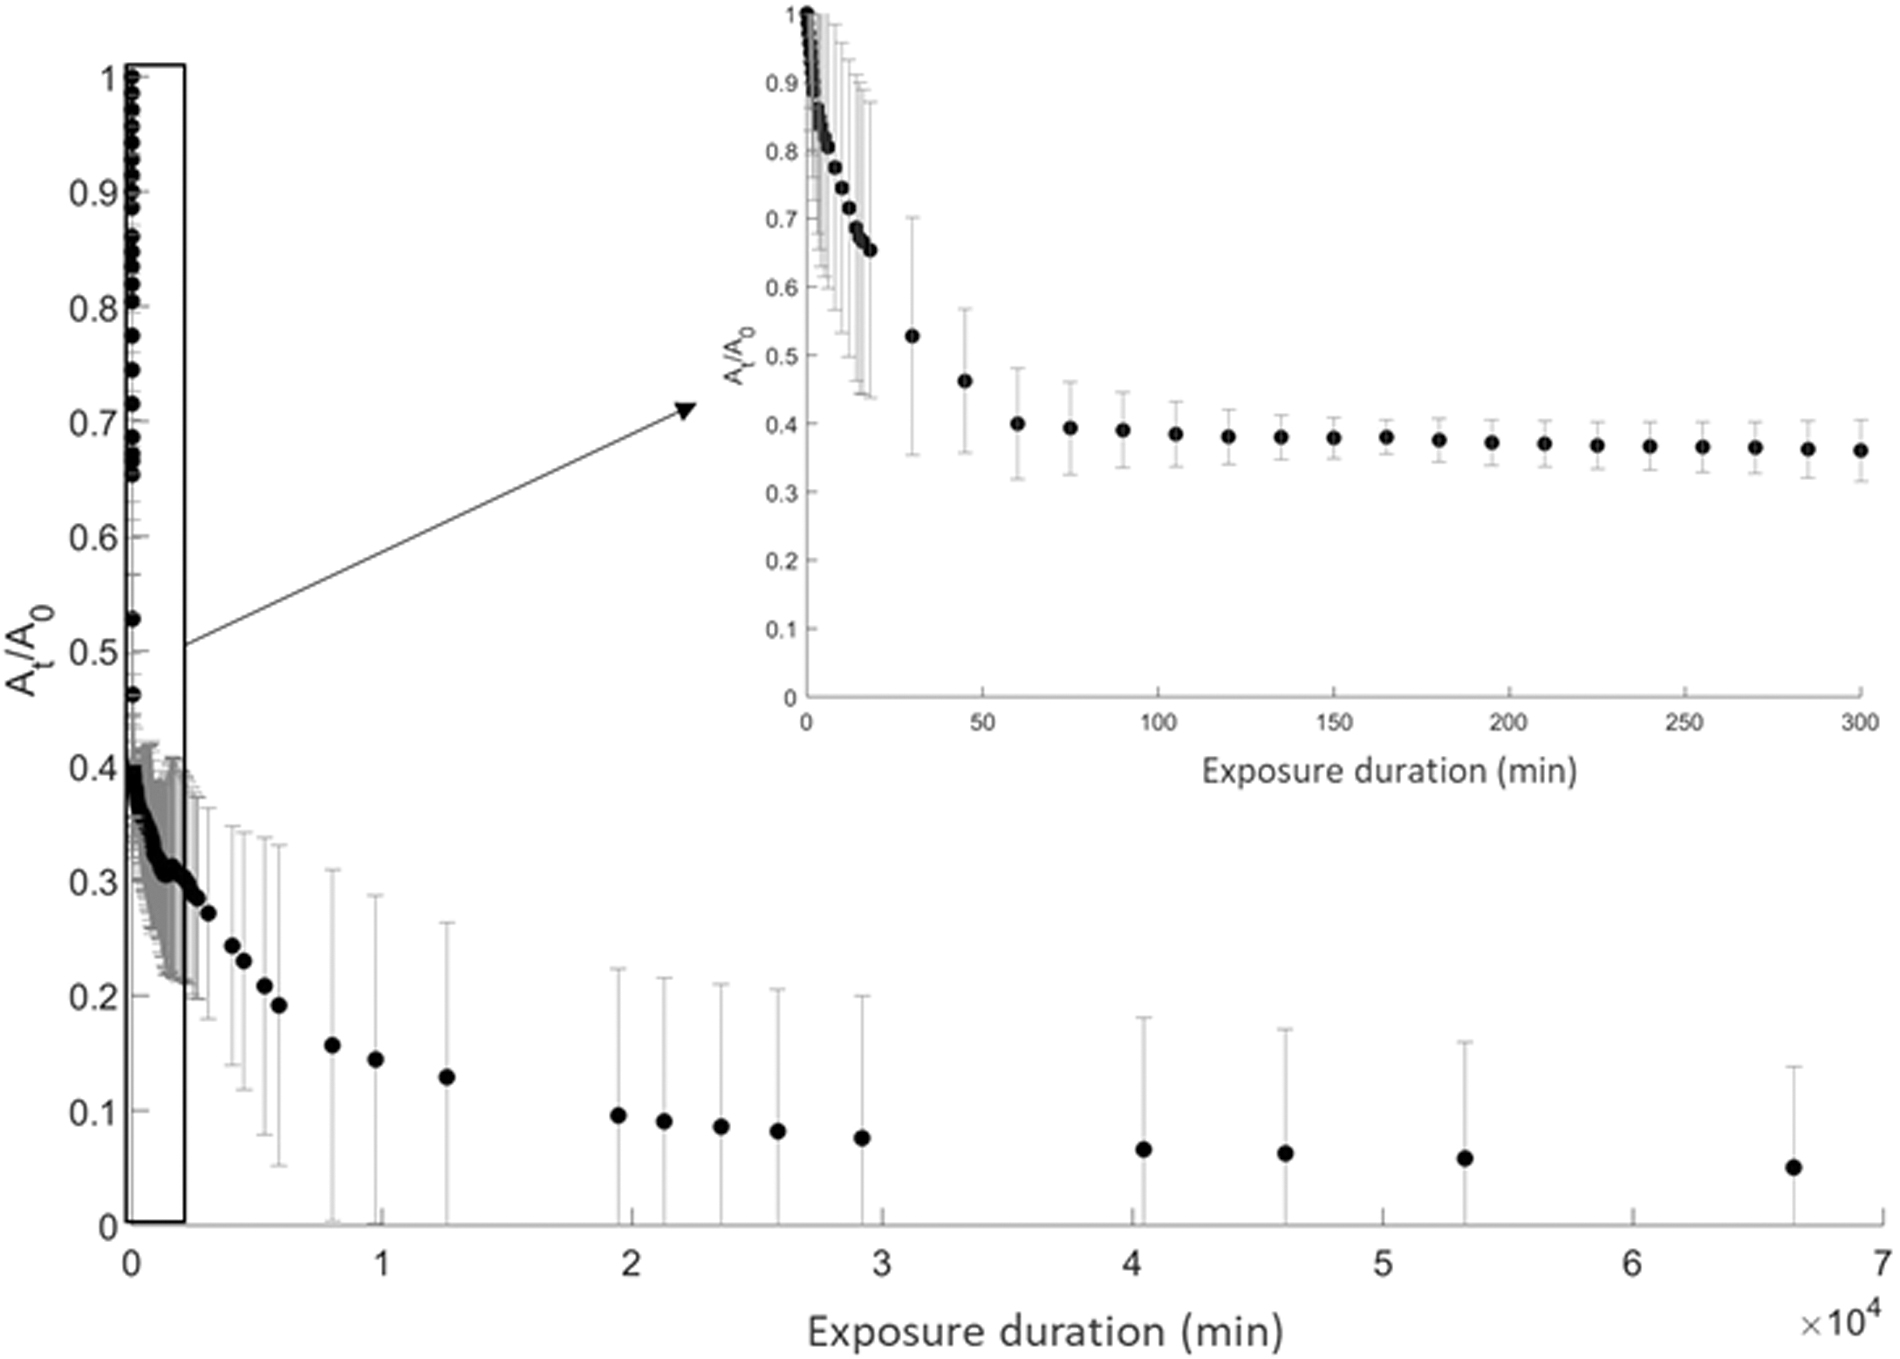
Evolution of uracil for 66,000 min in the MOMIE experiment simulating the martian UV environment. The relative absorption (At /A 0) of the band labeled “m,” attributed to the stretching of the uracil cycle (Table 1), is plotted as a function of the exposure time. The error bars (σ) are based on the results of the four uracil samples studied with different thicknesses and intra-sample heterogeneity, including the thickness differences between the center and the periphery of the sample [based on Saïagh et al. (2015)].
The evolution of the absorbance of the band labeled “10” is also followed (Fig. 7), because it corresponds to a C-O simple band, not present in uracil molecules, and therefore can be attributed to uracil photoproducts. C-O absorbance begins to increase in the first minutes of exposure to Mars-like UV radiation and continues until 50 min, and then, it slowly decreases. This shows that the photoproducts were formed within the first minutes of exposure and were then slowly photodegraded.
Evolution of the absorbance of the IR band labeled “10” corresponding to the C-O simple band present in the photoproducts plotted as a function of the exposure time (Table 2). The error bars (σ) are based on the results of the four uracil samples studied with different thicknesses and intra-sample heterogeneity, including the thickness differences between the center and periphery of the sample [based on Saïagh et al. (2015)].
3.2. FIA-HRMS results
FIA-HRMS analyses allowed for the identification of uracil photoproducts under Mars-like radiation conditions. The mass spectra of the unexposed and exposed uracil samples are presented in Figs. 8 and 9. Unexposed uracil samples show a major ion with mass-to-charge ratio (m/z) 113.0346, corresponding to the [M+H]+ ion of the uracil molecule. The exposed uracil samples show two new major ions with m/z 207.0513 and m/z 225.0620, two [M+H]+ ions of uracil photoproducts under Mars-like UV radiation conditions. These ions are observed for samples irradiated for more than the equivalent of 40 days of Mars radiation exposure. Other ions are observed in the background of our samples but are common with the MgF2 reference. These ions are contaminants.
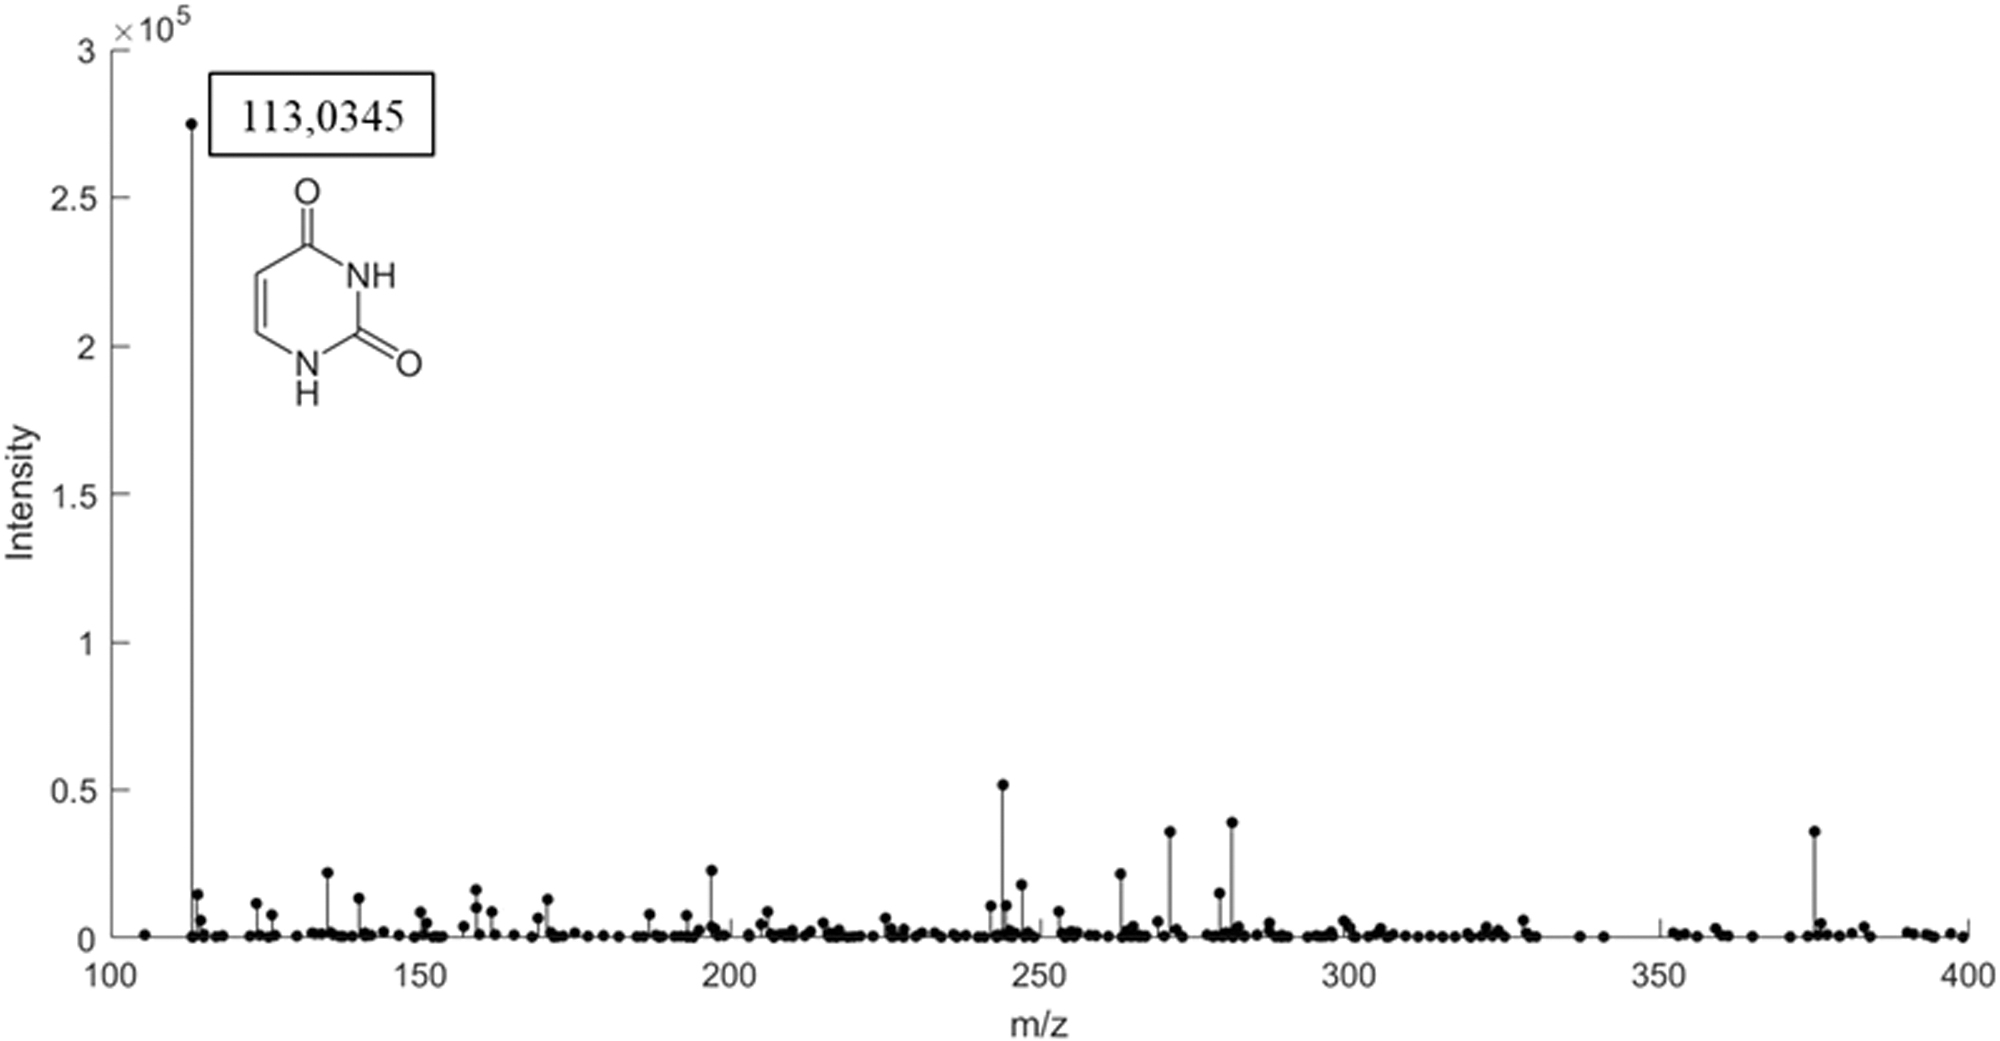
FIA-HRMS mass spectrum of an unexposed solid uracil sample. This sample shows a major ion with m/z 113.0346, corresponding to the [M+H]+ ion of the uracil molecule. The other masses are present in the reference (MgF2 window) and are contaminants. FIA, flow injection analysis; HRMS, high-resolution mass spectrometry; m/z, mass-to-charge ratio.
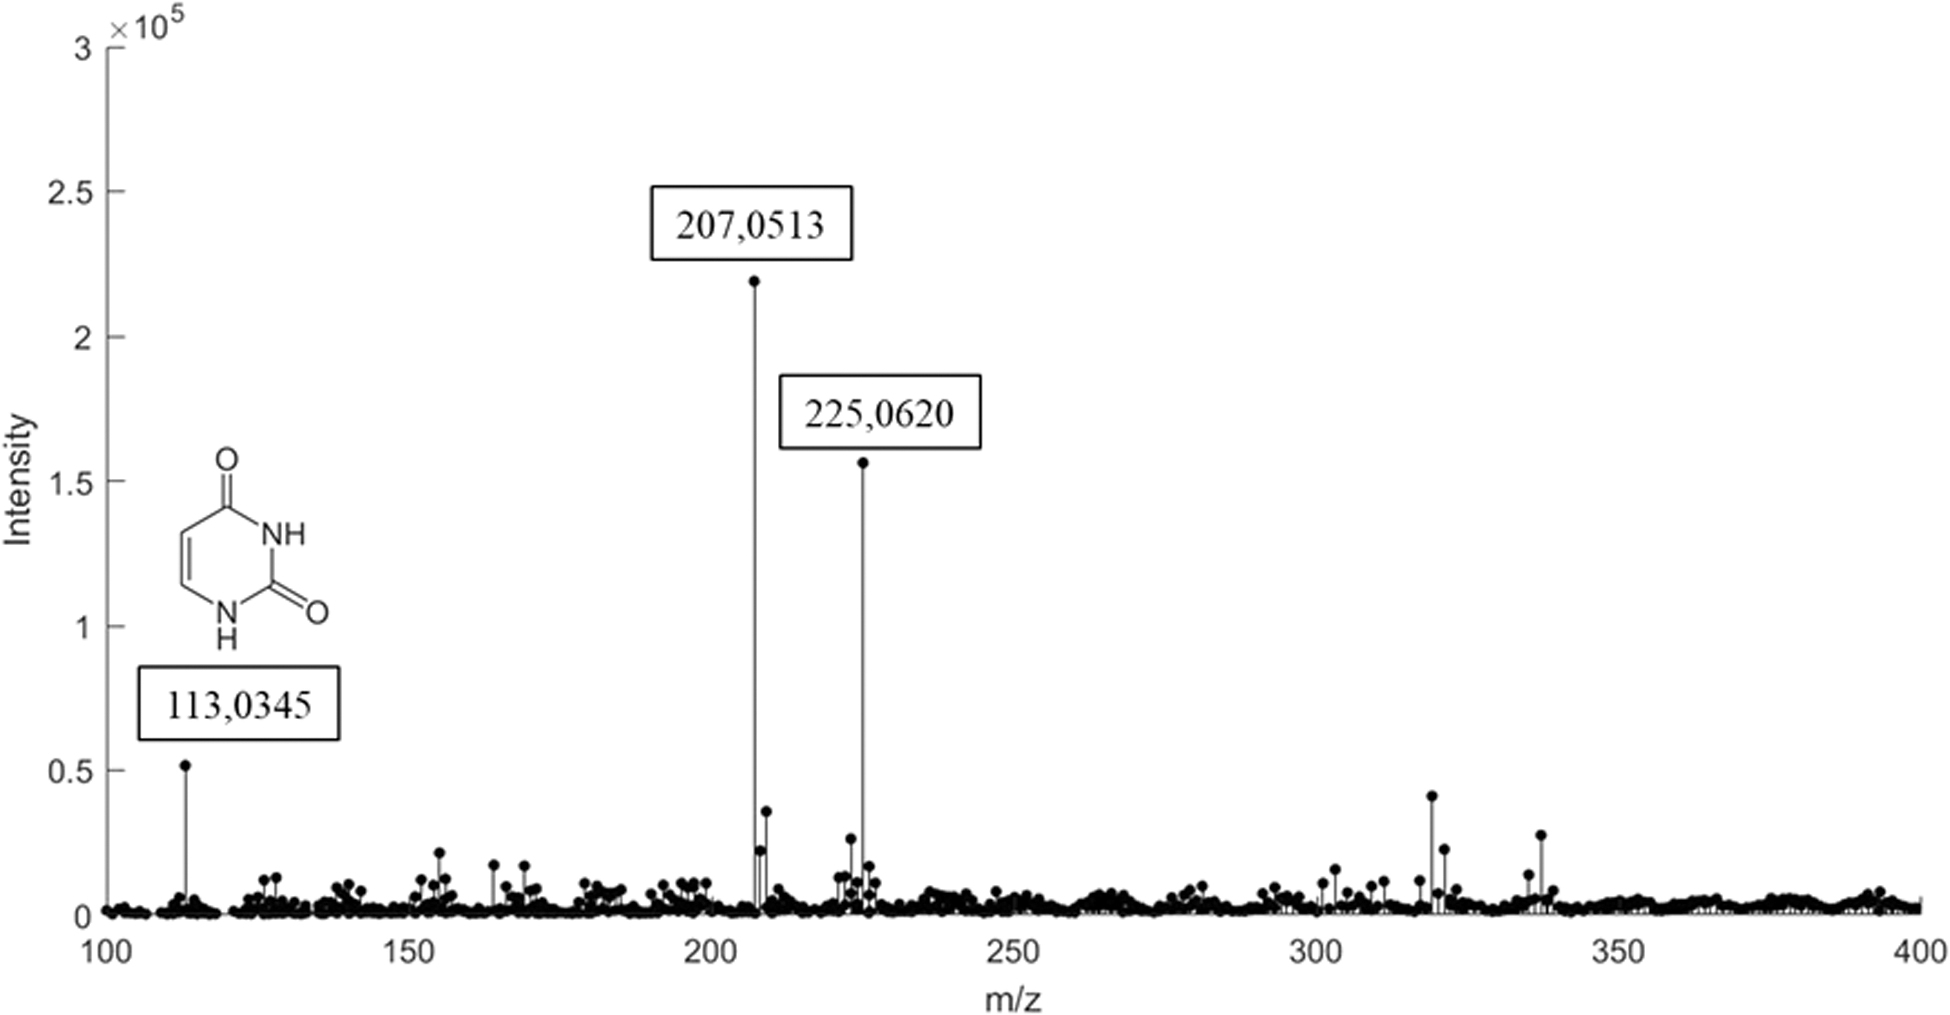
FIA-HRMS mass spectrum of a solid uracil sample after a 40 days of UV exposure to Mars-like UV radiation. The exposed uracil samples show two new major ions with m/z 207.0513 and m/z 225.0620, to [M+H]+ ions from uracil photoproducts. The other masses are present in the reference (MgF2 window) and are contaminants.
3.3. UHPLC-HRMS results
Unexposed and exposed samples were also analyzed by UHPLC-HRMS. The UHPLC separation shows that the unexposed uracil samples are composed only of one major compound, which is [M+H]+ uracil (m/z 113.0345). [2M+H]+ uracil clusters of two uracil molecules (m/z 225.0620) were also formed in the instrument for unexposed uracil samples (Fig. 10). Uracil and its cluster co-elute. A cluster can form by UHPLC-HRMS during ionization, by competition of different molecules to capture the H+ protons. This means that noncovalent associations of two molecules with close proton affinity without being covalently bound can be detected together during mass analysis. This also explains the co-elution of uracil and its cluster because they have the same polarity. The exposed uracil samples show chromatographic peaks that correspond to the ions of four photoproducts (labeled from 1′ to 4′ in Fig. 10). The peaks labeled 1′ and 2′ contribute to the ions with m/z 225.0620 and the peaks labeled 3′and 4′ to the ions with m/z 207.0513. Uracil was also detected in exposed samples (m/z 113.0345). We also detected [2M+H]+ uracil clusters of two uracil molecules (m/z 225.0620) for the exposed samples because the uracil was still present and they were formed during the UHPLC-HRMS analysis. We observed the co-elution of uracil and its cluster.
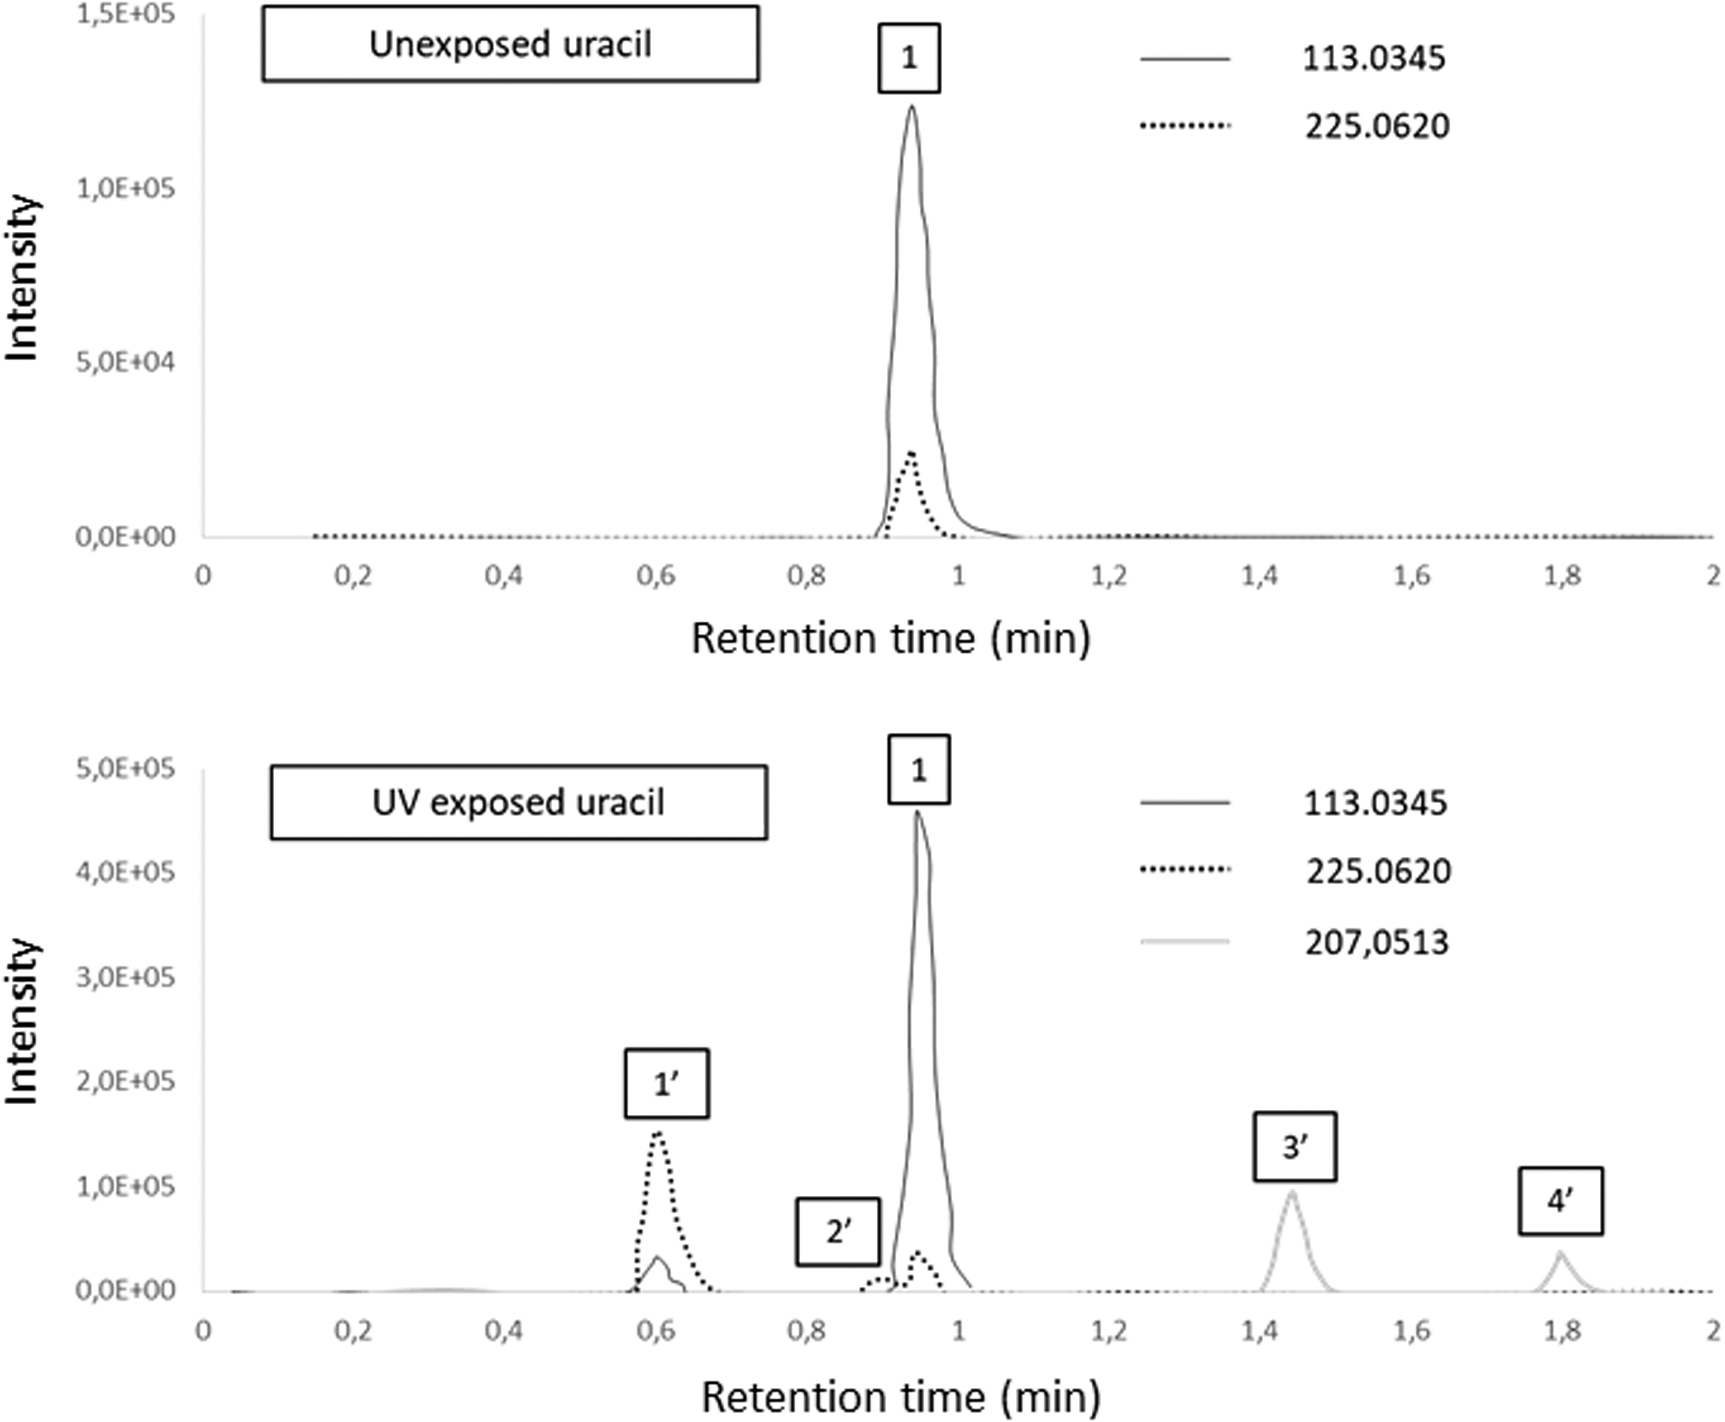
Chromatograms of two uracil samples: an unexposed uracil sample (top) and a uracil sample exposed to martian irradiation for 40 days (bottom). The exposed uracil samples show four new peaks corresponding to four photoproducts (labeled from 1′ to 4′). Peaks labeled 1′ and 2′ contribute to ion with m/z 225.0620 and peaks labeled 3′ and 4′ to ion with m/z 207.0513. Uracil is also detected in exposed samples, labeled 1.
4. Discussion
4.1. Identification of photoproducts
By comparing hypothetical and experimental ions, we are able to propose a chemical formula for ions with m/z 225.0620 and 207.0513. The ion with m/z 225.0620 can be explained by the photoproduction of at least two forms of dimers (two isomers of C8H8N4O4). It is possible that the syn- and anti-dimers suggested by Shetlar and Basus (2011) are formed but not resolved by chromatography. We also suggest two isomeric photoproducts that correspond to dimers (C8H6N4O3) at m/z 207.0513, in their anti- and syn-forms, even if they are not separated by chromatography. Table 3 compares the hypothetical and experimental ions of these compounds and shows that the relative error is lower than the instrumental accuracy (2 ppm at m/z 200). This shows a good correlation between hypothetical and experimental ions. All the suggested dimer structures are presented in Table 3. No other ions that could be attributed to trimers or oligomers were detected above the detection limit of HRMS.
Molecular Structures of Photoproduct as Deduced from Experimental Masses
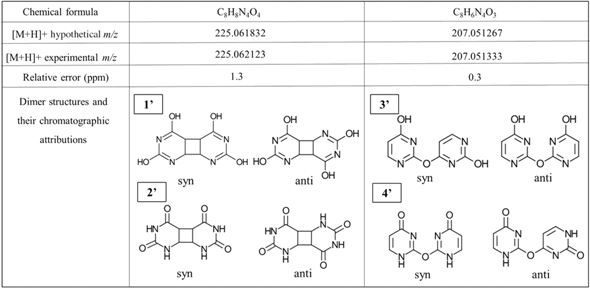
The relative errors between the [M+H]+ hypothetical m/z and [M+H]+ experimental m/z is less than the instrumental precision (2 ppm at m/z 200)
m/z, mass-to-charge ratio.
The dimer ion with m/z 207.0513 (Table 3), which was produced after UV irradiation, explains the appearance and the increase of IR absorbance around the band labeled “10” (C-O stretching mode). By combining the FTIR and UHPLC-HRMS analyses, we note that the photoproducts formed rapidly in <15 min of UV irradiation in the experiment (i.e., according to the appearance of the C-O stretching mode, which corresponds to the band labeled “10” in Fig. 7) and persisted for >40 days under Mars-like UV radiation conditions, according to their detection by HRMS analyses (Fig. 9). The formation of the alcohol dimer (m/z 225.0620) can also explain the continuous increase in the O-H absorbance signal (band labeled “1” in Fig. 5).
4.2. Kinetic of photodegradation
The experimental efficiency of photodecomposition Φ exp represents the photodegradation rate of a molecule when it is exposed to UV radiation in our experiments. The higher its value, the sooner the molecules will be photodegraded. For uracil, Φ exp is calculated from the first minutes of its evolution to avoid the influence of photoproducts, and it is found to be 0.16 ± 0.14 molecule/photon. This experimental quantum efficiency of photodecomposition is very high and confirms the rapid photodegradation of uracil in our experiments. However, uracil is still detected in a sample irradiated for 40 days. We assume that the photoproducts absorb UV photons and provide a shielding effect for the remaining uracil molecules at the bottom of the samples (no longer exposed to UV radiation). We compared Φ exp of uracil with that of other organic molecules that we previously studied with the MOMIE setup and also with low earth orbit (LEO) experiments (Poch et al., 2014; Stalport et al., 2019). Both LEO and laboratory experiments show that most of the organic compounds are photodegraded and do not produce solid, stable, or metastable compounds. One conclusion of these studies is that it seems unlikely that photodegraded organic compounds will accumulate in the first centimeters of the Mars surface. Φ exp are calculated for glycine (∼6 to 7 × 10⁻³ molecule/photon), glycine in the presence of an iron-rich phase (∼8 × 10⁻³ molecule/photon), adenine (∼0.2 to 1 × 10⁻⁴ molecule/photon), adenine in the presence of an iron-rich phase (∼1 × 10⁻⁴ molecule/photon), and chrysene (∼2 to 5 × 10⁻⁵ molecule/photon). The comparison of these data and Φ exp of uracil confirms a very rapid transformation of this molecule in a simulated martian environment. Indeed, the Φ exp of the most photodegraded organic molecule (glycine) is at least 20 times lower than Φ exp of uracil. Consequently, the presence of uracil in the first centimeters of the martian regolith seems very unlikely. However, FTIR and UHPLC-HRMS analyses show that uracil produces more metastable organic compounds. Future works will focus on the UV irradiation of these dimers to determine their experimental efficiency of photodecomposition.
5. Conclusion
Uracil was studied under Mars-like UV radiation with the MOMIE laboratory setup to estimate its preservation capacity under these conditions. The FTIR results show that uracil is destroyed under Mars-like environmental conditions and forms new products. The experimental efficiency of photodecomposition of uracil, Φ exp, is found to be 0.16 ± 0.14 molecule/photon and confirms its rapid photodegradation and transformation. The results of the UHPLC-HRMS analysis show that at least four different types of dimers are produced from the first minutes of the UV irradiation experiments and are then photodegraded, although they still persist after >40 days of irradiation. Based on our results and previous studies, up to eight dimers could have formed, but they were not separated by UHPLC analyses. We propose molecular structures for these dimers. These molecules should be sought in samples from the soil of Mars during present and future Mars missions because they are likely to be formed and better preserved in the martian environment. If these dimers were to be detected on the surface of Mars, we could deduce that uracil was initially present as a parent molecule. Our future works will focus directly on the UV irradiation of these dimers in our laboratory experiments. We will also study their preservation in the presence of oxidizing species such as perchlorates and/or iron-rich mineral phase. The study of uracil and its photoproducts has shown encouraging results, but these must be tested under even more representative martian conditions that take into account the potential synergy between UV radiation and these oxidizing species. We began to explore this line of research by adding perchlorates to organic films containing species relevant to Mars, such as uracil, followed by UV irradiation under Mars-like conditions. This work is part of an effort to globally model the evolution of organic matter on Mars and find resistant organic molecules that could be detected on Mars.
Our team is also involved in the Exomars 2022 mission and the Mars Organic Molecule Analyzer (MOMA) instrument (Goesmann et al., 2017). This instrument couples a laser desorption, a gas chromatograph (GC), and a mass spectrometer (MS) and will analyze samples from the surface/subsurface of Mars up to 2 m deep (Vago et al., 2017). In preparation of this mission, we will study with laboratory test beds (similar to the MOMA flight instrument) different samples of organic molecules and martian analogues that could be present on Mars. Some of these samples, such as uracil, will be exposed to Mars-like UV radiation with the MOMIE experiments. As they are synthesized in our laboratory, the compounds present in the samples could also be separated by the GC of the test beds and detected and identified by the MS. The final goal will be to obtain a GCMS database that we can compare with in situ data for future identification of organic matter at Mars.
Footnotes
Acknowledgments
We would like to thank the reviewers for their thoughtful comments and efforts toward improving our article.
Author Disclosure Statement
No competing financial interests exist.
Funding Information
This study was supported by the DIM ACAV (Domaine d'Intéret Majeur—Astrophysique et Conditions de l'Apparition de la Vie) and the French Space Agency “Centre National d'Etudes Spatiales” (CNES). Name of the project: EMOVISM - Evolution de la matière organique lors de son voyage interplanétaire puis à la surface de mars.
Abbreviations Used
Associate Editor: Petra Rettberg