
Abstract
A prototype rover carrying an astrobiology payload was developed and deployed at analog field sites to mature generalized system architectures capable of searching for biosignatures in extreme terrain across the Solar System. Specifically, the four-legged Limbed Excursion Mechanical Utility Robot (LEMUR) 3 climbing robot with microspine grippers carried three instruments: a micro-X-ray fluorescence instrument based on the Mars 2020 mission's Planetary Instrument for X-ray Lithochemistry provided elemental chemistry; a deep-ultraviolet fluorescence instrument based on Mars 2020's Scanning Habitable Environments with Raman and Luminescence for Organics and Chemicals mapped organics in bacterial communities on opaque substrates; and a near-infrared acousto-optic tunable filter-based point spectrometer identified minerals and organics in the 1.6–3.6 μm range. The rover also carried a light detection and ranging and a color camera for both science and navigation. Combined, this payload detects astrobiologically important classes of rock components (elements, minerals, and organics) in extreme terrain, which, as demonstrated in this work, can reveal a correlation between textural biosignatures and the organics or elements expected to preserve them in a habitable environment. Across >10 field tests, milestones were achieved in instrument operations, autonomous mobility in extreme terrain, and system integration that can inform future planetary science mission architectures. Contributions include (1) system-level demonstration of mock missions to the vertical exposures of Mars lava tube caves and Mars canyon walls, (2) demonstration of multi-instrument integration into a confocal arrangement with surface scanning capabilities, and (3) demonstration of automated focus stacking algorithms for improved signal-to-noise ratios and reduced operation time.
1. Introduction
Detection of extant or extinct life on another planet is one of the overarching goals of planetary science exploration and is fundamental to the Mars Exploration program (MEPAG, 2015), Ocean Worlds exploration (Sherwood, 2016; Lunine, 2017; Hendrix et al., 2019), and even exoplanet research (NRC, 2010). The burden of proof to confirm detection correlates with the magnitude of the claim. Relying on a single piece of evidence or controversial interpretations can lead to widespread disinformation that can negatively impact the credibility of the mission and the field. This motivates a mission design strategy that uses multiple, independent lines of evidence to support a detection of astrobiological significance (Shapiro and Schulze-Makuch, 2009).
As we have refined the search for life in our own Solar System, it has become apparent that many of the best targets for investigation lie in complex terrain that is inaccessible to current wheeled rovers. For example, the Opportunity rover imaged cross-bedding in exposed rock outcrops but could not access the site despite several months of effort (Squyres et al., 2009). This has motivated the development of more advanced mobility systems such as the Limbed Excursion Mechanical Utility Robot (LEMUR) 3 robot used in this work (Parness et al., 2017a) (Fig. 1).

The Limbed Excursion Mechanical Utility Robot (LEMUR) 3 climbing robot ascends a rocky wall in the Titus Canyon region of Death Valley National Park, California during a field test. A safety line is tethered to the top of LEMUR's chassis to prevent damage from a potential fall. Power and communications are transmitted through the lower cable. LEMUR, Limbed Excursion Mechanical Utility Robot.
Remote observations of Mars have identified numerous geological regions of interest in the search for life, including many that are difficult to access; for example, large canyons such as Valles Marineris (Nedell et al., 1987), vast deltas and floodplains (Moore et al., 2003), skylight entrances to putative lava tubes in the Tharsis region (Cushing and Titus, 2010; Léveillé and Datta, 2010), seasonal recurring slope linae (McEwen et al., 2011), and polar ice caps of water and carbon dioxide (Jakosky et al., 2003). On Ocean Worlds, the chaos terrain of Europa (Sotin et al., 2002; Kereszturi and Keszthelyi, 2013) and the active vents on Enceladus (McKay et al., 2008) are particularly attractive astrobiology targets, both lying in extreme terrain. Accessing targets on small bodies, such as volatiles escaping the actively venting scarps on Comet 67P-CG (Thomas et al., 2015) or the white faculae within Occator crater on Ceres (Vu et al., 2017), necessitates extreme terrain robotic systems that can maneuver despite the low gravity. Figure 2 shows the diversity of these extreme terrains that future rovers must be able to access and deploy instruments on for in situ investigations.

Several examples of astrobiologically interesting sites on other planetary surfaces not easily accessible by conventional wheeled rovers:
Microbial life and its biosignatures are the highest priority targets within these extreme terrains (NRC, 2011). Investigations may require evaluation of small regions of interest embedded in matrix materials that provide important contextual information. This motivates a science implementation strategy that can make multiple measurements of precisely the same site by using complementary analytical techniques and measure the surrounding matrix materials for comparison. Spatial registration of datasets is the current state of the art (Paar et al., 2016), but the ability to align multiple instruments to interrogate a single target without rotating a turret (Doran et al., 2016) or moving a deployment mechanism could reduce spatial errors in these data. Further, this approach can increase the operational tempo of an investigation and allow more science return within a fixed-life mission. Given travel times and bandwidth restrictions that may limit human-in-the-loop tactical decisions, the automation of these data acquisition activities can dramatically improve science return.
Our prototype system was designed with these factors in mind. It uses a suite of five instruments (three scientific and two engineering/science dual purpose) to generate independent and complementary lines of evidence for habitable environments and life. The climbing mobility platform (Parness et al., 2013), which comprises hardware and software, can traverse rocky environments independent of gravity and far beyond the reach of wheeled rovers. This enables access to many of the high-priority science targets of interest. By using alternative grippers (Curtis et al., 2018; Nash et al., 2020), similar terrains made of ice are also accessible with the same robot and autonomous software. The instrument suite was implemented in a confocal package for two of the three science instruments [deep-ultraviolet (DUV) fluorescence (Geobiology with ultraviolet (UV) Raman Imaging and Laser-induced Autofluorescence or GURILA) and X-ray fluorescence (XRF; Advanced PIXL {Planetary Instrument for X-ray Lithochemistry} Experiment or APE)] and demonstrated computer vision-based registration techniques to align all datasets.
Automated focal stacking algorithms improved both the quality of data signal to noise ratio (SNR) and the simplicity of operations by not requiring surface preparation or spectral re-focus at each point in a hyperspectral map.
To mature and evaluate this system, laboratory tests of the robot and instrument suite were performed, along with multiple field tests to Mars analog environments in New Mexico and California, as described in Section 2 of this study. Section 3 presents the Results of these tests, followed by a Discussion of the major lessons learned and their implications for future robotic planetary science missions to extreme terrain. The work is summarized in Conclusions.
2. Methods
2.1. Limbed Excursion Mechanical Utility Robot
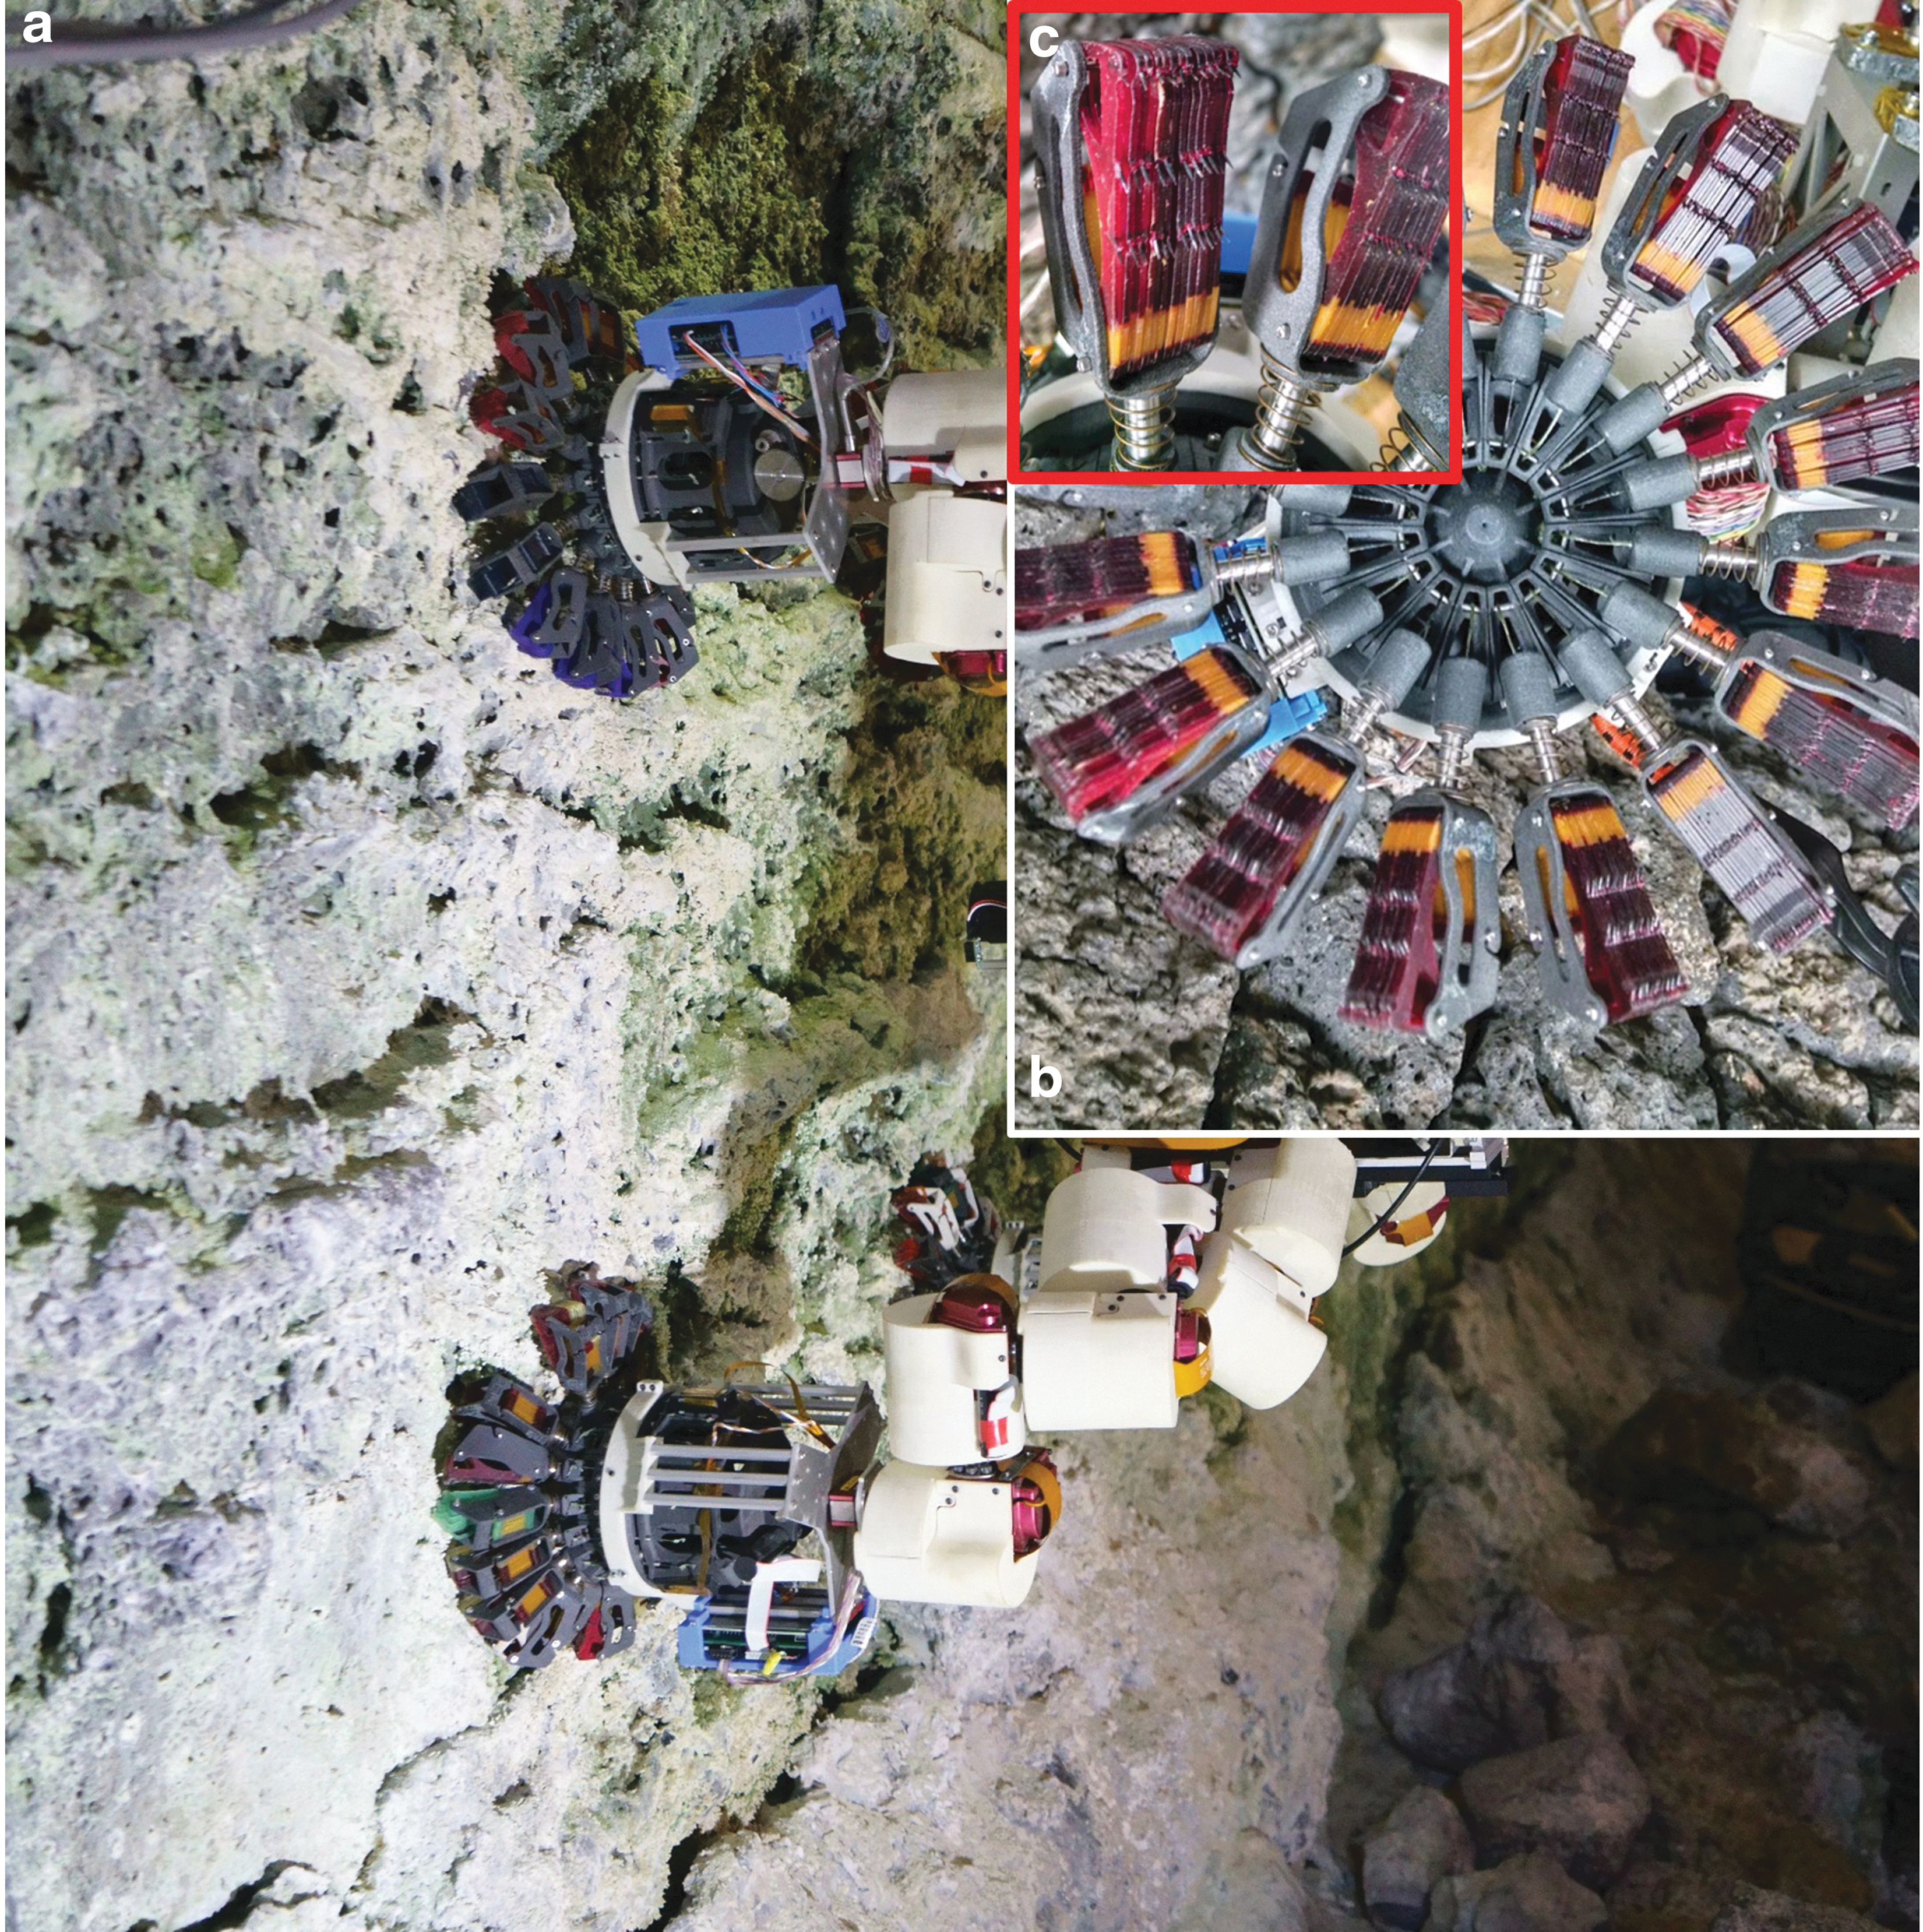
The LEMUR 3 limbed prototype robot is a quadruped with seven joints (degrees of freedom) per limb (Parness et al., 2017a). Swappable grippers allow the robot to climb a variety of terrains, including rocky cliff faces (Parness, 2011), man-made surfaces such as the exteriors of satellites (Jiang et al., 2017), and icy environments (Curtis et al., 2018; Nash et al., 2020). The robot uses a PC/104 avionics stack to control low-level motor loops and carries an Intel NUC for high-level autonomy and vision processing. It has been used as a representative robot for extreme terrain access and as a platform to mature autonomy software and develop scientific investigation concepts for habitability and life detection.
In this work, LEMUR 3 uses microspine grippers (Parness et al., 2013) (Fig. 3) as the end effectors on each limb. These grippers array hundreds of sharp hooks on compliant mechanisms that allow the gripper to conform to the shape and roughness of the rock's surface at the centimeter and millimeter scales. The hierarchical compliance also provides a load-sharing mechanism so that many individually low-force engagements of a single hook engaged with a crack or pit or vesicle on the rock can be summed to support large overall loads. Demonstrations of rotary percussive drilling in microgravity (Parness et al., 2017b) reacted by microspines as well as large-scale gripping with flight-like designs and materials (Parness et al., 2017c) were demonstrated during development of the now-cancelled Asteroid Redirect Mission.
The platform has been demonstrated in climbing basalt, granite, and carbonate rocks. Figure 4 shows an autonomous 4.2 m climb on vertical granite performed with the help of a safety cable and gravity offload system.
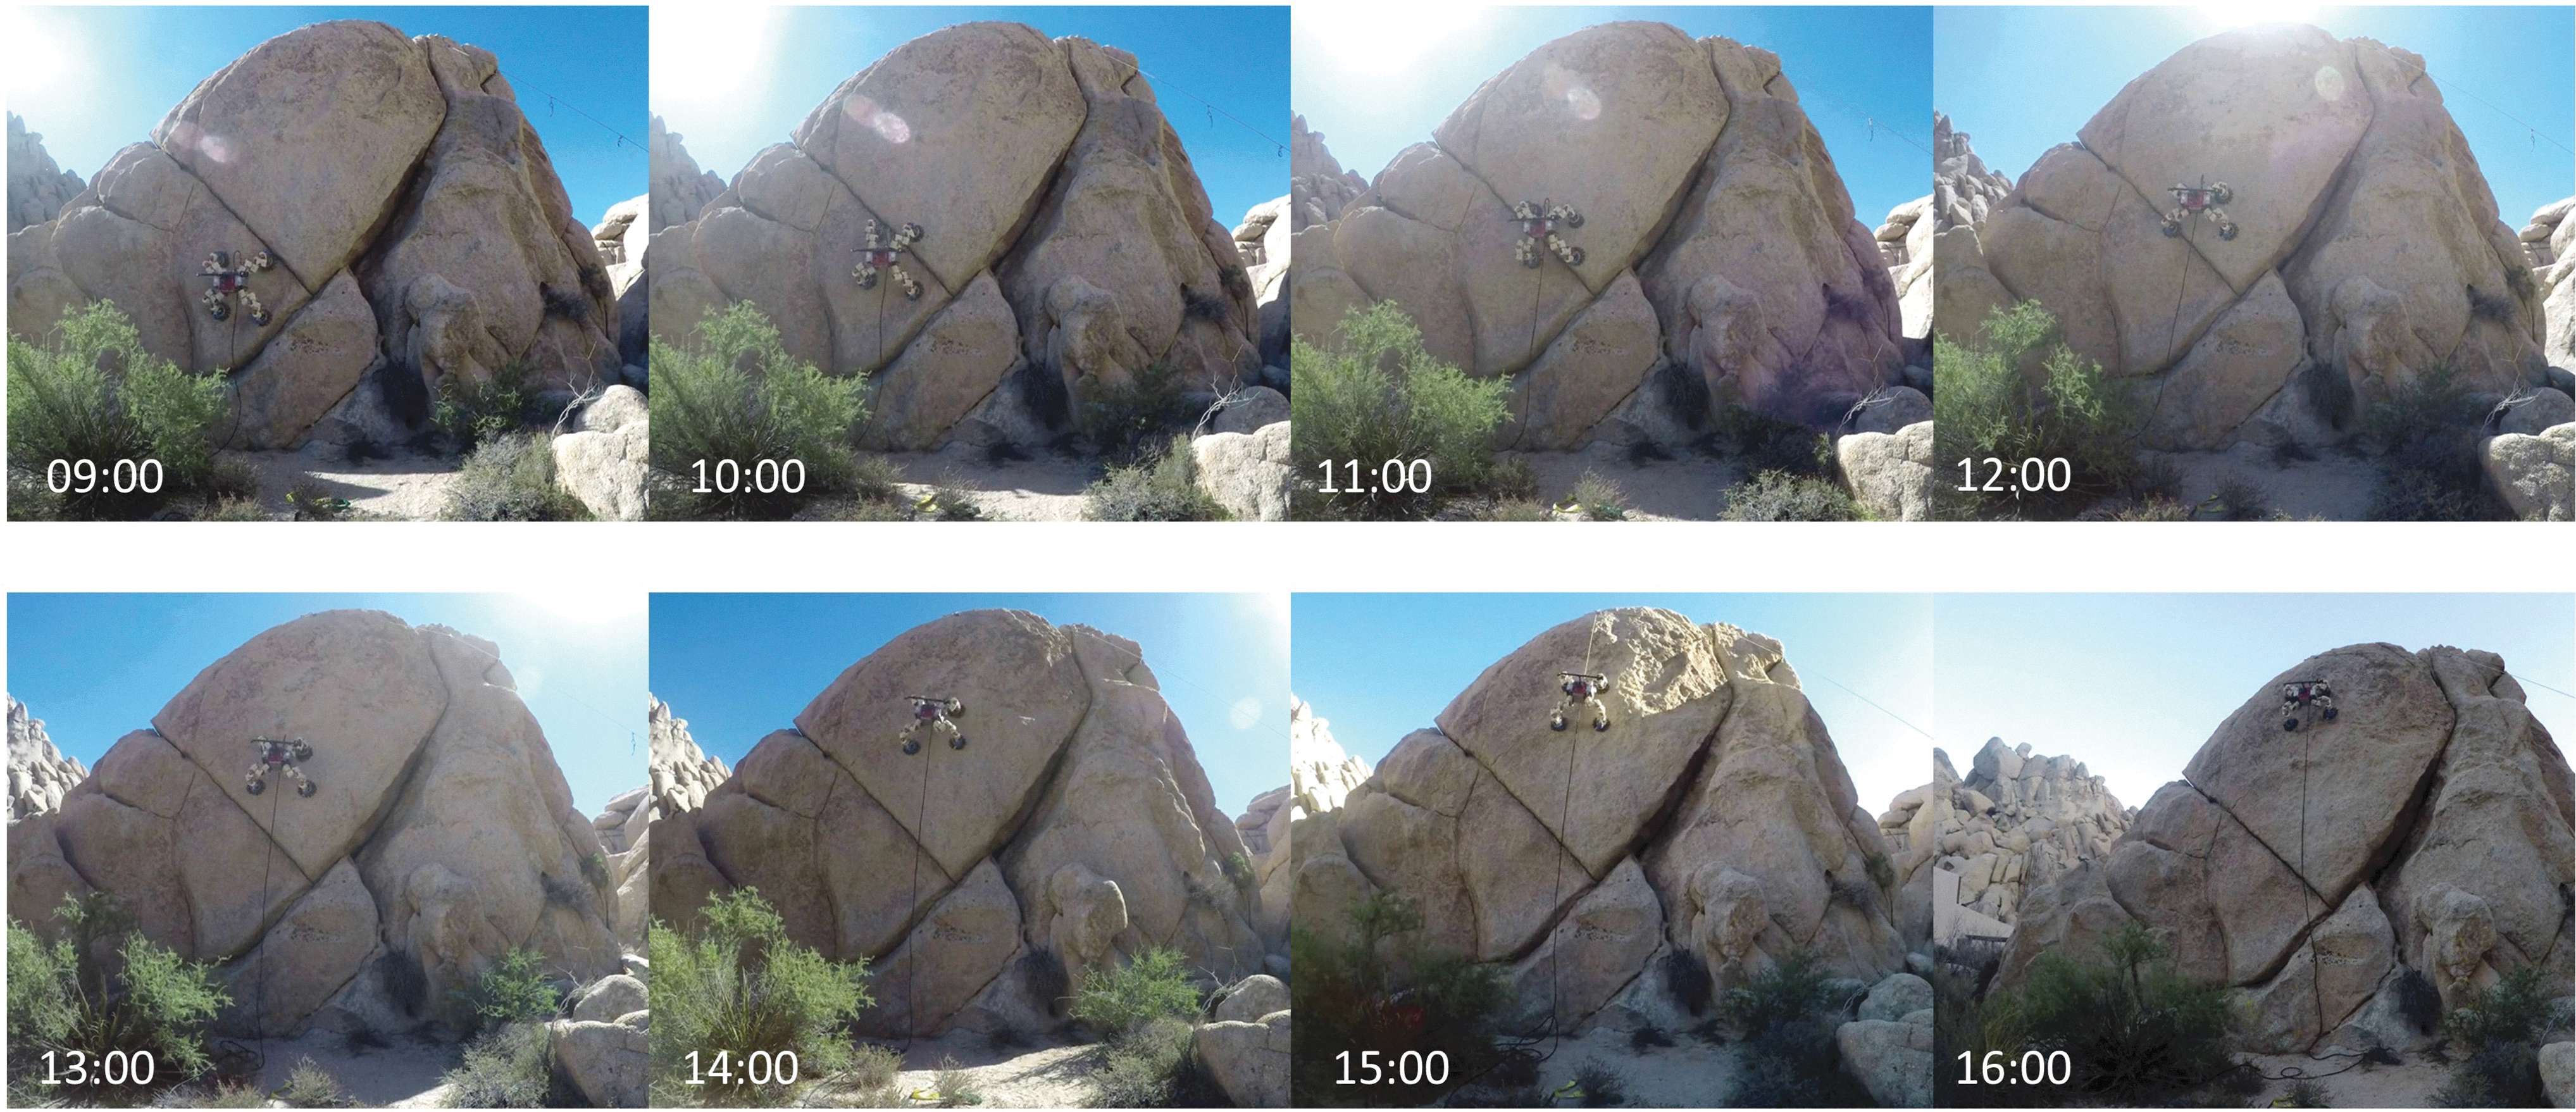
A time-lapse photo series of LEMUR 3 climbing a granite outcrop at the Granite Mountain Desert Research Center. During this test, LEMUR 3 climbed ∼4.2 m vertically in 7 h.
2.2. Light detection and ranging/context camera
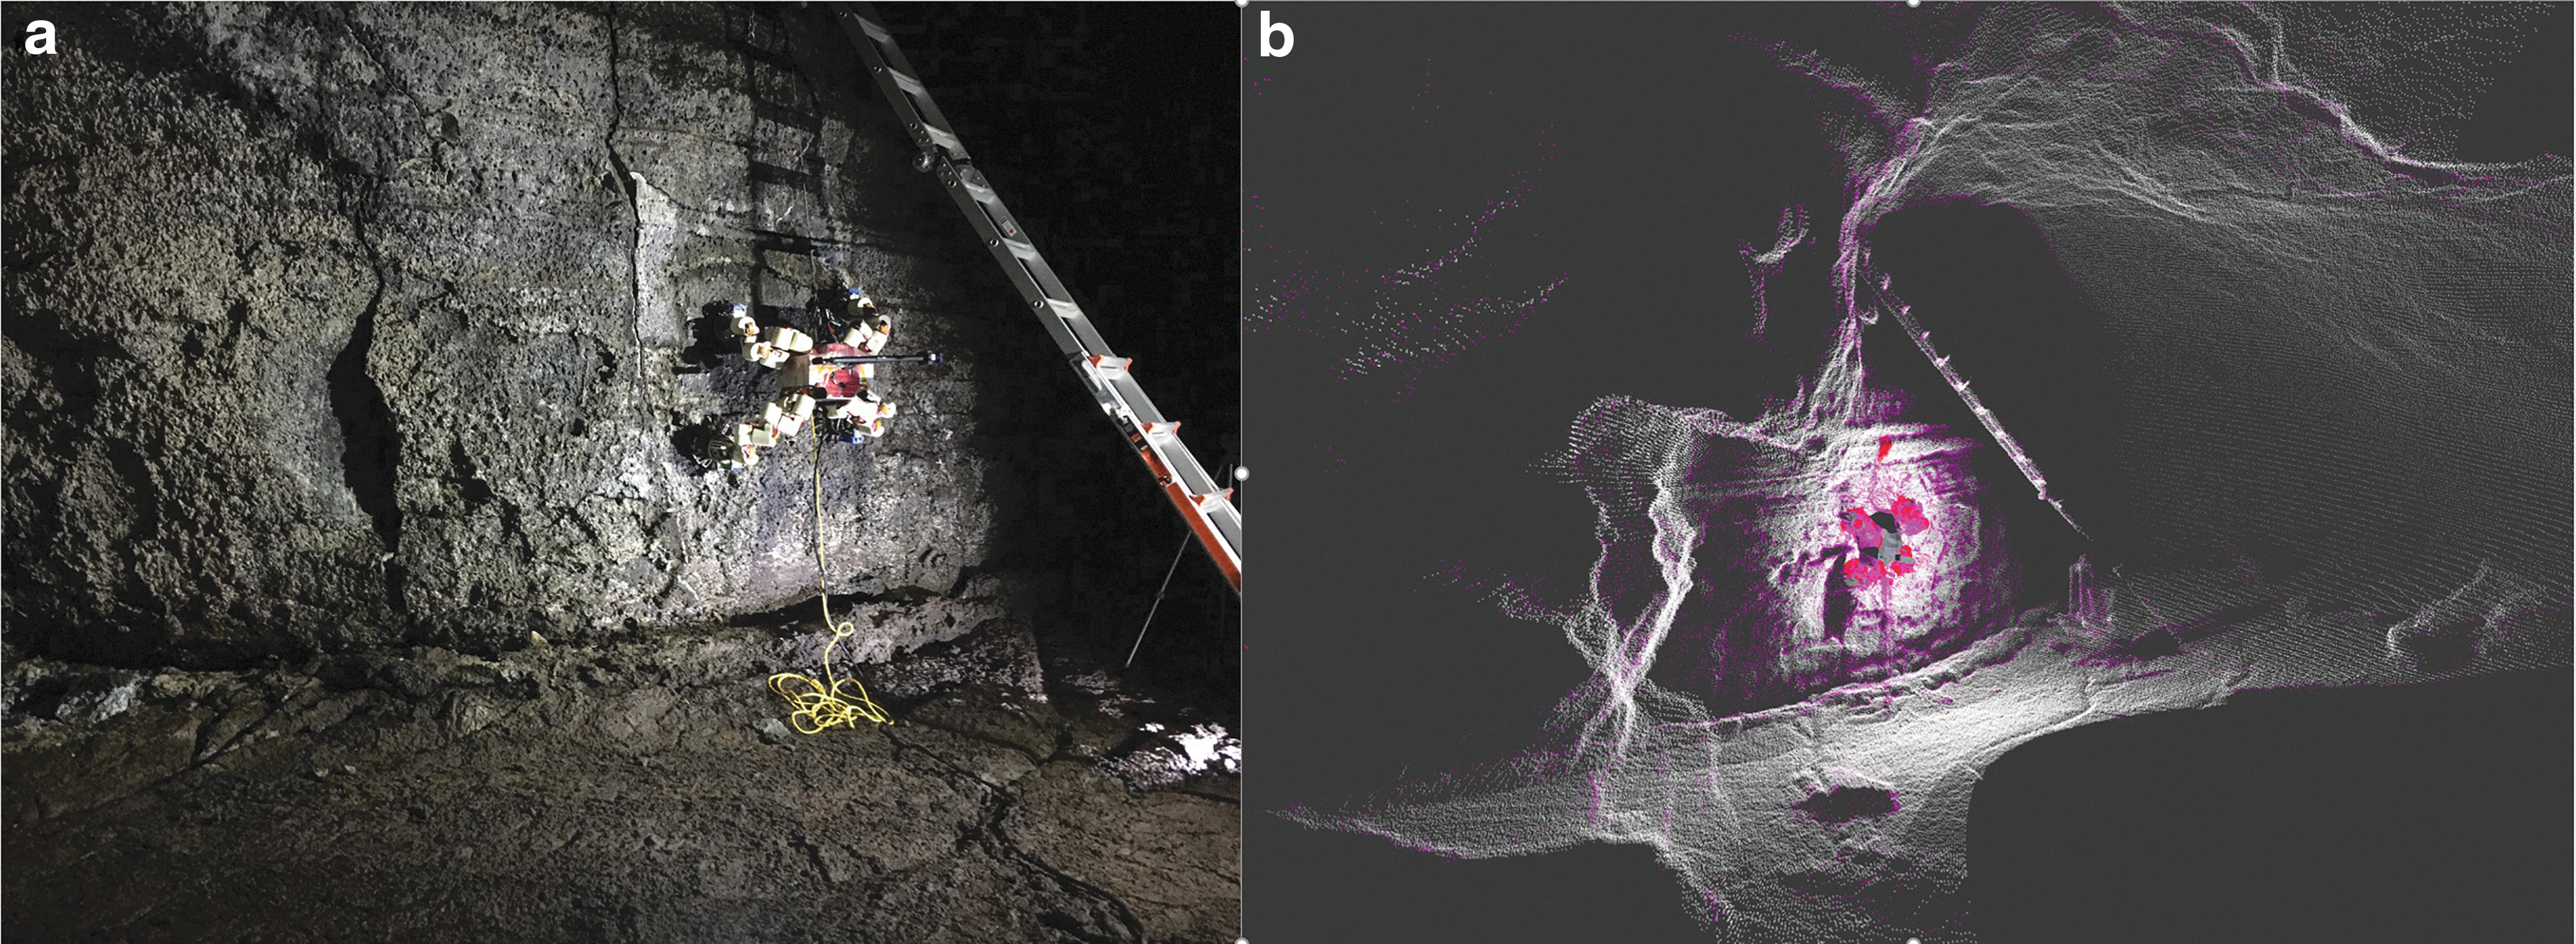
A Hokuyo UTM-30LX-EW light detection and ranging (LIDAR) with a 270° field of view is mounted on a perception mast that sweeps the unit 360° around the robot to create a three-dimensional (3D) point cloud that represents the rock face (Fig. 5). The sensor is invariant to ambient lighting conditions, functioning well in total darkness (inside a cave) and in direct sunlight. Data from multiple scans are registered with one another and filtered to continually improve the quality and range of the 3D map and to better localize the rover within the map. Point cloud data are converted into a voxel map for use by the robot planning software. More than a byproduct, this 3D surface can also be passed to the science team (with optional color and texture layers) to enhance the science investigations.
Four cameras provide additional navigation guidance and context imagery for science interpretation. A camera on the perception mast opposite the LIDAR provides contextual information on rock color, texture, and fractures. An engineering camera on the opposite side of the chassis enables an operator to monitor instrument proximity to the wall for redundant collision avoidance. A camera mounted on the underside of LEMUR 3 images the target surface measured by the Portable AOTF (Acousto-Optic Tunable Filter) Spectrometer for Astrobiology (PASA)-Lite instrument, providing a scientific context and focusing guidance. An additional context camera mounted to the 3-axis instrument stage images science targets and provides input to the focusing algorithm used to position the GURILA and APE instruments, described further in Section 2.6.
2.3. PASA-lite
Infrared spectroscopy probes the vibrational transitions of a molecule, and the wavelength-dependent reflectivity of an irradiated sample can be used to infer its molecular composition and hydration state. The presence of organic compounds and the characterization of minerals indicative of habitability (including carbonates) can be used to vet samples within a region for their highest astrobiological potential (Korablev et al., 2017; Uckert et al., 2017).
We measured samples in situ as well as those returned to the laboratory with PASA-Lite (Chanover et al., 2012; Uckert et al., 2015)—an active illumination infrared (IR) point spectrometer that operates in the 1.6–3.6 μm range (with a spectral resolving power of λ/Δλ > 250), overlapping with the fundamental vibrational modes of hydrocarbons (C–H), hydroxyls (–OH), and other hydrogen bonded molecules. Weaker vibrational transitions associated with overtones and combinations of fundamental vibrations of other molecules are also present (Pieters and Englert, 1993; Bokobza, 2002; Uckert et al., 2017).
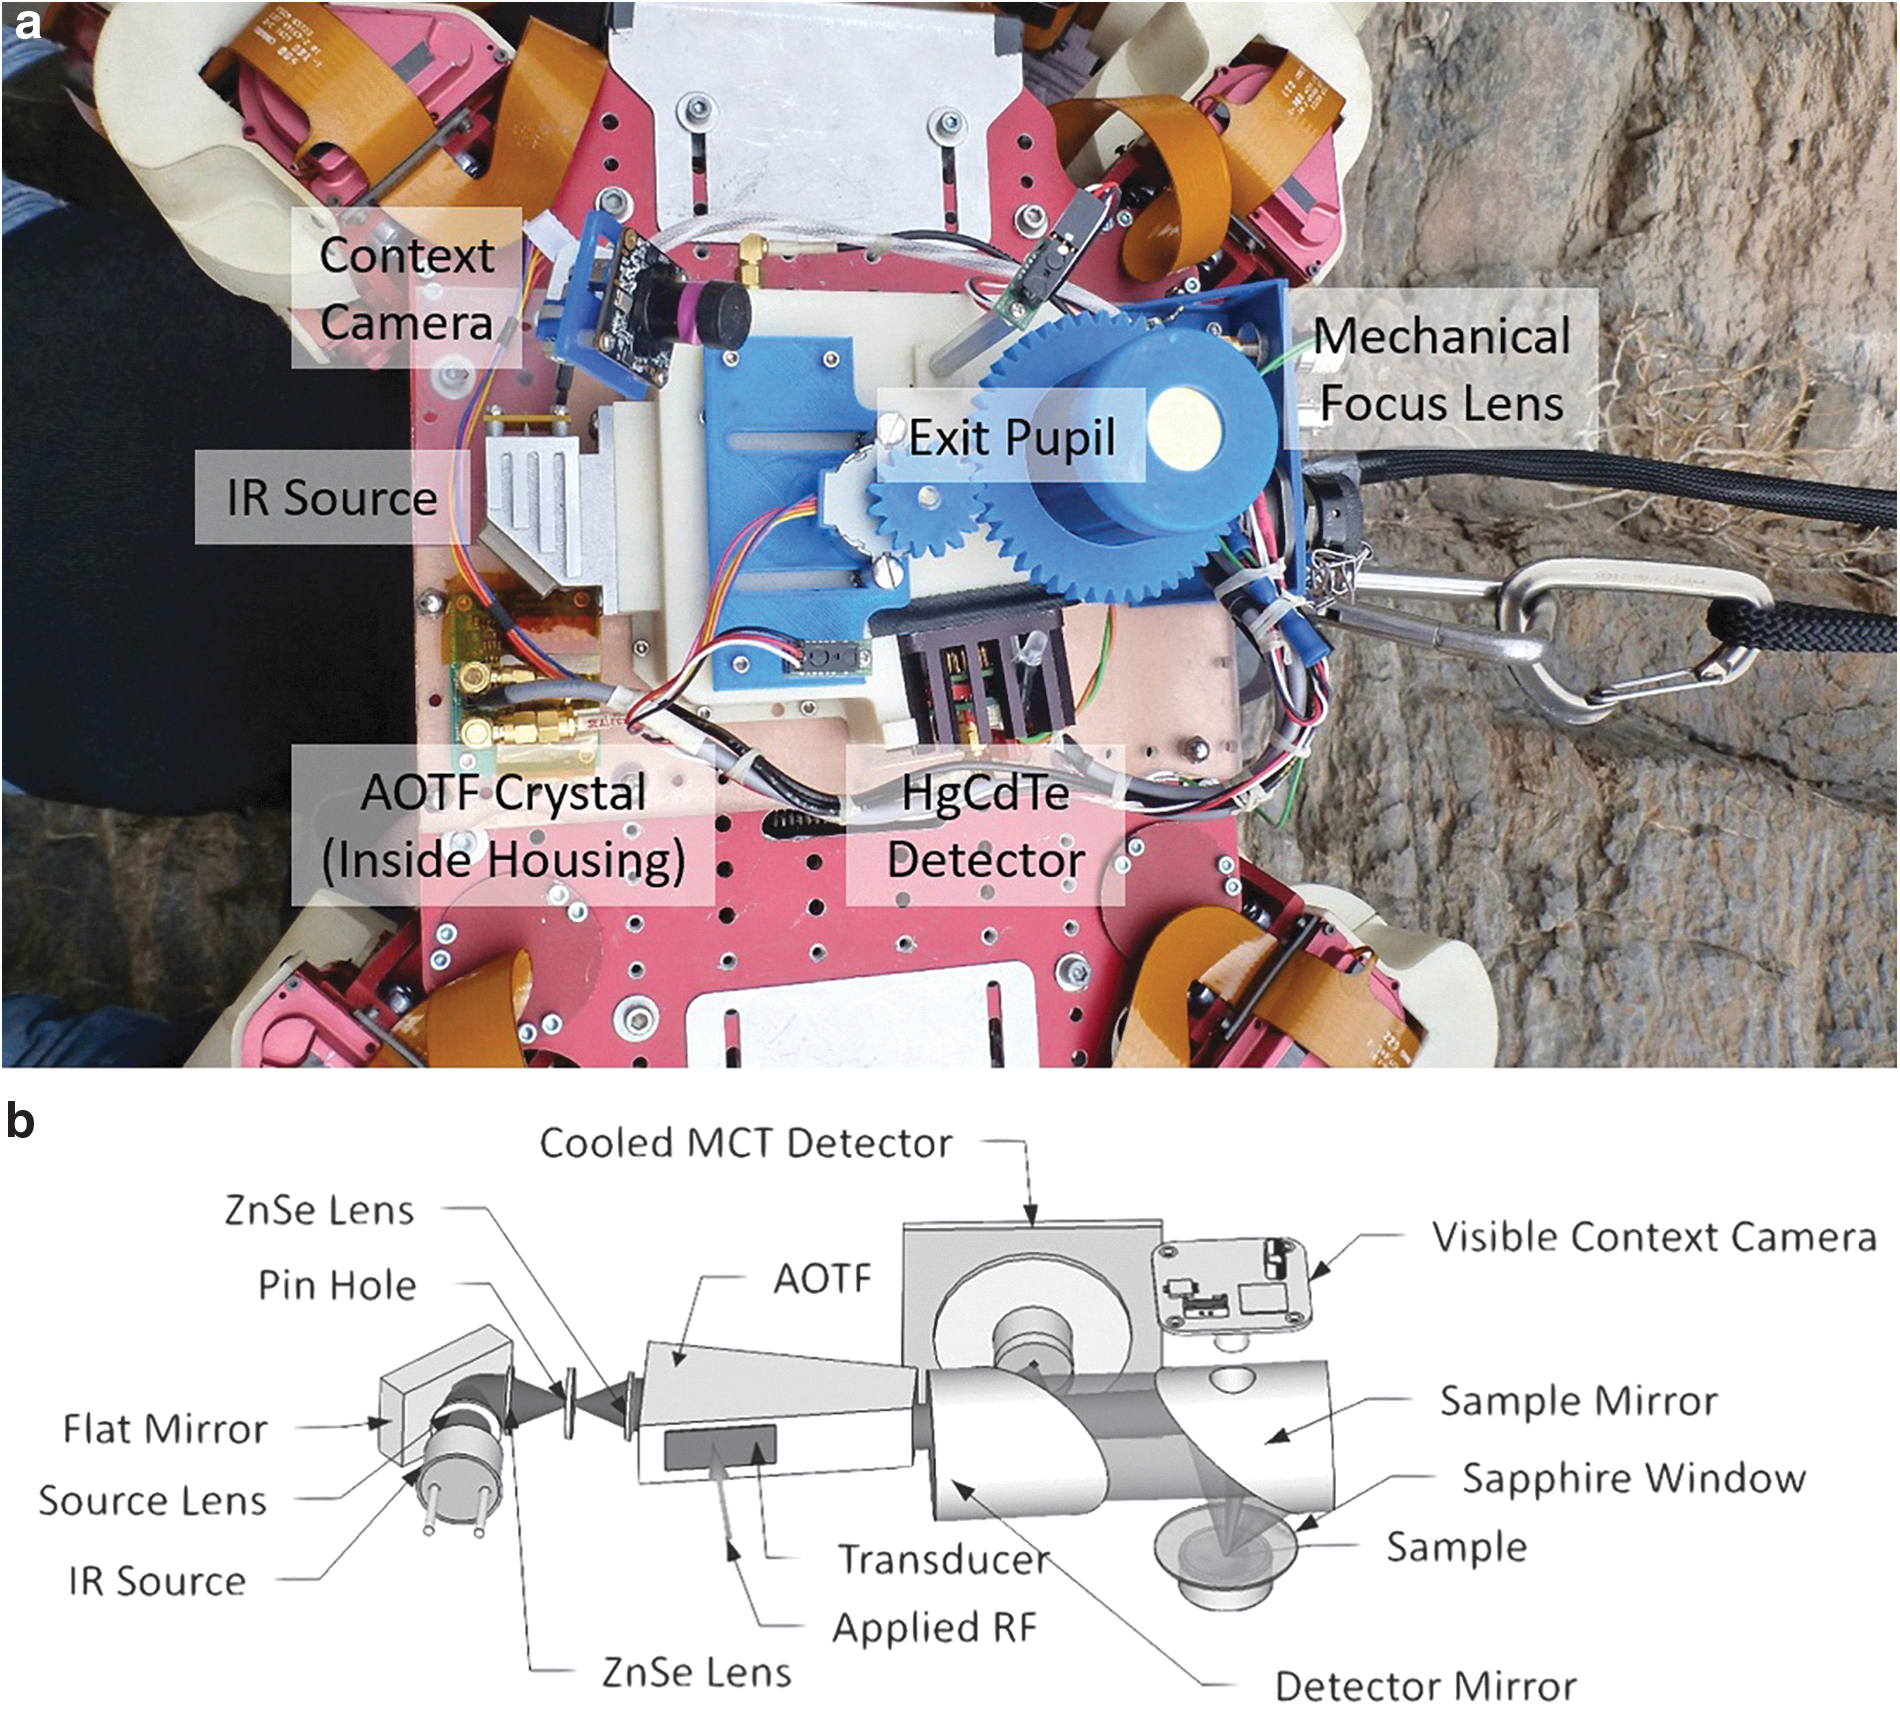
To acquire a near-infrared (NIR) spectrum of a target, LEMUR 3 positions a sample within the working distance of the PASA-Lite auto-focuser, 0–37 mm. A broadband IR light source is then directed through the AOTF wavelength selection element, resulting in a narrow-band beam of photons that is focused onto a ∼2 mm spot on a sample and reflected into the HgCdTe single-element detector. Figure 6a shows a photograph of PASA-Lite, labeled with major components. The light path through the optical elements is presented in Fig. 6b.
2.4. Advanced PIXL Experiment
The elemental composition of a sample (including trace elements) is revealed by XRF spectroscopy. Hyperspectral elemental composition maps reveal subtle changes in chemistry across a sampling area, which may indicate the presence of grains, mineral veins, or concretions. These geological boundaries can correspond with elevated organic content or biological activity (identified with Raman or IR spectroscopy) and provide a geological context for the deposition of these formations. In XRF, target atoms are bombarded with high-energy X-rays, ionizing an atom by ejecting inner-orbital electrons. Secondary X-rays are emitted as outer-orbital electrons drop to lower energy states to fill the vacant inner-orbital shell. The energy of these characteristic secondary X-rays is measured by a silicon drift detector (SDD) to determine the elemental composition of a sample.
We developed the APE XRF spectrometer and integrated it with the LEMUR 3 rock-climbing robot to determine the chemical composition of a sample in situ, during climbing activities. The APE is based on the design of the PIXL instrument for Mars 2020 (Allwood et al., 2015). Mapping micro-XRF spectroscopy provides elemental abundance data that are comparable to the element maps generated by energy-dispersive spectroscopy in scanning electron microscopy, but it is a technique that can now be deployed in field settings (including martian surface environments) and be used to analyze unprepared rock and soil surfaces (Allwood et al., 2015).
The APE is of a similar design to other PIXL prototype instruments that have been built to effectively map textural biosignatures in field and laboratory settings (Flannery et al., 2016, 2018a; Allwood et al., 2018). The APE generates X-rays by using a Moxtek X-ray tube (operating at 28 kV and 40 μA) and focuses them to a 100 μm spot at a 2 cm stand-off distance with a custom-built polycapillary optic. A Vitus H50 Ketek SDD detects secondary X-rays (along with scattered source X-rays) with a ∼140 eV energy resolution (full-width at half maximum [FWHM] at 5.9 keV). During in situ operations, the Ketek detector was replaced with a more robust but less sensitive Amptek SR-100SDD, which has a similar energy resolution but requires longer integration times due to a smaller collection area.
We also measured samples returned to the laboratory by using the PIXL breadboard, which produces higher resolution elemental composition maps with a more precise motorized stage. The PIXL breadboard uses a two-channel detector system (two Ketex Analytical X-Ray Acquisition System [AXAS] SDDs, energy range: ∼0.7 to 28 keV, energy resolution: ∼130 eV at FWHM 5.9 keV) and a Moxtek X-ray tube, focusing photons to α < 100 μm spot (under standard operating conditions at 28 kV and 230 μA).
The X-ray flux attenuation is dependent on the sample composition and density, primary X-ray energy, and secondary X-ray energy (Hubbell and Seltzer, 1995). For the samples measured in this study, the derived energy spectrum represents the composition of the uppermost 100 μm of the target. All laboratory XRF measurements are conducted in an He-rich environment to improve X-ray transmission and limit the contribution of atmospheric fluorescence peaks (primarily from Ar) to the energy spectrum, more closely resembling measurements in a martian atmosphere.
2.5. Geobiology with UV Raman Imaging and Laser-induced Autofluorescence
In DUV Raman and fluorescence spectroscopy, an incident laser pulse interacts with a target molecule in one of two ways: (1) Stokes Raman scattering: The photon promotes a molecule to an excited virtual state, which then relaxes to an excited vibration state, transferring energy to the lattice and shifting the photon's wavelength (diagnostic of the molecule), or (2) fluorescence: The incident photon is absorbed by the molecule, exciting it to a higher electronic and vibrational state. The molecule returns to the vibrational ground state, and it releases a photon as it relaxes to the electronic ground state. DUV Raman and fluorescence spectroscopy can assess a sample's habitability potential, its aqueous history, and detect the presence of biosignatures preserved in rocks by detecting and classifying organics and minerals on a surface (Beegle et al., 2015).
GURILA is a DUV Raman and fluorescence spectrometer and is a predecessor to the Mars 2020 Scanning Habitable Environments with Raman and Luminescence for Organics and Chemicals instrument (Beegle et al., 2015). GURILA measures the native fluorescence and pre-resonance/resonance DUV Raman scattering of a sample after irradiation by a narrow linewidth, high radiance 248.58 nm NeCu DUV laser (Photon Systems) focused to a ∼100 μm spot. The GURILA sensors consist of 32-channel photomultiplier tube detectors (Photon Systems), which operate from ∼265 to 430 nm, with a resolution of Δλ ∼5 nm. The optical design is similar to the Wireline Analysis Tool for Subsurface Observation of Northern ice sheets DUV Raman spectrometer described in the works of Eshelman et al. (2019) and Mellerowicz et al. (2018).
GURILA is capable of detecting a range of organics, microbes, and potential biosignatures, including the classification of bonds such as C–H, CN, C = O, C = C, NHx, NOx, SOx, POx, ClOx, and OH (Nealson et al., 2002; Bhartia et al., 2008, 2012a, 2012b, 2015; Salas et al., 2015; Abbey et al., 2017; Sapers et al., 2019).
We also measured samples returned to the laboratory with the Jet Propulsion Laboratory (JPL) Mineral/Organic/Biological Investigations with UV Spectroscopy (MOBIUS) high-resolution fluorescence/Raman spectrometer to characterize the organic and major mineral components within a sample (Abbey et al., 2017). MOBIUS uses the same 248.58 nm laser excitation source as GURILA, which resonantly excites nucleobases and amino acids. The MOBIUS instrument uses a 250 μm slit width, and the liquid nitrogen-cooled detector operates from 572 to 4252 cm−1 with a resolution of Δλ ∼4 cm−1. The penetration depth of the 248.58 nm photons is dependent on the substrate, but it is expected to be >500 μm for most materials (Carrier et al., 2019).
2.6. Confocal integration and scanning stage and operations
GURILA and APE are a confocal system integrated on the same custom 3-axis stage, shown in Fig. 7. These two instruments interrogate the same ∼100 μm spot on a target, producing a hyperspectral map that combines Raman/fluorescence, XRF, and context imagery. A confocal instrument suite eliminates uncertainty in instrument targeting and reduces operation time by allowing for simultaneous measurements with both instruments. In addition, coincident measurements of a target allow for direct comparisons between points without the need for interpolation within a hyperspectral map or requiring instrument-specific positioning systems.

The 3-axis stage comprises three linear stages that move independently. Each motorized stage has 5 cm of travel, better than 1 μm precision, and employs custom software to position the instruments in a predefined pattern over the rock at the APE/GURILA focus point. A visible imaging system with an expanded field of view and a shallow depth of field collects a series of images at various distances from the target. A topographic map of the sample terrain is autonomously reconstructed by using these images as follows: Image features are identified and images are aligned; a sub-group of pixels (16 × 16) within each image is compressed along a z-stack, where the least compressible image represents the focus position within the scene; and a 3D representation of the scene is programmed into the 3-axis stage to drive the instrument system to the focus point at each (x, y) position based on user-defined targeting resolution and area parameters. Each of these intermediate processing steps within this algorithm is represented visually in Fig. 8. This technique alleviates the need for a rock abrasion tool to flatten a surface, which removes potentially scientifically interesting surface features or chemically distinct weathering rinds to accommodate instrument positioning requirements.

A demonstration of the focus-merge algorithm applied to an unprepared sample.
2.7. Field deployment and data collection
Samples were measured in the field with instruments mounted to LEMUR 3 and in a stand-alone in situ data collection mode. In some cases, samples were returned to the laboratory for longer-duration measurements with benchtop instruments. Raw spectral data collected by each instrument in situ and by laboratory instruments on returned samples were processed through a standard data reduction pipeline to calibrate the spectra and to normalize to source intensity.
The NIR spectra collected with PASA-Lite were calibrated against an Infragold reflectance target—a handheld Lambertian reflector that is measured before each in situ measurement. Normalization to a reflectance target allows for spectral comparison between datasets and geochemical reference standard libraries and corrects for instrument variability, including detector temperature (Tawalbeh et al., 2013).
Elemental composition information from XRF spectra collected with APE and the PIXL breadboard prototype instrument were quantified by using PIQUANT, a calibration and data reduction tool (Elam et al., 2002) derived from the fundamental parameters approach to peak identification and fitting (Broll, 1986; Allwood et al., 2015). PIQUANT accounts for sample orientation, source and detector geometry, air mass, sample matrix effects, X-ray source spectrum, and other instrument- and sampling-specific differences to calculate the absolute intensity of the X-ray spectrum.
The Raman and fluorescence spectral processing pipeline includes standard procedures for baseline subtraction, laser photodiode normalization to account for variable laser pulse energy, cosmic ray removal, and wavelength calibration based on the Raman peak positions of known standards (Uckert et al., 2019).
2.7.1. Lava tube cave: El Malpais National Monument
Four Windows Cave is 1 of out more than 200 documented lava tube caves located in the El Malpais National Monument, New Mexico. Four Windows Cave is notable for its relatively long length (1.2 km), having an entrance at each end of the tube, skylights, and a relatively large passage diameter of ∼10 m (Rogers, 1991; Marinakis, 1997). A map of Four Windows Cave is presented in Fig. 9 with sampling locations annotated as red points throughout the cave.

A map of Four Windows Cave, annotated with sampling locations. This map has been adapted from the original survey by B. Rogers (courtesy of El Malpais National Monument).
The El Malpais formation is an extensive series of Pliocene to Holocene basalt flows that resulted from the eruption of shield volcanoes, cinder cones, fissures, and spatter cones over ∼100,000 years (Rogers, 1991; Marinakis, 1997). Four Windows Cave formed within the Bandera flow ∼10,000 years ago (Laughlin et al., 1994). The Bandera flow field contains the largest number of lava tube caves (∼30 km of passage) in the El Malpais region, with some of the largest passages in the monument (Marinakis, 1997). The relatively large tubes in the Bandera flow are partially due to their recent formation; many large tubes in the area have not yet undergone collapse due to roof failure after plastic deformation or weathering (Rogers, 1991). In addition, the composition of the flows sourced from Bandera crater have a more mafic composition with relatively low SiO2, K2O, and Al2O3 concentrations and relatively higher Fe2O3, TiO2, and MgO, leading to low viscosity, tube-fed, pahoehoe flows that are conducive for lava tube formation (Hatheway and Herring, 1970; Laughlin et al., 1972; Dunbar and Phillips, 2004).
2.7.2. Stratigraphic section: Titus Canyon
Titus Canyon cuts through the Grapevine Mountains, exposing uplifted, Cambrian-aged limestone, dolostone, quartzite, and siltstone (Niemi, 2002, 2012). The outcrop associated with the field site described in Section 3 is part of an upper Proterozoic/Middle Cambrian unit (∼550 million years old), and the cross-sections interrogated by the instrument suite are primarily carbonate rock. These Cambrian carbonates were originally deposited in a warm, shallow sea, and have since been overturned and folded, as shown in Fig. 10a (Niemi, 2002).
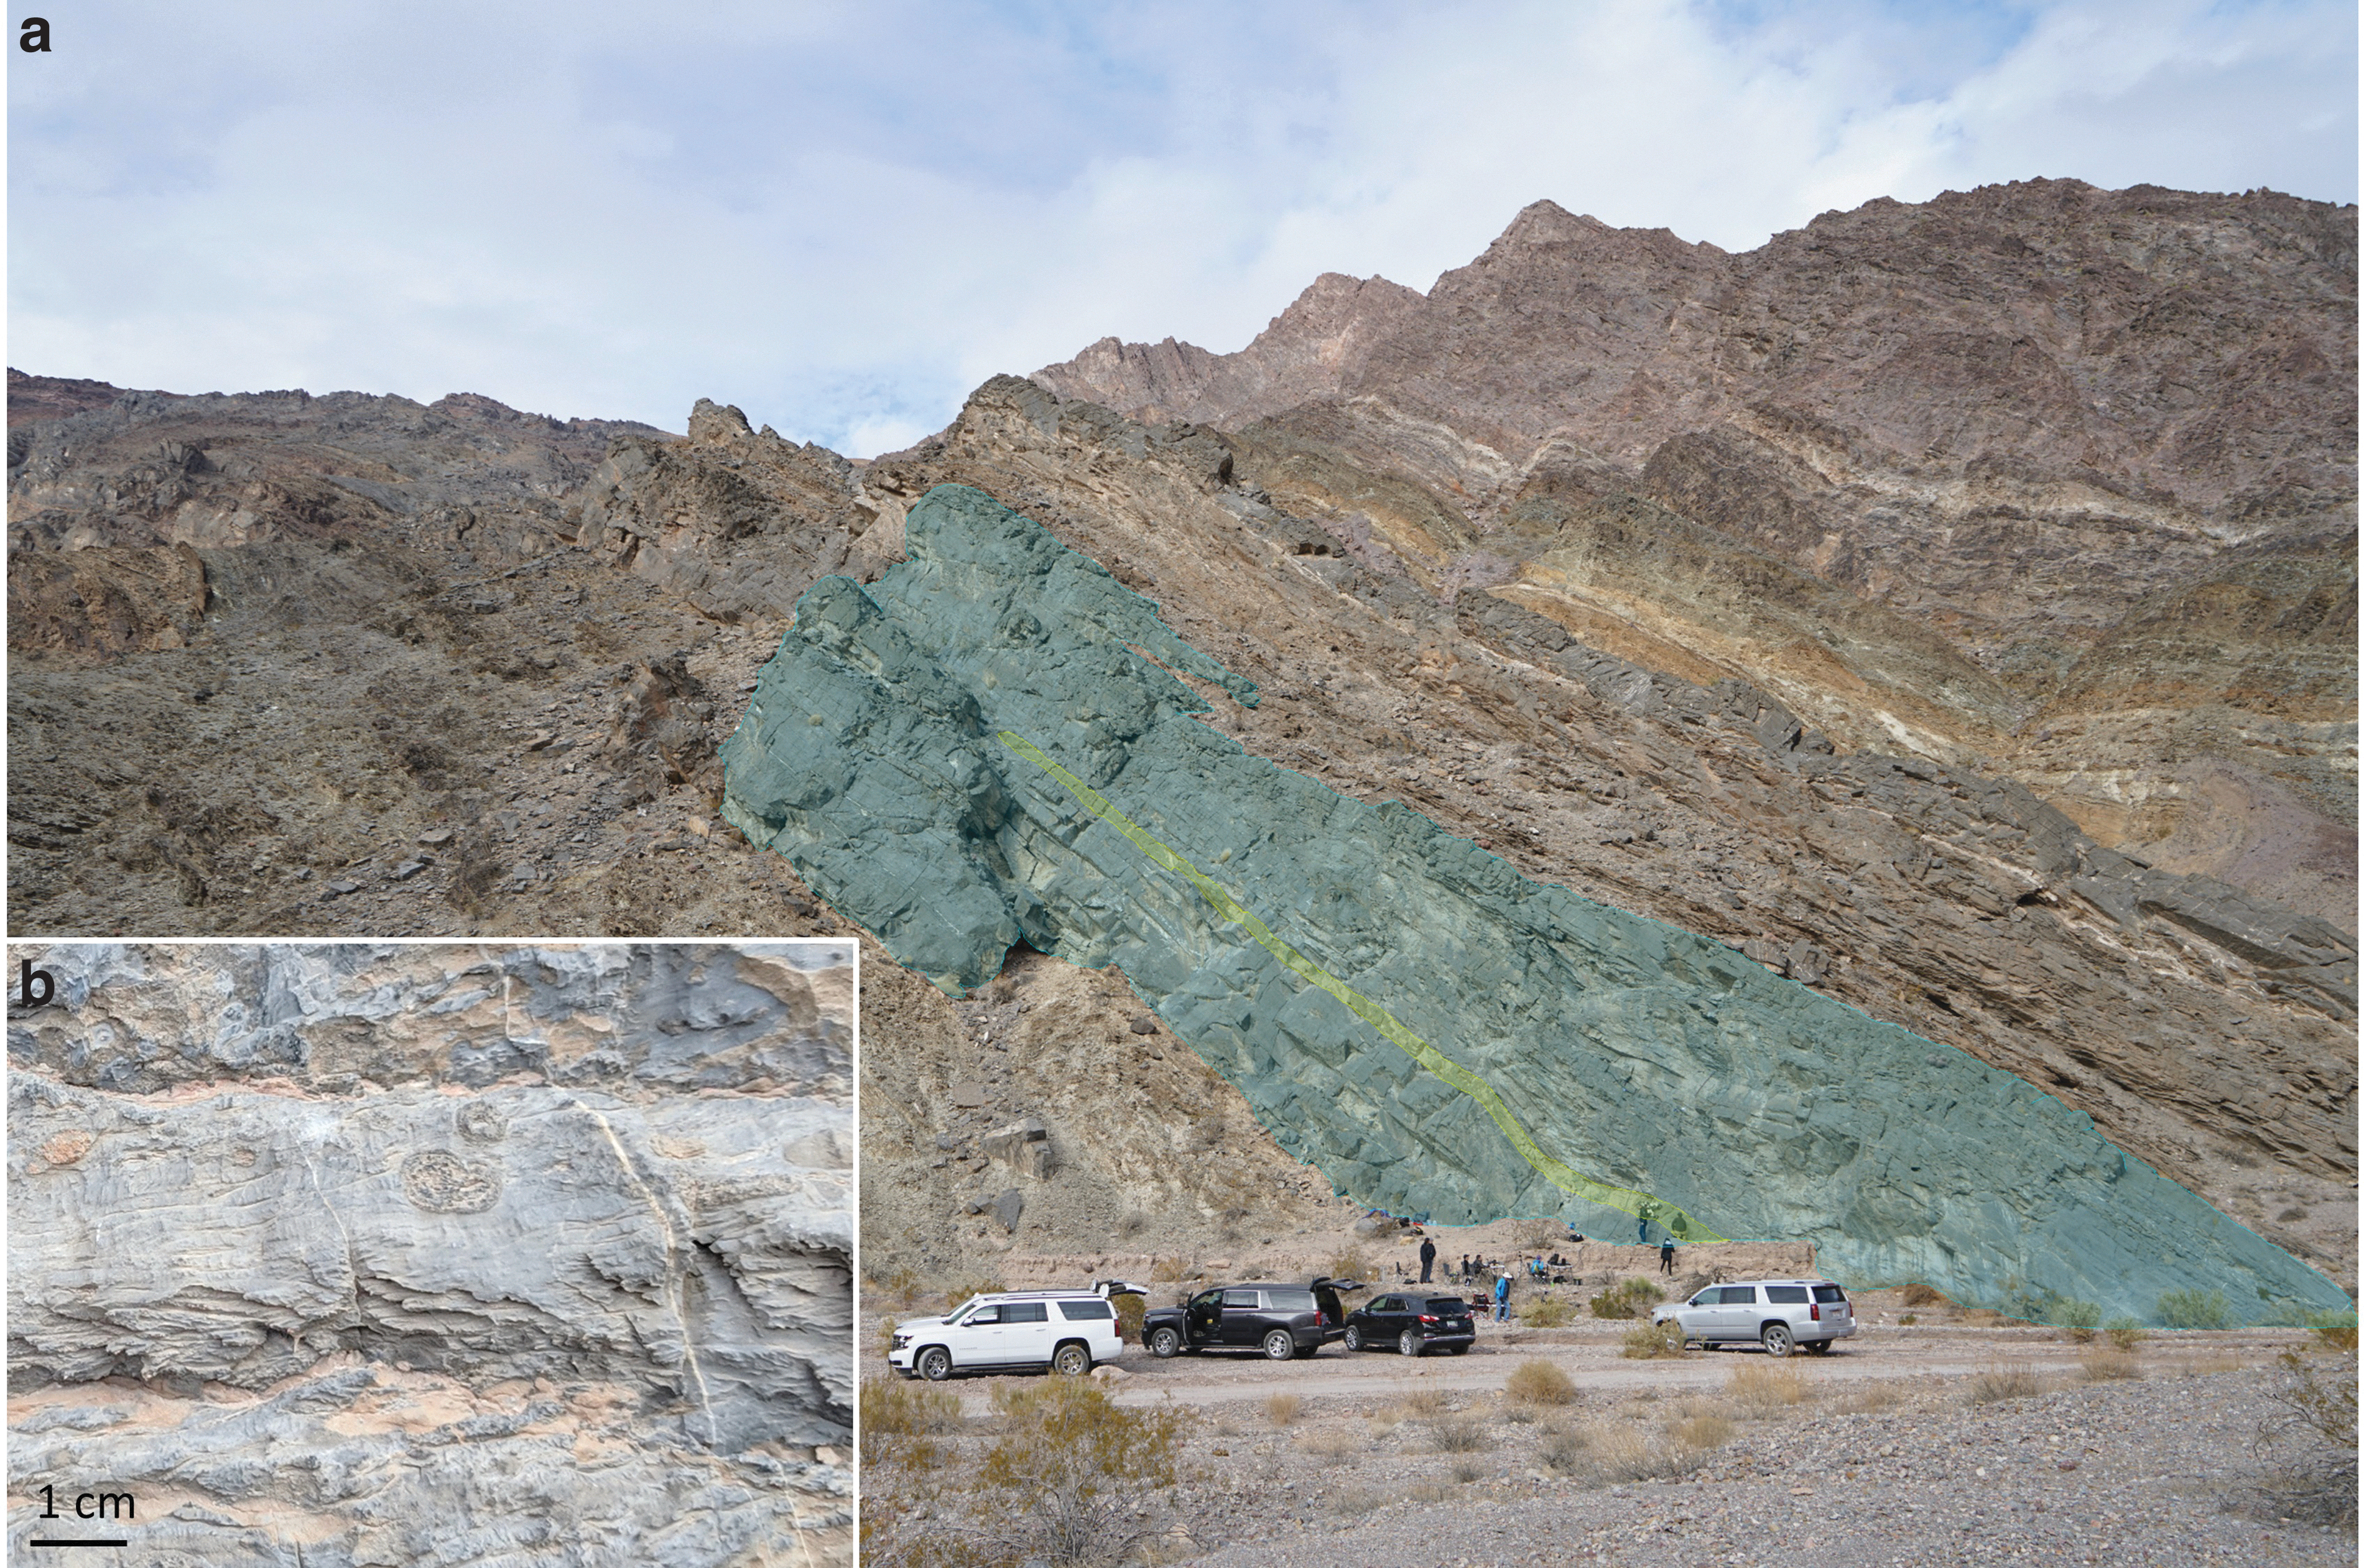
Our field site preserves relatively high concentrations of laminated, spheroidal, textural microbial biosignatures, known as Girvanella (Nicholson and Etheridge, 1878; Stewart, 1970; Niemi, 2012; NPS, 2015), that were the focus of this field test. Girvanella is believed to reflect the metabolic activities of filamentous Cyanobacteria in shallow-water environments that were saturated in calcium carbonate (e.g., Pratt, 2001). It is a form of oncolite that may form in environments that are dominated by prokaryotic organisms in waters that are regularly agitated. Oncolites have been observed forming in modern settings (e.g., Mawson, 1929) and are known from throughout the early geological record in rocks deposited as early as the Archean (Flannery et al., 2018b). At this field site, Girvanella ranges in size from 1 to 20 mm. Figure 10b shows the carbonate rocks that host Girvanella (the Girvanella-rich stratigraphic layer is highlighted in Fig. 10a).
2.7.3. Deployment logistics
The robot and instruments were deployed for multiday field tests in remote areas. To facilitate such tests, the robot was broken down into pieces that could be transported across rough terrain in hiking backpacks: individual limbs (with grippers attached) and the main chassis. Power was provided by portable lithium ion battery packs. Instruments were packed within ruggedized equipment cases for transportation. At the field site, the robot was reassembled, and then instruments were calibrated and assembled onto the robot.
Although prior versions of the LEMUR robot used onboard batteries, these required frequent change-out due to their limited capacity. LEMUR 3 uses off-board power that allows for unlimited continuous operation with the use of an uninterruptible power supply. Operators controlled the robot and instruments from a work station no >15 m from the robot, determined by electrical cable length. Setup times from arrival at field site to meaningful field test were reduced to ∼2.5 h over the course of multiple excursions. Repacking time averaged 1.5 h.
3. Results
3.1. Lava tube cave: El Malpais National Monument
We measured basaltic surfaces covered by apparent microbial mats, microbial precipitates, and carbonate and sulfate speleothems throughout Four Windows Cave (see Fig. 9 for sampling locations) with a suite of in situ and laboratory instruments. During a 5-day expedition to Four Windows Cave, we conducted 3 days of testing, which included LEMUR 3 robot climbing tests, measurements of Cyanobacteria-rich basalt walls with APE and PASA-Lite integrated with LEMUR 3, stand-alone in situ measurements of samples throughout Four Windows Cave, and a collection of samples from inconspicuous locations in breakdown talus piles to minimize impact to the cave.
We collected samples from regions within the cave near in situ measurement locations, when applicable, for follow-up measurements with laboratory instruments. Samples were wrapped in aluminum foil (sterilized through a dry heating technique to 450°C for 10 h), and they were sealed in plastic containers to limit contamination.
3.1.1. Climbing results
The LEMUR 3 robot successfully climbed on three wall surfaces within Four Windows Cave, including surfaces coated with Cyanobacteria as well as basalts without obvious microbial mat coatings. The robot was operated with a full-gravity offload system, also serving as a safety line, which provided an effective weight of approximately ±3 kg. The surfaces were well suited to microspine grippers with many asperities at the 1–10 mm scale. The robot autonomy software performed well, faulting and requiring manual intervention only at large discontinuities (ledges and corners), cases for which functionality had not been built into the code operating at the time. The longest climb measured 2.5 m and occurred on a vertical face within the cave (climbing site 2 in Fig. 9). Gross positioning of the instruments was performed through teleoperation of the robot by using the context cameras.
3.1.2. Cyanobacteria microbial mat
Cyanobacteria-coated basaltic rocks are located in the Twilight Zone of the cave, where they are exposed to sunlight and greater temperature variability than the microbial communities in the Dark Zone (Northup, 2004; Northup et al., 2011; Boston and Kelly, unpublished data). Thin (<1 mm) green-colored coatings are deposited on top of the basalt walls in this region, forming a nearly homogenous mat. In many areas, immediately underlying these green-colored coatings is a thin (∼1 mm) white-colored crust between the basalt wall and the microbial mat. These coatings are more sparsely observed within vesicular regions of the basalt and under overhangs that may block sunlight. At a larger scale, these microbial communities exist in multiple regions within the Twilight Zone, occupying several square meters of basalt wall.
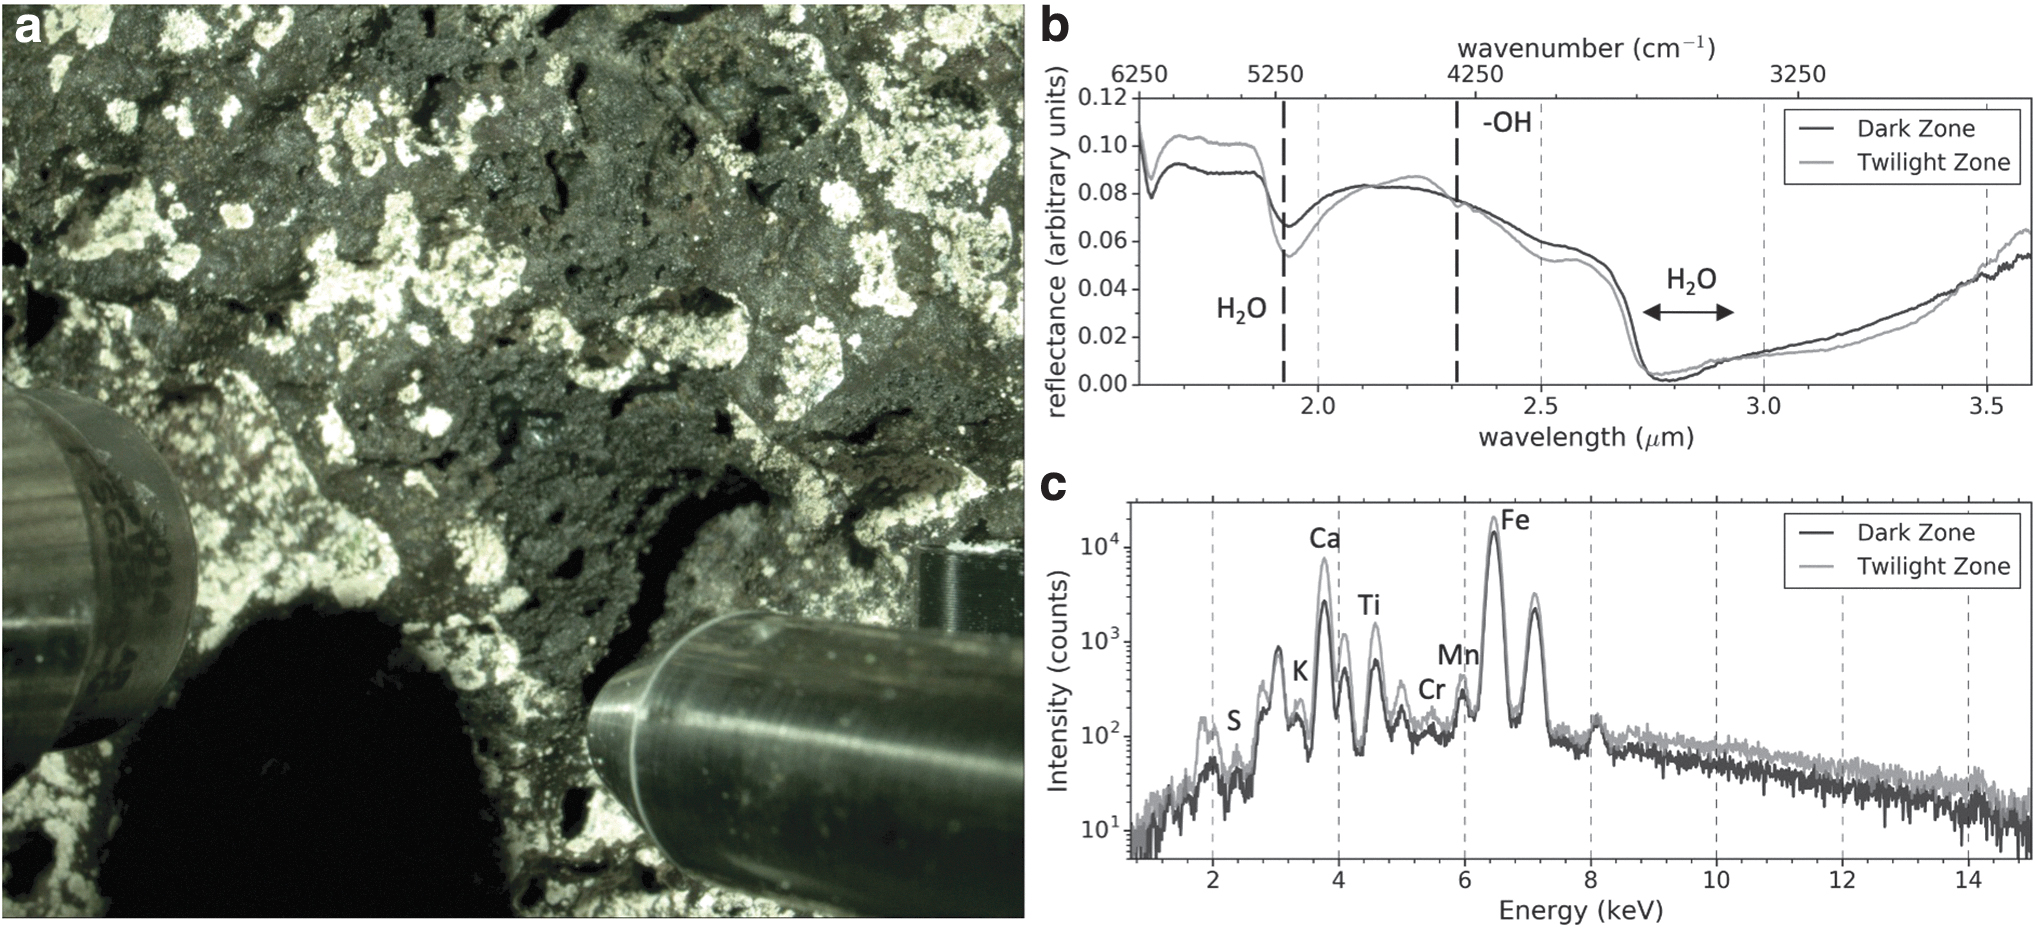
Figure 11a shows LEMUR 3 performing a vertical traverse over the Cyanobacteria-rich microbial mat. Figure 11b shows a photograph acquired by the scientific context imager on the GURILA/APE instrument stage, which reveals a green-colored microbial mat, a white-colored calcified deposit, and a dark-colored basalt rock. The APE detector and X-ray source are visible in this image.

Figure 11c shows PASA-Lite IR spectra of the underlying basalt (black trace) and the calcified deposit and microbial mat superimposed on the basalt (gray trace) collected while mounted to LEMUR 3. Major absorption features are labeled: H2O symmetric bend and asymmetric stretch combination band at ∼1.95 μm, the hydroxyl stretching and –OH bending modes at ∼2.4 μm, and broad H2O and HO− stretching vibrations from ∼2.6 to 3.0 μm (Pieters and Englert, 1993; Bishop et al., 2014).
Figure 11d shows an annotated XRF spectrum collected from the same locations while the instrument was mounted to LEMUR 3. Throughout this study, the Kα and Kβ lines of major and minor elements detected by APE are labeled in fluorescence spectra; other lines with lower transition probabilities, and peaks related to trace elements are not labeled (Deslattes et al., 2005). The APE collected a line scan measurement across a Cyanobacteria microbial mat/basalt boundary; the spectra presented in Fig. 11d represent the extrema of this scan.
Figure 11e shows two spectra collected with the MOBIUS laboratory spectrometer of a returned sample (shown in Fig. 11f); the black trace represents an average spectrum of the basalt region, and the gray trace represents an average spectrum of the green-colored microbial mat. Annotations indicating the broad classification of Raman scattering peaks associated with characteristic frequencies of molecular functional groups are noted, including carbonate (∼1100 cm−1), organic (∼1500–1600 cm−1), and water (∼3000–3400 cm−1) spectral features.
The returned sample shown in Fig. 11f was measured in the laboratory with the MOBIUS Raman spectrometer and the PIXL breadboard spectrometer, with mapping areas outlined in cyan and red, respectively. An intensity distribution map of the 1630 cm−1 scattering peak is shown in Fig. 11g, alongside a context image, showing an association between the green-colored microbial mat and the strength of this spectral feature. Laser spots were ∼100 μm in diameter, with 200 μm spacing between points. The XRF false-color maps shown in Fig. 11h show high concentrations of Fe associated with basalt, as well as higher concentrations of Ca and Si that are associated with the microbial mat and calcium carbonate crust. The X-ray spot size is ∼100 μm at the target, with points spaced every ∼100 μm. In both these hyperspectral maps, the center of each pixel represents a single measurement, with a linear interpolation between individual spectra.
3.1.3. Gold-colored microbial mat: Twilight Zone versus Dark Zone
Actinobacteria-rich microbial mats and crust are present on the basalt walls near the entrance of the cave in the Dark and Twilight Zones, as shown in Fig. 9 (Northup et al., 2011). A photograph showing the brightly colored biological deposit and the dark basalt host rock acquired by the scientific context camera are presented in Fig. 12a. Figure 12b and c show spectra of basalt walls containing these microbial mats measured at each of the Actinobacteria-rich measuring sites noted in Fig. 9 by PASA-Lite (Fig. 12b) and APE (Fig. 12c), where the black trace represents a spectrum of the microbial community in the Dark Zone, and the gray spectrum represents a measurement acquired in the Twilight Zone. Point spectra were acquired in both locations of microbial mat-rich regions of the sample to maximize signal. These spectra were acquired in situ in a stand-alone mode – not while integrated with LEMUR 3.
3.1.4. Coralloid deposits
Coralloid deposits, colloquially known as “cave popcorn,” are present throughout the main passage of Four Windows. Cave popcorn typically precipitates from calcium-rich waters that have seeped into the cave (Hill et al., 1997). A photograph of a coralloid measured in situ is shown in Fig. 13a.

Figure 13b shows an IR spectrum of the coralloid sample measured with PASA-Lite, with the gray trace representing the white precipitated structure and the black trace representing the underlying basalt. Annotations indicate the most significant vibration modes in the reflectance spectrum. Figure 13c shows an XRF spectrum of the basalt and coralloid measured with APE with elemental peak assignments indicated. Both PASA-Lite and APE collected measurements of the sample noted in Fig. 13a in situ, unmounted from LEMUR 3.
Raman spectra of a coralloid-bearing basalt sample (shown in Fig. 13e) are presented in Fig. 13d. Point spectra at several locations on the target were acquired, denoted by the colored circles in Fig. 13e, including white-colored coralloids, bare basalt, and thin white-colored evaporite deposits. Two distinct spectra are presented in Fig. 13d: a carbonate-rich region (black trace, blue-colored spots in Fig. 13e), containing strong carbonate spectral features (∼1100 cm−1) and a sulfate-rich region (gray trace, red-colored region in Fig. 13e), containing strong sulfate spectral features (∼1000 cm−1).
3.1.5. Sulfate deposits
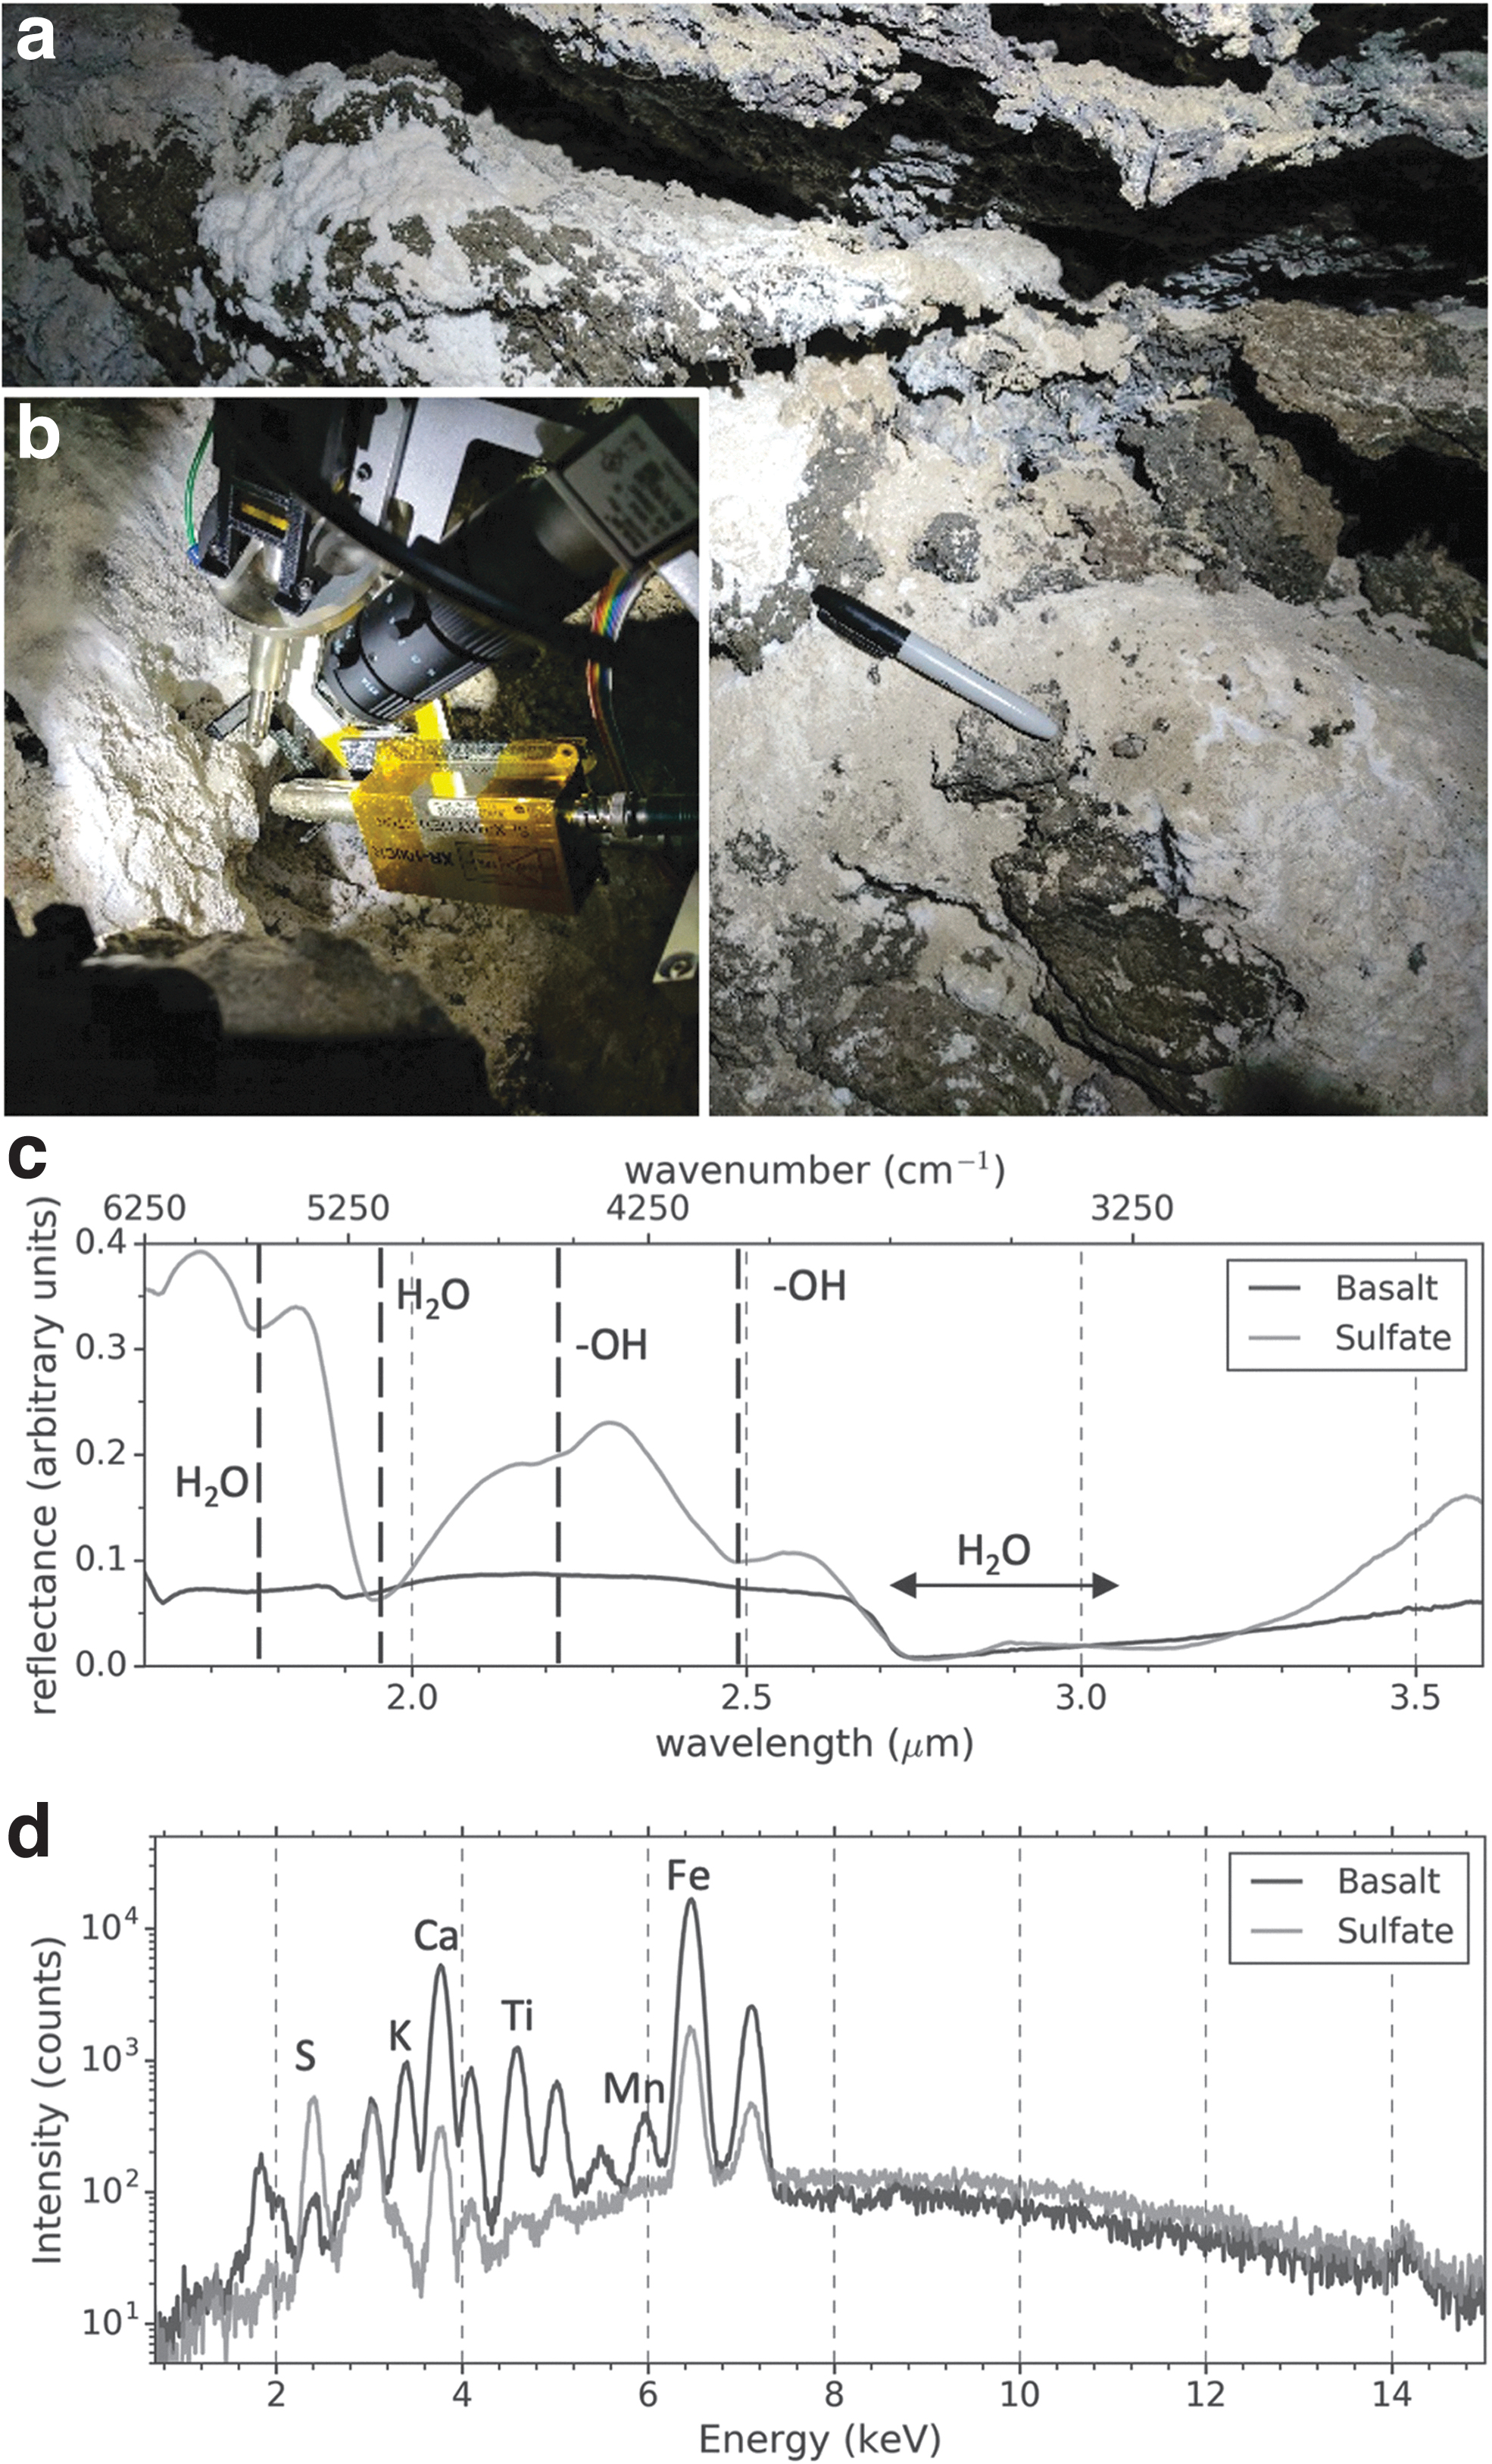
Several accumulations of a white, powdery sulfate deposit are located in the upper room at the end of the main passage (labeled as Oe Puna Beach in Fig. 9), near the second entrance (Marinakis, 1997). Figure 14a shows a photograph of these deposits, which coat the floor in the Oe Puna Beach Room (Fig. 9) and appear to be emerging from veins in nearby walls, which are encrusted with the same white-colored deposit. We measured these deposits and nearby veins with PASA-Lite and APE in a stand-alone configuration (Fig. 14b). An IR spectrum of the sulfate deposit measured with PASA-Lite is presented in Fig. 14c, with the gray trace representing the white precipitate and the black trace representing the underlying basalt. Figure 14d shows an XRF spectrum of the basalt with sulfate deposit measured by APE.
3.2. Stratigraphic outcrops: Titus Canyon
We analyzed a single Girvanella-rich unit within a larger outcrop of carbonate in Titus Canyon. In situ measurements acquired by the integrated instrument suite were constrained by the schedule of the 3-day field expedition to Titus Canyon, which also included LEMUR 3 climbing tests, stand-alone measurements, and sample collection.
We collected samples from a nearby talus pile associated with the same stratigraphic layer for follow-up measurements with laboratory instruments. Samples were removed from inconspicuous locations, packaged in sterile aluminum foil (sterilized through a dry heating technique to 450°C for 10 h) and sealed in plastic containers to limit contamination.
3.2.1. Climbing results
The LEMUR 3 robot successfully climbed on two stratigraphic surfaces at roughly 70- and 90-degree (vertical) slopes at the Titus Canyon site, including surfaces where oncoids were present. The robot was operated with a full-gravity offload system, which also served as a safety line that provided an effective weight of approximately ±3 kg. The surfaces were moderately suited to microspine grippers with a few asperities at the 1–10 mm scale, but many asperities at the sub-millimeter scale. Long climbs were not attempted; the limited fieldwork was focused on scientific integration and data acquisition.
3.2.2. Textural biosignatures
The oncolite shown in Fig. 15a and b was measured with all three instruments while integrated aboard the LEMUR 3 rock-climbing robot. The sample is located within a carbonate matrix and has similar features found throughout this unit (see Fig. 10a for context). An IR spectrum of the carbonate matrix (black trace) and the oncolite (gray trace) is shown in Fig. 15c with prominent absorption features annotated. A GURILA fluorescence spectrum is presented in Fig. 15d, showing increased fluorescence signal on the oncolite (gray trace) compared with the carbonate matrix (black trace). A Raman spectrum of a returned sample is presented in Fig. 15e with an inset showing the carbonate (∼1100 cm−1) and organics (∼1500–1600 cm−1) that are described in greater detail in Section 4.2.1. Each spectrum represents an average of several spectra acquired from the dark- and light-colored regions associated with the context image shown in Fig. 15h. The XRF spectra of the carbonate matrix (black trace) and the oncolite (gray trace) measured with APE are presented in Fig. 15f. We present APE and GURILA data that are representative of spectra acquired from the carbonate matrix and the oncolite from a line scan that bisected the feature.
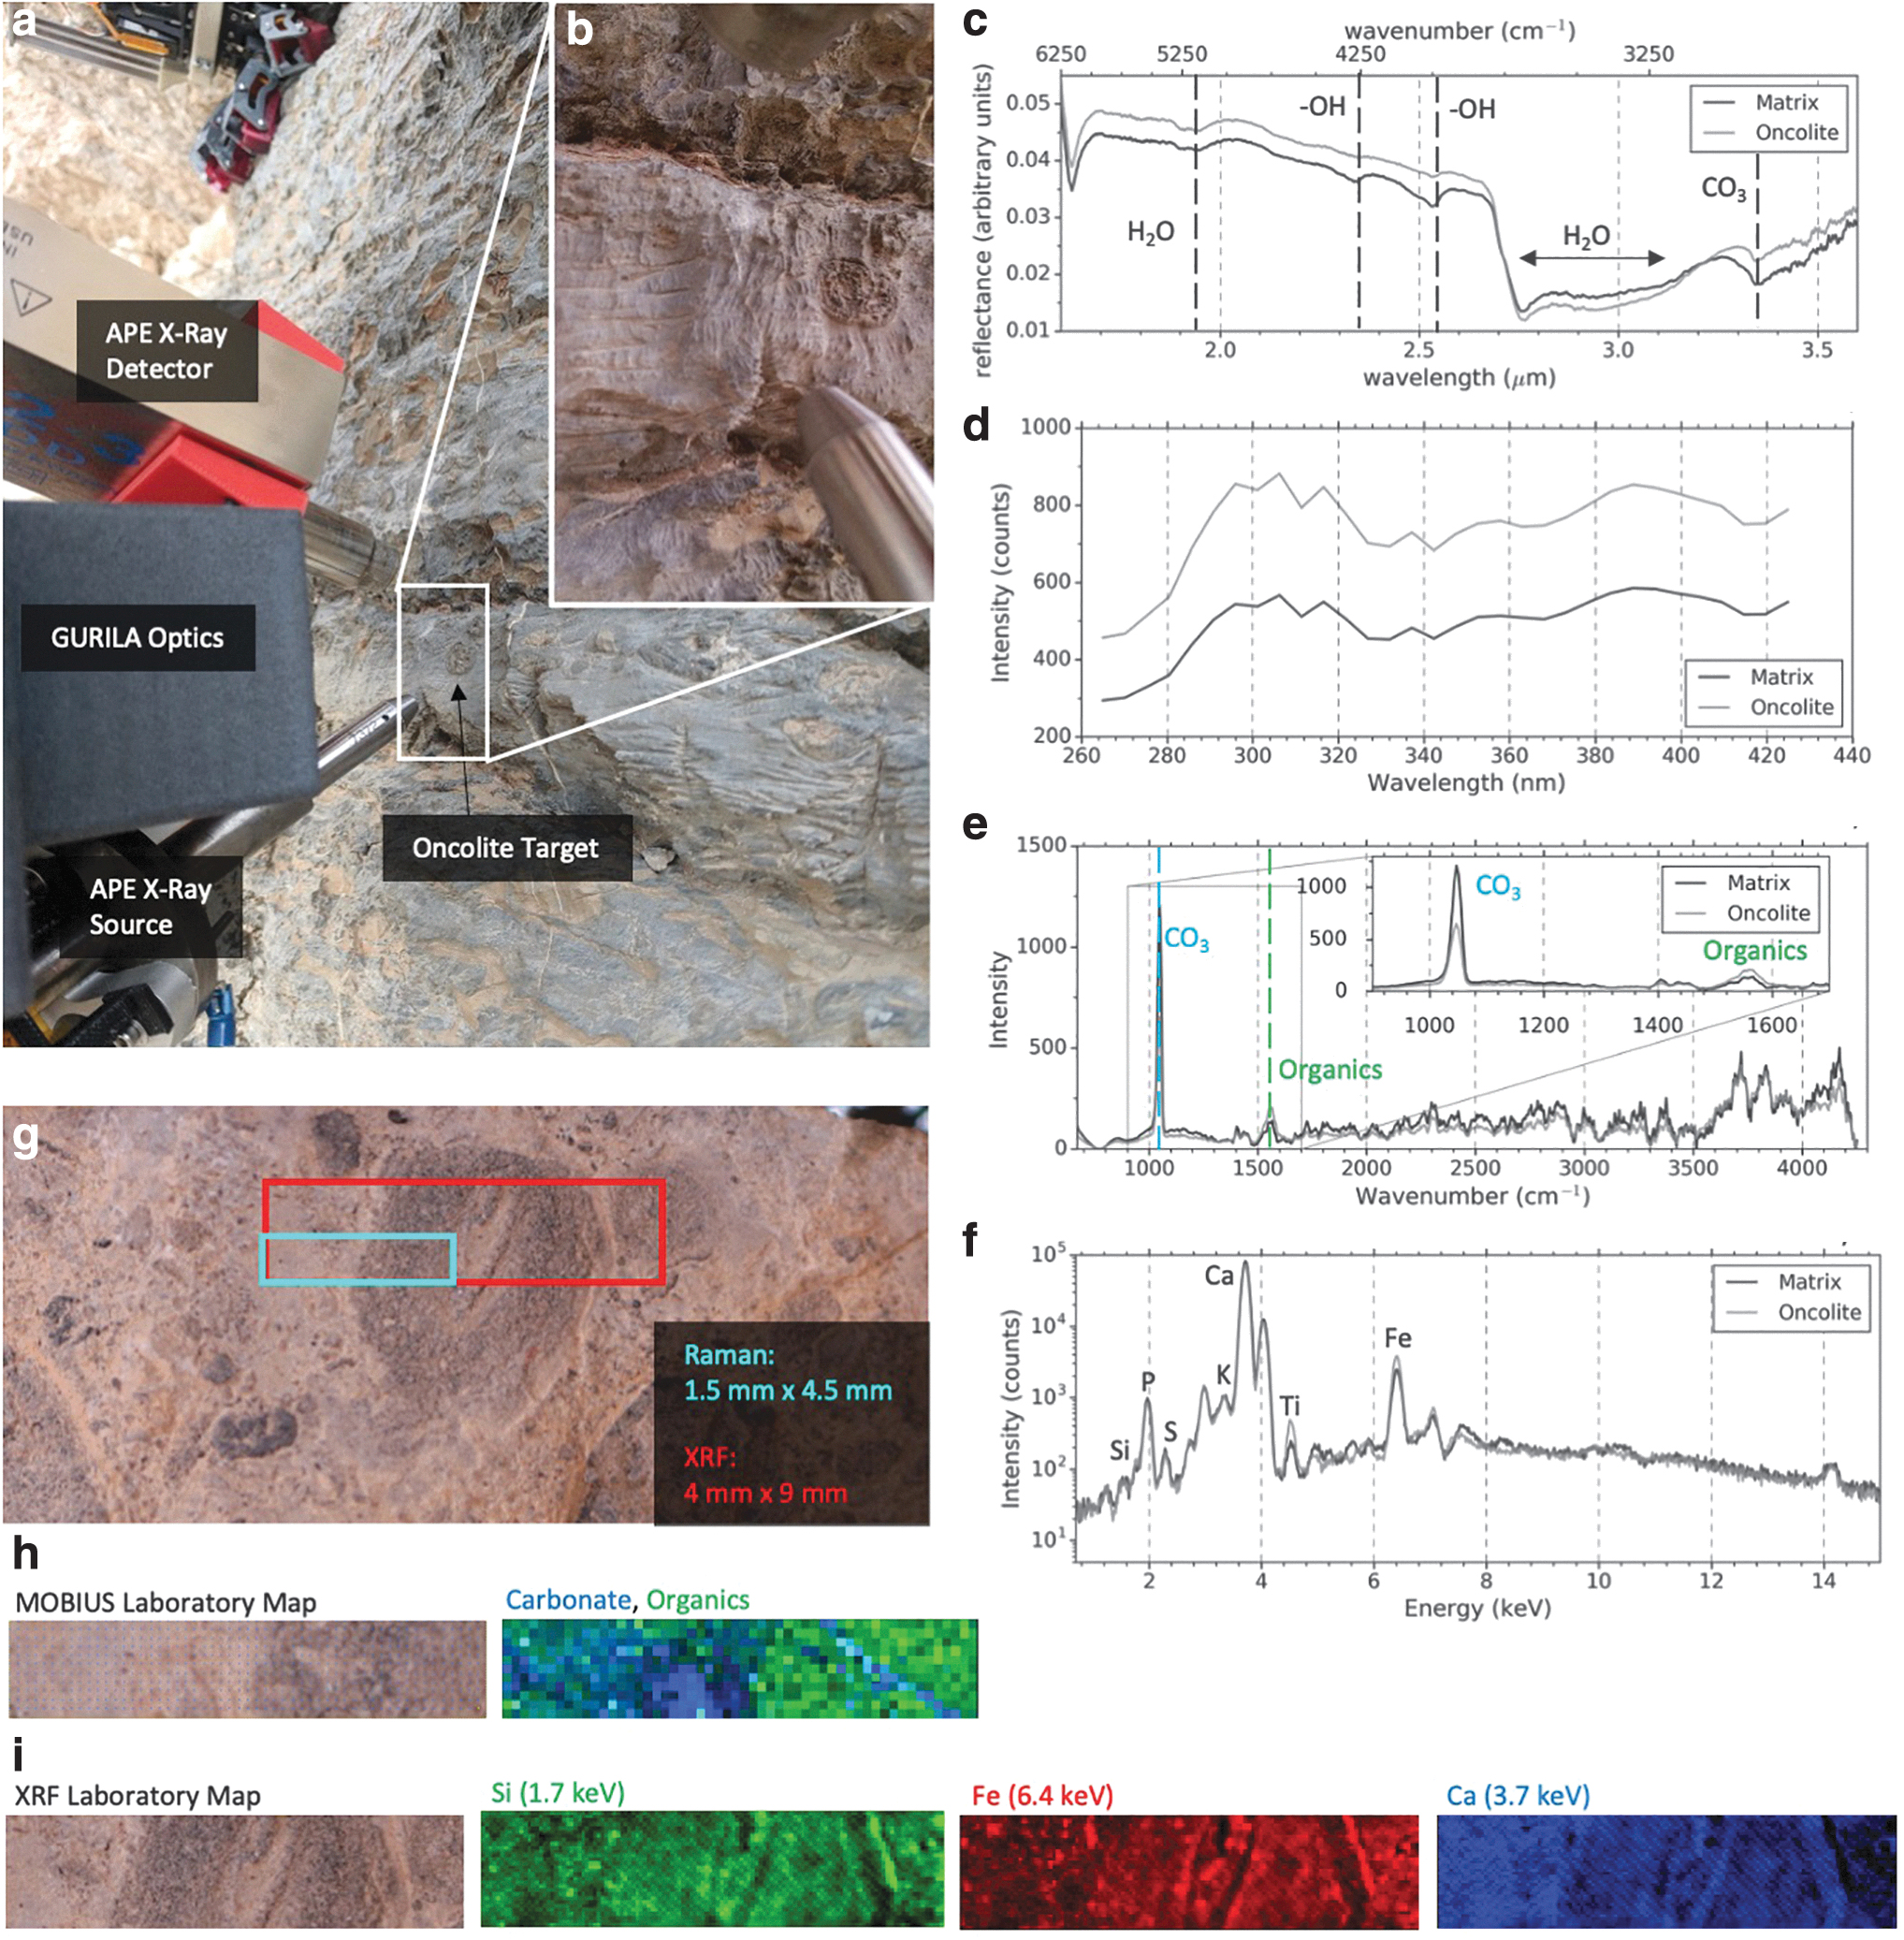
Longer integration hyperspectral measurements acquired with laboratory instruments focused on the returned sample shown in Fig. 15g were also conducted. Figure 15h shows the context image (left: blue points indicating laser shot position) and intensity distribution map for two prominent spectral features identified in Fig. 15e. Laser spots were ∼100 μm in diameter, with 100 μm spacing between points. False-color maps representing the elemental distribution inferred from energy spectra generated by the PIXL breadboard instrument are shown in Fig. 15i. The X-ray spot size is ∼100 μm at the target, with points spaced every ∼100 μm.
3.3. Granite: Sweeney Granite Mountains Desert Research Center
The LEMUR 3 robot successfully climbed two vertical granite faces at a field site at Sweeney Granite Mountains Desert Research Center within the Mojave Desert. The robot was operated with a full-gravity offload system, also serving as a safety line, that provided an effective weight of approximately ±3 kg. The surfaces were well suited to microspine grippers with many asperities at the 1–10 mm scale. The robot autonomy software performed well, faulting and requiring manual intervention only at large discontinuities (ledges and corners), cases for which functionality had not been built into the code operating at the time. The longest climb measured 4.2 m on a vertical surface.
3.4. Statistical techniques
We applied a principal component analysis (PCA) to each hyperspectral map to reduce the dimensionality of the hyperspectral dataset and to determine the dominant organic and mineral vibration modes associated with the microbial community and the elemental composition variability. Before applying PCA, Raman and fluorescence data were calibrated by using the standard procedures described in Section 2.7. The XRF energy calibration was performed by fitting a polynomial to the major, known peak locations of a basalt standard measurement.
Custom software was written in Python to apply PCA to these preprocessed hyperspectral datasets, based on the implementation described in the work of Wold et al. (1987). Principal components are calculated for all spectra by calculating the eigenvectors and eigenvalues of the covariance matrix of the spectra intensity values, with the wavelength (Raman) and energy (XRF) dimensions representing the independent variables. The data are not standardized or normalized. The resulting principal components represent the variance in the hyperspectral maps.
Cluster analysis of the resulting PCA score point cloud was achieved by using a simple k-means clustering machine-learning algorithm to group data points based on their variance relative to principal component loading spectra (Arthur and Vassilvitskii, 2007). False-color maps of the target associated with these cluster analysis results demonstrate spectral variability correlation with millimeter-scale morphologic features in the context images. This can reveal the boundaries or spatial extent of regions of interest associated with trace elements or the relative distribution of organic material throughout a sample without a priori knowledge of the spectral features associated with this variability. Regions of interest are defined by an optimization of the variability of the region (maximizing the distinct number of spectral classes, as defined by the k-means cluster results), while minimizing the area of the region (while still containing some minimum number of points).
4. Discussion
Multiple instruments probing the same target reveal unique characteristics of a sample, leading to a more robust interpretation of its composition or origin. In our case, an IR reflectance spectrometer identifies the bulk mineralogy of a sample by probing the molecular vibrational modes. Similarly, Raman and fluorescence spectroscopy reveal the mineralogical and organic composition of a sample. XRF spectroscopy is used to infer the elemental composition. The interpretation of measurements from a suite of instruments is enhanced by multivariate statistical techniques along with machine-learning cluster analyses to classify the most significant sources of variance within a hyperspectral dataset. Spectral maps, such as those produced in the lab or by APE and GURILA when not under strict time constraints, allow for better correlation between visible context images and spectral features.
4.1. Lava tube cave: El Malpais National Monument
4.1.1. Cyanobacteria microbial mat
Skylights near the cave entrance extend the cave's twilight zone, allowing for the growth of an extensive moss garden atop breakdown (as shown in Fig. 9) and for the support of a Cyanobacteria microbial community inhabiting damp basalt walls.
Comparison of NIR spectra with geologic reference standards provided by the United States Geological Survey (USGS) (Clark et al., 2007) indicates calcite deposition overlying basalt host rocks. A definitive classification of the precipitate from the IR spectrum is not possible due to a relatively weak IR reflectance signal, potentially caused by the complex sample surface and difficulty focusing during the test. Organic content associated with the Cyanobacteria coating, evidenced by the increased concentration of C–H stretch modes in the NIR spectra, is not obvious in the IR spectra. The low atomic weight hydrocarbon-rich cyanobacterial mat is not detectable by the XRF instrument, which instead reveals the calcium associated with the biological carbonate precipitate that underlies the microbial mat. XRF measurements of the basalt wall show strong Ti, Mn, Fe, and Ni peaks relative to the calcified deposit, which contains a higher percentage of S and Ca (Fig. 11d). The detection of S in the precipitate could indicate the presence of calcium sulfates. Strong organic (∼1650 cm−1) and bound water Raman signatures associated with the microbial mat texture are observed in Fig. 11e, demonstrating the ability of this technique to detect organic concentration variability that correlates with morphological features, potentially indicative of microbial mats.
We applied a PCA to the Raman and fluorescence laboratory hyperspectral data set to determine the dominant organic vibration modes associated with the microbial community. An autonomous k-means clustering algorithm applied to the PCA score point cloud reveals the presence of three major spectral groups in the dataset associated with the carbonate deposit (blue), Cyanobacteria microbial mat (red), and basalt (green) shown in Fig. 16a. The magenta false-color map in Fig. 16a represents the variance of the first principal component, which accounts for 91% of all variance within the dataset; high correlation with the spectral variance loading plot indicates high spectral correlation (i.e., high fluorescence and strong organic Raman scattering peaks coincide with the green microbial mat observed in the context image). Dark regions in this false-color map indicate dissimilar spectra. The depth of focus of the MOBIUS instrument is large, relative to the magnitude of the surface roughness for this sample; fluorescence intensity variability is likely not caused by the instrument focus at each point in the hyperspectral map.

The results of PCA applied to the XRF hyperspectral map measured with the PIXL breadboard are presented in Fig. 16b. In this case, the k-means clustering algorithm identifies two main groups (basalt—colored in green, and the red and blue overlying deposit). The majority of the variance within the dataset is associated with the difference between basalt-rich spectral signals and all other spectra. An additional 15% of variance is determined to exist within the calcified deposit (blue and red coloring), where the red regions poorly match the placement of the Cyanobacteria microbial mat shown in the context image. The red-colored region is defined by higher metal content than the blue-colored region, which may indicate an association with a thinner calcified coating, allowing the XRF to probe the underlying basalt more easily. An application of PIQUANT to quantify these spectra reveals the most significant compositional differences to be associated with Fe (∼28% for basalt, compared with approximately <1% for the calcified region), Ca (∼17% for basalt, compared with ∼40% for the calcified region), and Ti (∼1% for basalt, compared with ∼0.1% for the calcified region).
The application of multivariate statistics and unsupervised cluster analyses demonstrate an autonomous method to classifying regions of interest. Regions are ranked based on their variability, distribution of distinct principal components, and presence of boundaries associated with spectral variability, which in this case may provide ideal measurement locations due to a potential overlap between organic material and underlying host rock.
4.1.2. Gold-colored microbial mat: Twilight Zone versus Dark Zone
Unlike the Cyanobacteria microbial mat discussed in Section 4.1.1, these gold-colored microbial mats are not photosynthetic and extract energy instead from organic detritus. Differences in the microbial communities inhabiting the twilight and dark zones of the cave may be revealed through distinct spectral signatures. The IR PASA-Lite spectrum of the sample located in the Twilight Zone shows enhanced absorption of the H2O stretch at ∼1.9 μm and –OH stretch at ∼2.4 μm. These features may indicate increased adsorbed water content on the target surface, likely caused by the higher relative humidity at this site due to its proximity to the entrance of the cave and the skylights (shown in Fig. 9). The XRF spectrum in Fig. 12c appears to show an enhanced spectral signal for all peaks in the Twilight Zone, likely caused by improved focusing at this location. Normalizing these spectra to the count rate reveals similar peak areas, indicating a nearly identical composition at each of these sites.
The relatively small size of the microbial mat patches and the tendency for these biomats to conform to concave features within the pitted basalt wall contribute to the difficulty in focusing on these targets. Spectra presented here are, therefore, more likely to represent a mixture of the microbial mat and basalt wall, which fluoresces efficiently in the X-ray region, potentially overwhelming any signal contribution from the microbial mat. A high-density hyperspectral map could reveal spectral differences associated with the microbial mat by applying a spatial de-convolution to the dataset or by using the multivariate technique described in Section 3.4. We were unable to locate a sample from this region to return to the lab for longer integration measurements, and generating high-resolution maps with APE in the field was not possible due to the prohibitively long time required for acquisition.
4.1.3. Coralloid deposits
Coralloid features are typically precipitated out of solution in caves from water enriched in Ca ions. Higher overall reflectivity of the coralloid is noted in the IR spectrum in Fig. 13b as well as the presence of carbonate absorption features associated with calcite (Gaffey, 1987; Clark et al., 2007), which are absent in the basalt host rock. The XRF spectra produced by APE are similar in both sample regions, with differences in the overall signal strength associated with poorer focusing of the X-ray beam on the small coralloids. Similar to the instrument focusing difficulties described in Section 4.1.2, the small size of the coralloid and high fluorescence yield of the basalt results in the spectral signature of the basalt overwhelming the signal associated with the coralloid. The low IR reflectivity of basalt limits the potential signal degradation in the IR spectra presented in Fig. 13b, revealing the spectral differences associated with the carbonate precipitate more easily.
Raman spectroscopy measurements of a basalt sample returned to the laboratory containing coralloids also show carbonate-rich features with some sulfate-rich deposits in an isolated region on the left side of the sample. Our laboratory instrument is unable to create a high-resolution hyperspectral map of this sample due to its complex topographic profile, but several point scans of coralloids, bare basalt, and evaporite deposits reveal a distribution of mineral precipitates. Direct measurements of coralloid (white circular protrusions) are carbonate rich, consistent with results from PASA-Lite. The overall Raman scattering signal is stronger on more highly concentrated precipitate deposits (inferred by a whiter color), which appear thicker with distance from the bare basalt visible in the lower portion of the image. Higher concentrations of carbonates on the right side of Fig. 13e transition to sulfate-rich deposits on the left side of the sample. In addition, higher concentrations of carbonates are observed with closer proximity to the bare basalt with increasing sulfate composition with distance from this region. This reveals the aqueous alteration of this precipitate layer—carbonates likely precipitate out of solution first, followed by sulfates, possibly as liquid flows down gradients toward the bare basalt. This sample was collected from a breakdown pile in the main passage of the cave, and therefore its original orientation during the formation of these features is not known.
4.1.4. Sulfate deposits
Sulfate deposits lie within veins along the walls, and large deposits lie on the ground in heaps near Oe Puna Beach shown in Fig. 9. The largest deposit has been steadily shrinking since it was first identified in the early 1990s. Both wall and floor deposits were measured with PASA-Lite and APE. The IR spectra reveal similar spectral features in the wall and floor deposits, possibly indicating that the white sulfates, which have a powdery consistency, are precipitated out of solution in large veins along the walls of the cave and deposited onto the nearby floor by air flow from the nearby entrance. The reduction in size of the large sulfate deposit may indicate that the precipitation rate has been variable over the decades-long timescale since they were documented. Alternatively, their reduction may simply be caused by increased human impact as access to the cave has improved over this time. The XRF spectrum of the sodium sulfate powder shows an enhanced concentration of sulfur (by ∼40%) and a diminished concentration of Ca (by ∼10%), Fe (by ∼35%), and Ti (by ∼3%) relative to the basalt background.
4.2. Stratigraphic section: Titus Canyon
4.2.1. Oncolites
The concentric features presented in Fig. 10b likely formed via incremental microbially induced precipitation of carbonate around a small grain that served as a nucleation site. Biological mediation of these features is possible, especially given the setting—a warm, shallow sea (Niemi, 2012)—and evidence for Cyanobacteria reported from similar features in this and other units [e.g., Nicholson and Etheridge (1878) and microfossils reported in the work of Liu et al. (2016)]. However, concentrically laminated features accreted around a nucleus are known to form abiotically, and there is an extensive literature debating the biogenicity of modern and ancient ooids (e.g., Davies et al., 1978; Summons et al., 2013; Flannery et al., 2019). The spatially resolved association of carbonate minerals, elemental enrichments, and organics, and the putative textural biosignatures visible in context images provide several lines of circumstantial evidence that help to inform a biological/abiological interpretation of the features. In this case, the textural biosignatures are closely associated with organic molecules, as well as the elements and minerals that would be expected to preserve these molecules had they formed via the metabolic activities of Cyanobacteria living in a habitable environment.
Results of the in situ measurements presented in Fig. 15c, d, and f reveal the presence of carbonate-rich minerals, as well as increased fluorescence associated with the oncolite, compared with the carbonate matrix, possibly due to the increased concentration of organics, described in more detail later. No significant spectral differences are observed in the NIR spectra associated with the concretion and the mineral matrix; higher reflectivity in the oncolite may be attributed to better instrument focusing at this location. The presence of organic Raman scattering features associated with both regions measured suggests the presence of organic matter, possibly with an increased contribution coincident with the oncolite, as shown in Fig. 15h. The carbonate-rich band cutting through the right side of the oncolite in Fig. 15h does not appear in the context image and is hypothesized to be a small surficial carbonate scratch, possibly caused during deposition in the talus pile from which the sample was retrieved.
Results from a PCA applied to the fluorescence and Raman MOBIUS hyperspectral maps are shown in Figs. 17a and b, respectively. The k-means clustering algorithm applied to the principal component score point cloud identified two primary clusters (cyan and magenta in Fig. 17a) corresponding to a distinct double-fluorescence feature at 300 and 340 nm, which appears to be absent in spectra more closely correlated with the carbonate matrix. The fluorescence peaks in the oncolite region of the hyperspectral map could be attributed to large-structure organic compounds. Cluster analysis results of the PCA of the Raman spectra show a more intense Raman organic feature associated with this same region in the sample, indicating that these fluorescence features are correlated with organics. The PCA was also applied to the Raman MOBIUS spectrum, revealing variance associated with the carbonate-organic Raman scatter feature peak ratios. Spectra associated with the oncolite (red-colored points) are enhanced in organics relative to the matrix spectra (green-colored points). The blue-colored points are associated with a high carbonate signal.

The XRF spectrum of the carbonate matrix appears similar to the oncolite target (shown in Fig. 15f), however a PCA applied to the dataset presented in Fig. 15i, shown in Fig. 17c, reveals subtle variability highly correlated with the oncolite feature visible in the context image. The principal component variability plot shows positive and negative correlation between spectral features associated with each element. Spectra more closely associated with the carbonate rock (green points) have relatively higher peak areas associated with Ca and lower concentrations of Fe, Si, Ti. Oncolite spectra are elevated in Fe, Si, Ti, and depleted in Ca, possibly due to a biofilm adhering to detrital grains or selective diagenetic replacement of carbonate due to the presence of organics. A quantification of these spectra is consistent with this result, with the carbonate containing ∼40% Ca and ∼19% Si, compared with ∼38% Ca and 24% Si in the oncolite.
5. Conclusions
Field tests conducted in a basaltic lava tube and along stratigraphic sections exposed in cliffs simulated two types of semi-autonomous planetary science missions investigating astrobiology targets. Autonomous climbing with the LEMUR 3 robotic platform provided access to science targets in extreme terrain. A confocal arrangement of nondestructive instruments allowed interrogation of a specific target simultaneously and without the need for complex image co-registration and precision pointing. An autofocusing algorithm that controlled the 3-axis instrument stage maximized the signal from the contact science instruments.
The instrument suite used in this study (Raman spectrometer, XRF spectrometer, NIR spectrometer) was selected to identify distinct astrobiologically relevant classes of rock components. The combined measurements of the elemental, mineralogic, and organic rock components provided greater confidence for a biogenic interpretation of textural biosignatures encountered in the field as the results showed organic and elemental compositional variability correlated with textural features, demonstrating the importance of interrogating samples with multiple instruments to evaluate the biogenicity of a sample.
Although the exact instrument suite and the design of the robotic platform are likely to be different for future in situ astrobiology missions to extreme terrains, and chosen specifically for the science goals and terrain of the given target, the lessons learned by the work presented here can be applied to the architecture of future missions. Key takeaways included: Physical co-registration of the instruments provided the ability to examine more deeply a target with simpler post-processing of the data. Both instruments interrogated the same point on a target; therefore, interpolation of spectra in a hyperspectral map is not required for direct comparison of points at the ∼100 μm scale. In addition, because measurements are collected near-simultaneously, environmental degradation of the sample between measurements is unlikely. Engineering instruments (LIDAR and navigational cameras) were implemented to identify science targets in the field, and additional work in autonomously selecting these targets by using pattern recognition software is in progress. Autonomous vetting of scientific targets based on these surveys could enable a fast operational tempo that is beneficial to cost-effective or time-sensitive mission operations, and it would be essential on a future mission to a subsurface environment where a bandwidth-restricted mission architecture could limit ground-in-the-loop operations. Automated focal stacking techniques reliably demonstrated autonomous focusing of the GURILA and APE instruments in the field without requiring manual focus adjustments for each point in the hyperspectral map or rock abrasion to generate a flat surface. The ability of the robot to both access targets in extreme terrain and grossly position the instruments within ∼1 cm of a target proved essential at the various field sites. Investigations solely of the flat terrains in these areas would not have uncovered the biosignatures readily observable on the walls and ceilings and other extreme terrain. A macro-mini approach to pointing far outperformed an all-in-one solution. The robot positioned the instrument suite within ∼1 cm of a target while the instrument scan stages and focus mechanisms performed the fine micrometer-level pointing and focusing required by the instruments. Requiring a larger range of motion from the instrument stages or a finer resolution of movement from the 28 degree of freedom robot each would have incurred large costs and mass increases to approach the performance achieved by the macro-mini system. Finding the correct balance between rover requirements and instrument stage requirements is a key trade deserving early evaluation in any new extreme terrain mission architecture.
Overall, the LEMUR 3 robot was successfully deployed in the field more than 10 times at four different geographic sites with varied terrain. It climbed rough vertical rock facies largely autonomously and carried a suite of five instruments, three scientific and two for engineering. The system's instrument suite successfully identified biosignatures, inferred from compositional variability, trace elements, and the presence of organics within a sample. Comparative laboratory analysis showed similar results, but these larger datasets and the multivariate statistics applied to them allowed for improved correlation between spectral signatures and morphology present in context images. Although many of the samples measured in this study have higher organic content than what is expected to be found on the surface of Mars, the instrument development and integration, operational techniques, and analytical methods discussed by this study are applicable to astrobiology explorations of other planetary surfaces.
Future work should include many more mock missions in a wide variety of extreme terrains of Earth, such as those supported by National Aeronautics and Space Administration (NASA)'s Planetary Science and Technology from Analog Research program, to prepare for successful exploration of these terrains across our solar system. Some of these will take the form of climbing robots such as LEMUR 3 and its ice-climbing sibling, IceWorm (Curtis et al., 2018; Nash et al., 2020), whereas others will use alternative architectures such as rappelling (Nesnas et al., 2019), hopping, perching, and more. These field campaigns and the iterative design/test/fix cycles of development provide the foundation on which future extreme terrain rovers can be built.
Footnotes
Acknowledgments
The authors thank National Park Service and the El Malpais National Monument for their support during their field expeditions. They specifically thank Eric Weaver (ELMA) and Kevin Wilson (DEVA) for logistical support and guidance at these field sites. They also thank Tasha La Doux and Jim Andre for their support of LEMUR 3 climbing operations at the Sweeney Granite Mountains Desert Research Center. The authors thank Aaron Curtis, Christopher Heirwegh, Joseph Razzell Hollis, Abigail Allwood, Lawrence Wade, and Sabrina Feldman for intellectual discussions that have improved this project. Thanks are due to Rina Onishi for assistance with the mechanical configuration of GURILA. The authors thank William Timothy Elam for development of PIQUANT, used in this study to quantify XRF measurements. They also thank Marco Tempest for providing video documentation of their Death Valley field expedition. The authors are grateful to the reviewers of this article, including Chris McKay, for providing helpful feedback on the presentation and discussion of these results.
Author Disclosure Statement
No competing financial interests exist.
Funding Information
This work was carried out at the JPL, California Institute of Technology, under contract with the NASA. Government sponsorship is acknowledged. The authors thank the NASA Planetary Science and Technology through Analog Research for funding under NNH14ZDA001N.
Associate Editor: Christopher McKay