
Abstract
Identifying and distinguishing between abiotic and biotic signatures of organic molecules such as amino acids and fatty acids is key to the search for life on extraterrestrial ocean worlds. Impact ionization mass spectrometers can potentially achieve this by sampling water ice grains formed from ocean water and ejected by moons such as Enceladus and Europa, thereby exploring the habitability of their subsurface oceans in spacecraft flybys. Here, we extend previous high-sensitivity laser-based analog experiments of biomolecules in pure water to investigate the mass spectra of amino acids and fatty acids at simulated abiotic and biotic relative abundances. To account for the complex background matrix expected to emerge from a salty Enceladean ocean that has been in extensive chemical exchange with a carbonaceous rocky core, other organic and inorganic constituents are added to the biosignature mixtures. We find that both amino acids and fatty acids produce sodiated molecular peaks in salty solutions. Under the soft ionization conditions expected for low-velocity (2–6 km/s) encounters of an orbiting spacecraft with ice grains, the unfragmented molecular spectral signatures of amino acids and fatty acids accurately reflect the original relative abundances of the parent molecules within the source solution, enabling characteristic abiotic and biotic relative abundance patterns to be identified. No critical interferences with other abiotic organic compounds were observed. Detection limits of the investigated biosignatures under Enceladus-like conditions are salinity dependent (decreasing sensitivity with increasing salinity), at the μM or nM level. The survivability and ionization efficiency of large organic molecules during impact ionization appear to be significantly improved when they are protected by a frozen water matrix. We infer from our experimental results that encounter velocities of 4–6 km/s are most appropriate for impact ionization mass spectrometers to detect and discriminate between abiotic and biotic signatures.
1. Introduction
The subsurface oceans of the saturnian and jovian moons Enceladus and Europa, respectively, harbor conditions that appear to be suitable for life or its emergence (Hand et al., 2007; Glein et al., 2018; McKay et al., 2018). Enceladus maintains a cryovolcanic plume (Goldstein et al., 2018; Postberg et al., 2018a; Spencer et al., 2018), and similar venting phenomena are potentially occurring on Europa (Huybrighs et al., 2020; Roth et al., 2014; Sparks et al., 2016, 2017; Jia et al., 2018; Paganini et al., 2020). Measurements by the Cassini spacecraft indicate that a large fraction of the ice particles ejected into space formed from ocean water within Enceladus (Postberg et al., 2009b, 2011b). Sampling these ice grains, therefore, provides a method for assessing the physical and chemical properties of the subsurface ocean as well as the ocean-core interface (Postberg et al., 2008, 2009b, 2018b; Hsu et al., 2015; Sekine et al., 2015; Khawaja et al., 2019; Glein and Waite, 2020).
Mass spectrometers such as the Cassini spacecraft's Cosmic Dust Analyzer (CDA) (Srama et al., 2004), the Surface Dust Analyzer (SUDA) (Kempf et al., 2014) being built for NASA's Europa Clipper mission, or instruments proposed for future missions to Enceladus (Lunine et al., 2015; Reh et al., 2016; Mitri et al., 2018), such as the Enceladus Icy Jet Analyzer (ENIJA) (Srama et al., 2015), subsequently renamed the Enceladus Ice Analyzer (ENIA), utilize the principle of impact ionization. In these instruments, ions are generated by hypervelocity (≥1 km/s) impacts of nm- or μm-sized grains onto a metal target, forming an impact plasma from which time of flight (TOF) mass spectra are produced (Hillier et al., 2007; Postberg et al., 2009a, 2011a; Wiederschein et al., 2015; Klenner et al., 2019). The impact ionization process creates singly charged ions almost exclusively, and the spectral peak positions, that is, ion arrival times, therefore only depend on the atomic and molecular masses, together with the spectrometer's field configuration.
The controlled acceleration of μm-sized ice grains to hypervelocities in a laboratory environment for instrument calibration is extremely technically challenging, and techniques employing Laser-Induced Liquid Beam Ion Desorption (LILBID) (Karas et al., 1990, 1991, 2000) have instead been developed to simulate the process (Postberg et al., 2009b; Wiederschein et al., 2015; Klenner et al., 2019; Taubner et al., 2020). Using such a LILBID analog experiment, Klenner et al. (2019) reproduced ice grain mass spectral variations as produced by different ice grain impact speeds recorded by CDA at Saturn. In addition to the ability to reproduce noncompositional spectral variations, a further advantage with the analog laser-desorption approach is that the compounds tested and their concentrations in the water matrix are known. This allows the compositions of ice grains detected in space to be investigated in detail by comparing them with the laboratory data (Postberg et al., 2009b, 2018b; Khawaja et al., 2019).
Data obtained by Cassini's CDA instrument also revealed that ∼25% (by number) of the ice grains formed from Enceladus' salty ocean contain organic material at detectable concentrations (Postberg et al., 2008, 2011b, 2018a). Volatile organic constituents, including aliphatic oxygen- and nitrogen-bearing compounds, have been identified in the majority of these organic-bearing ice grains (Khawaja et al., 2019). It was found that 5–10% of the organic-enriched ice grains contain even more complex organics derived from refractory macromolecules at high (≥0.5 wt.-%) concentrations (Postberg et al., 2018b).
However, given the insufficient mass resolution of CDA, it is still unclear whether these ice grains contain biosignatures. The volatile organics are suggested to have been previously dissolved in the ocean (Khawaja et al., 2019). Their high vapor pressures enable efficient evaporation from Enceladus' oceanic water, and they subsequently undergo recondensation and adsorption onto water ice nucleation cores on cooling during ascent through the icy crustal cracks (Postberg et al., 2018a; Bouquet et al., 2019; Khawaja et al., 2019). In contrast, the refractory and probably hydrophobic macromolecules are hypothesized to originate from an organic layer floating on top of the ocean (Postberg et al., 2018b) (Fig. 1).

Formation of ice grains from heterogeneous nucleation (not to scale) (from Postberg et al., 2018b with permission from Nature).
Among potential biosignatures, amino acids and fatty acids are considered to be particularly diagnostic (McKay et al., 2018). Techniques such as laser-induced fluorescence have been proposed for detecting such biosignatures at low concentrations (e.g., 0.4 ppm of an amino acid in 3 μg of ice collected over an ∼150 km path) during plume traversing Enceladus flybys (Mathies et al., 2017). Recently, an experimental setup also applicable to ocean world space missions has demonstrated that amino acids and lauric acid can be identified in pure water by chemical ionization mass spectrometry, although the exact sensitivity of this technique remains to be determined (Waller et al., 2019).
High sensitivities to such compounds in pure water have been achieved with a LILBID setup by Klenner et al. (2020), who investigated the cation and anion spectra of various biogenic amino acids, fatty acids with 12 to 20 carbon atoms, and peptides with up to four amino acid residues in pure water. Molecular peaks and characteristic fragments were found to be clearly identifiable, with detection limits at the μM to nM level. Although most amino acids and peptides could be best identified in cation spectra, anion spectra were more suitable for the characterization of fatty acids. Molecular peaks of amino acids at a given concentration vary by more than an order of magnitude in intensity because of the different pKa-values and proton affinities of individual amino acids. In contrast, molecular peaks of fatty acids at a given concentration are almost equally high (Klenner et al., 2020).
Building on the foundation of Klenner et al. (2020), here we investigate two additional key aspects required for the characterization of these potential biosignatures if embedded in ice grains emerging from a subsurface ocean and ejected by an Enceladus-like plume.
The example of enceladean ice grains shows that some biosignatures might not be present in relatively pure water ice and instead will coexist with additional inorganic and organic constituents. We investigate the effects of ocean constituents other than water on the spectral appearances and on the detection limits of biosignatures.
Both amino acids and fatty acids are also found in abiotic environments (Cronin and Pizzarello, 1983; Altwegg et al., 2016). However, the abundance ratios of specific amino acids and fatty acids that result from abiotic and biotic generation are distinctly different. We investigate abundances from both sources with the LILBID experiments to predict characteristic mass spectrometric fingerprints for abiotic and biotic cases in impact ionization mass spectrometers on future space missions.
The abiotic synthesis of amino acids in water–rock systems (e.g., Menez et al., 2018) follows the free energy of formation with the abundance of the simplest amino acid glycine exceeding those of other, more complex amino acids (Higgs and Pudritz, 2009). Because abiotic synthesis is generally inefficient, kinetically controlled reactions should favor the synthesis of simpler amino acids. In contrast, in biotic systems the more complex amino acids become prevalent and therefore the ratio of different amino acids to glycine can be used as a biosignature (Dorn et al., 2011; Davila and McKay, 2014; Reh et al., 2016; Sherwood, 2016; Creamer et al., 2017).
Fatty acids can also aid in the search for life, as they are commonly present in the lipid membranes of Earth life. For most organisms (bacteria and eukaryotes), fatty acids are biochemically produced by the addition of two carbon atoms at a time, resulting in an excess of unbranched, saturated fatty acids with an even number of carbon atoms, with hexadecanoic acid (C16) and octadecanoic acid (C18) dominating (Georgiou and Deamer, 2014). For archaea, carbon chains are constructed from isoprene units, and hence they exhibit a 5-carbon pattern (Berg et al., 2012). In contrast, in the abiotic (e.g., Fischer-Tropsch) synthesis of carbon chains, carbon atoms are added one at a time. The relative abundances of fatty acids with different backbone lengths can, therefore, serve as a discriminator for biosignatures (Summons et al., 2008; Dorn et al., 2011; Reh et al., 2016; Sherwood, 2016), although these patterns may be significantly less apparent in psychrophilic organisms that use more branched and unsaturated fatty acids to maintain membrane flexibility (M.J. Malaska, pers. comm., 2019). In addition to mere detection, the ability to differentiate between biotic and abiotic signatures on extraterrestrial ocean worlds might therefore be crucial in the search for life.
The effects of ocean constituents other than water on the spectral appearance and detection limits for the key organic species mentioned earlier are of particular relevance to ocean worlds. Sodium salts, believed to be endogenous, have been observed not only on the surface of Europa (Trumbo et al., 2019) but also in particles emitted by Enceladus, where a large fraction of the ice grains detected in the plume are believed to be frozen ocean spray (called Type 3 grains). There, the nonwater constituents are dominated by sodium salts amounting to about 1% of the ice grain's mass (Postberg et al., 2009b, 2011b). These salts produce large quantities of cations and anions on impact ionization and may suppress the signals arising from less abundant dissolved constituents or modify their spectral appearance (Annesley, 2003; Piwowar et al., 2009). Amino acids are quite soluble (Dunn et al., 1933) and, if present, will dissolve in Enceladus' salty ocean and can be expected to reside in the salty Type 3 ice grains. Thus, in this work we investigate amino acids in an Enceladus-like salty ocean scenario and examine the effects of sodium salts on the mass spectral appearance as well as detection limits of the amino acids.
Although the enceladean ocean is alkaline (e.g., Postberg et al., 2009b; Glein et al., 2015, 2018) and contains sodium (e.g., Postberg et al., 2009b), it is reasonable to assume that long-chain fatty acids, due to their low solubility in water, are not significantly dissolved in the ocean at temperatures close to 0°C, but instead are part of a phase-separated organic layer on top of the water surface as described in the work of Postberg et al. (2018b). After these components are aerosolized, they could serve as condensation cores for water vapor within the south polar ice vents, thereby growing a salt-poor outer ice layer on the grain (Postberg et al., 2018a, 2018b). We, therefore, investigate appropriate mixtures of different fatty acids in a salt-poor solution and differentiate between biotic and abiotic signatures in the corresponding mass spectra.
In addition to potential biosignatures and salts, other organic species, most notably low-mass carboxylic acids, which are abundant in carbonaceous chondrites (Huang et al., 2005), could coexist in the ice grains. The latter species could be derived from a primordial reservoir in carbonaceous rock at the bottom of the ocean. We, therefore, investigate a complex mix of amino acids together with fatty acids and other organic background compounds, to identify potential interferences and infer how readily biosignatures from these key organic species can be detected in such a complex mixture.
2. Methods
Analog mass spectra were generated by the LILBID mass spectrometer acting on water or water–acetonitrile matrixed solutions (see section 2.2). Here, the LILBID process, as well as the variety and concentrations of the solutions used, is described.
2.1. Experimental
The experimental setup used for this work (Fig. 2) is described in detail in the work of Klenner et al. (2019) and we, therefore, provide only a brief overview here.

Laboratory analog setup (the LILBID-TOF-MS apparatus) for simulating hypervelocity impacts of ice grains onto impact ionization mass spectrometers in space. The schematic (inset) shows the instrument configuration underlying the principle of delayed extraction (adapted from Postberg et al., 2018b; taken from Klenner et al., 2019). The oil diffusion pump shown has recently been replaced by a turbo pump. LILBID, Laser-Induced Liquid Beam Ion Desorption; TOF-MS, time-of-flight mass spectrometer. Color images are available online.
The technique used to simulate the impact ionization process of ice grains in space is as follows. A μm-sized liquid water beam is irradiated by a pulsed infrared laser (20 Hz and 7 ns pulse length) operating at a wavelength of ∼2850 nm and at variable laser intensities (0–100%). The water beam absorbs the laser energy and explosively disperses into atomic, molecular, and macroscopic fragments, a portion of which is charged. After passing through a field-free drift region, cations and anions are analyzed in a commercial reflectron TOF mass spectrometer. The mass spectrometer uses the principle of delayed extraction (Klenner et al., 2019). The delay time between laser shot and the switch-on of the acceleration voltages of the mass spectrometer, during which ions traverse the field-free region and enter the acceleration region, is adjusted, which allows the extraction of the ions as a function of their initial velocities. After amplifying and digitizing the detected signals, the final mass spectrum is recorded with a LabVIEW-controlled computer. The mass spectra presented here are each an average of typically 500 individual spectra, co-added to improve the signal to noise ratio. The experimental setup is intensity calibrated before every measurement by using a 10−6 M NaCl solution at three different delay times and laser intensities to ensure reproducible spectra. The mass spectra typically achieve a mass resolution of 600–800 m/Δm (full width at half maximum).
2.2. Biosignature solutions
Three main compositional scenarios have been investigated by using four different types of solution (i, ii, iii, and iv below). Later, amino acids are abbreviated to their common three letter codes (Table 1) and fatty acids to their respective carbon number Cn.
Detection Limits for the Laser-Induced Liquid Beam Ion Desorption Results and Molecular Weights of Amino Acids in a Salty 0.1 M NaCl Solution
Note that detection limits for space instruments will likely be lower than these values (see main text).
We note that Orn produces an AA +67 u peak with an amplitude lower than AA +45, although the detection limit was not determined.
AA, amino acid.
2.2.1. Amino acids in a salt-rich solution
2.2.1.1. Solution type i
Initially, 100 ppmw of the single amino acids His and Arg, each in a separate 0.1 M NaCl solution, were measured to investigate the general spectral appearance of amino acids under salty ocean conditions. Detection limits of each of the following 10 amino acids under such conditions were determined: Asp, Glu, His, Arg, Cit, Gly, Ser, Thr, Orn, and Tyr. A characteristic mass peak just exceeding a 3 σ signal to noise level was defined as the detection limit.
2.2.1.2. Solution type ii
These experiments were designed to investigate the mass spectra from ice grains that preserve the composition of a hypothetical abiotic ocean on Enceladus.
The abiotic abundances of amino acids and other soluble organic constituents are calculated under the simplified assumption that Enceladus' rocky core has a composition similar to primitive CR chondrites and that all water-soluble organics are unlikely to remain for long timescales in the highly porous, water-percolated (Choblet et al., 2017) rocky core, instead leaching into the ocean water. Organic abundances in CR2 and CR3 chondrites were reported by Glavin et al. (2011) and Pizzarello et al. (2012). We use the average concentrations (nmol/kg) of the seven most abundant amino acids, and those of the 14 other most abundant soluble organic compounds (Supplementary Table S1), dissolving their total mass in the entire ocean volume. Estimates of the mass of the rocky core and Enceladus' ocean were obtained from the work of Waite et al. (2017). An example calculation and the resulting concentrations of the amino acids and carboxylic acids are summarized in Supplementary Data and Supplementary Table S1. Concentrations of the most abundant inorganic substances were inferred by using values for the most abundant salts (0.1 M NaCl, 0.015 M Na2CO3, and 0.015 M NaHCO3) from Postberg et al. (2009b) and adopting an NH3 concentration of 0.01 M (Waite et al., 2017).
2.2.2. Fatty acids in a salt-poor solution
2.2.2.1. Solution type iii
In contrast to amino acids, long-chain fatty acids are thought unlikely to be present at high concentrations in the salty ocean water because of their low water solubilities. They instead may accumulate in a thin organic film/layer on top of the water surface (Postberg et al., 2018b). Making combined solutions in the laboratory, at concentrations in pure water approaching the upper limit for the nine fatty acids (C12–20), was found to be unfeasible and instead an acetonitrile–water mixture (50:50 vol) was used together with the sodium salts (soaps) of the fatty acids (as in Klenner et al., 2020). This enabled the required concentrations to be achieved and also introduced small amounts of sodium into the solution, as might be expected in the organic layer on Enceladus (Postberg et al., 2018b) from physical mixing during the disruption of this layer (Fig. 1).
Abundances of abiotically produced fatty acids in carbonaceous chondrites range from 100 ppbw to 5 pptw (Hayes, 1967; Lai et al., 2019); leaching from the chondrite-like core of Enceladus (Sekine et al., 2015) would generate dissolved free fatty acids (DFFAs) in the ocean in the ∼20–200 micromolar range (Waite et al., 2017). Abiotic fatty acid synthesis via, for example, Fischer-Tropsch-type processes (Loison et al., 2010) results in no preference for the production of odd or even carbon number fatty acids (see Section 1). We, therefore, consider the solution investigated by Klenner et al. (2020), with each saturated fatty acid at a concentration of 5.5 × 10⁻⁶ M, as a possible lower bound. By contrast, many biochemically produced fatty acids show a clear preference for even carbon number fatty acids over odd carbon number fatty acids, with C16 and C18 showing the highest abundances (Georgiou and Deamer, 2014) (see Section 1). To investigate the spectral appearance of a simplified biotic versus an abiotic fatty acid fingerprint at comparable concentrations, a solution with the odd carbon number fatty acids (saturated) at a concentration of 5.5 × 10⁻⁶ M; C12, C14, and C20 at a concentration of 55 × 10−6 M (10-fold greater than the odd-carbon background); and C16 and C18 at a concentration of 275 × 10−6 M (50-fold greater) was prepared and analyzed. Concentrations in ppmw can be found in Supplementary Table S2. Due to the use of the sodium salts, this resulted in a [Na]+ concentration of about 0.75 mM in the solutions used.
2.2.3. Complex biosignature mix
2.2.3.1. Solution type iv
We also investigate a more complex case in which amino acids and fatty acids enter Enceladus' ocean from biotic processes at depth. The fatty acids are assumed to migrate upward through the oceanic layer by thermal convection and bubble transport, thereby accumulating in an organic layer at the ocean's surface (Porco et al., 2017; Postberg et al., 2018b). Droplets formed from this layer may become the cores of salt-poor ice grains (Fig. 1) after they are aerosolized from bubble bursting (Postberg et al., 2018b).
We based our concentration estimates on Earth's ocean as an analogue, as amino acid concentrations are determined by life as a system, which produces and consumes them. The presence of specific amino acids (e.g., aspartic acid and arginine) indicates either active biotic or abiotic production, because these amino acids are degraded over relatively short geological timescales (<1 Ma) (Truong et al., 2019). Ocean concentrations of dissolved free amino acids (DFAAs) are 10–20 nM in the deep ocean (Repeta, 2014), equivalent to about 1 ppbw Gly. The average concentration of DFFAs in ocean water is 5–80 μg/L or 5–80 ppbw (Zsolnay, 1977). We adjust this value based on enrichment of organics in marine sea spray aerosols, which was found to be a good analogue for organic-enriched ice grains from Enceladus (Postberg et al., 2018b). Russel et al. (2010) observed that bulk organic compounds are 100–1000 times enriched in marine aerosols compared with the surface ocean. From these, lipids and proteins will be even more (preferentially) enriched in sea spray aerosols (Burrows et al., 2014 and references therein). For our biotic solution, we choose to enrich fatty acids by a factor of ∼100 and amino acids by a factor of ∼1000, yielding values slightly above or below 1 ppmw for each component.
To mimic abundance variations from biogenic fatty acids, we reduced the concentrations of fatty acids with odd carbon numbers and enhanced it 10-fold or 50-fold for fatty acids with even carbon numbers as previously done in Solution type iii. Ratios (varying from 0.25 to 1.5) of biogenic amino acids relative to Gly were approximated by using values for interstitial ocean water from Kawahata and Ishizuka (1992). To account for other organics that may be likewise embedded in the ice grains (see section 1), we added the same 14 carboxylic acids as used for Solution type ii, plus propionic acid, each at higher concentrations than the biogenic compounds, to represent abiotic organic background components in a salt-poor solution. The concentrations of all substances used in Solution type iv are summarized in Supplementary Table S3.
3. Results and Spectral Analysis
Measurement results for the four types of solutions (i, ii, iii, iv) are presented next. The laboratory results are archived in the form of an internal database (spectral reference library) and can be compared with results from previous and future space missions.
3.1. General spectral appearance of amino acids and their detection limits in salty solutions (Solution type i)
In a typical cation mass spectrum of an amino acid (AA) in a salty solution (Solution type i), the spectral “background” produced by the NaCl solution consists of peaks of the form [(H2O)nNa]+, [(NaOH)nNa]+, [(NaCl)nNa]+ and mixed clusters of these species, for example, [(NaOH)n(H2O)mNa]+. These species were also observed by Postberg et al. (2009b), who performed LILBID experiments with pure salt solutions. We find that in this sodium-rich solution the AAs typically form neutral sodiated (sodium-complexed) molecules (AANa), in which a sodium ion replaces a hydrogen ion (proton) in the amino acid molecule. This sodiated molecule is cationized by a [Na+] to form a disodiated adduct cation [(AANa)Na]+, as shown by His in Fig. 3:
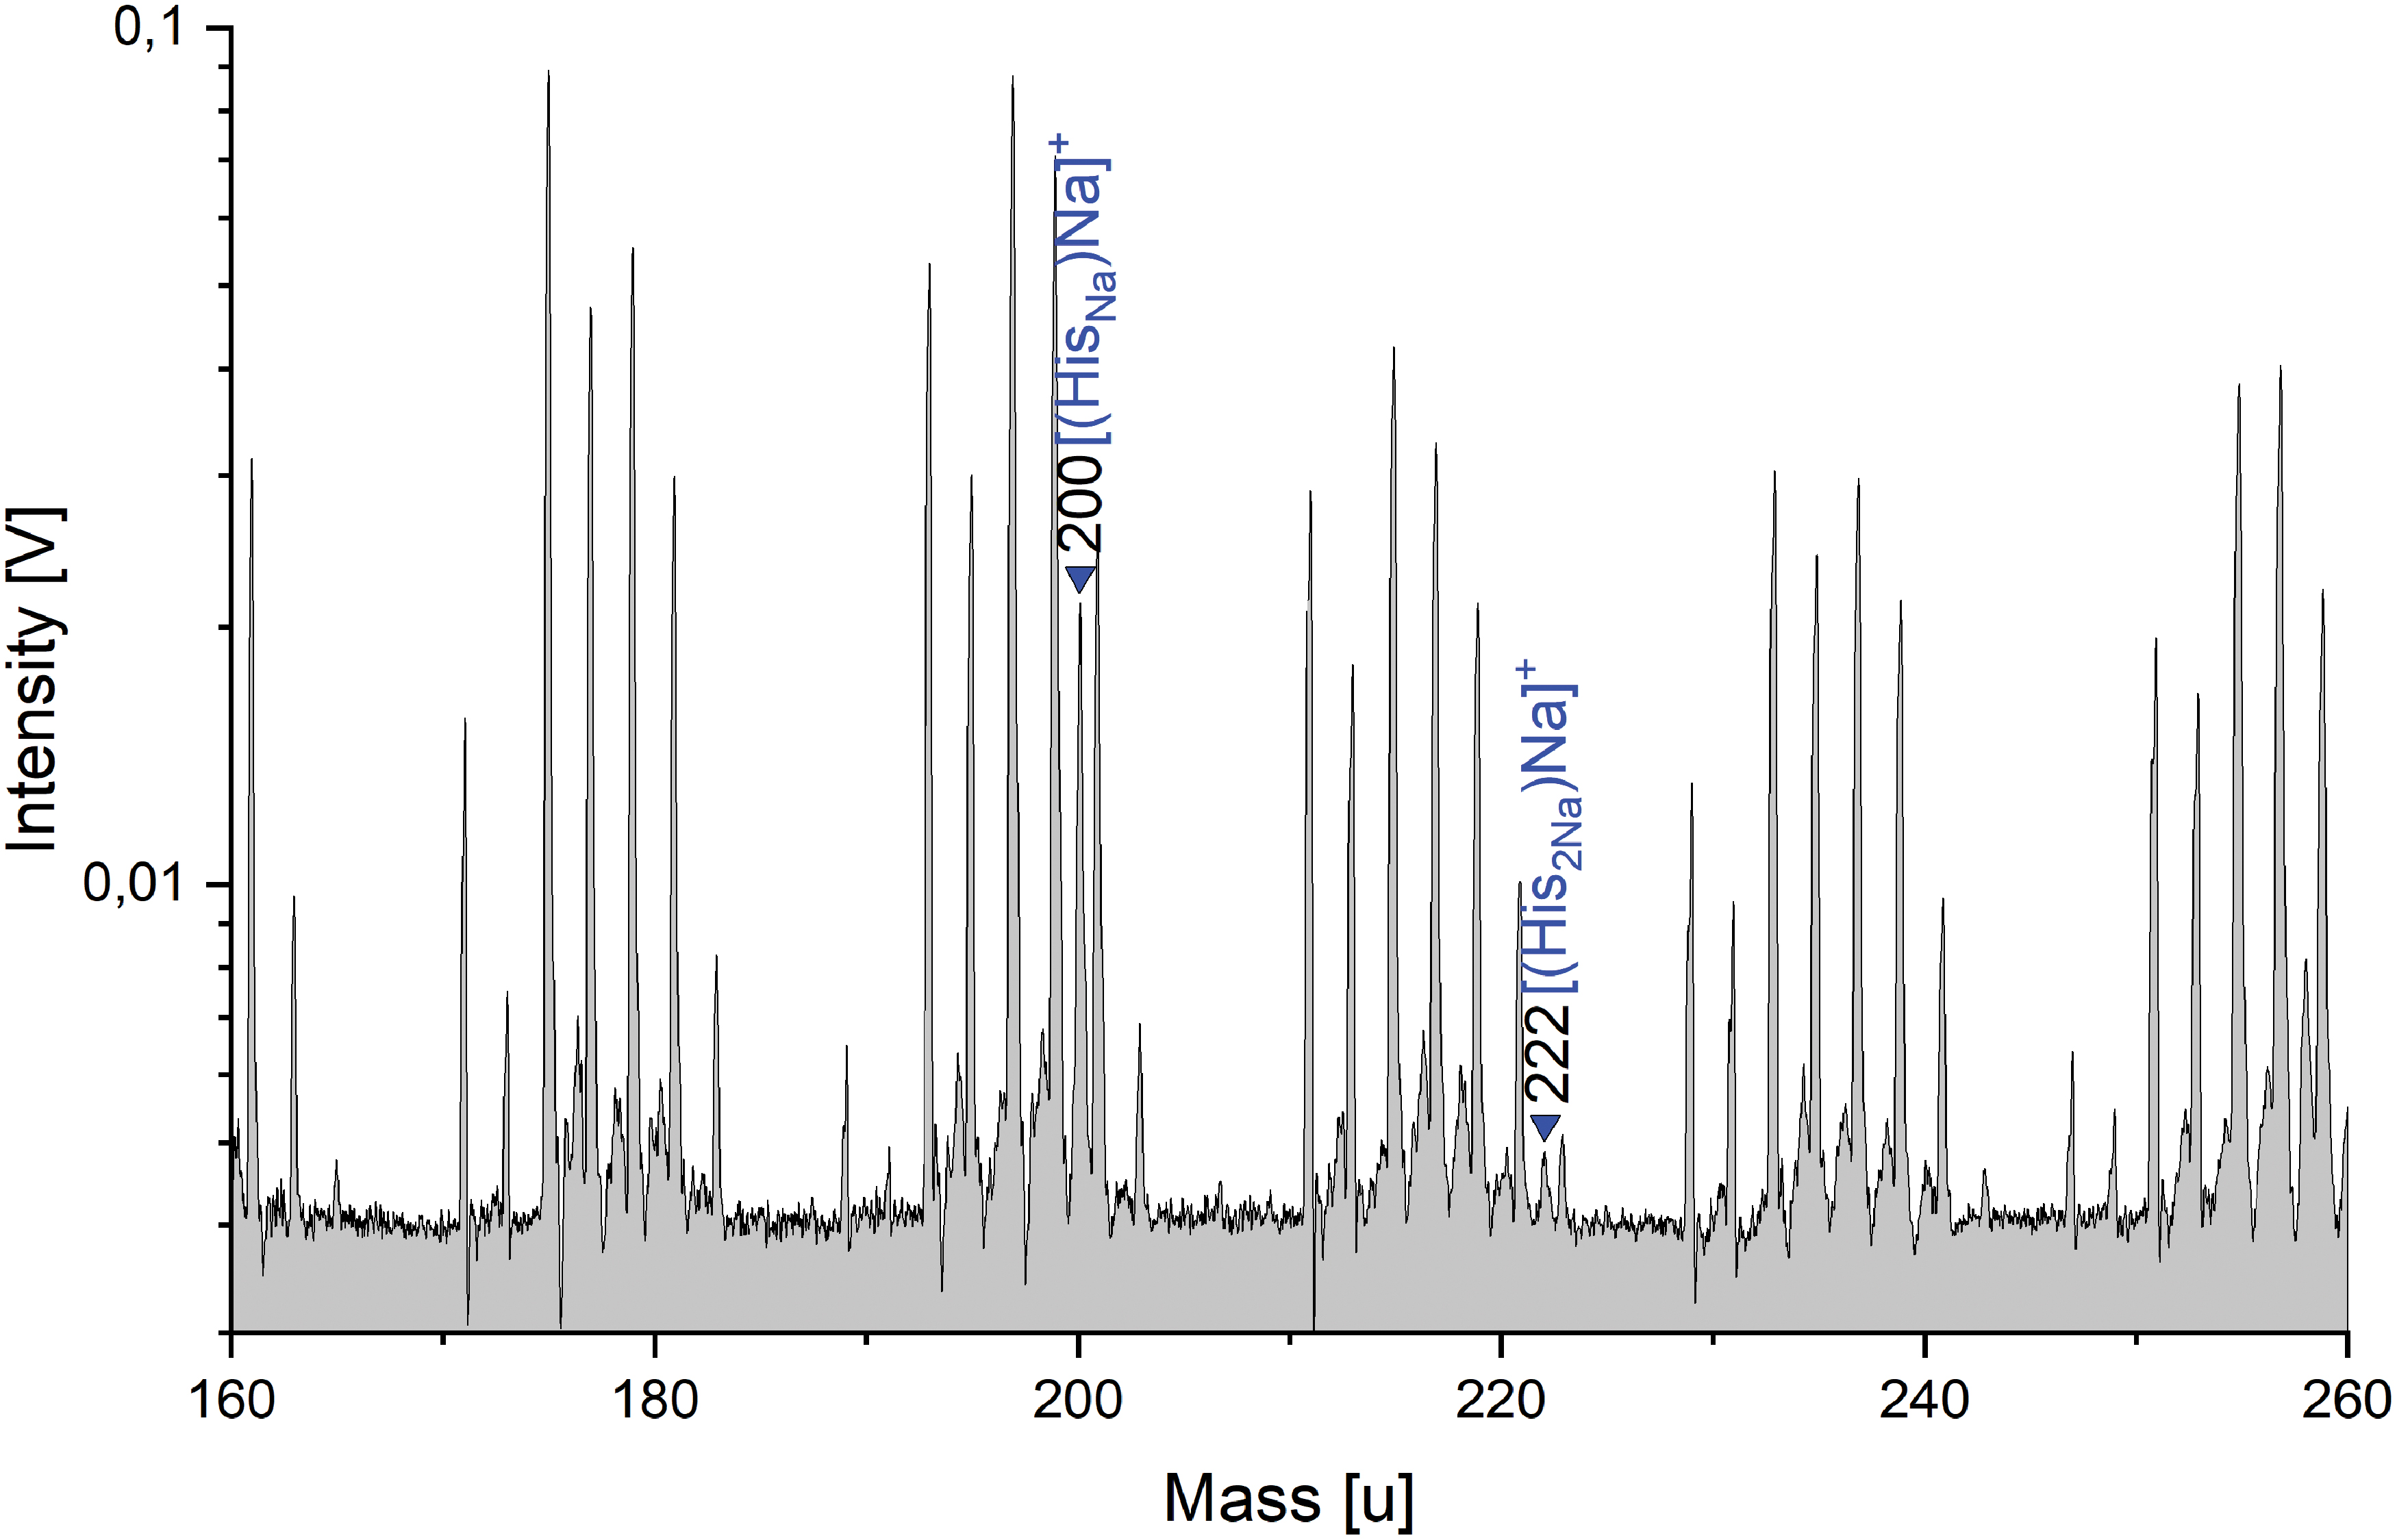
Section of a baseline corrected cation mass spectrum of 100 ppmw His in 0.1 M NaCl (y-axis in logarithmic scale). The characteristic amino acid peaks are sodiated and detectable at His +45 u (m/z 200) and His +67 u (m/z 222). In addition to the amino acid peaks, the spectrum is dominated by salt peaks (unlabeled) from the matrix solution, with amplitudes often much higher than those of the amino acid (see text for further explanation). Color images are available online.
As one proton ([H]+; 1u) is removed and two [Na]+ (23u) are added, amino acid molecules in an NaCl-rich solution are detectable at masses of AA +45 u in the mass spectra. The most acidic amino acids (most notably Asp and Glu) have a characteristic trisodiated peak, in which an additional H is replaced by Na:
This produces an additional molecular peak at AA +67 u in the mass spectra. One, or both, of these sodiated peaks may occur in an individual spectrum, as illustrated in Table 1. The disodiated and trisodiated peak amplitudes of different amino acids (AA +45 u and AA +67 u) vary within an order of magnitude for identical amino acid concentrations. The amino acids are clearly identifiable and, in general, neither quantitatively nor qualitatively influence the spectral appearance (e.g., peak amplitudes) of the salty matrix solution at the given concentrations (Supplementary Fig. S1).
The only exceptions are sodiated amino acids that may interfere with the ever-present salt–water peaks, for example, Arg + 45 u with [(NaCl)2(NaOH)2Na]+ at m/z 219. Because of a significant peak asymmetry the mass resolution (600–800 m/Δm) of the spectrometer used for this work is, however, sufficient to resolve interferences of this magnitude, such as the 0.19 u mass difference between Arg +45 u and [(NaCl)2(NaOH)2Na]+ (Fig. 4).
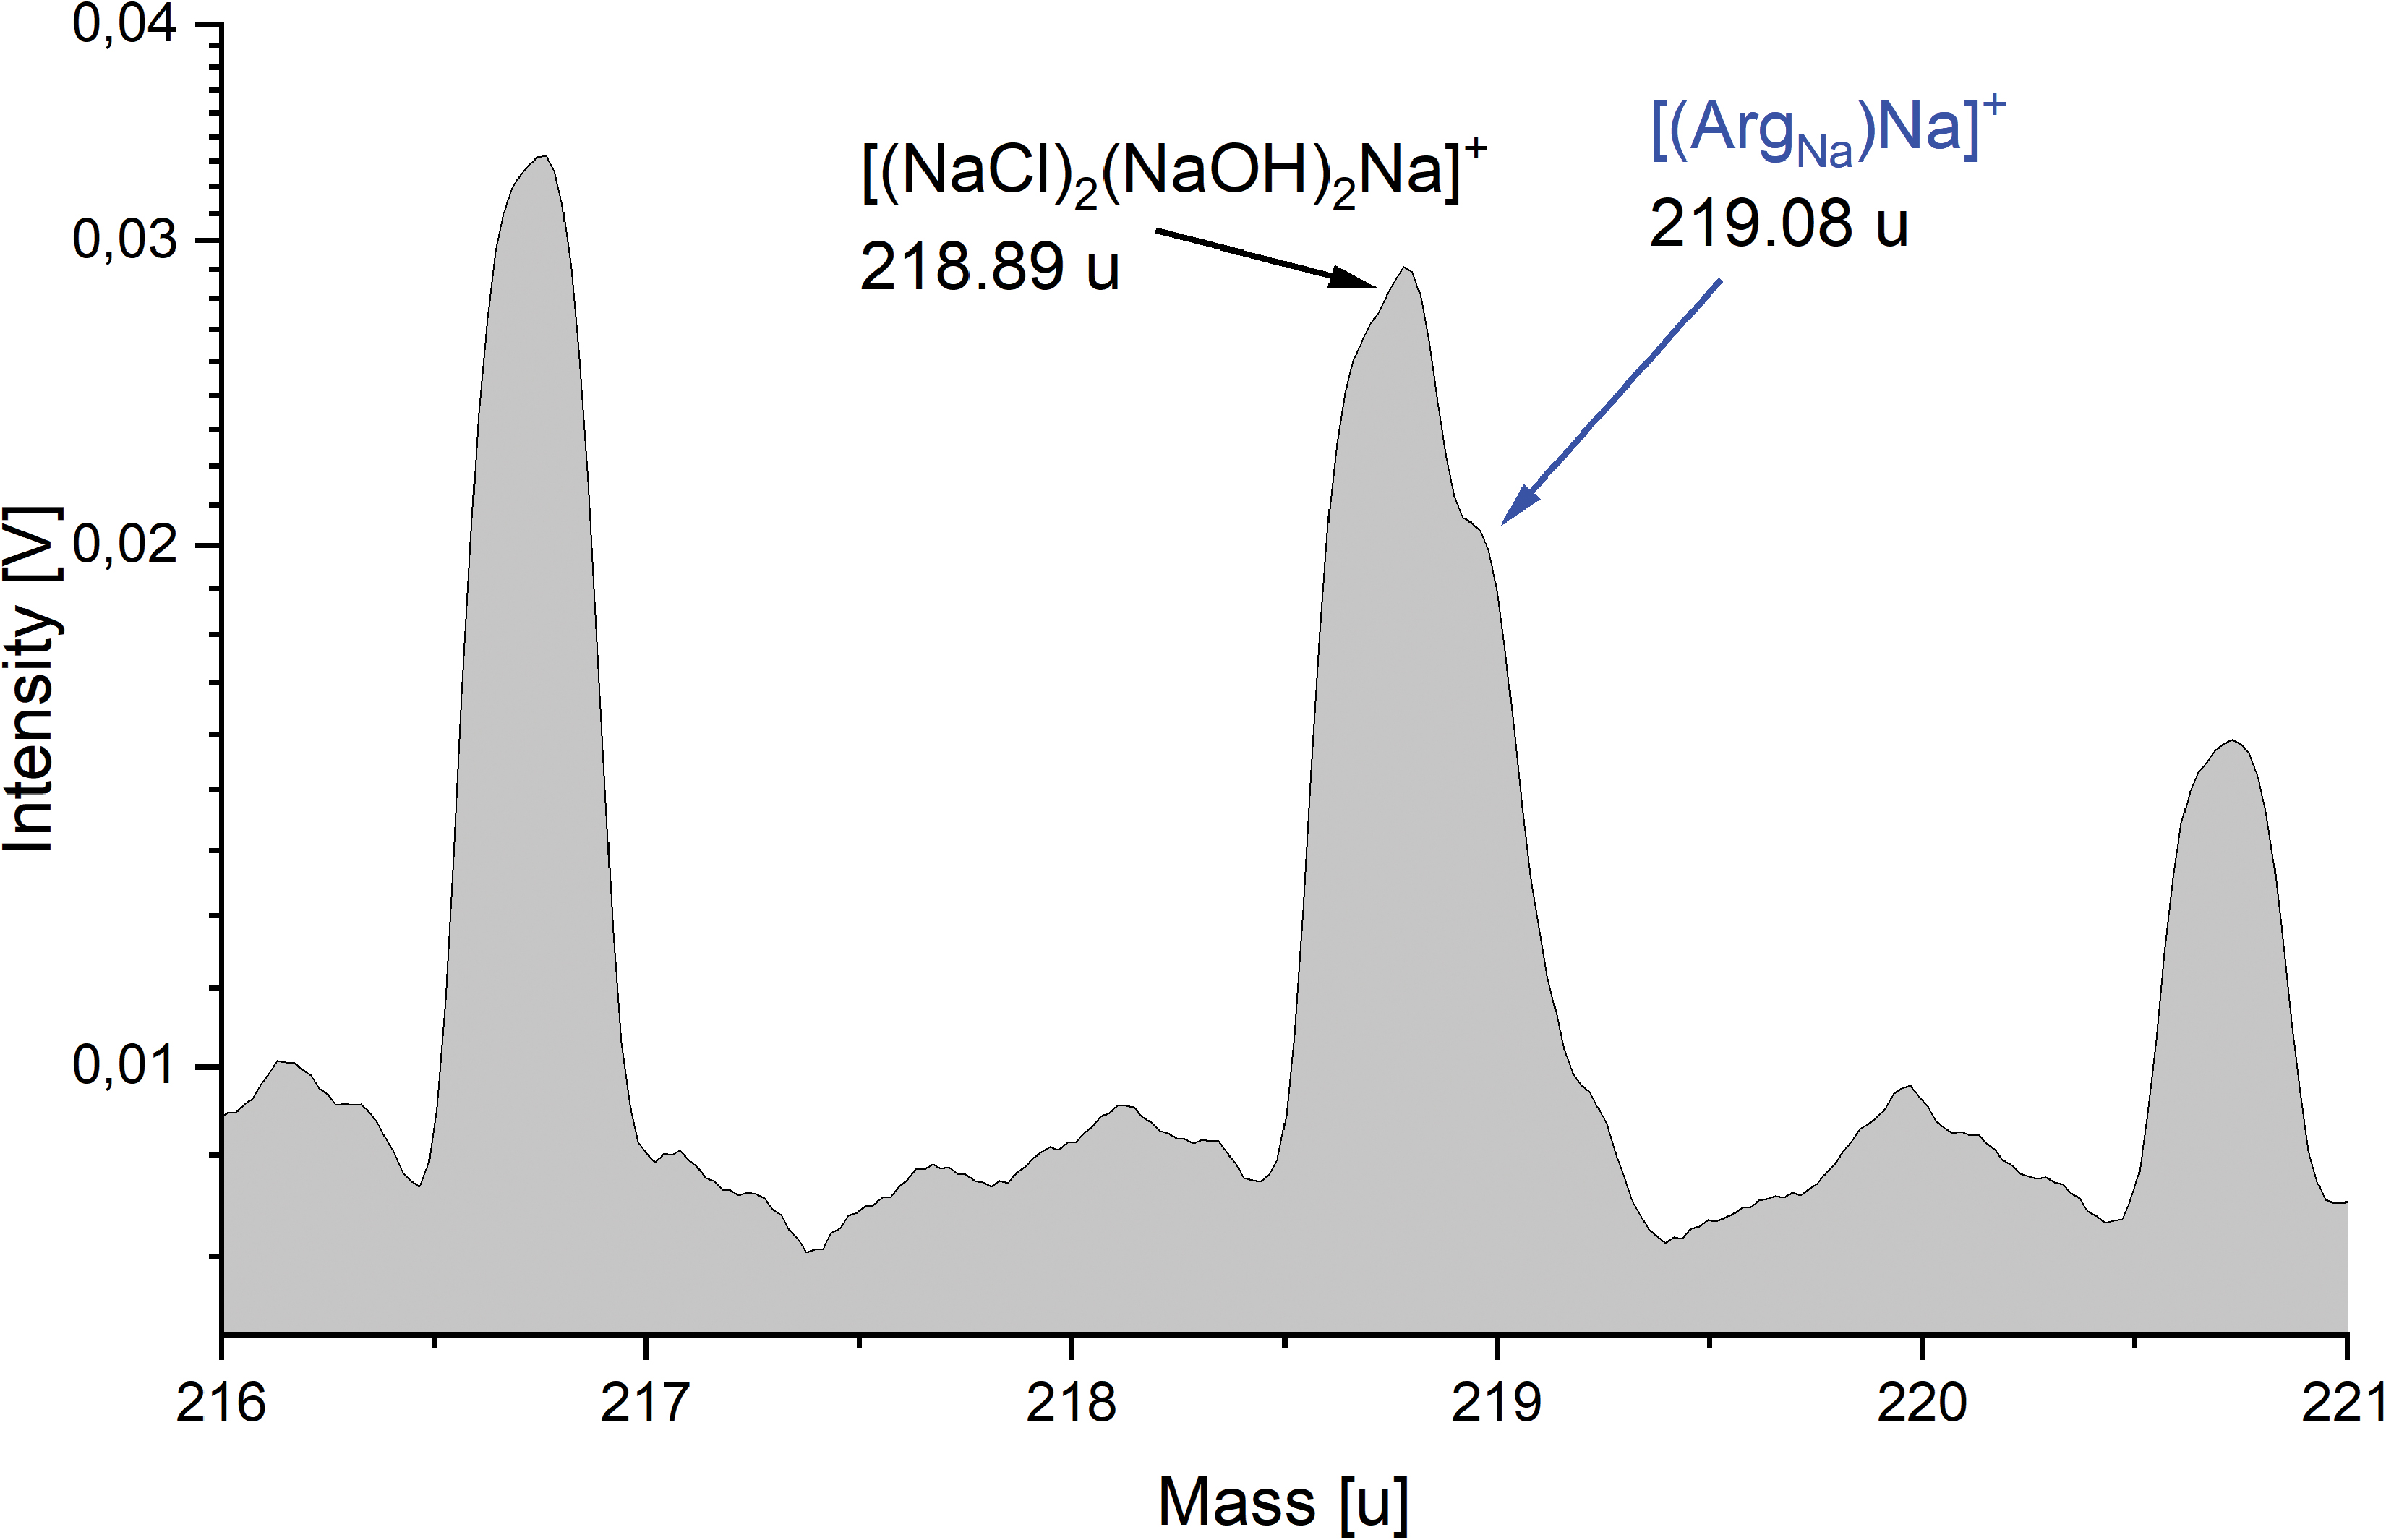
A section of a cation mass spectrum (216–221 u) of 57 × 10−5 M (100 ppmw) arginine in 0.1 M NaCl (y-axis in logarithmic scale). Although the salt cluster species [(NaCl)2(NaOH)2Na]+ at m/z 219 interferes with the sodiated [(ArgNa)Na]+ (labeled blue), both species are identifiable. An extended mass range version of this spectrum is shown in Supplementary Fig. S1. Color images are available online.
Table 1 shows the detection limits of amino acids in salty solutions. The detection limits were individually determined for each amino acid (apart from Gly, which was measured in a mixture) with the experimental parameters (laser intensity and delay time) optimized for greatest sensitivity to the amino acid under investigation. Trisodiated ions of Asp and Glu are detectable at the lowest concentrations in our experimental setup.
3.2. Amino acids at abiotic abundances in salty solutions with carboxylic acids (Solution type ii)
As in the case of Solution type i, [(NaOH)nNa]+, [(NaCl)nNa]+ and mixed clusters of these species, for example, [(NaOH)n(H2O)mNa]+ (Postberg et al., 2009b) from the inorganic spectral background are observable. The characteristic sodiated peaks of Gly and Ala dominate the other sodiated amino acid peaks in the mass spectrum of the abiotic mix (Fig. 5). Despite the low concentrations of the amino acids, the majority can be identified, with Ser as the exception. Typical amino acid fragments ([NH4]+, [CH2NH2]+, [AA-OH]+, [AA-NH2]+, and [AA-COOH]+), as seen in low salinity solutions (Klenner et al., 2020), or their sodiated forms, are not observable in the spectrum of Solution type ii. If these fragments are, indeed, produced during laser desorption of this Solution type, they must be present only in very low quantities and/or interfere with more abundant species from the matrix solution. Here, we specifically note that the disodiated (M + 45 u) peaks of the most abundant carboxylic acids—valeric acid and methylbutyric acid (molecular weights: 102 u) at a total concentration of 120 ppmw (considered likely to be detectable)—interfere with a salt species at m/z 147 ([(Na2CO3)(H2O)Na]+) and are unresolvable with the available mass resolution.

Section (115–215 u) of a baseline-corrected laboratory cation mass spectrum (y-axis in logarithmic scale) of the seven most abundant amino acids (Gly, Ala, ABA, Ser, Val, Asp, and Glu) at abiotic concentration ratios in a salty Enceladus-like solution (Solution ii) containing background compounds (carboxylic acids). Only Ser is undetectable at its inferred abiotic concentration of 2.9 × 10⁻⁵ M. Concentrations can be found in Supplementary Table S1, together with the calculation of the concentrations in Supplementary Data. The characteristic amino acid peaks are labeled in blue. In addition to the amino acid peaks, there are NaCl–water and Na2CO3–water peaks (unlabeled) from the matrix solution, with amplitudes often much higher than the amino acid peaks (see text for further explanation). No mass lines from the added carboxylic acids are observable. Color images are available online.
3.3. Fatty acids at abiotic and biotic concentration ratios (Solution type iii)
For comparison with the abiotic concentration ratios used by Klenner et al. (2020) (Fig. 6, upper panel), we measured fatty acids (sodium salts—see Section 2) at simulated biotic concentration ratios in a water–acetonitrile matrix (50:50 vol) (Fig. 6, lower panel). Despite the different abundance ratios of the fatty acids, no indication of peak suppression or matrix effects was found. The deprotonated molecular peak amplitude pattern was found to match that of the abundance ratios of the fatty acids in the original solution, as observed with the abiotic case in Klenner et al. (2020), confirming that no unexpected ion suppression effects on ion formation due to concentration imbalances of the different fatty acids occur. No clear preference in forming particular molecular peak ions was observed, despite the differing molecular masses of the fatty acids. Anions of the form [M-2H+Na]−, as seen in, for example, electrospray ionization (ESI) experiments on dyes (Holcapek et al., 2007), were not found. Chlorinated adducts were also not observed, due to the absence of chlorine in the solution.

Top: Baseline-corrected anion mass spectrum (y-axis in logarithmic scale) of fatty acids at abiotic concentration ratios in a water–acetonitrile matrix (50:50 vol) (adapted from Klenner et al., 2020). The characteristic fatty acid peaks are labeled red and green for even and odd carbon number fatty acids, respectively. Deprotonated molecular peaks are equally intense, in agreement with the fatty acid equal concentrations of 5.5 × 10⁻⁶ M. Bottom: Baseline-corrected anion mass spectrum (y-axis in logarithmic scale) of fatty acids at biotic concentration ratios in a water–acetonitrile matrix (50:50 vol [Solution type iii]). Deprotonated molecular peak amplitudes reflect the concentration differences between odd and even carbon number fatty acids. Concentrations are 5.5 × 10⁻⁶ M for the odd carbon number fatty acids C13, C15, C17, and C19; 55 × 10−6 M for the even carbon number fatty acids C12, C14, and C20; and 275 × 10−6 M for C16 and C18. Concentrations in ppmw can be found in Supplementary Table S2. Fatty acid dimers (sodiated) from the most abundant compounds are observed at m/z > 450. The total carbon numbers of the dimers are labeled in purple as D28, D30, D32, D34, and D36. Color images are available online.
Detection limits for the fatty acids used here in salt poor solutions have been previously determined to be <0.02 μM (< ≈5 ppbw) (Klenner et al., 2020). In addition, some fatty acids were also tested in a salty solution (0.1 M NaCl). They were not detectable at the solubility limit (about 30 ppmw for hexadecanoic acid).
Sodiated dimers of the form [C16,18+C12,14,16,18,20–2H+Na]− can be clearly observed from species for which the combined fatty acid concentration exceeds ≈300 × 10−6 M (Fig. 6, lower panel). All dimers are identifiable as one of the fatty acids at the highest concentration of 275 × 10−6 M, that is, C16 and C18 in combination with another even carbon number fatty acid at a concentration of 55 × 10−6 or 275 × 10−6 M. The dimers were not observed in the abiotic case because of the lower fatty acid concentrations (each fatty acid at 5.5 × 10⁻⁶ M). Nonsodiated dimers were not observed.
There are conspicuous peaks at m/z 172 and m/z 186. The two peaks were also observed by Klenner et al. (2020) in the abiotic case. Although their exact origin is unclear, these peaks are associated with the fatty acid samples (see Section 4).
3.4. Complex biotic mix of amino acids and fatty acids (Solution type iv)
Spectra arising from a low salinity solution of 8 amino acids, 9 fatty acids, and 15 carboxylic acids together at biotic concentration ratios were measured to simulate a spectrally demanding and complex mixture of organics in water ice grains with embedded biosignatures. Figures 7 and 8 show sections of mass spectra of this type of solution. The mass spectra were recorded in the cation (Fig. 7) and anion (Fig. 8) modes of the mass spectrometer, respectively.

Section of a baseline-corrected laboratory mass spectrum (120–190 u) recorded in the cation mode of the mass spectrometer (y-axis in logarithmic scale). The measured solution contains amino acids at relative abundances chosen to be representative for biotic processes as well as carboxylic acids as background components (Solution type iv). The concentrations can be found in Supplementary Table S3. The amino acids (labeled blue) are clearly identifiable. Peaks from the background carboxylic acids are labeled orange. Unlabeled peaks of the background matrix are from water clusters ([(H2O)nH3O]+), Na–water clusters ([(H2O)nNa]+), or water clusters of the organics ([(H2O)norganic]+). Color images are available online.

Two sections of a baseline-corrected laboratory mass spectrum (70–140 u on the top panel and 160–350 u on the bottom panel) recorded in the anion mode of the mass spectrometer (y-axis in logarithmic scale). The solution contains amino acids and fatty acids at relative abundance ratios representative for biotic processes and carboxylic acids as background components (Solution type iv). The concentrations can be found in Supplementary Table S3. A water–acetonitrile (50:50 vol) matrix was used, as the fatty acids are poorly water soluble. Amino acids (labeled blue) and fatty acids (labeled red and green) are clearly identifiable. Unspecified but fatty acid samples related peaks at m/z 172 and m/z 186 are observable as in Solution type iii. Peaks from the background carboxylic acids are labeled orange. Unlabeled peaks of the background matrix are from water clusters ([(H2O)nOH]−), Cl–water clusters ([(H2O)nCl]−), or water clusters of the organics ([(H2O)norganic]−). Color images are available online.
Amino acids can be identified in such a complex mix by their protonated and deprotonated molecular peaks in the mass spectra, with sodiated species not expected to be observed owing to the low salinity of the background solution. Although the sensitivity of the method varies for different amino acids—reflecting differences in ion formation efficiency and therefore detection thresholds (Klenner et al., 2020)—amino acids other than Gly dominate the mass spectra of this biotic mixture. For example, Arg, Asp, and Lys show especially high peak amplitudes (Figs. 7 and 8). Despite the differences in ion formation efficiency, we easily detect the characteristic spectral signatures, as initially applied to the solution to mimic biotic processes (e.g., Dorn et al., 2011). Extrapolating from the peak amplitudes, all amino acids would still be detectable even if an enrichment factor of 100 would have been chosen instead of 1000 (see section 2.2.3). Arg, Asp, and Lys would still be easily detectable with an enrichment factor of 10, likely even without any enrichment applied.
Fatty acids can be identified in such a complex mixture by their deprotonated molecular peaks ([M-H]−) in the anion mode (Fig. 8). The fatty acid biosignature abundance pattern, as seen in the mixture consisting only of fatty acids at biotic concentrations (Fig. 6, bottom panel), is clearly observable and reflects the different biotic fatty acid concentrations. Even carbon number fatty acids are present in much higher abundances than odd carbon number fatty acids, as would be expected from biotic processes (e.g., Dorn et al., 2011). However, a general slight decline in sensitivity with increasing carbon number, due to the increasing poor solubility, can be observed. Extrapolating from the peak amplitudes, all fatty acids would still be detectable even if an enrichment factor of 10 would have been chosen instead of 100 (see section 2.2.3). Even numbered fatty acids would still be easily detectable without any enrichment applied.
Molecular peaks of the background carboxylic acids can also be identified, except decanoic acid (5 ppmw), propionic acid (2 ppmw), and formic acid (2 ppmw), which were present at the lowest concentrations of all background carboxylic acids. We, therefore, infer these three carboxylic acids to be present in the solution at abundances lower than their respective detection thresholds. Although present in higher concentrations, no interference of these abiotic organic compounds with any of the biogenic signals was observed.
4. Discussion
4.1. Salt-rich amino acid solutions
In this work, for the first time, analog mass spectra for amino acids potentially captured in salty ice grains from an ocean-bearing moon have been investigated. There are some fundamental differences in comparison with the previously investigated (Klenner et al., 2020) cationic mass spectra of amino acids in a salt-poor matrix.
Our results indicate that the protonated molecular peaks, which are strongest in a salt-poor medium, are suppressed (e.g., Piwowar et al., 2009) in the salt-rich case, with the strongest mass spectrometric signals from amino acids in Na-rich ocean water instead arising from sodiated cations (Figs. 3 and 5). These appear at masses M(olecule) +45 u and M + 67 u, respectively. In these complexes, one or two protons ([H]+) are replaced by one or two sodium ions in the molecular structure and addition of another [Na]+ cation provides a positive charge (Table 1) to the complex. Sodiation of organic molecules in a sodium-rich environment is a well-known process in ESI mass spectrometry (e.g., Newton and McLuckey, 2004; Concina et al., 2006). As in ESI, the polysodiated complexes in LILBID are likely to result from the substitution of carboxylic or amidic protons by Na+, with the degree of sodiation dependent on the number of oxygen (from OH) and nitrogen atoms available in the molecule.
As in pure water the sensitivity of the method, and thus the detection limits, varies between different amino acids. The different side chains confer a wide range of properties, with the logarithmic acid dissociation constant pKa being the most relevant here (e.g., Wu et al., 1992). The more positive the pKa, the less dissociation of the acid at any given pH, that is, the weaker the acid. In pure water, the lowest detection limits are determined to be those for Arg and Lys (1 nM)—amino acids with basic side chains and relatively high pKa values (Klenner et al., 2020). In the salty matrix, we found the lowest detection limits (Table 1), those for sodiated Asp and Glu, to be about 3 μM (compared with about 0.1 μM for the relevant (nonsodiated) peaks in salt-poor water). Both amino acids have acidic side chains and relatively low pKa values.
In general, sensitivity to those amino acids that have been investigated in both matrices drops between a factor of two (Ser) and five orders of magnitude (Arg) when a 1% concentration of sodium salts is present. Experiments on NaCl-rich Gly solutions showed that the activity of Gly in the Gly-NaCl-H2O system diminishes with increasing NaCl concentrations, giving rise to a so-called salt-in effect for amino acids (Sirbu and Iulian, 2010). We conclude that a high salt concentration also suppresses the characteristic organic peaks in our LILBID experiments. However, sensitivities vary significantly less between different sodiated amino acids (Table 1) compared with the sensitivity variations observed between protonated molecular species in a salt-poor matrix (table 1 in Klenner et al., 2020). The salts (and NH3) may function as a pH buffer in the solutions used here and, in turn, counter pH dependent effects on the different sensitivities to the amino acids and/or the ionic bonding of Na+ to the amino acids might be more similar among different molecular structures than protonation of amino acid molecules.
Unlike identical measurements with amino acids at concentrations varying from 50 to 1000 ppmw in pure water (Klenner et al., 2020), in a salty solution no characteristic fragmentation of the amino acids was observed (whether sodiated or not) in the resulting mass spectra. The high salt concentration may have neutralized charged fragments or suppressed the fragmentation process of the organics. In the latter case, although out of the scope of this work, we hypothesize that uncomplexed amino acids may be less stable than the sodium complexes formed in a sufficiently [Na]+-rich solution. This appears to differ from the case of ESI mass spectrometry, in which fragment cations of the form [Na2NH2]+, [NaOCNNa]+, and [Na3CN2]+ can form from sodiated organic molecules, dependent on the elemental composition of the analyzed molecule (Shi et al., 2005).
In Solution type ii, several amino acids and salts, together with 14 carboxylic acids, were measured in the cation mode to simulate a more complex mixture, as might occur in Enceladus' ocean. The goal was to investigate (a) interferences between mass lines and (b) matrix effects on the sensitivity for amino acids. Indeed, some of the peaks from sodiated amino acids have isobaric masses, at the integer level, with salt- and salt–water-derived peaks. However, the mass differences between these cationic species are relatively large, typically on the order of 0.15 to 0.2 u (Supplementary Fig. S2), and they can be readily resolved with a mass resolution of about m/Δm = 1000. For example, the disodiated Arg cation interferes with the salt cluster species [(NaCl)2(NaOH)2Na]+ at m/z 219. The mass difference of 0.19 u between these two species can be resolved with the laboratory reflectron (mass resolution of m/Δm = 600–800) used here (Fig. 4).
Although some of the carboxylic acids were present in higher concentrations than most of the amino acids (e.g., valeric acid and methylbutyric acid at concentrations of almost 600 μM), no sodium complexes involving them were detectable in Solution type ii (cation mode). Their concentrations probably were below their detection limits in a salty matrix. This finding is in agreement with our nondetection of sodiated fatty acids at their solubility limit (∼30 ppm for hexadecanoic acid) in a solution with identical salt compounds. They could, however, be identified in the negative mode in a low-salinity solution.
4.2. Fatty acids
If present in Enceladus' ocean, the poorly soluble long-chain fatty acids will probably most easily enter the plume within salt-poor ice grains formed from an organic layer at the oceanic surface (Postberg et al., 2018b). Under such conditions, fatty acids produce characteristic deprotonated molecular peaks in anion mass spectra (Figs. 6 and 8) even at trace concentrations of a few tens of nM (Klenner et al., 2020).
In the biotic mixture used for this work, with concentrations differing between fatty acids with even and odd carbon numbers, the peak amplitude pattern again matches that expected from the fatty acid concentrations (Figs. 6 and 8). In contrast to amino acids, detection sensitivities vary by only a small amount between fatty acids ranging in size from 12 to 20 carbon atoms, with spectral peaks decreasing only slightly for identical concentrations with an increasing carbon number. This reflects the fact that, in contrast to amino acids, the fatty acids have very similar structures and pKa values. This similarity enables the facile distinction between biotic and abiotic abundance patterns.
Even at low to intermediate sodium concentration in the solution (∼0.75 mM from the sodium salts used), sodiated dimers of the fatty acids are observed (Fig. 6), with amplitudes approximately two orders of magnitude lower than those of the deprotonated molecular peaks. A combined fatty acid concentration for two species of ≈300 μM is sufficient to create very clear dimer signals at the given [Na]+ concentration and, extrapolating from the observed amplitudes (Fig. 6), concentrations of 100 μM should still allow for a dimer detection. With increasing salinity, the sodiated dimers are likely to become more abundant than the deprotonated molecular anions, which may suffer from similar suppression effects as observed in the case of amino acids.
There are conspicuous peaks at m/z 172 and m/z 186 in all fatty acid mass spectra. These two peaks are also observed by Klenner et al. (2020). The exact origin of these peaks is still unclear, but they are undoubtedly associated with the fatty acid samples. They may potentially be fragments due to CnH2n cleavage from the fatty acids in combination with electron capture ionization. The peaks could also represent undefined sodiated species. However, the most likely possibility is that the peaks derive from a specific but currently unknown contamination of the fatty acid sodium salts. For more details about the potential origin of these peaks, see Klenner et al. (2020).
4.3. Complex biosignature mixtures
Two scenarios were investigated. The first (Solution type ii) simulated spectra arising from amino acids at putative abiotic abundances together with other abiotic organic compounds with added salts that are representative of Enceladus' ocean composition. These were measured in the cation mode of the mass spectrometer. In the second scenario (Solution type iv), we investigated the spectra generated by biotic concentrations of fatty acids and amino acids in ice grains as may form from a putative organic film on the surface of Enceladus' ocean. For the amino acids, biotic concentration ratios as they appear in Earth's ocean were used and enrichment factors inferred from similar processes on Earth's ocean then applied (section 2.2.3). The availability of amino acids in Enceladus' ocean probably differs from that in Earth's ocean. However, as the most well-characterized, cold water, salty environment in which life flourishes, Earth's ocean currently represents the only example from which biotic amino acid abundance ratios can be derived for application to Enceladus. As in Solution type ii, a large number of potential abiotic organics were included in the simulant mixture. These parameters can be expected to produce the most complex, and therefore challenging, mass spectra for a biotic case. These spectra were obtained by using both positive and negative modes.
In both scenarios, the abiotic and biotic mass spectrometric fingerprints of the biosignatures could be successfully identified (Figs. 5, 7, and 8). No unresolvable interferences with any of the amino acids and fatty acids in the solution were observed. In the analytically demanding salty solutions, sodiated amino acids can be identified down to ∼1 ppmw. The nondetection of Ser does, however, indicate that due to matrix effects the detection limits are slightly higher in comparison with those for a solution with just individual amino acids. In the salt-poor solution, the sensitivity to amino acids is much higher in most cases, as expected from the results by Klenner et al. (2020). There, 500 ppbw concentrations of Arg and Lys created very clear signals (signal to noise ratio ≈50 sigma for both amino acids) in the cation mode (Fig. 7) whereas Asp and Ser are the dominant amino acid signals in the anion mass spectra (Fig. 8).
In a similar way, spectra of fatty acid mixtures at biotic concentrations down to 100 ppbw reflect the biotic abundance pattern in which even carbon number fatty acids are clearly more abundant than odd carbon number fatty acids, even in a complex mixture where different organics could theoretically easily interfere with each other (Fig. 8). However, a stronger dependence on the number of carbon atoms (i.e., C-number) was observed when compared to Solution type iii (Fig. 6), with decreasing sensitivity toward higher carbon numbers. Extrapolating from the observed amplitudes, the biotic patterns would have been clearly identifiable in the mass spectra even at 10–100 times reduced concentrations in agreement with the detection limits found by Klenner et al. (2020).
Klenner et al. (2019) showed that the experimental parameters of the LILBID analog setup can be correlated with impact speeds of ice grains onto impact ionization mass spectrometer targets in space. By comparison between the experimental parameters used here (intermediate to high laser intensities and intermediate to high delay times) with amino acids and those required to simulate different impact speeds of the ice grains, we infer that instrument sensitivity to amino acids in grains formed from a salty ocean environment is maximized at impact speeds of 5–10 km/s. The slightly higher values compared with those in pure water agree with the observation that the sodiated amino acids, which are the characteristic peaks in a salty environment, resist fragmentation more than the protonated and deprotonated molecular species produced in a salt-poor matrix. We confirm the finding of Klenner et al. (2020) that using very high delay times and intermediate laser intensities, equivalent to impact speeds of 3–6 km/s, maximizes the detection sensitivity for fatty acids.
Previous work has shown that organics (both refractory and volatile) in projectiles are capable of surviving the impact process at velocities of up to 5 km/s (e.g., Bowden et al., 2009; Burchell et al., 2014; New et al., 2020). Further experiments, in which capsules containing aqueous amino acid solutions were subjected to impacts of steel projectiles at up to ∼2 km/s, showed that a large fraction (40–70%) of the amino acids also survived (Blank et al., 2001). In the specific case of ice grains, modeling of particle impacts onto aluminum targets indicates that at relative velocities of up to 5 km/s, comparable with Enceladus' plume transect velocities, little to no thermal degradation of entrained organics, such as amino acids, should occur (Mathies et al., 2017).
The LILBID technique is known to be capable of preserving and measuring delicate organic structures, such as intact membrane complexes (Morgner et al., 2007), as a function of applied laser intensity, with ultra-soft ionization occurring at low laser energies. However, the results presented in this work, and those of Klenner et al. (2020), use higher laser energies that are typically more destructive, and yet show that a detectable fraction of organic molecules, in particular amino acids, fatty acids, and peptides, survive at equivalent impact speeds of >5 km/s. The fragmentation of organic macromolecules during impacts of ice grains from Enceladus (Postberg et al., 2018b) shows similar behavior, with the characteristic (70–200 u) spectral signatures of the breakup of large (m > 200 u) parent molecules only becoming detectable at impact speeds above 5 km/s and becoming more prominent at speeds >10 km/s (Postberg et al., 2018b).
These laboratory and flight results are in good agreement with ab initio molecular dynamics simulations that show that even a few layers of water ice molecules can effectively protect organic molecules from impact fragmentation (Jaramillo-Botero et al., under review). With ionization also promoted by a liquid or frozen water matrix (Wiederschein et al., 2015), the survivability and detectability of organics appears to be significantly improved in ice grains ejected into space by ocean-bearing moons, even if encountered at relative velocities above 5 km/s.
These relative speeds are of keen interest for feasibility studies of flying through the plume of Enceladus on ballistic trajectories. Cassini flew through the plume at speeds as low as 7.5 km/s, but plume transects at 4–5 km/s are possible (Reh et al., 2016; Mitri et al., 2018). Even slower speeds can be achieved, but grain impact speeds of greater than ∼3 km/s were required to generate sufficient ionization for the analysis of plume material with Cassini's CDA. Thus, not only are plume transects below 3 km/s undesirable for this technique, but based on our work they also provide no improvements to the diagnostic capability of the mass spectrometry.
5. Conclusions
The proven ability of the LILBID experiment to simulate the impact ionization mass spectra of water–ice-dominated grains (e.g., Postberg et al., 2009b, 2011b, 2018b; Khawaja et al., 2019; Klenner et al., 2019) has been applied to the simulation of ice grains containing biosignatures in biotic and abiotic concentration ratios. Potentially abiotic organic substances (such as simple carboxylic acids) and inorganic substances (salts and ammonia) have been added to investigate detection limits, potential mass spectral interferences, and suppression effects, with the aim of verifying whether abiotic and biotic spectral fingerprints can be clearly identified under complex conditions. A more precise quantitative determination of the biosignatures (e.g., calibration curves), however, is beyond the scope of this article and will be a goal of future work.
Enceladus' organics are principally believed to enter ice grains either from a solution in the ocean or from an organic layer on top of the ocean. Poorly soluble compounds can only originate from that layer and will be part of salt-poor ice grains (Type 2) (Postberg et al., 2018b; Khawaja et al., 2019), whereas organics with higher water solubility will also be incorporated into ice grains forming from salty ocean droplets (Type 3) (Postberg et al., 2009b). If present, free amino acids will be dissolved in the enceladean ocean and are thus expected also to be found in salt-rich ice grains. All tested amino acids form sodiated cations that produce the most intense amino acid signal by far under these conditions. To discriminate between the characteristic sodiated mass peaks of amino acids and other dissolved organic species and extraneous peaks from near isobaric salt species, a future flight instrument will require a mass resolution of at least m/Δm = 700, and ideally m/Δm > 1000.
Amino acids generally favor forming cations, whereas fatty acids favor forming anions. A future flight instrument, therefore, ideally needs to be capable of detecting both cations and anions to cover the complete range of biosignatures investigated here.
Of the amino acids tested, Asp and Glu, via their sodium complexes, have been detected at the lowest concentrations (0.5 ppmw). Fatty acids and other carboxylic acids are not detected in such a high salinity environment at or below a level of 50 ppmw. In an environment of intermediate salinity, sodiated dimers of fatty acids, however, can be detected at a level of 0.1 mM, equivalent to ∼25 ppmw. By contrast, deprotonated anions from fatty acids and protonated cations from amino acids will dominate spectra from salt-poor water ices and are detectable down to the nanomolar or ppbw level, respectively (Klenner et al., 2020).
It is reasonable to assume that the observed suppression and complexation effects arising from interaction with the salty matrix will also affect other organic species. Recently, identified soluble organic compounds, found in many salt-poor Type 2 grains, are believed to enter grains via condensation from the vapor phase (Khawaja et al., 2019). Such soluble organics should then also be incorporated into ocean spray, which is believed to form salty Type 3 ice grains rising through Enceladus' fractures (Postberg et al., 2009b, 2011b). The work presented here, however, indicates that the detection and identification of such compounds in spectra generated by impacts of salty Type 3 grains might be more difficult than for the salt-poor grains.
The initial abundances of amino acids and fatty acids at given concentrations are reflected in the amplitudes of their molecular peaks, including the sodiated molecular peaks of amino acids in salty solutions. Abiotic and biotic fatty acid signatures within the ice grains are easily discernible. The ratios of various amino acids to Gly and the odd–even carbon number abundance pattern of fatty acids serve as biosignatures that can be readily distinguished from each other in mass spectra, even under demanding matrix conditions in a salt-poor as well as a salt-rich environment. Should they be present, these key organic species as well as their abiotic and biotic signatures are, therefore, likely to be identifiable in impact ionization mass spectra from ice grains recorded in space. Detection limits for space instrumentation with more efficient ion detectors and higher dynamic ranges than the experimental setup used here may be expected to be at least two orders of magnitude lower than the values reported here and in Klenner et al. (2020). We conclude that in a salt-poor water ice matrix, all investigated biosignatures could then be detectable, as such, down to the nanomolar level, with amino acids in a salty environment detectable down to at least the micromolar level.
To simulate biotic concentrations, we used values from the only example we have: Earth's ocean. The concentrations and specific types of fatty acids and amino acids in an inhabited extraterrestrial environment will almost certainly be very different. Although our results demonstrate the ability to identify by using LILBID a large number of biogenic tracers at Earth-like concentrations, it is impossible to say whether this or any other method will be able to detect the concentrations of these substances in ice grains from an extraterrestrial ocean world.
It is important to note, however, that according to a recent work by Truong et al. (2019), concentrations of abiotic amino acids may be expected to be barely detectable. Specifically, aspartic acid and arginine have been shown to decompose within thousands, to at most a few million years in oceanic water and any detection of these compounds in material from ocean worlds will be strong evidence for a very efficient, probably extant generation mechanism. Another study implies high compatibility of amino acids in ice Ih during the freezing of an aqueous solution and suggests that the ice matrix protects amino acids from decomposition or racemization (Hao et al., 2018). The LILBID experiments conducted so far (this work, and Klenner et al., 2020) show that such compounds can be reliably detected and identified at low concentrations, particularly arginine in a salt-poor matrix and aspartic acid in a salt-rich matrix.
In the future, the LILBID technique will be used to perform quantitative investigations of not only the biosignatures discussed in this work but also a wide range of other relevant organic compounds, in matrices designed to mimic ice grains derived from a range of realistic oceanic compositions for Enceladus and Europa. The LILBID experiments on DNA extracted from bacterial cultures, as well as lysed and disrupted cellular material, are currently underway to investigate the mass spectral appearance of these biological materials after simulated impact ionization.
The results of this work also aid future space mission planning, with laboratory experimental parameters used to derive recommended impact velocity regimes and instrument configurations (Klenner et al., 2019)—for ice grain impacts onto spaceborne mass spectrometers—which maximize the chances of detecting biomarker compounds.
The survivability of organics appears to be significantly improved when large molecules are protected by a liquid or frozen water matrix, which simultaneously promotes ionization (Wiederschein et al., 2015). When using impact ionization mass spectrometers, the efficient detection of amino acids and fatty acids in ice grains present in plumes or ejecta emitted from Enceladus and Europa and the reliable identification of abiotic and biotic signatures of these organics is found to occur at encounter velocities of 3–8 km/s, with an optimal window at 4–6 km/s. At these speeds, in a water-rich matrix, even complex organic molecules remain largely intact, yet they are expected to efficiently form cations and anions from impact ionization, yielding the highest possible signal-to-noise ratio. This means that ballistic fly-throughs of Enceladus' plume (and potential plumes of other ocean worlds) at these velocities will yield optimal diagnostic data on the presence and identity of potential biogenic compounds.
Footnotes
Acknowledgments
The authors thank Lenz Nölle for valuable discussions about the experimental results and Marie Dannenmann for discussions about future studies. Most of this work was carried out at the Institute of Earth Sciences, Heidelberg University. Some additional work was carried out at the Wilhelm-Ostwald-Institute, Leipzig University, and at the Jet Propulsion Laboratory, California Institute of Technology, under a contract with the National Aeronautics and Space Administration.
Author Disclosure Statement
No competing financial interests exist.
Funding Information
The research leading to these results received funding from the German Research Foundation (DFG) projects PO 1015/2-1,/3-1,/4-1, project AB 63/9-1 and from the European Research Council (ERC) under the European Union's Horizon 2020 research and innovation programme (ERC Consolidator Grant 724908-Habitat OASIS). JIL was supported by the Distinguished Visiting Scientist Program at the NASA Jet Propulsion Laboratory during the course of the work.
Supplementary Material
Supplementary Data
Supplementary Figure S1
Supplementary Figure S2
Supplementary Table S1
Supplementary Table S2
Supplementary Table S3
Abbreviations Used
Associate Editor: Christopher McKay
References
Supplementary Material
Please find the following supplemental material available below.
For Open Access articles published under a Creative Commons License, all supplemental material carries the same license as the article it is associated with.
For non-Open Access articles published, all supplemental material carries a non-exclusive license, and permission requests for re-use of supplemental material or any part of supplemental material shall be sent directly to the copyright owner as specified in the copyright notice associated with the article.