




Abstract
The investigation of chemical composition on planetary bodies without significant sample processing is of importance for nearly every mission aimed at robotic exploration. Moreover, it is a necessary tool to achieve the longstanding goal of finding evidence of life beyond Earth, for example, possibly preserved microbial remains within martian sediments. Our Laser Ablation Ionization Mass Spectrometer (LIMS) is a compact time-of-flight mass spectrometer intended to investigate the elemental, isotope, and molecular composition of a wide range of solid samples, including e.g., low bulk density organic remains in microfossils. Here, we present an overview of the instrument and collected chemical spectrometric data at the micrometer level from a Precambrian chert sample (1.88 Ga Gunflint Formation, Ontario, Canada), which is considered to be a martian analogue. Data were collected from two distinct zones—a silicified host area and a carbon-bearing microfossil assemblage zone. We performed these measurements using an ultrafast pulsed laser system (pulse width of ∼180 fs) with multiple wavelengths (infrared [IR]-775 nm, ultraviolet [UV]-387 nm, UV-258 nm) and using a pulsed high voltage on the mass spectrometer to reveal small organic signals. We investigated (1) the chemical composition of the sample and (2) the different laser wavelengths' performance to provide chemical depth profiles in silicified media. Our key findings are as follows: (1) microfossils from the Gunflint chert reveal a distinct chemical composition compared with the host mineralogy (we report the identification of 24 elements in the microfossils); (2) detection of the pristine composition of microfossils and co-occurring fine chemistry (rare earth elements) requires utilization of the depth profiling measurement protocol; and (3) our results show that, for analysis of heterogeneous material from siliciclastic deposits, siliceous sinters, and cherts, the most suitable wavelength for laser ablation/Ionization is UV-258 nm.
1. Introduction
In situ methods of chemical analysis on the surfaces of planetary bodies are of primary importance in current space research and promise to significantly increase the scientific return from these missions (Knight et al., 2000; Wurz et al., 2012; Horneck et al., 2016). From the current perspective, Mars is a cold desert with an intense flux of ionizing radiation at the surface (Hassler et al., 2014), high ultraviolet (UV) flux, chemical reactivity of soils (Carrier and Kounaves, 2015), and considered to be largely uninhabitable (Fairén et al., 2010). However, scientific analysis and modeling suggest that life could survive in the subsurface and imply the possible existence of rock-hosted life in the deep subsurface (Stamenković et al., 2019), where liquid water may be present (Orosei et al., 2018). Considering impact cratering and early faulting, some of these formations may be accessible from the surface (Onstott et al., 2019).
In addition, multiple lines of evidence exist for abundant liquid water on the surface, during the early stages of evolution of the planet, particularly in the Noachian (Ehlmann et al., 2011). These lines of evidence include, for example, fluvial landforms, paleolakes, river deltas, and mineralogy indicative of water alteration and weathering (Arvidson et al., 2014; Grotzinger et al., 2014). Evidence of clement conditions on early Mars raises questions about the extent of the planet's possible habitability, for example, the scale and duration of this habitability.
To answer such questions, an in situ chemical and mineralogical investigation of rocks from the martian surface is required along with set of complementary instruments capable of recording high-quality chemical information. However, techniques that are traditionally used in space research, for example, pyrolysis–gas chromatography-mass spectrometry (Pyr-GCMS) or remote methods such as laser-induced breakdown spectroscopy (LIBS), might not be sufficiently sensitive to detect faint signatures of life from micrometer-sized and below organic remains (Navarro-González et al., 2006).
Laser ablation ionization mass spectrometry (LIMS) is a promising analytical technique (Azov et al., 2022) capable of providing molecular (Ligterink et al., 2020), elemental (Tulej et al., 2015; Riedo et al., 2020), and isotope (Riedo et al., 2013; Tulej et al., 2020) characterization of solid materials. LIMS provides fast measurements (20 μs per spectrum for a single laser shot) (Riedo et al., 2019), spatially resolved (∼10 μm) analysis with high detection sensitivity (ppm level), and excellent depth resolution (nm scale) (Grimaudo et al., 2020).
The laser ablation/ionization reflectron-type time-of-flight mass spectrometer used in this study is an instrument developed in the Space Research and Planetary Sciences group at the University of Bern and represents a real-sized prototype of a space instrument. The LIMS instrument incorporates a femtosecond laser ionization source, a miniature time-of-flight mass spectrometer (Ø 60 × 160 mm), making it suitable for space exploration, and an integrated microscopy system. However, the applicability of the LIMS systems to identify chemical signatures of life from microfossils that are billions of years old has not been shown so far.
Among others, Precambrian cherts from banded iron formations were suggested as an astrobiologically relevant Mars analog site (Allen et al., 2001) since iron oxides and silicates might precipitate as an aqueous mineral phase from a Fe and Si saturated water column, efficiently trapping any microbiota present. Moreover, terrestrial cherts offer an exceptional preservation level due to their capacity to encapsulate and preserve organic material (Alleon et al., 2016). Gunflint microstromatolites preserved within the banded iron formation (outcrop on the North Shore of Lake Superior, Ontario, Canada) are well studied and considered among the best known Precambrian Fossil Lagerstätten. They represent a diverse microbial community that thrived in a shallow marine environment ∼1.9 billion years ago (Barghoorn and Tyler, 1965). Moreover, Precambrian chert containing bona fide microfossils from the Gunflint formation represents an excellent and realistic testbed for in situ space instrumentation.
To clarify the current state of the performance of our LIMS instrument on realistic samples, we test the LIMS ability to identify ∼1.9 Ga microfossils and potential chemical biosignatures in the Gunflint chert as a function of different fs-ablation wavelengths. The chemical identification and characterization of microfossils from cherts when using space instrumentation are challenging due to the low bulk densities and small size of the microfossils, which are usually not larger than the first tens of micrometers in length, with the thickness of their organic cell walls in the order of hundreds of nanometers (Brasier et al., 2014).
The task is also complicated by the three-dimensional distribution of the microfossil bodies within the silicified matrix (only a fraction of microfossils might be exposed at the surface of the sample), which would require a layer-by-layer analysis. It is worth noting that the micrometer-scale investigation of putative structures can advance our ability to discriminate between the biotic and abiotic origin (pseudofossils) of micrometer-sized inclusions. For example, commonly occurring manganese dendrites resembling branching structures of biological origin will not pass the test for the presence of major biorelevant elements (CHNOPS), whereas organic remains of microfossils will.
In this contribution, we investigated the LIMS capabilities to detect faint element signatures of life by acquiring highly resolved spectrometric data from heterogeneous media present in the Gunflint chert. We will discuss the technical aspects of chemical identification of micrometer-sized inclusions and compare the ablation and ionization performance and quality of the depth profiling from two distinct zones (microfossil assemblage zone and clean host area) by using femtosecond laser pulses at three different laser wavelengths. Finally, we will present LIMS measurement results from using a high-voltage (HV) pulse mode applied to the ion-optical system of the mass spectrometer designed to enhance the detection sensitivity of species of interest.
2. Materials
All measurements were conducted on a doubly polished thin section (thickness ∼30 μm) of a Precambrian chert sample from the Gunflint Formation (Fig. 1). Samples were collected from the Schreiber beach locality (north shore of Lake Superior, Canada). The Gunflint chip was attached to the glass holder and cut to an L shape with dimensions of 1.09 cm in height and 0.8 cm in width. The microfossils are localized within layered zones (laminae). For this study, material probing was mainly conducted within the pure host mineral area (quartz) and within the microfossil-rich laminae. No prior surface conditioning was conducted.

Panoramic image of the Gunflint chert thin section mounted on a steel holder (L-shaped sample, left bottom). Color images are available online.
The sample was kept in vacuum storage to avoid any surface contamination and handled only with gloves in a cleanroom environment (ISO 5). The sample was mounted on a 25 mm round steel holder with premilled cavities where a vacuum compatible copper tape fixed it, and the holder was positioned below the instrument on the XYZ translation stage.
2.1. Experimental setup and instrument overview
Material ablation, ion production, and subsequent mass spectrometric analysis, as illustrated in Fig. 2, are achieved by generating and guiding a pulsed femtosecond laser beam through three optical sections and focusing the laser beam on the surface of the sample inside a vacuum chamber. Femtosecond laser pulses at infrared [IR]-775 nm (red line in Fig. 2), UV-387 nm (white line), and UV-258 nm (blue line) wavelengths were applied to ablate and ionize material from the microfossils and the surrounding host mineral.

Schematics of femtosecond laser light transmission and subsequent mass spectrometric analysis of ablated positive ions when using our LIMS system. IR-775, UV-387, and UV-258 nm ablation occur by guiding appropriate wavelength to beam guiding line and periscope system. Further technical details in sections 2.1 - 2.3. IR, infrared; LIMS, laser ablation ionization mass spectrometer; UV, ultraviolet. Color images are available online.
In the first section, the fundamental wavelength from a Ti: Sapphire Chirped Pulse Amplified Clark-MXR laser (λ ∼775 nm, t ∼ 180 fs, pulse repetition rate ≤1 kHz, maximum pulse energy: 1 mJ, and s-polarization) is directed to the remotely controlled variable power attenuator (Newport VA-BB-2-CONEX). The attenuated beam is guided further into the second section to generate second and third harmonics on the nonlinear beta barium borate crystals (BaB2O4). Second and third harmonic emission (λ ∼387.5 nm and λ ∼258.3 nm) generation is achieved by using the STORC harmonic generator. After generating additional frequencies, the laser beam is expanded to 35 mm and directed into the periscope system, containing a set of UV enhanced aluminum-coated mirrors, which guides the beam into the vacuum chamber. Inside the chamber, the vacuum is maintained at a pressure of ∼5 × 10⁻⁸ mbar by combining a molecular turbopump and an ion getter pump.
A fused silica viewport with dedicated broadband antireflection coating was installed to reduce the beam transmission losses, which provides an enhanced beam transmittance of ∼99% for the UV-258 nm wavelength. The beam is focused by a doublet lens and forms an ablation spot with a diameter of ∼12 μm for IR and ∼10 μm for UV-258. The focal point of the incident beam is positioned ∼200–300 μm below the mass analyzer. The sample is positioned at the focal point of the laser beam by using a translation stage, which provides positioning accuracy ∼1 μm in the x, y, and z dimensions.
Calibration of the translation stage was achieved by using an internal microscopy system with a resolving power ∼1 μm (Wiesendanger et al., 2018). Ions from the ablated plume are confined, accelerated, and focused by the dedicated ion-optical system. Mass separation is achieved in the field-free area of the mass spectrometer. A chevron-type ring microchannel plate (MCP) detector is used for the measurements of arriving ions (Riedo et al., 2017). From the initial ion cloud, only positively charged species enter the mass analyzer, as shown in Fig. 2. The time-of-flight spectrum is recorded by collection of the current from the atomic and molecular ions.
The signal from the incoming ion flux is amplified by the MCP detector and recorded as a function of the signal arrival time with a fast data acquisition system. The output current of the detector is measured as electrons × ns−1. The time-of-flight spectrum is converted into a mass spectrum with a quadratic equation m = a(t + b)2, where m is the mass/charge unit, t is the arrival time of the charged species, and a and b are the instrument-dependent calibration constants. Data acquisition occurs by the simultaneous recording of the signal from two anode rings on the MCP detector. High-resolution digitizers from Agilent Technologies providing a sampling rate of 3.2 GS/s are used for data acqusition. Control of the ion-optical voltages, as well as translation stage positioning, is achieved with in-house made software. All collected data from the control PC are saved on the storage PC for postprocessing and data analysis.
2.2. Laser beam quality
The applied laser radiation for all used wavelengths is determined to be temporally and spatially Gaussian shaped (Fig. 3). The spatial pulse profiles have been measured with a CCD camera and widths with an interferometer. The laser beam diameter and pulse width measured at full width at half maxiumum were determined to be ∼5 mm and 180 fs. The measurements of the laser pulse energy of our laser system (Clark-MXR, Inc.) at the maximum power output (1 mJ) were performed over 10,000 single laser shots and revealed a standard deviation of 0.28%, which corresponds to the nominal level of the laser power stability (Riedo et al., 2013).
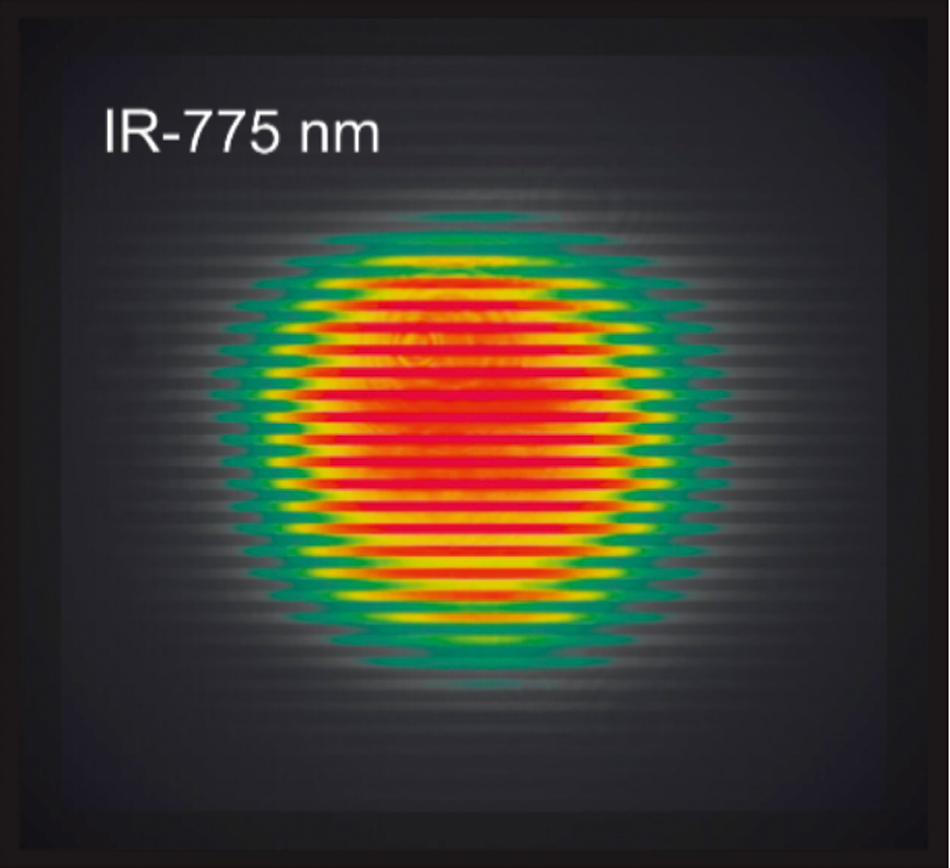
Fundamental IR-775 nm laser beam profile measured with the CCD camera. Color images are available online.
Due to the slight variations in the focal point position for different wavelengths, a set of mirror adjustments were applied to achieve the focal point positioning at ∼0.3 mm below the extraction electrode of the mass spectrometer. Furthermore, to achieve maximum power transmission through the optical setup, installation started from dielectric mirrors with 99% of transmission for IR-775 nm, and later they have been exchanged to the aluminum-coated UV-enhanced 3″ mirrors (Ravg >90% for 250–450 nm), for better transmission of the UV-387 nm and UV-258 nm wavelengths.
2.3. “HV-pulser” mode
Our time-of-flight LIMS instrument with an MCP detector provides a record of all charged species (e.g., element isotopes and molecular species) present in the ablated plume. However, detector sensitivity for heavy species arriving later in the mass spectrum might decrease, which will eventually affect the ability to quantify their abundances, or they might not be registered at all. To avoid the detector saturation or detector gain loss caused by lighter elements of high abundance, we performed measurements with a short HV pulse applied to the acceleration electrode of the ion-optical system.
A short description will be given here, for more detailed information with wiring schemes and performance estimations can be found in our earlier publication (Wiesendanger et al., 2017). The HV pulse used in this study was made with a high-speed switch (Behlke FSWP 51-02), with a rise and fall time of ∼10 ns. The HV pulse connects to the ion optics and forms a positive electric field, which repels positively charged ions from the optimal ion-optical path and switches back to the nominal voltage to allow the remaining ions reach the detector. Appropriate timing to efficiently eject major ions from the confined cloud is achieved by using a set of delay generators (DG535 and DG645; Stanford Research Systems).
2.4. Measurements
To probe the chemical composition of the Precambrian chert sample and compare abundances from different locations, we consecutively used three different laser wavelengths: IR-775 nm, UV-387 nm, and UV-258 nm. Also, a HV pulser with UV-258 nm laser was used to improve the detection of heavy ions (>150 amu). Each of these regimes was accompanied by applying a variable amount of laser shots. Depth profiles were recorded with a total laser shot count for IR-775 nm—150,000 within a single spot and histogramming each 100 single laser shots spectra, resulting in 1500 consecutive spectra.
For UV-387 nm, the total laser shot count resulted in 300,000 laser shots from a single spot, histogramming mass spectra from every 200 single laser shots spectra (1500 consecutive spectra). For UV-258 nm, 500,000 single laser shots were applied, histogramming mass spectra from every 200 single laser shot spectra (2500 consecutive spectra). The increased number of collected data with short UV wavelengths was motivated by the improved mass spectral resolution and high ion signal levels. All applied laser pulse energies were above the ablation threshold of the investigated material and were set to the maximal achievable spectral resolution by conducting laser power scans beforehand outside of the zone of interest.
3. Results
3.1. IR-775 measurements
The mass spectrometric studies with IR-775 nm radiation were conducted by applying ∼10 TW/cm2 irradiances to the surface of the Gunflint sample. The depth profiles (150,000 applied laser shots binned into 1500 spectra are referred to as “ablation layers”) were measured within two locations—the dense assemblage of microfossils and the host mineral area (Fig. 4A, B). Sample overview, acquired crater shapes, and locations are depicted in Figs. 4A and 5A–D.

Panoramic image of the Gunflint chert thin section.
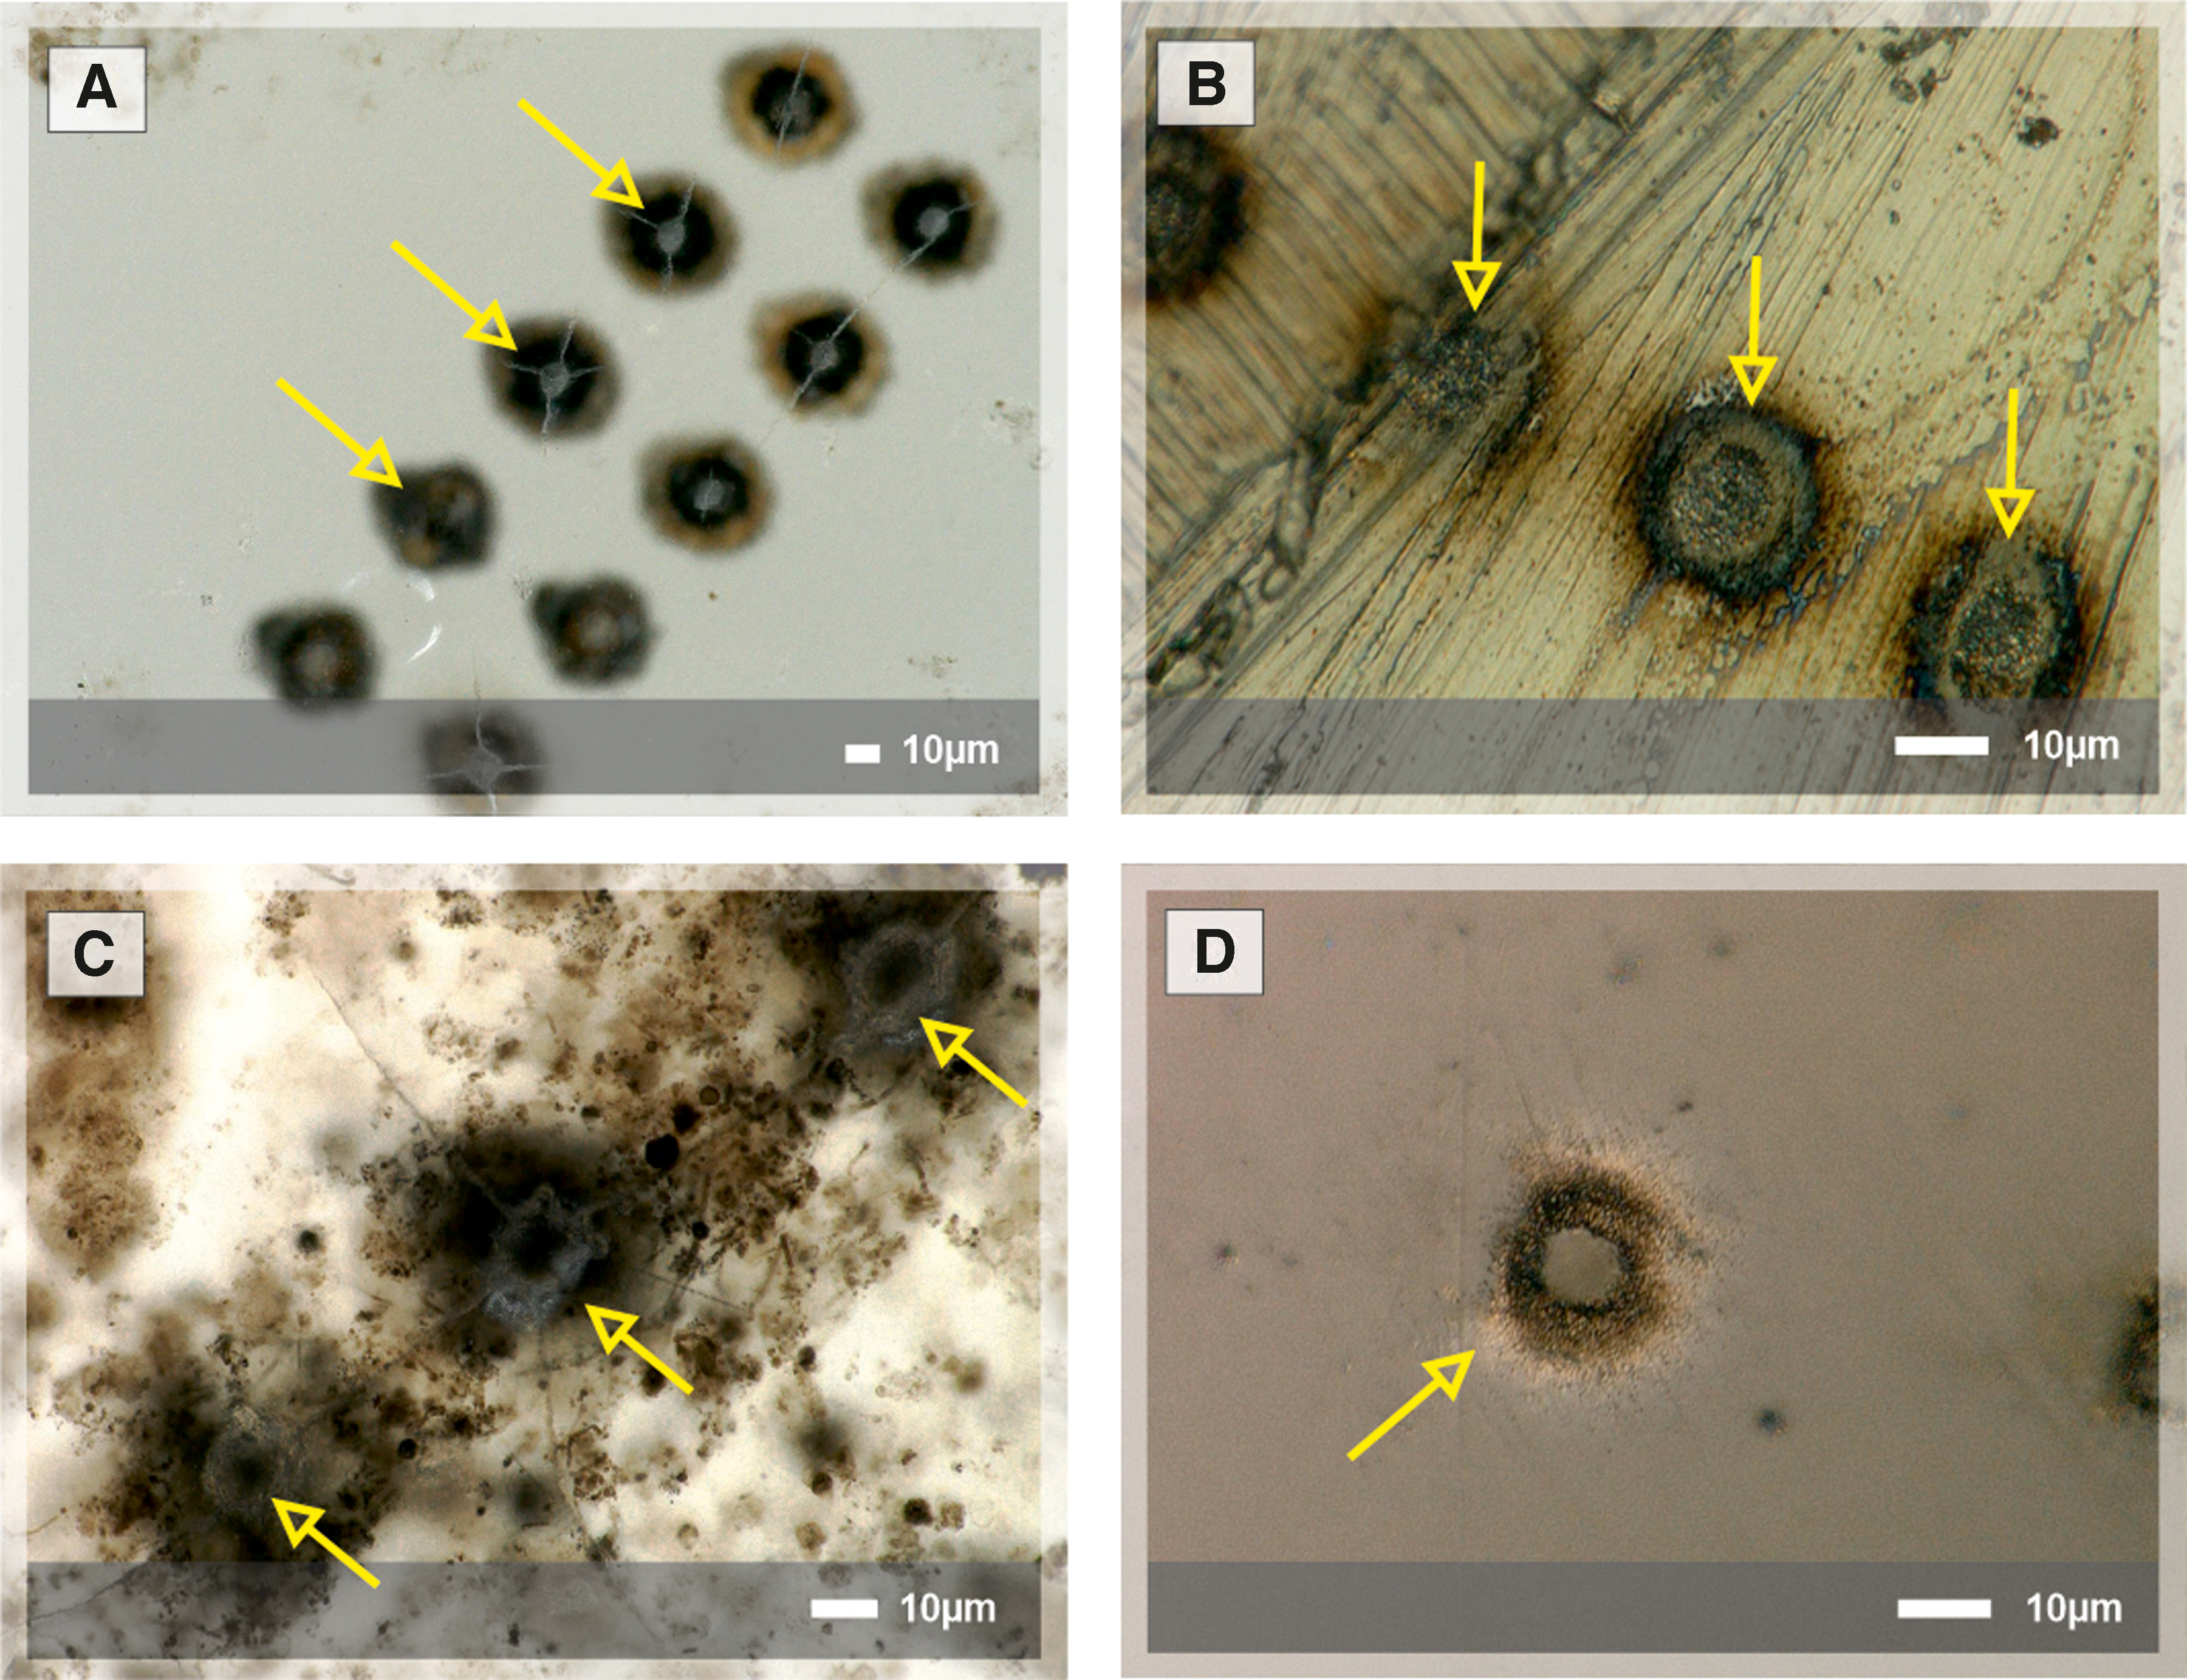
As can be seen in Fig. 5A, IR-775 radiation applied to the host area of the sample produced radial cracks and secondary craters (Fig. 5B) on the surface of the underlying steel holder. The high laser transmission rate through the quartz (SiO2) explains the formation of the secondary craters, which led to the ablation of the material from the underlying steel holder. The presence of a dark halo around each produced crater could be noted (Fig. 5A). This particular feature was identified as material ablated from the steel holder and deposited onto the bottom of the Gunflint thin section (Fig. 5D).
Moreover, radial cracks on the thin section were observed in the host and microfossil-rich area, as shown in Fig. 5A and C. The formation of the cracks is likely caused by thermal stress occurring in the material during the ablation or by a thermodynamic expansion of the ablated plume originating from the steel holder.
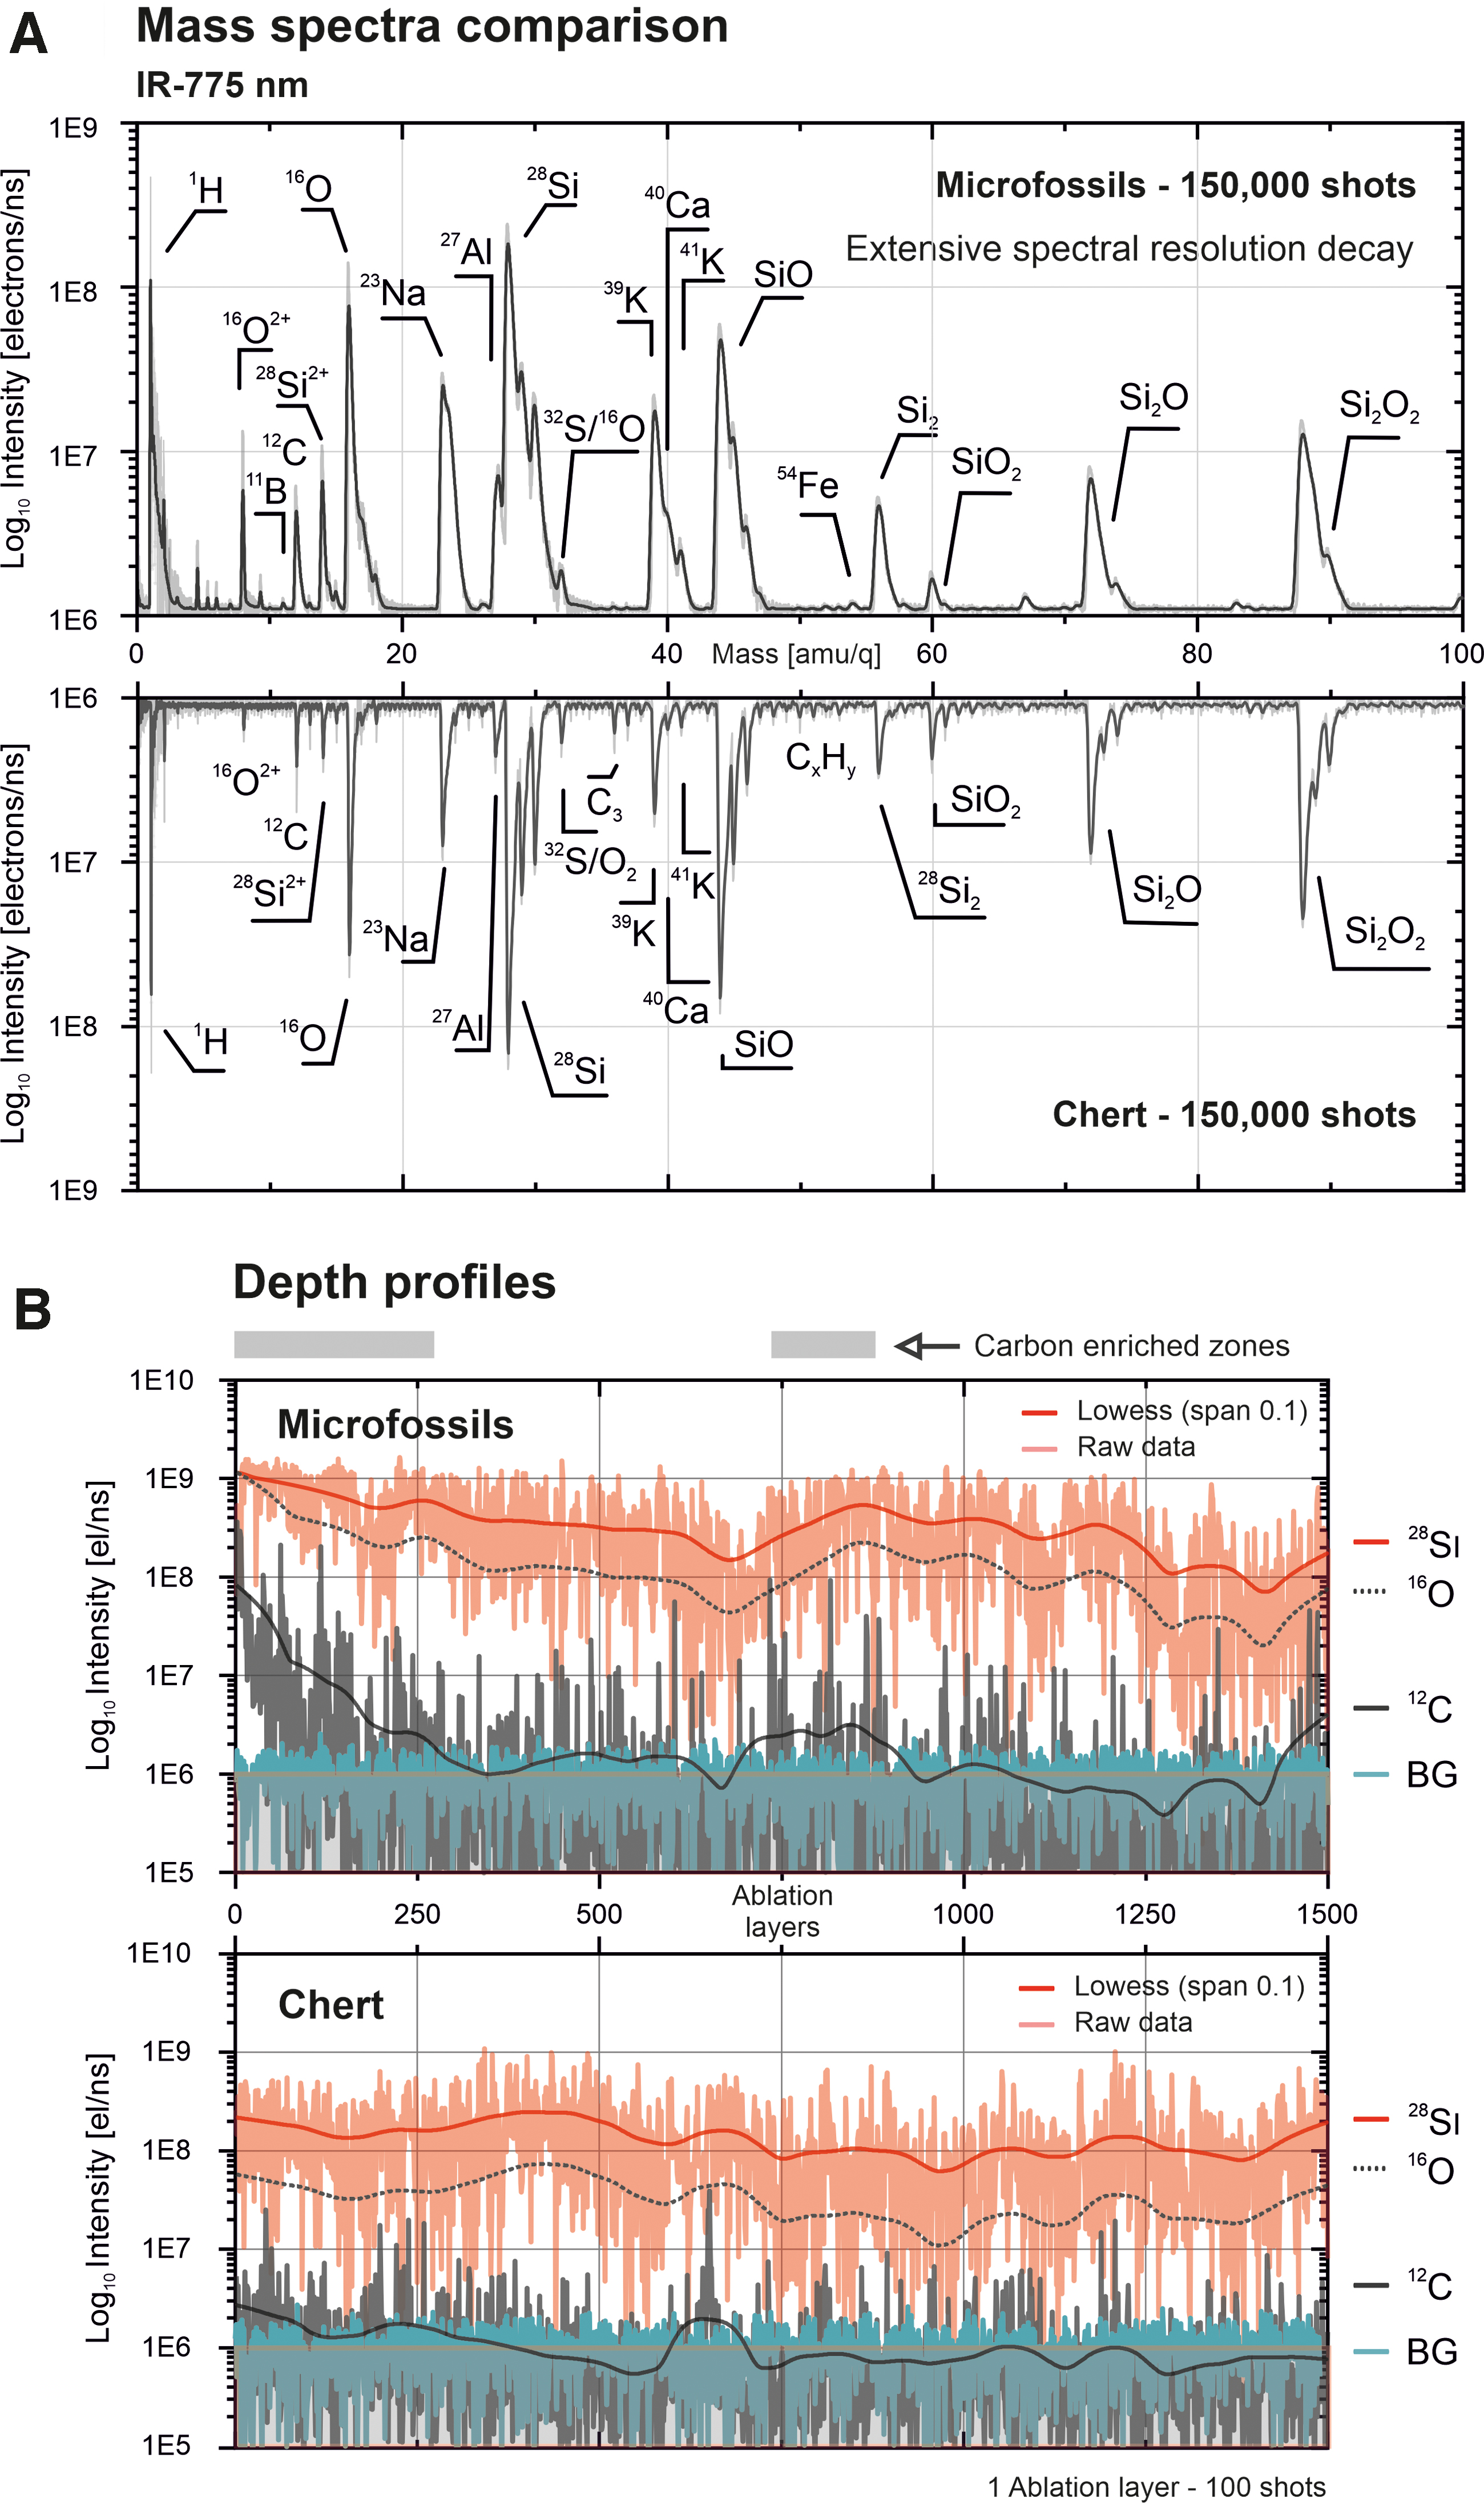
Typical mass spectra (histogrammed over 150,000 individual laser shots) registered from the microfossil-rich spot and host mineral location obtained during the campaign are depicted in Fig. 6A in upper and bottom panels, respectively. While investigating the quartz phase from the host location, the laser ablation stability can be maintained, mainly due to the uniform material properties. This results in the accumulation of mass spectra with high mass resolution. By applying the same conditions at the microfossil-rich locations, broadening of the mass peaks and decrease of the mass resolution were observed.
The explosive appearance of the craters (presence of cracks and sharp edges) within the microfossil-rich zone depicted in Fig. 5C reveals preferential absorption of the laser energy by the dark features, for example, the carbon-bearing cell walls of the microfossils. Changes in the ablation conditions at these locations result in changes in the plasma plume characteristics with surface and space charging effects, which may not be easily accommodated by the ion-optical setting of our miniature mass analyzer.
The depth profiles shown in Fig. 6B consist of consecutive signal intensities of 28Si, 12C, and 16O determined by the Simpson integration of the investigated peaks from each spectrum (Meyer et al., 2017). Element isotope intensities are plotted along with the background signal (BG), measured within a time range free of any ion signal. The carbon depth profiles from both locations, depicted in Fig. 6B (thicker curves represent a lowess smoothed version of the data), reveal a nonuniform signal distribution. A significant portion of the carbon signal from the chert is located close to the surface (first hundreds of laser shots), which indicates presence of the surface contamination.
Another question concerns the stability of the ion signal intensities from the depth profiles, as shown in Fig. 6B, with fluctuations of raw silicon signal in the range of up to 103. The unstable ion yield is interpreted to be a result of the nonuniform laser ablation and ionization processes. Furthermore, redeposition of the ablated material, namely silicon oxides and kerogen from the microfossils, in the form of nanometer- and micrometer-sized particles, can be observed frequently on the surface of the sample (see further in Section 4). This redeposited material can further intermix and contaminate surface chemistry within proximity to the previously analyzed spots.
Analysis of the depth profiles reveals an increased abundance of carbon at certain depths within a microfossil-rich spot and the chert location (indicated by gray boxes above the depth profile). The total carbon content in the microfossil-rich positions is higher than that in the matrix (Fig. 6A and Table 1). However, carbon is also present in the host location; an explanation for this might be found in the location of the matrix analysis spot. As shown in the panoramic picture of the Gunflint chert sample (Fig. 4A), there is a relatively clean matrix, which gradually turns into a dense assemblage of microfossils. Considering the relative proximity of the analyzed spot to the microfossil-rich zone, the presence of diluted organic and inorganic material within a matrix position is a possible explanation.
Atomic Fractions of Elements Measured with Three Wavelengths of the Femtosecond Laser in Microfossils and Chert
Measurements are from different locations and represent uncalibrated abundances measured from spectra shown in Figs. 6, 8, 10, and 11.
Values affected with clusters interference.
IR, = infrared; n.d. = nondetection; UV = ultraviolet.
Elements identified inside the matrix (host area) and the microfossil-rich zone are presented in Table 1. The chemical composition of the microfossil-rich location shows the presence of 11B, 10B, 32S, and 54Fe, which is consistent with the previously reported presence of pyrite within the cell walls of some of the microfossils (Wacey et al., 2013), as well as enhanced intensities of 12C and 1H and doubly charged 16O2+. The chemical composition of the matrix from the host location reveals the presence of Si and O with contribution of Si oxides, Na, K, Ca, C, H, and hydrocarbon clusters.
An increased amount of carbon localized in the vicinity of the surface likely represents the source of the hydrocarbon clusters. Chert is found to be relatively hydrogen rich and contains elevated amounts of alkali metals compared with other quartz minerals. Considering the particular chemical composition, quartz from the host area is interpreted as a dehydrated diagenetic product of precipitated silica gel (with relatively abundant species in the seawater—Na, K).
3.2. UV-387 measurements
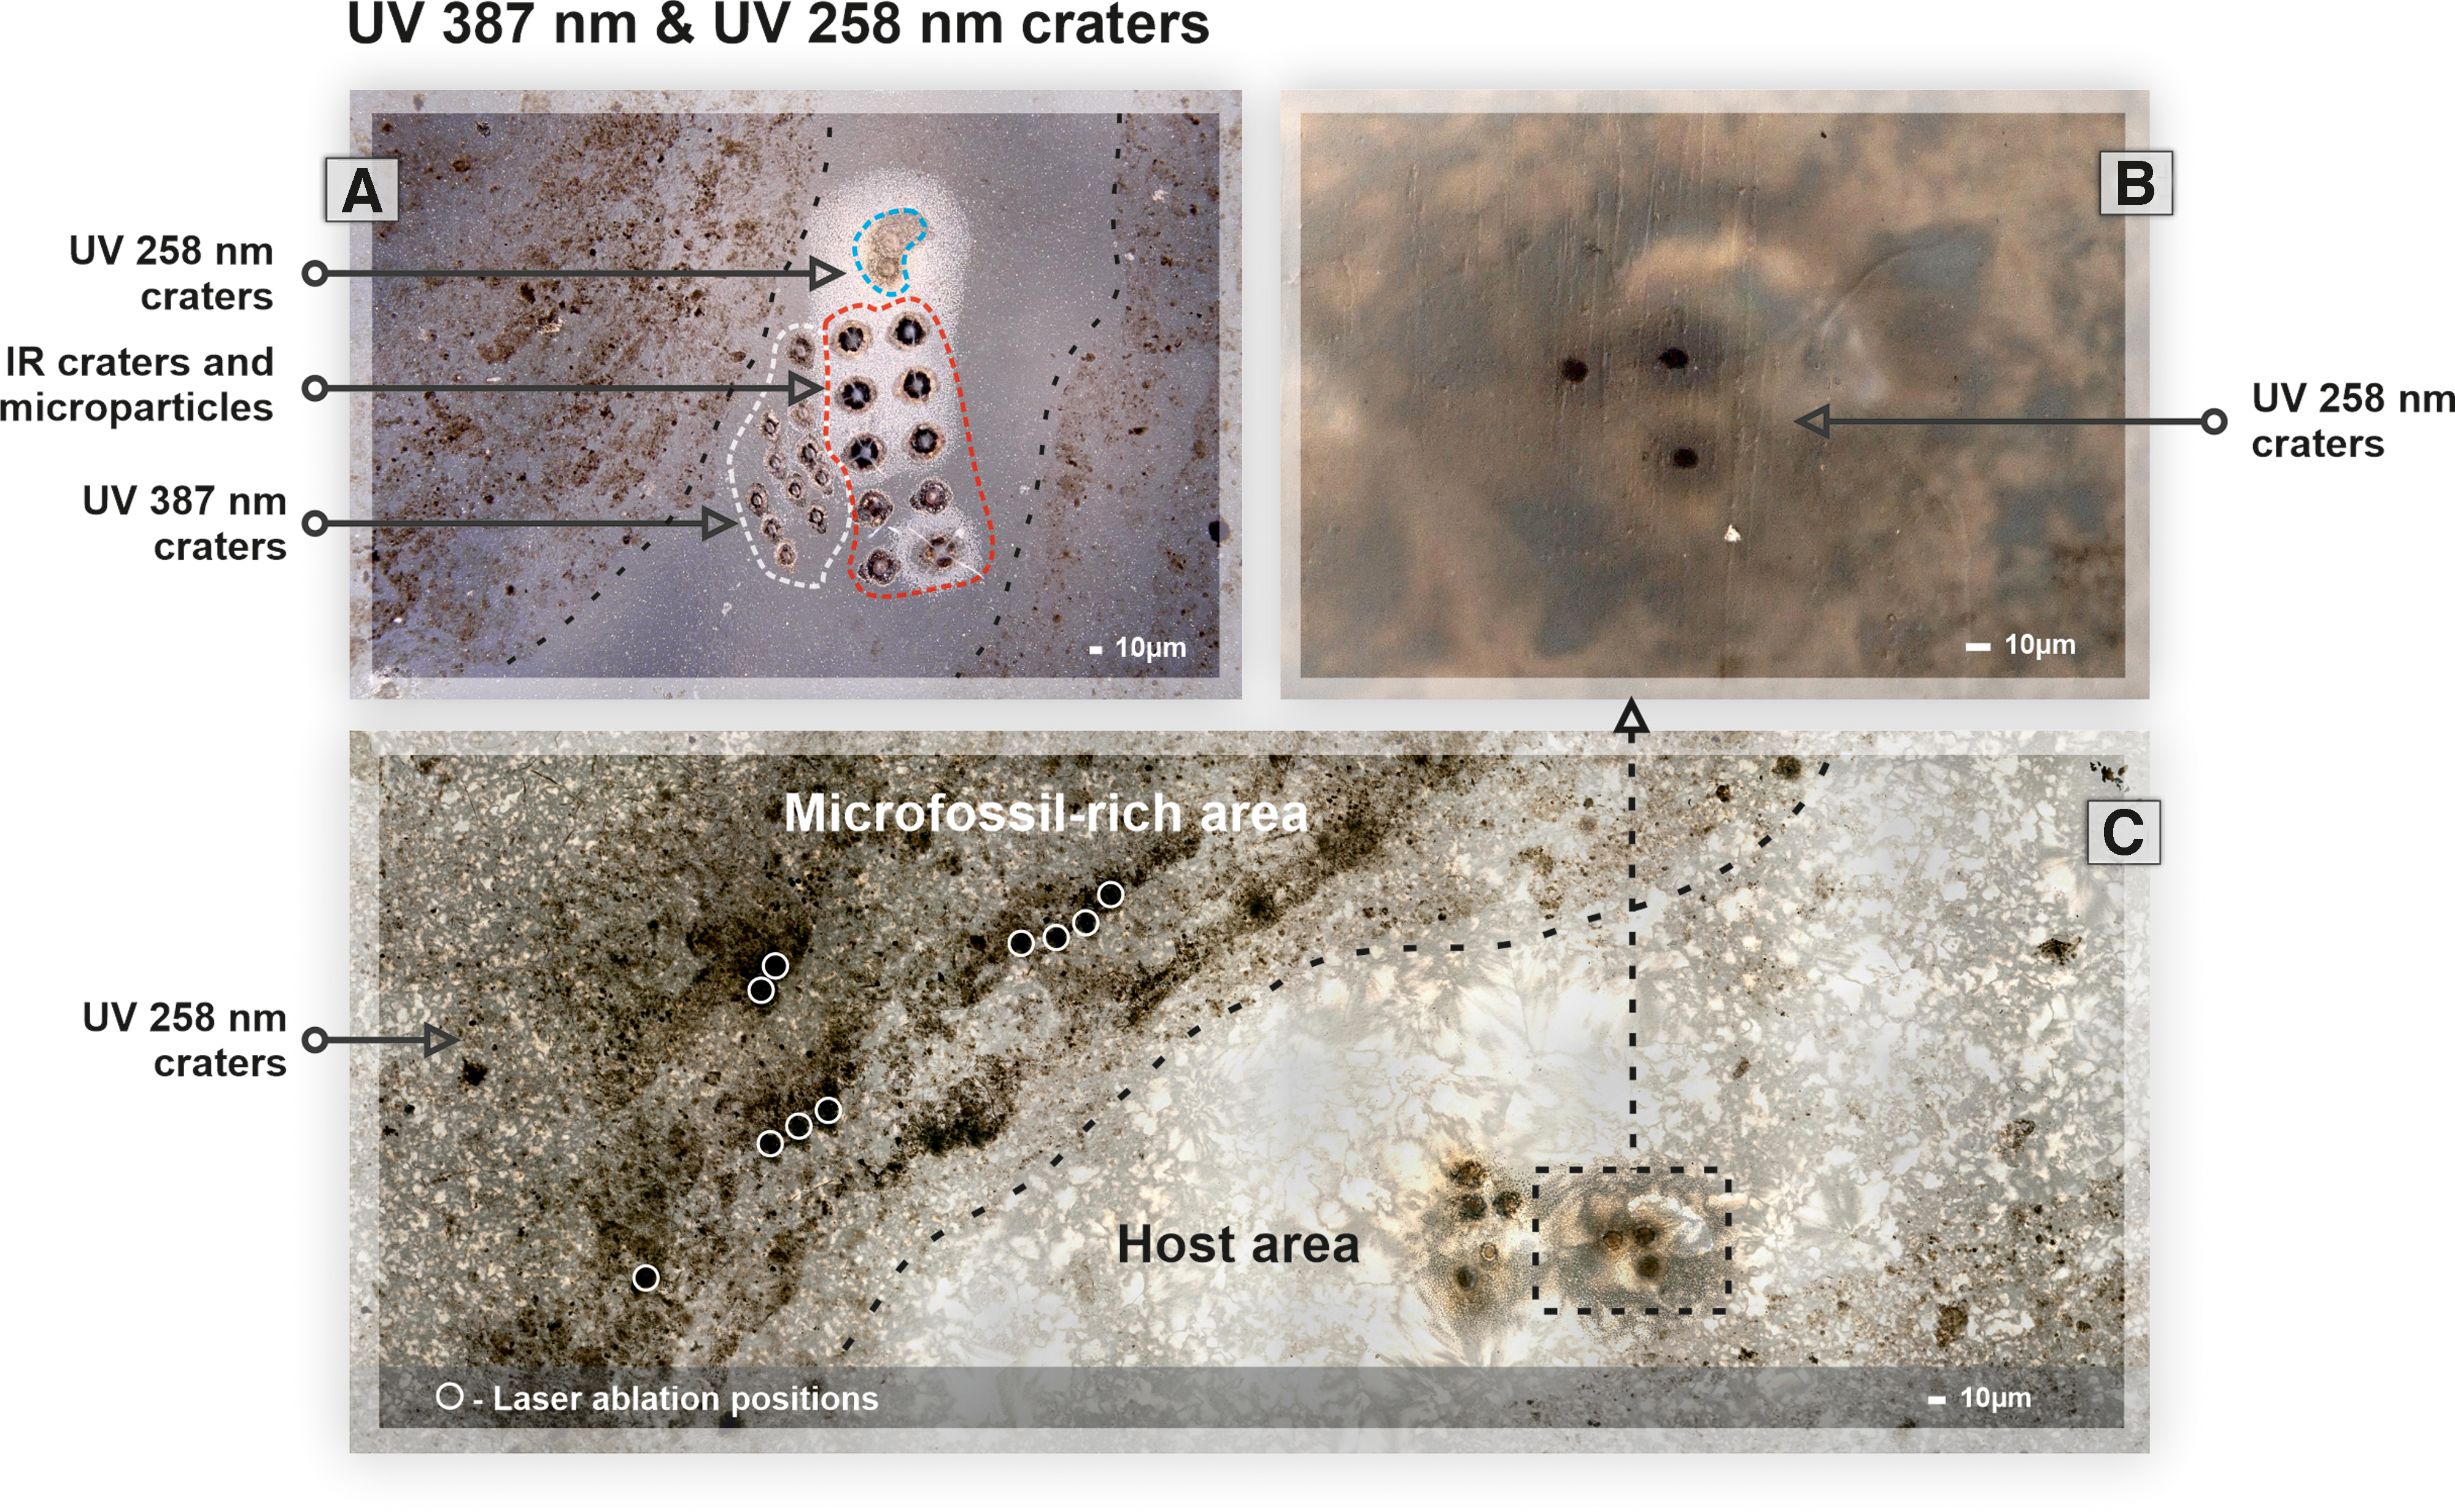
The second set of measurements was performed with UV laser radiation (∼387 nm), where the photon energy increases from 1.6 eV (IR-775) to 3.2 eV (UV-387), thus increasing ionization efficiency. The laser ablation craters formed in these studies are illustrated in Fig. 7A. Mass spectra obtained from the chert and microfossils are shown in Fig. 8A. In comparison with the IR campaign, double the amount of laser shots (300,000 shots) were applied with increased histogramming of 200 shots per accumulated spectrum. Accordingly, the same number of spectra was collected from each position (1500 in total). The increased number of applied laser shots with the UV-387 laser was motivated by an increased signal resolution and stability of the ion yield. In comparison with the IR-775 nm data, the UV-387 nm laser provides better spectrally resolved signals, for example, at the 28Si ion, and with reduced amplitude fluctuations in the depth profiles.
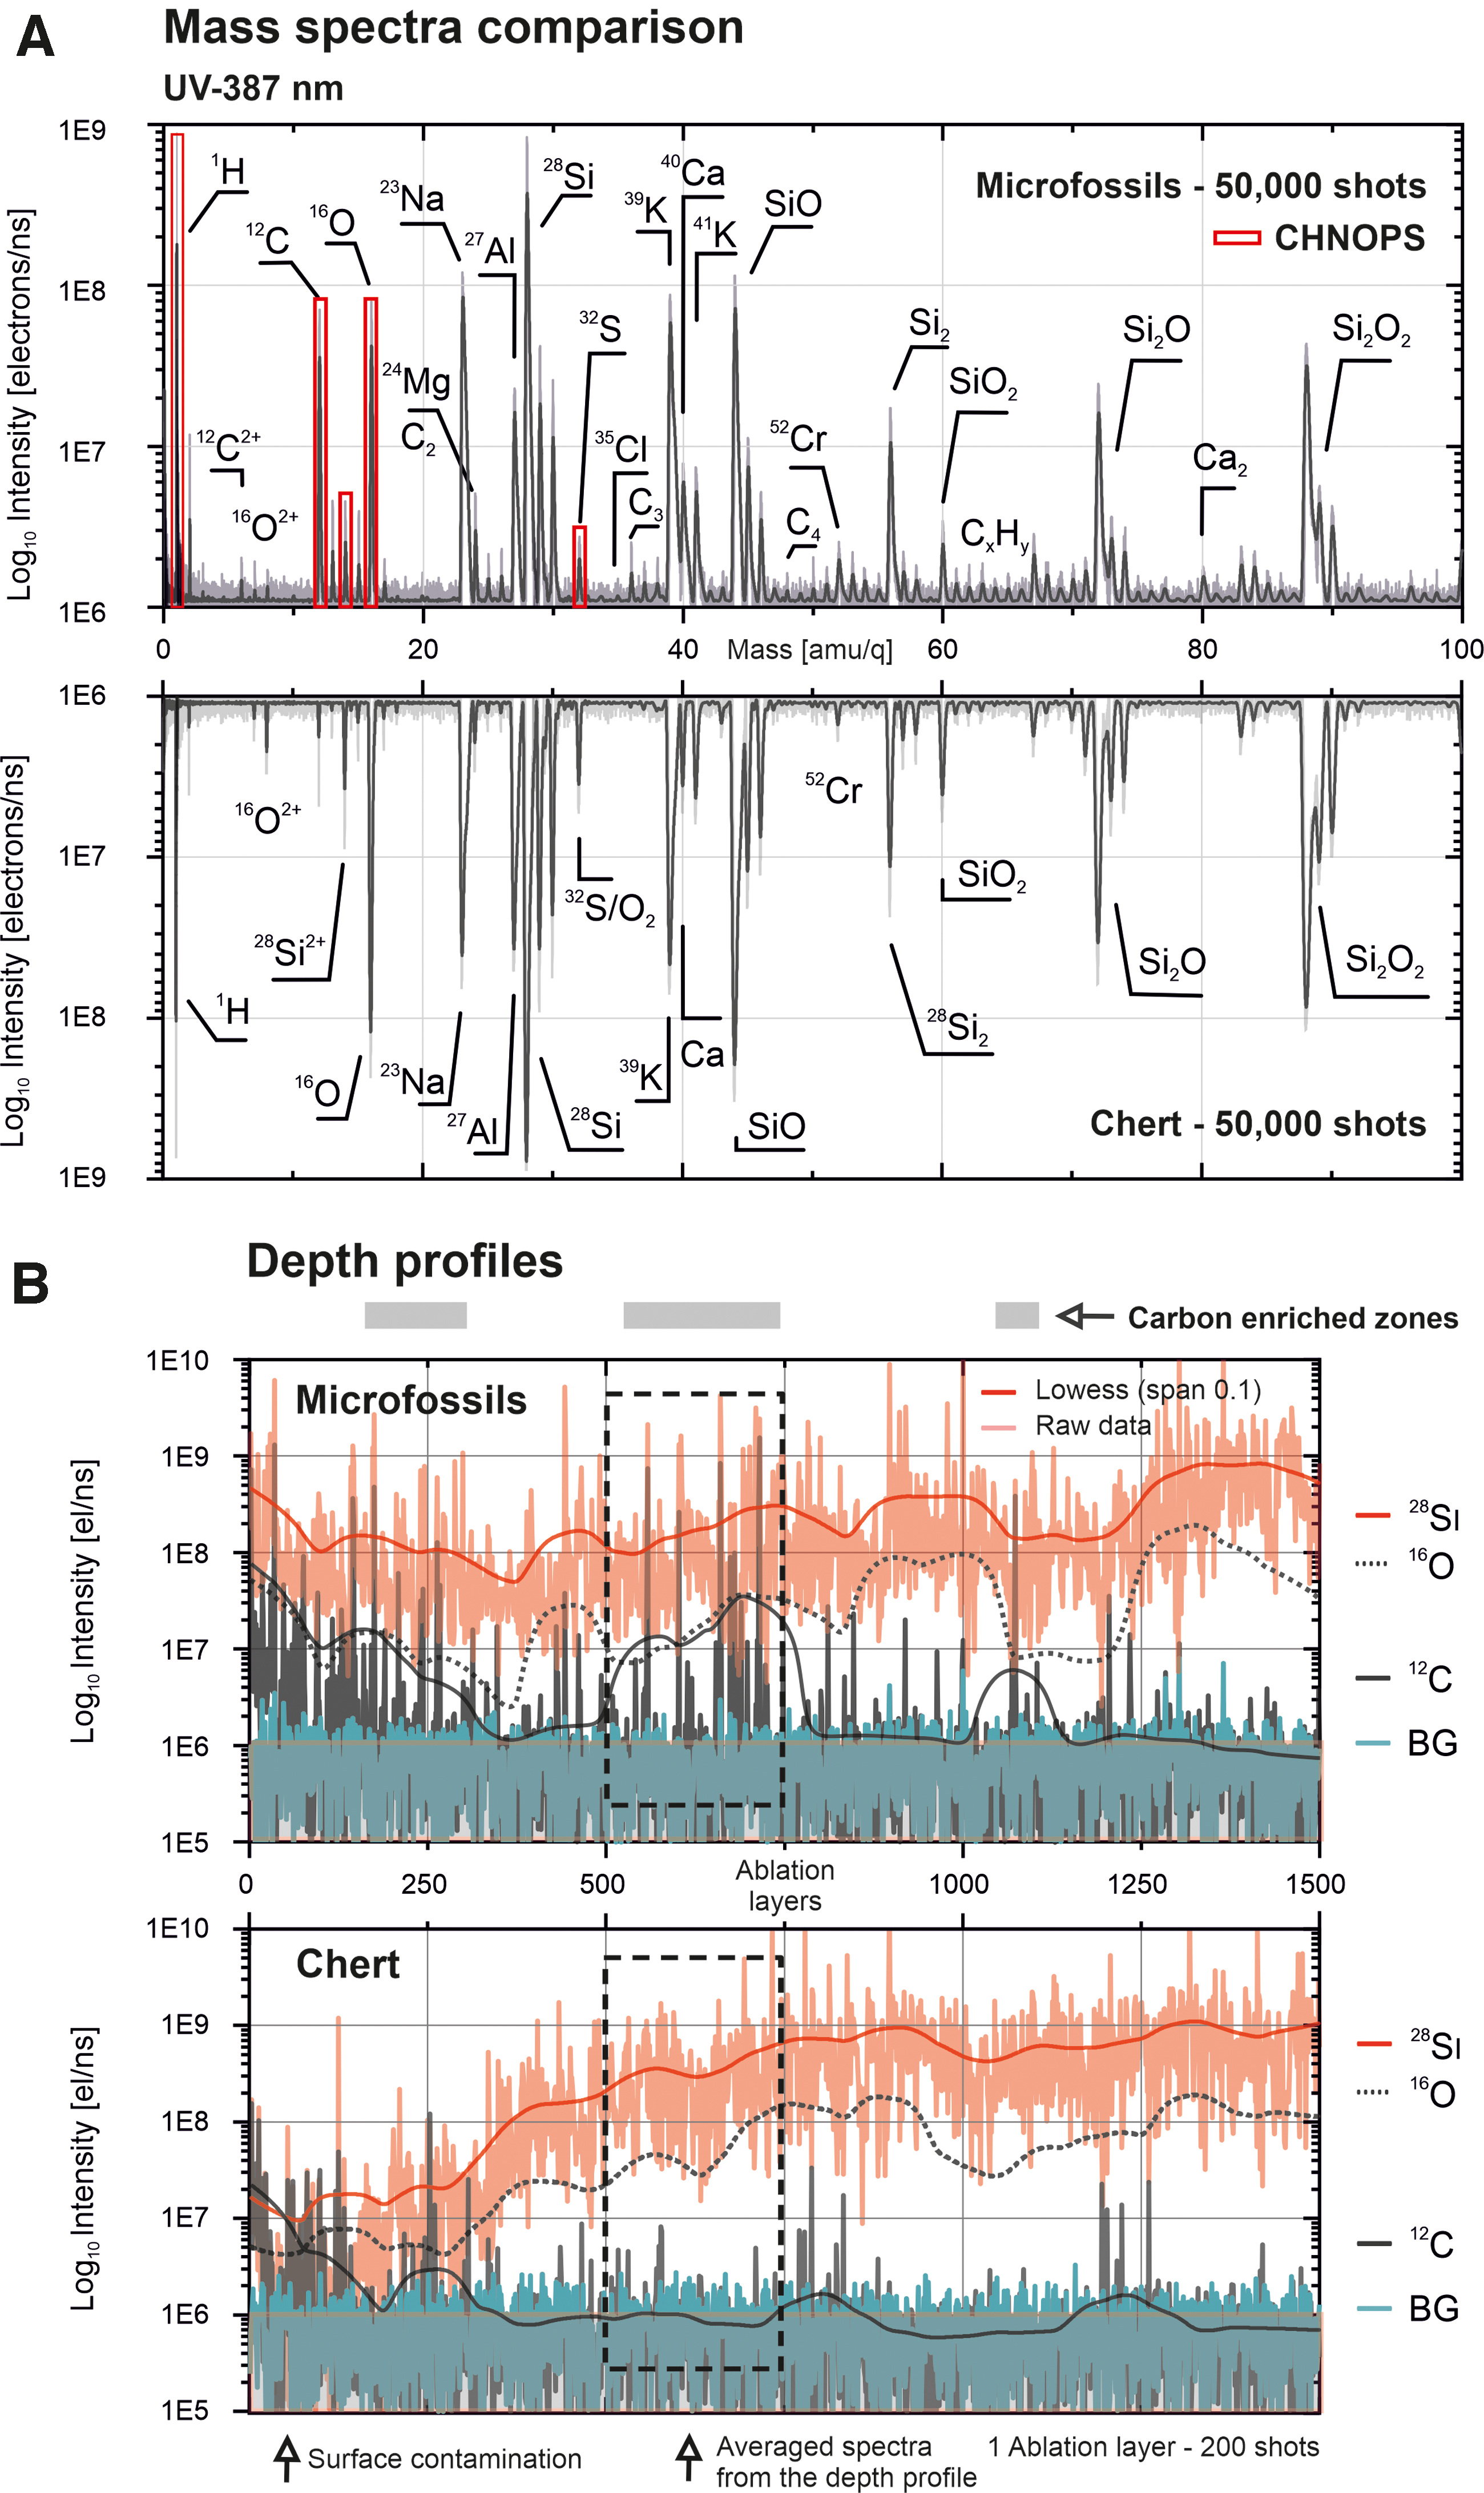
The mass spectra shown in Fig. 8A represent averaged chemical composition accumulated from the shot number 100,000 up to 150,000 (i.e., 50,000 shots in total, corresponding to 250 ablation layers) from the matrix (bottom) and microfossils (top), respectively. Figure 8B depicts the depth profiles obtained from a microfossil and chert location. Data acquired from the surface show an enhancement of carbon signal within both positions, as it was previously observed, which is most probably caused by surface contamination. To avoid contribution from the surface, we analyzed the dataset localized within the depth profile. The most noticeable difference is the increased carbon and hydrogen content, as shown in Table 1 and Fig. 8A.
Moreover, small amounts of 51V, 54Fe, 55Mn, and other isotopes are observed. However, an increased presence of hydrocarbons in the mass spectra makes the unambiguous assignment of elements challenging. On the contrary, an increased abundance of hydrocarbons indicates CH saturated inclusions within the investigated location, which points toward the presence of organic material in the depth profile. Other peaks present in the microfossil-rich location reveal the same SinOm oxides distribution pattern, which means that on the scale of 50,000 shots, matrix signatures dominate the mass spectrum of the fossil location.
In addition, the spectral resolution compared with the IR results substantially increased (see Section 3.4), which allows the accurate analysis of the single mass spectra within the depth profiles. Investigation of the laser ablation craters produced with the UV-387 nm laser within the host area also shows an improvement in the crater formation processes. This observation could be attributed to the better absorption of applied laser radiation by the host mineral (Fig. 7A) and increased ionization efficiency. No secondary craters were observed on the backside of the sample, and no cracks formed in the thin section.
Figure 9 depicts spectra registered from the microfossil-rich spot and reveals an enhanced ionization of the microfossils. As shown in Fig. 9, the spectrum contains mass peaks of triply charged nitrogen, carbon, oxygen, and silicon. All species were identified within the microfossil-rich zone by averaging 50 individual spectra with the most intense carbon signal, excluding surface data. Since the main 14N peak is interfering with CH2 and with doubly charged 28Si, identification of nitrogen is challenging; however, multiply charged species have distinct mass-to-charge ratios, and the presence of triply charged species allowed unambiguous identification of nitrogen 14N3+ at mass 4.67 in the microfossil-rich zone (Fig. 9) along with 12C3+, 16O3+, and 28Si3+.
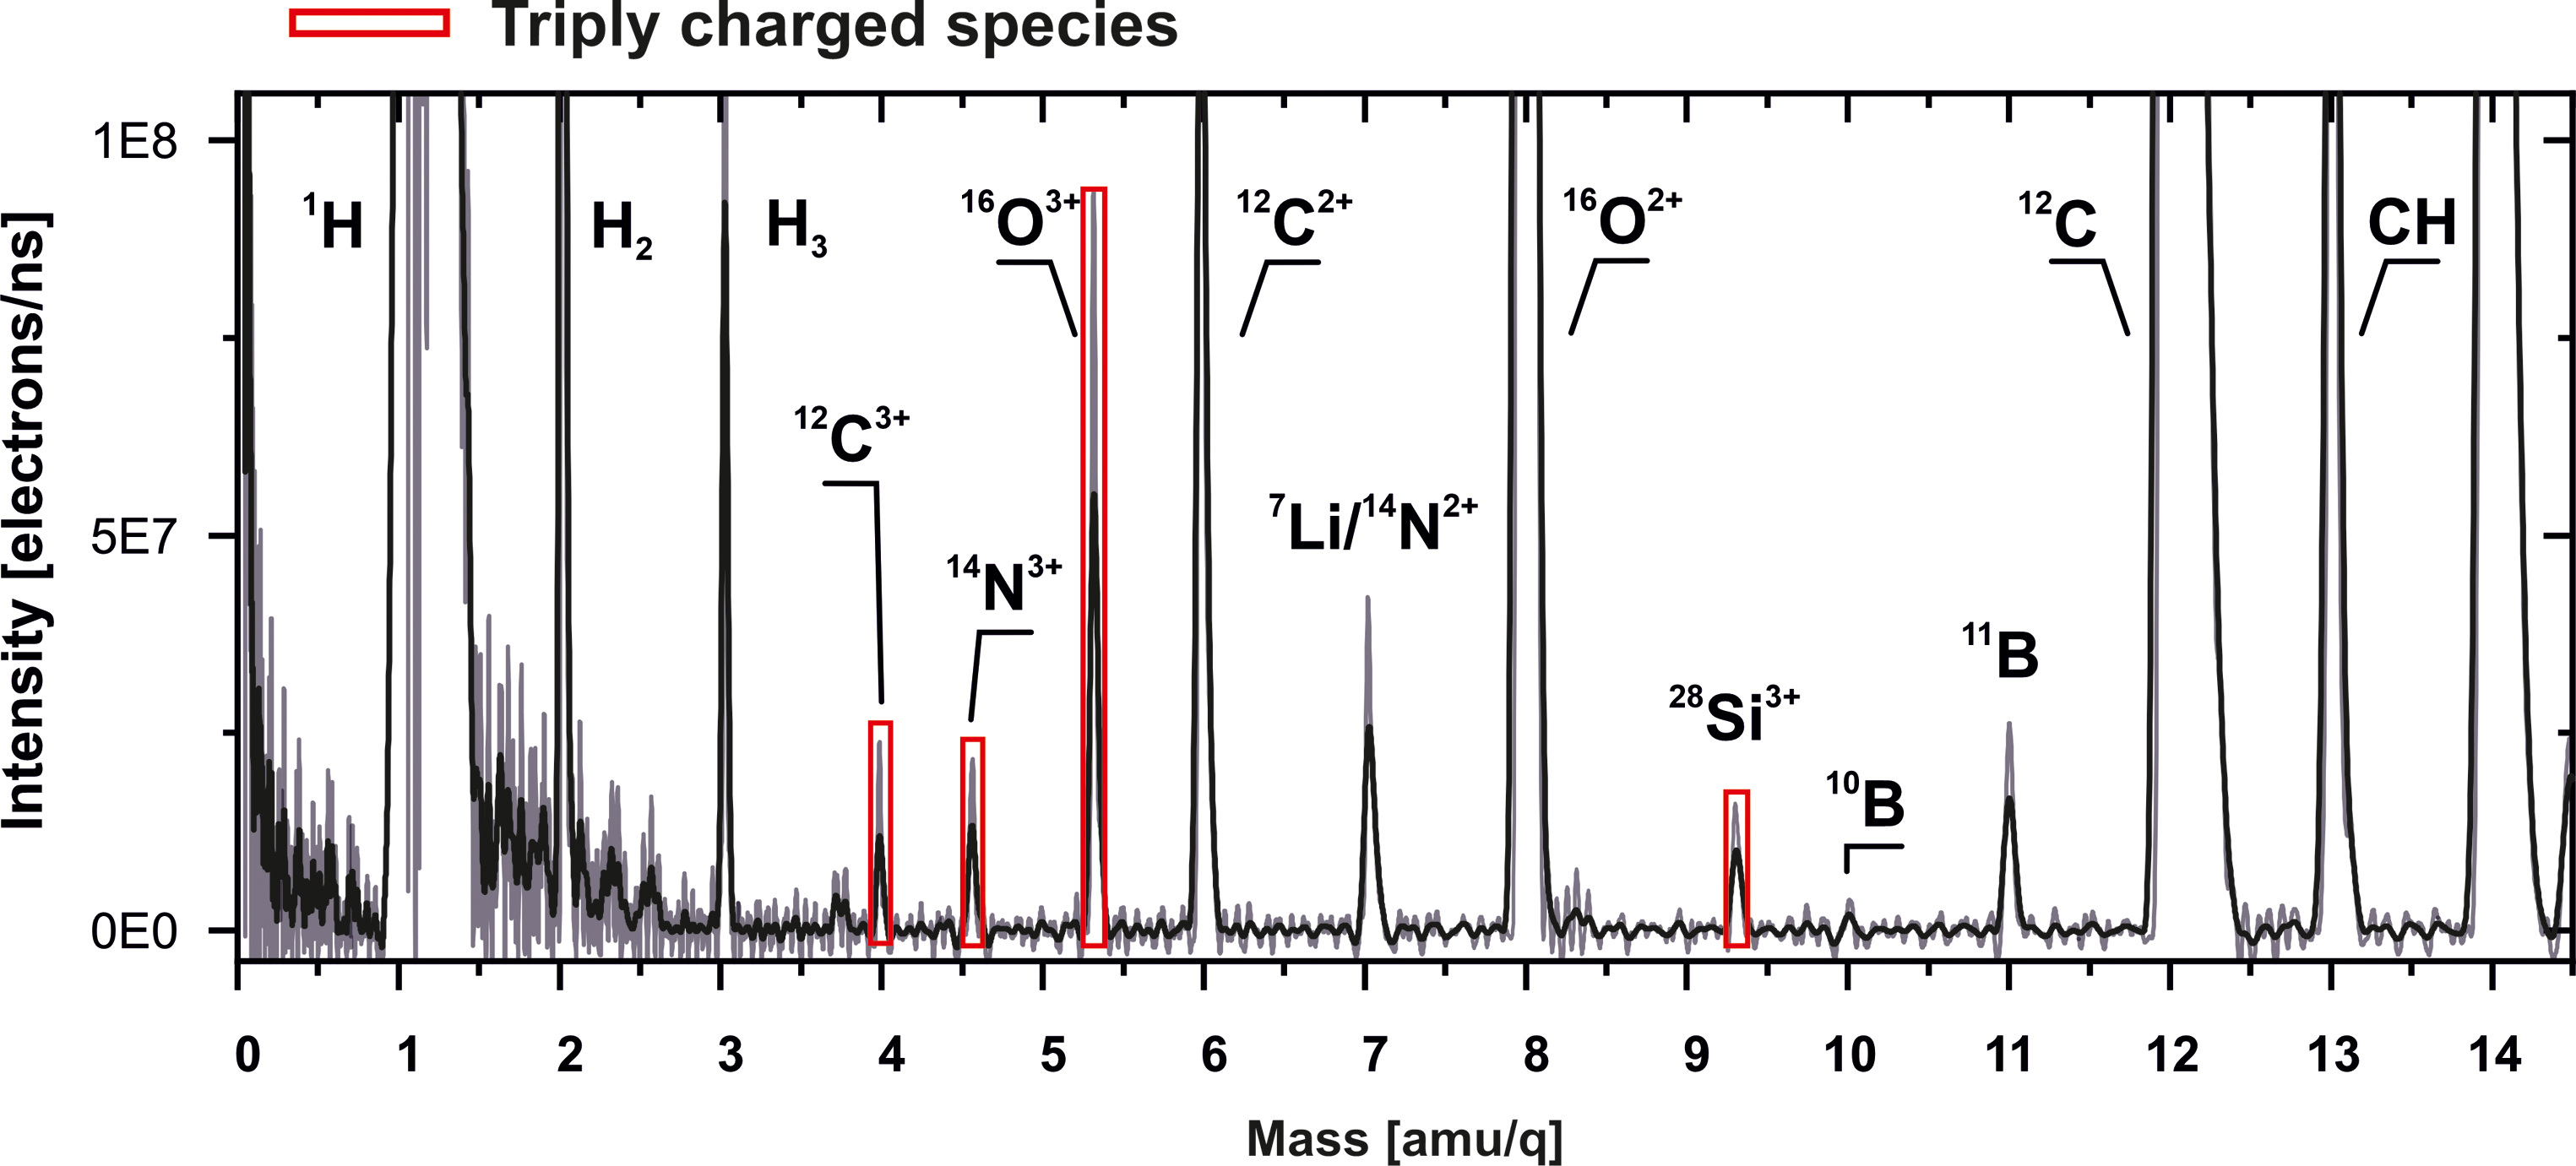
Mass spectrum registered from the microfossil-rich location using UV-387 nm laser. Red bars indicate the presence of triply charged nitrogen-14, carbon-12, oxygen-16, and silicon-28 peaks. Color images are available online.
In addition, this observation shows that a high-power scan strategy (high laser irradiances) might be applied to identify elements with isobaric interferences, shifting the identification of elements into the lighter mass-over-charge range. Compared with IR-775 nm, using the UV-387 nm laser wavelength resulted in a considerable improvement in mass resolution, crater shape, and sensitivity.
3.3. UV-258 measurements
The third measurement campaign was performed with the UV-258 nm laser radiation (photon energy reached 4.8 eV, further increasing the ionization efficiency). Single position analysis was performed by applying 500,000 laser shots and registering signals on two digitizing cards. In total, we registered 2500 spectra from each card, where each of the accumulated spectra consists of 200 single laser shot spectra, making it 5000 spectra from a single depth profile.
The experiments were held by using a constant repetition rate of 1 kHz between batches of 200 laser shots. After finishing the batch of 200 laser shots, a 1-s delay was implemented to ensure the spectrum transfer to the solid-state-disk. The length of the data recording for a single depth profile amounted to 50 min. Unlike the mass spectrometric studies with UV-387 nm and IR-775 nm laser radiation, where the mass spectra were measured from only two channels of the detector, the measurements with UV-258 nm were recorded on three anode channels (to mitigate signal saturation and fluctuations effects).
This approach allows recording the ion signal collected from the MCP detector with a reduced probability of saturation. However, it requires a different ion-optical configuration (for an even distribution of ions on the MCP detector) and the collection of two separate datasets.
Figure 10 depicts mass spectra and depth profiles collected with the UV-258 nm laser radiation. In comparison with the studies with the IR-775 and UV-387 laser radiation, the mass peak intensity of 28Si is observed to be less variable, allowing high-quality depth profiling analysis, both within the host and the microfossil-rich locations. The spectral resolution remains on the nominal level, even during the transition between carbon-containing cell walls of the microfossils and pure silica matrix.
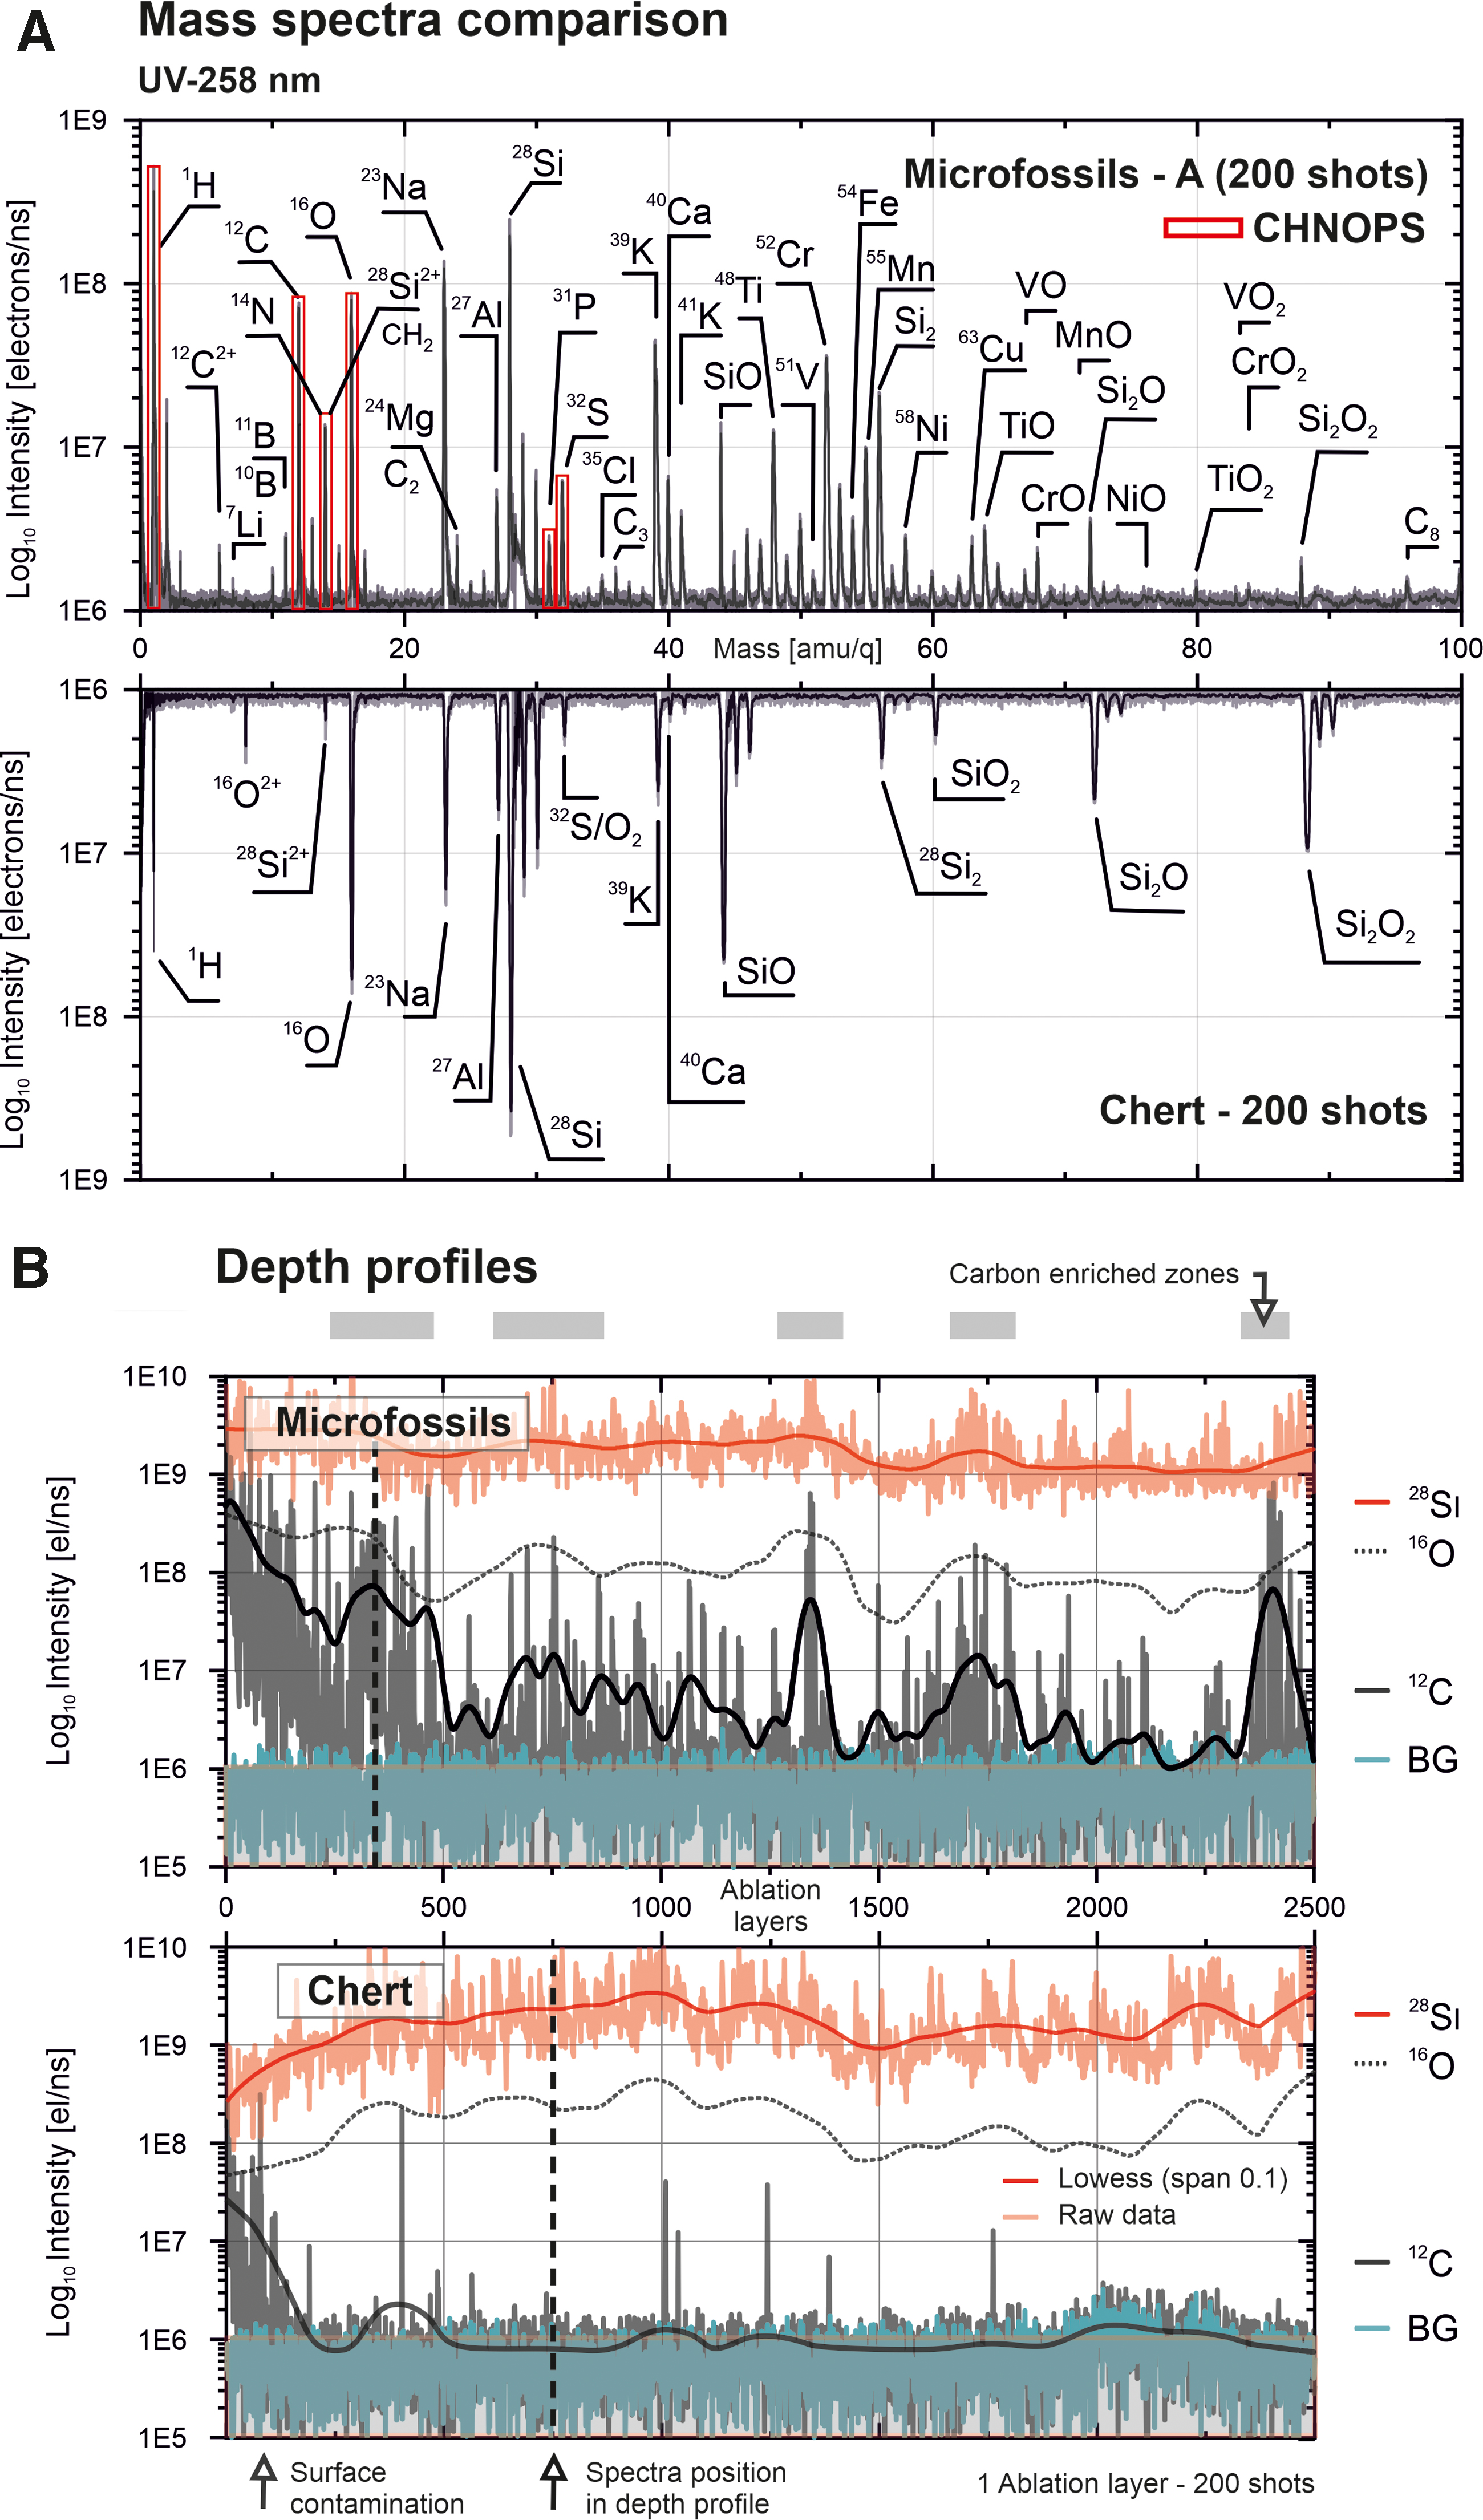
Figure 10A depicts a comparison of two mass spectra histogrammed over 200 shots each, in two distinct zones—within the body of a microfossil and inside a clean host matrix. Selective low-scale averaging (200 shots) was applied here to emphasize the importance of single spectrum accumulation. The 12C depth profile from the microfossil-rich location reveals multiple carbon sources located at different depths (see gray boxes in Fig. 10B). The signal from the microfossil-rich location differs from the chert and could be characterized by the presence of biologically relevant elements (CHNOPS) (see red bars in Fig. 10A).
Similar to the data obtained with the UV-387 nm laser, individual spectra along the depth profile reveal high-intensity mass peaks of 12C and 1H with the presence of mass peaks of carbon clusters but at much lower intensities. Another notable feature observed in the mass spectra of the microfossils is the presence of 31P, 32S, 34S, and elevated values of transition metals with biological relevance 48Ti, 51V, 54Fe, 55Mn, 58Ni, and 63Cu, which are considered to be essential for the operation of oxygenic photosynthesis (Shcolnick and Keren, 2006).
Elevated values of these elements compared with the abundances of other elements, such as C and Si, result from more efficient ionization of metallic species. The host mass spectrum, depicted on the lower part of Fig. 10A, shows the elements expected from the host (quartz) mineral—Si and O with typical Si clusters and oxides distribution pattern, and additional contributions of H, Na, Ca, and K.
Moreover, the carbon mass peak intensities from the host location (quartz) are observed to be negligibly low with rare spikes in the depth profile, which may be interpreted as a contribution from the surface, reflecting the growing diameter of the ablation crater with increased depth. The presence of carbon on the surface of the matrix location was identified as contamination. As shown in Fig. 10B (see gray boxes), using carbon as a tracer of microfossils, we identified multiple locations of microfossil bodies, which are distributed within the SiO2 matrix. Removal of several layers of the matrix is required to acquire a spectrum from the embedded microfossil. In this particular case, the microfossil spectrum was acquired at a depth of 70,000 shots.
3.4. Identification of rare earth elements and elemental composition of analyzed spots
Figure 11A depicts a spectrum from a microfossil and reveals a similar element composition to previously described spectra but with the additional identification of La and Ce. The element composition of the analyzed locations is given in Table 1 (column: Fossil-B). The distribution of La and Ce within the analyzed spot reveals a highly confined character; that is, elements were identified in two distinct locations (see gray boxes, Fig. 11B). Each of these spectra shows the correlation with the elements previously identified in other microfossil-rich zones. The co-occurrence of P, O, La, and Ce can indicate the presence of an inclusion of a rare earth phosphate mineral; that is, monazite.

The appearance of La and Ce together with carbon also raises questions about potential preservation of parts of the microfossils by monazite, which has been previously reported for microfossils from 1 billion-year-old Torridon phosphates (Wacey et al., 2019). Monazite was suggested as the first mineral precipitate to form after cell death in the Torridon samples, forming an insoluble, stable phase, thus preserving fine structural information. However, a limited number of detections from the Gunflint microfossils do not allow us to infer a definitive correlation between monazite preservation and microfossils. The abundance of rare earth elements (REEs) from the Gunflint chert was reported previously (Shimizu and Masuda, 1977), with bulk values <1 ppm: La—0.0785 ppm, Ce—0.1946 ppm. Other REE concentrations were estimated to be significantly lower (measurements were performed by using a stable isotope dilution technique) (Shimizu and Masuda, 1977).
Our observation also shows that heavier REEs' abundances are below the detection limit, which points toward the necessity of data acquisition with an even smaller number of laser shots to be binned (histogramming of 10–50 single laser shot mass spectra) to improve the detection limits. Enriched Ce and La points toward the presence of oxidizing conditions within Gunflint waters and supports a cyanobacterial affinity of at least some microfossils, which might indicate microbially mediated oxygenation of the photic zone. Another piece of evidence comes from the identification of Mn and Fe, two relatively abundant elements within the Gunflint sample.
Mn has a similar redox profile to Ce (Mofett, 1994), and it is known that large numbers of microorganisms enzymatically oxidize Mn (Lozano and Rossi, 2012). Bulk rock geochemistry from the Gunflint formation (Fralick et al., 2017) suggests that La and Ce concentrations vary within the formation in the range from single-digit ppms to hundreds of ppms (including data from calcite stromatolites, conglomerates, ankerite, and calcite grainstones). These lithologies represent variations within the stratigraphic column, reflecting changing input from different sources—detrital and fluvial to hydrothermal REEs and transition metals.
The total atomic composition of the analyzed locations is given in Table 1. More elements can be identified due to the increased sensitivity and improved ionization efficiency by using shorter UV wavelengths (see Table 1 columns: Fossil-A and Fossil-B). Figure 12 reveals histograms of 28Si peak mass resolutions (left) and 28Si signal intensities (right) measured in different depth profiles and using different wavelengths. The width of the distributions indicates the incidence of different mass resolutions and peak intensities (width is normalized to the same height between laser wavelengths and samples).

Left—The distribution of the 28Si spectral resolution in the depth profiles for each applied wavelength within two distinct zones. Distributions are calculated by using kernel density estimates and have been normalized to the mode values. Mean value location and 1 SD variation indicated with a dot and a vertical line. Right—The distribution of the 28Si intensities in the depth profiles for each applied wavelength within two distinct locations (microfossil-rich zone and host mineral area) is shown as a scatter plot. The red thick horizontal line indicates location of the mean peak intensity registered from the depth profile. The red horizontal line indicates location of the background signal. The numbers at the top of the figures indicate the total laser count applied to the given locations. SD, standard deviation. Color images are available online.
In comparison with the IR measurements, spectral resolution within highly absorptive microfossil bodies remains at the nominal level, without any significant distortions of the spectral features (Fig. 12). By collecting data in situ, within the microfossil bodies, a gradual increase of C and H with shorter laser wavelengths was detected (Table 1 Fossil-A). The atomic fraction of H increased from ∼2% in the chert (host area) to ∼24% within the microfossil body. A similar increase was detected for C ranging from nondetection (n.d.) to ∼7%. A negative correlation was detected for the host elements on the same location: Si concentration decreases from ∼77% to ∼15% in the spectra acquired from the microfossil.
A comparable decrease was observed for O as well: from ∼15% to ∼8%. We inferred the presence of pyrite microscopic inclusions from the high values of Fe—an increase from n.d. in the host area to ∼6% within a microfossil. Similarly, S increased from ∼0.2% to ∼0.7%, which is in agreement with previously reported data (Wacey et al., 2013). An almost identical distribution of element composition was detected in location B (see Table 1 columns: Fossil-B), with the additional presence of REEs (La and Ce). Application of the relative sensitivity coefficients (RSCs determined for matrix-matched quartz latite standard sample [USGS QLO-1]) (Neuland et al., 2016) reveals accurate stoichiometric ratios for quartz matrix [Si/O] ∼1/2.
3.5. UV-258 nm measurements with HV pulser
As mentioned previously, our time-of-flight mass spectrometers can register positively charged species present in the ablation plume. However, highly abundant light ions, arriving early to the detector, with ion flux values exceeding 107 ions × s−1 might lead to the saturation of the detector (caused by the dead time of the triggered MCP pores) (Riedo et al., 2017; Wiesendanger et al., 2017), which will result in the reduced sensitivity of the detector for heavy elements and molecules.
To suppress saturation effects, we applied two technical solutions: (1) enlargement of the active area of the detector and implementation of the impedance-matched multianode. (2) Implementation of a short HV pulse applied to the ion-optical system of the mass analyzer to repel the flux of the major light ions from the nominal ion-optical path. A mass spectrum measured with the HV pulser and UV-258 nm laser radiation is depicted in Fig. 13 and represents an average composition (200,000 laser shots) of the quartz mineral from the host location. In comparison with the conventional spectrum acquisition mode, the mass range of the detected species was substantially enlarged (by factor 4).
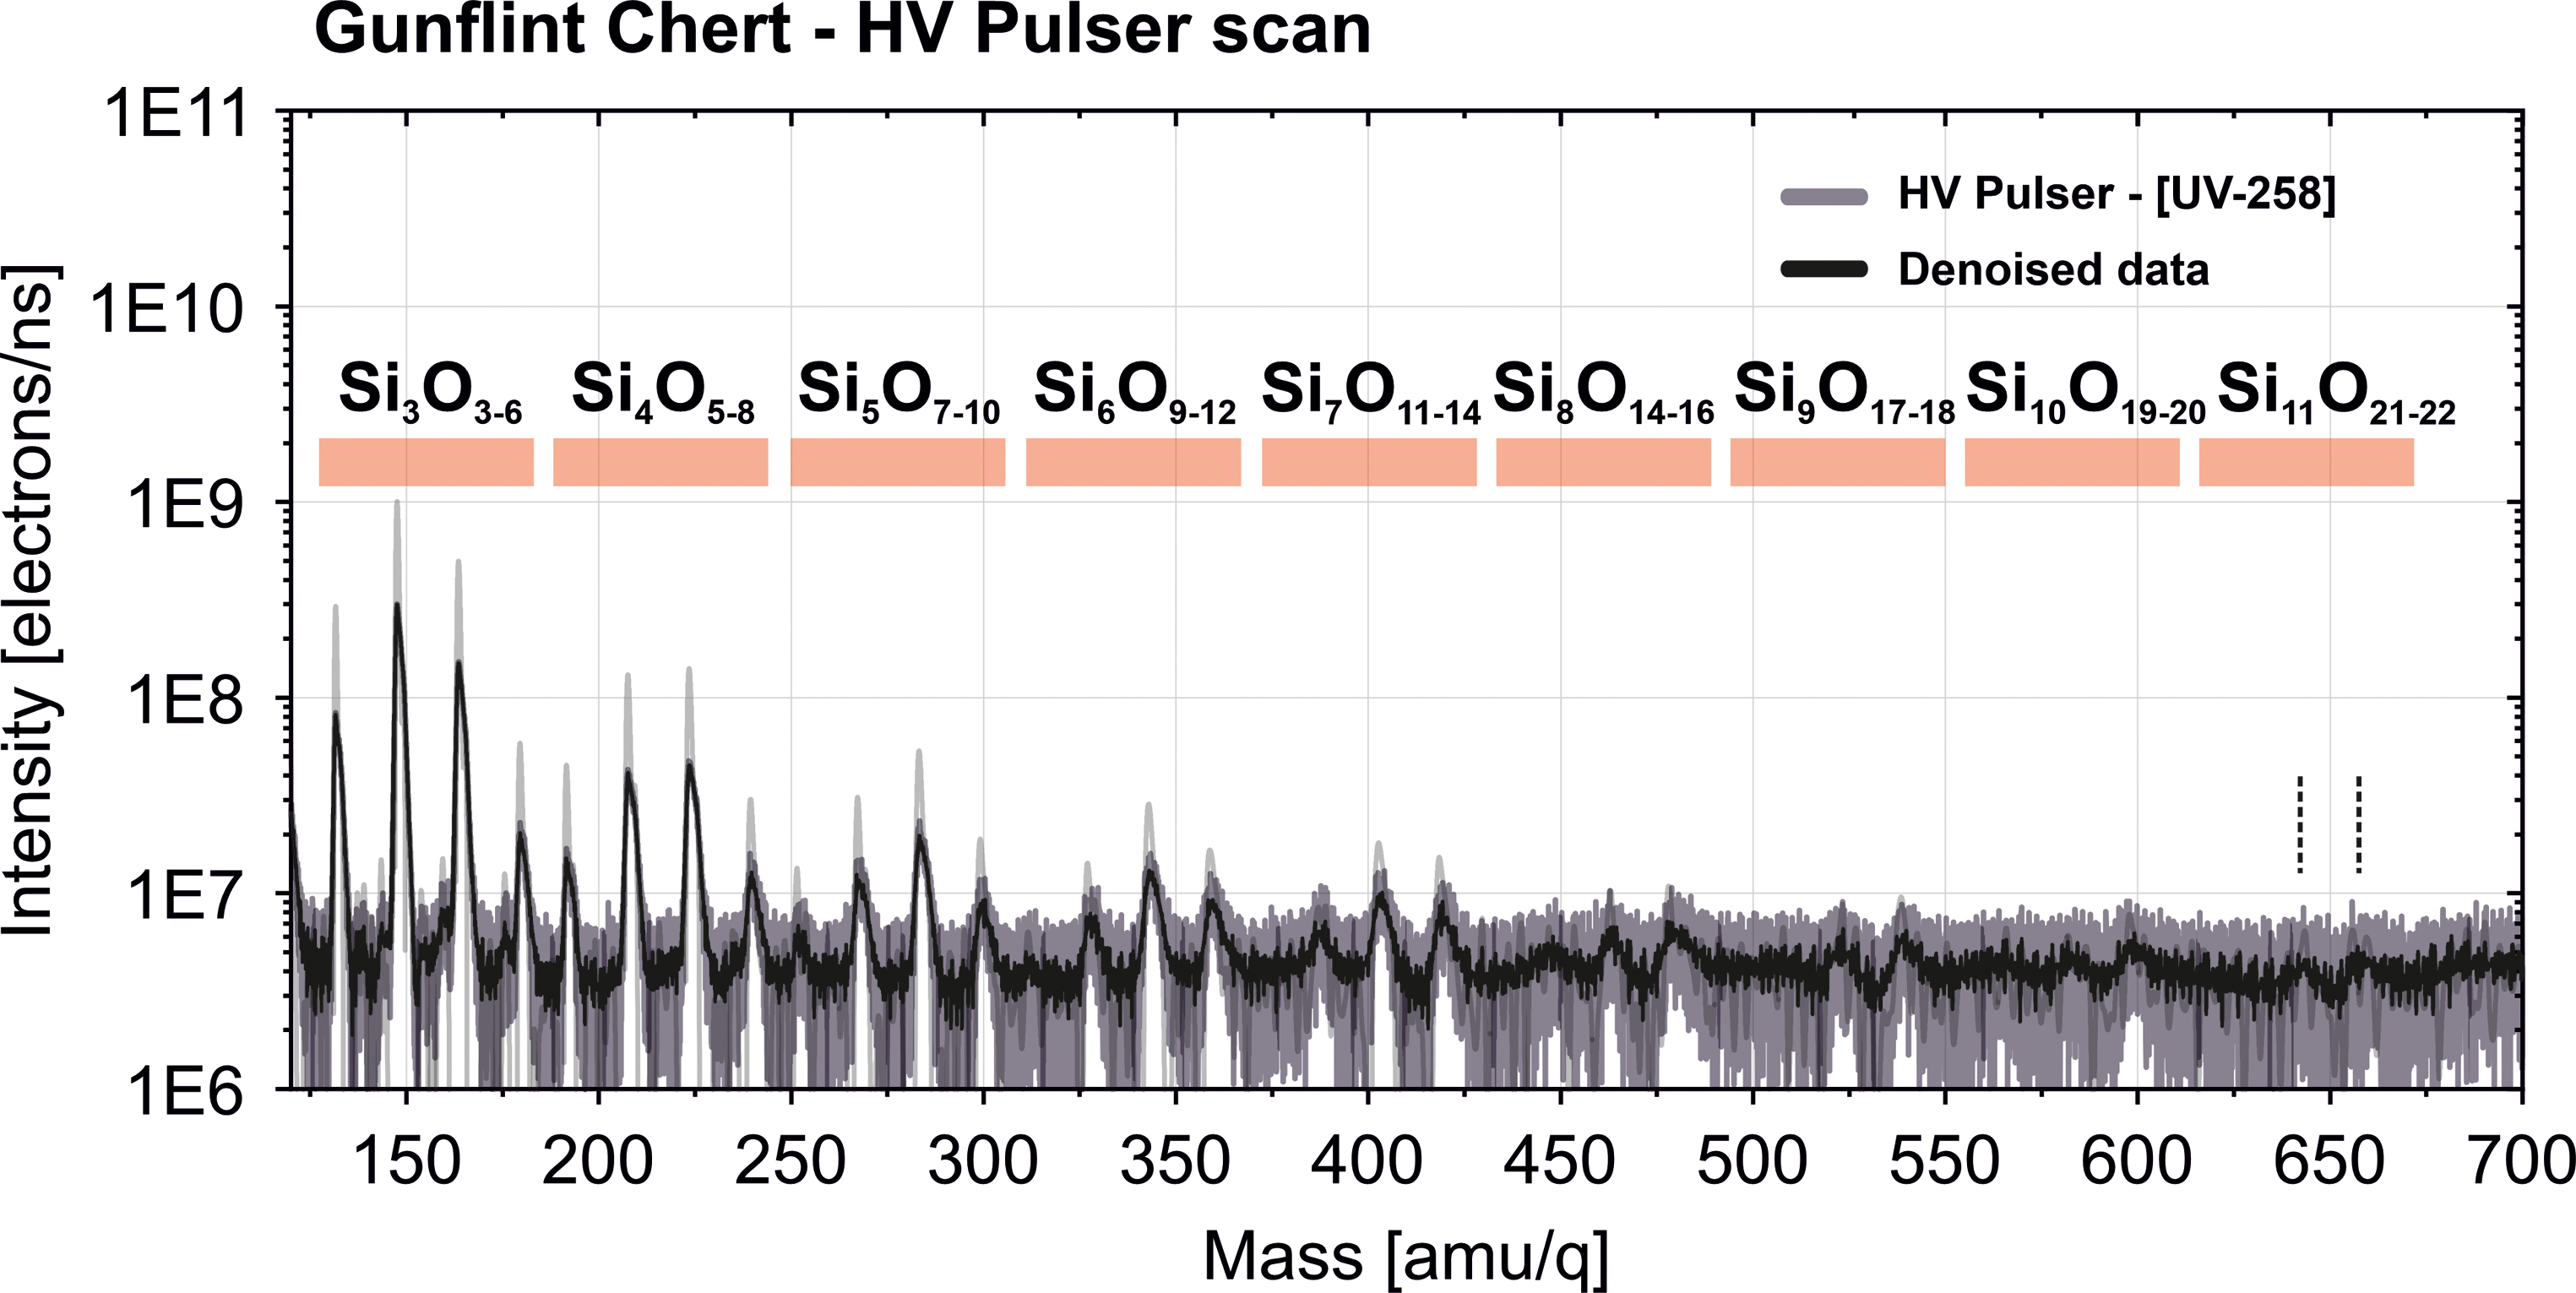
Mass spectrum of quartz mineral from chert is acquired in the HV pulse mode. Red bars on top of the spectrum indicate the location of the specific SixOy chains. The last identified molecules are shown with two dashed horizontal lines, and represent large molecules of Si11O21 and Si11O22 (m/q = 644 and 660). The light gray line indicates the raw spectrum, and the black line represents denoised mass spectrum. HV, high voltage. Color images are available online.
The spectrum depicted in Fig. 13 illustrates the distribution of various silicon oxide clusters and reveals a good agreement with theoretical calculations of stability ranges of silicon oxides (Lepeshkin et al., 2019). The identified species span from relatively small oxides—Si3O3, Si3O4, with masses 132 and 148 amu, respectively, up to the largest identified silicon oxide—Si11O22 (660 amu). Measurements conducted within the microfossils revealed an identical cluster distribution profile (on the same averaging scale), which supports the conclusion that signal from the microfossils is very narrowly localized within specific depths, and quickly decays to the matrix values and requires the depth profile analysis with an averaging scale between 50 and 200 single laser shots.
4. Discussion
The main scope of this study was the investigation of the applicability of our integrated LIMS system (mass spectrometer and a microscope) for the detection and characterization of microscopic organic inclusions from astropaleontologically relevant samples, such as cherts, siliceous sinters, and siliciclastic deposits (McMahon et al., 2018). One of the main advantages of the LIMS system is that it can provide localized and spatially resolved in situ element analysis (Riedo et al., 2016) combined with molecular information (Moreno-García et al., 2016; Ligterink et al., 2020). However, performance of the mass analyzer coupled to a laser ionization source inherently depends on the physical parameters of the ablation/ionization.
The implementation of femtosecond lasers instead of nanosecond lasers was shown to reduce various fractionation processes and matrix effects (Zhang et al., 2013), and the corresponding RSC tended toward one for polymetallic samples (Riedo et al., 2013). Nevertheless, despite the LIMS applicability to an extensive range of samples, the quality of gathered data might vary. Optically transparent, dielectric samples with heterogeneous, highly absorptive inclusions, for example, microfossils, are challenging targets for analysis, as shown in Section 3 for the longer wavelengths. For example, bandgap values reported for α-quartz are determined to be ∼6 eV (Calabrese and Fowler, 1978) and 9 eV (Chelikowsky and Schlüter, 1977), which means that for an effective release of charge carriers from quartz, the absorption of a higher amount of photons is required, compared with the absorptive kerogen embedded in a silicate matrix.
Within the experimental framework, analysis of such different materials with LIMS by using an IR laser requires tuning the energy of the laser for each investigated material to achieve well-resolved spectral data (which is hard to accomplish within a single position). The issue of low spectral quality of data obtained from geological samples with the IR laser was addressed by filtering acquired spectra (Wiesendanger et al., 2019). This method applies spectral quality scoring and selects only resolved peaks for the analysis, while discarding spectra affected by broadening.
Method revealed significant improvement in the determination of isotope ratios; however, a substantial amount of data might be discarded, and thus information about the chemical depth profile may be lost. Unequal ionization of different minerals can also affect the mass spectrometric imaging quality, where potentially more sets of minerals can be present, which consequently has a potential to introduce artifactual imaging results.
Some of the processes observed during the ablation of the thin section from the Gunflint chert are shown in the sketch in Fig. 14. Figure 14A describes the formation of the ablation crater after a number of applied IR laser shots. Since the sample and the glass holder are nearly transparent to the applied wavelength, part of the IR beam passes through the transparent media and ablates material on the surface of the metal holder, forming a secondary crater. This process can be accompanied by the formation of radial cracks and possibly by contamination of the surface with the steel ablation products.
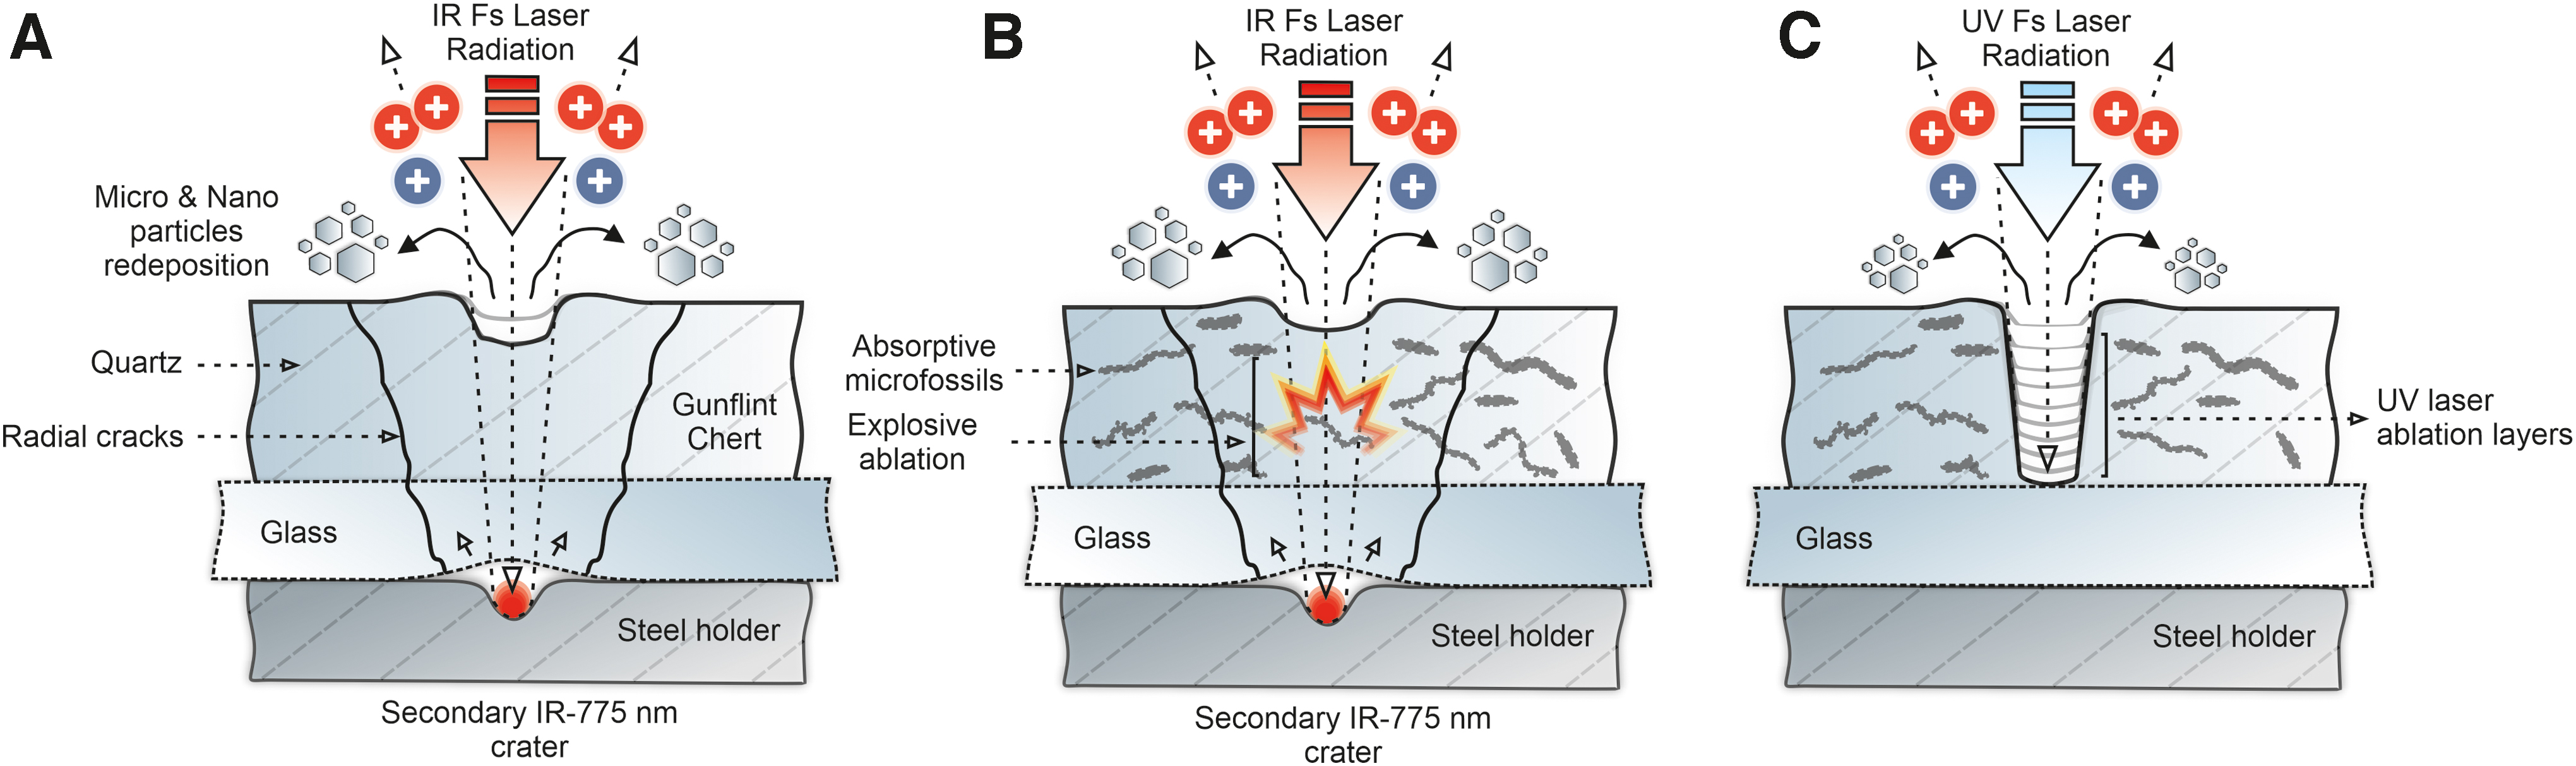
Schematics of the femtosecond laser ablation of the Gunflint chert sample.
Figure 14B depicts the ablation of embedded microfossils due to their higher absorptivity of the IR radiation and subsequent formation of the secondary craters. The figure illustrates the quick removal of the absorptive microfossils from the analyzed spot. In contrast, ablation and ionization with UV-258 nm radiation provide a uniform absorption of photons by the host mineral and the microfossil inclusions, as illustrated in Fig. 14C. This conclusion is verified by the absence of the secondary craters on the underlying steel holder.
Moreover, the distribution of the spectral resolution and intensity of 28Si, depicted in Fig. 12, indicate an improvement of the registered signal quality by using shorter laser wavelengths. Figure 15A and B show the close-up images of the obtained craters and demonstrate a gradual improvement of the crater morphologies by using shorter wavelengths. Figure 15C shows the atomic force microscopy (AFM) crater morphology measurement obtained from the host mineral area when using a UV-258 nm laser (see the location of the same crater in Fig. 15B [white arrow] and the depth profile registered from the same crater in Fig. 10B). The figure indicates that a 10 μm wide crater quickly decays to half of its diameter at depth ∼4 μm and forms a conical crater with a sharp ending. The crater most likely goes as deep as ∼25–28 μm; however, the AFM depth range was not sufficient to measure such deep craters.

Therefore, an accurate estimation of ablation rates could not be achieved. However, the precise ablation rate for the same instrument was previously determined for NiCr standard material, where a mean ablation rate of ∼3 nm/pulse (∼72 nJ/pulse) was observed when using the double-pulse UV-258 nm fs-laser radiation to produce the optimal mass spectrometric signal quality (Grimaudo et al., 2020). In our case, ∼360 nJ/pulse for UV-258 nm was needed to produce the optimal mass spectrometric signal quality. Accordingly, the more absorptive NiCr standard sample requires less energy for ablation in contrast to the less absorptive quartz mineral. As a first-order approximation, we can assume that the mean ablation rate is in the same order as in a previous study (Grimaudo et al., 2020), which gradually decreases during the formation of craters and likely ends with thermal ionization from side walls with even lower ablation rates.
Measurements of the mass resolution of the 28Si peaks obtained with the IR-775 nm laser are shown in Fig. 12, left panel, with a distribution of m/Δm values ranging from 10 to 500, with the better resolution within the matrix than in the microfossil-rich location. UV-387 nm and UV-258 nm laser depth profiles reveal distributions with a higher mean mass resolution. For the UV-387 nm laser, data reveal highly stable m/Δm values ∼800 at both matrix and microfossil locations. However, the extended tailing of m/Δm distribution toward lower values (Fig. 12, left panel) is a definite drawback.
In contrast, the UV-258 nm data reveal highly stable m/Δm values ∼800 in both matrix and microfossil locations, without any significant tailing. Considering that the total applied laser shot count is much higher, 500,000 versus 300,000 and 150,000 for UV-258, UV-387, and IR-775, respectively, shorter UV wavelengths have a clear advantage in the depth profiling and large-scale spectral data collection (i.e., mass spectrometric imaging). Figure 12 (right panel) depicts the distribution of the 28Si peak intensities and again demonstrates an improvement of the signal stability when using shorter laser wavelengths. Distribution of the intensities could also be observed in the depth profiles; however, stacked representation helps recognize that a UV-258 nm laser provides more stable measurements with an improved mean signal-to-noise ratio ∼104.
However, despite clearly improved ablation conditions, there are still some limitations: the spot size and accessible depth of the analysis are limited. Craters deeper than tens of μm are prone to admixing of signal from the crater walls since the laser beam is of Gaussian shape. In addition, the decay of signal intensities could be observed when the crater gets sufficiently deep (Cedeño López et al., 2018; Grimaudo et al., 2019). This aspect can be improved with an appropriate beam shaping (π-shape) and sample positioning, so that the focal position of the incident laser beam tracks the surface of the analyzed material.
Moreover, in situ characterization of the molecular composition of the microfossils would be considered beneficial. The analysis can be made with local direct laser desorption studies, as has been demonstrated before (Ligterink et al., 2020). Even though the desorption of molecules from the microfossils is out of the scope of this study, our preliminary results show that an IR wavelength might provide better performance compared with UV wavelengths. More energetic photons from the deep UV laser are expected to increase the fragmentation of the molecules, and therefore decrease the probability of detection of a parent peak within already substantially decomposed organic matter. However, more detailed studies are required to understand the performance of the different lasers in the direct desorption of kerogen molecules from the highly silicified media.
Overall, the mass spectrometric analysis conducted on the 1.88 Ga Gunflint chert sample with our LIMS instrument and integrated microscope system using three different laser wavelengths clearly demonstrated the advantage of the UV-258 nm laser wavelength over longer wavelengths for elemental analysis and depth profiling of heterogeneous samples.
5. Conclusions
In this study, we investigated the capability of our LIMS microprobe system to provide chemical depth profiles from a heterogeneous Precambrian chert sample and collected information about the chemical composition of microfossils embedded in the quartz matrix. We have discussed the generation and performance of three different femtosecond laser wavelengths: IR-775 nm, UV-387 nm, and UV-258 nm, and their relative advantages and drawbacks in the analysis of silicified geological samples. In addition, analysis of the host media was performed with the HV pulser mode.
By combined usage of optical microscopy, in situ mass spectrometry, and depth profiling, the chemical composition of microscopic inclusions within the chert could be characterized at precisely defined locations and depth positions. Chemical depth profiling is aimed to enhance the scientific output from a single position measurement and provides a pathway to highly resolved three-dimensional mapping. By tracking the 28Si mass peak resolution, intensities, and crater shapes, we identified a significant increase in the analytical performance by using shorter laser wavelengths.
Ablation with a UV-258 nm femtosecond laser revealed geometrically better defined crater morphologies, higher and more stable spectrometric mass resolution (up to 800), and almost uniform ionization of heterogeneous materials present in the depth profiles. Identification of the microfossils and the quartz matrix was performed by tracking the carbon, silicon, and oxygen ion yield in the depth profiles. Concentrations of different elements within two distinct zones and their relative change are summarized for each wavelength as atomic fractions. The main elements identified within the silica matrix are Si, O, Na, K, H, and Ca. Analysis of the chemical composition of microfossils revealed the presence of the same elements as found in the matrix plus contributions from a suite of elements specific to the fossils, namely Li, B, N, Mg, Cl, P, S, Ti, V, Mn, Fe, Cu, Ni, La, Ce, with strongly enhanced C and H.
Footnotes
Author Disclosure Statement
No competing financial interests exist.
Funding Information
P.W. acknowledges the funding from the Swiss National Science Foundation. A.N. acknowledges funding from Swedish Research Council Contract number 2017-05018. D.W. acknowledges funding from an Australian Research Council Future Fellowship, grant number FT140100321.
Abbreviations Used
Associate Editor: Russell Shapiro