
Abstract
The European Space Agency and Roscosmos' ExoMars rover mission, which is planned to land in the Oxia Planum region, will be dedicated to exobiology studies at the surface and subsurface of Mars. Oxia Planum is a clay-bearing site that has preserved evidence of long-term interaction with water during the Noachian era. Fe/Mg-rich phyllosilicates have previously been shown to occur extensively throughout the landing area. Here, we analyze data from the High Resolution Imaging Science Experiment (HiRISE) and from the Compact Reconnaissance Imaging Spectrometer for Mars (CRISM) instruments onboard NASA's Mars Reconnaissance Orbiter and the Colour and Stereo Surface Imaging System (CaSSIS) onboard ESA's Trace Gas Orbiter to characterize, at a high spatial resolution, the morphological and spectral variability of Oxia Planum's surface deposits. Two main types of bedrocks are identified within the clay-bearing, fractured unit observed throughout the landing site: (1) an orange type in HiRISE correlated with the strongest detections of secondary minerals (dominated by Fe/Mg-rich clay minerals) with, in some locations, an additional spectral absorption near 2.5 μm, suggesting the mixture with an additional mineral, plausibly carbonate or another type of clay mineral; (2) a more bluish bedrock associated with weaker detections of secondary minerals, which exhibits at certain locations a ∼1 μm broad absorption feature consistent with olivine. Coanalysis of the same terrains with the recently acquired CaSSIS images confirms the variability in the color and spectral properties of the fractured unit. Of interest for the ExoMars mission, both types of bedrocks are extensively outcropping in the Oxia Planum region, and the one corresponding to the most intense spectral signals of clay minerals (the primary scientific target) is well exposed within the landing area, including near its center.
1. Introduction
During the next decade, two in situ missions are slated to investigate for the first time Noachian terrains on Mars: the ExoMars rover “Rosalind Franklin” of ESA and Roscosmos and the Mars 2020 rover “Perseverance” of NASA. As the primary goal of the ExoMars mission is to identify potential signatures of ancient life (Vago et al., 2017), the criteria for landing site selection included the predicted presence of rocks suitable for organic matter concentration and preservation, in conjunction with engineering and safety constraints.
Oxia Planum is the site selected by ESA for the ExoMars mission.* It is a generally flat region at a low elevation (between approximately −2600 and −3100 m) located near the martian crustal dichotomy on the margin of Chryse Planitia (Fig. 1).
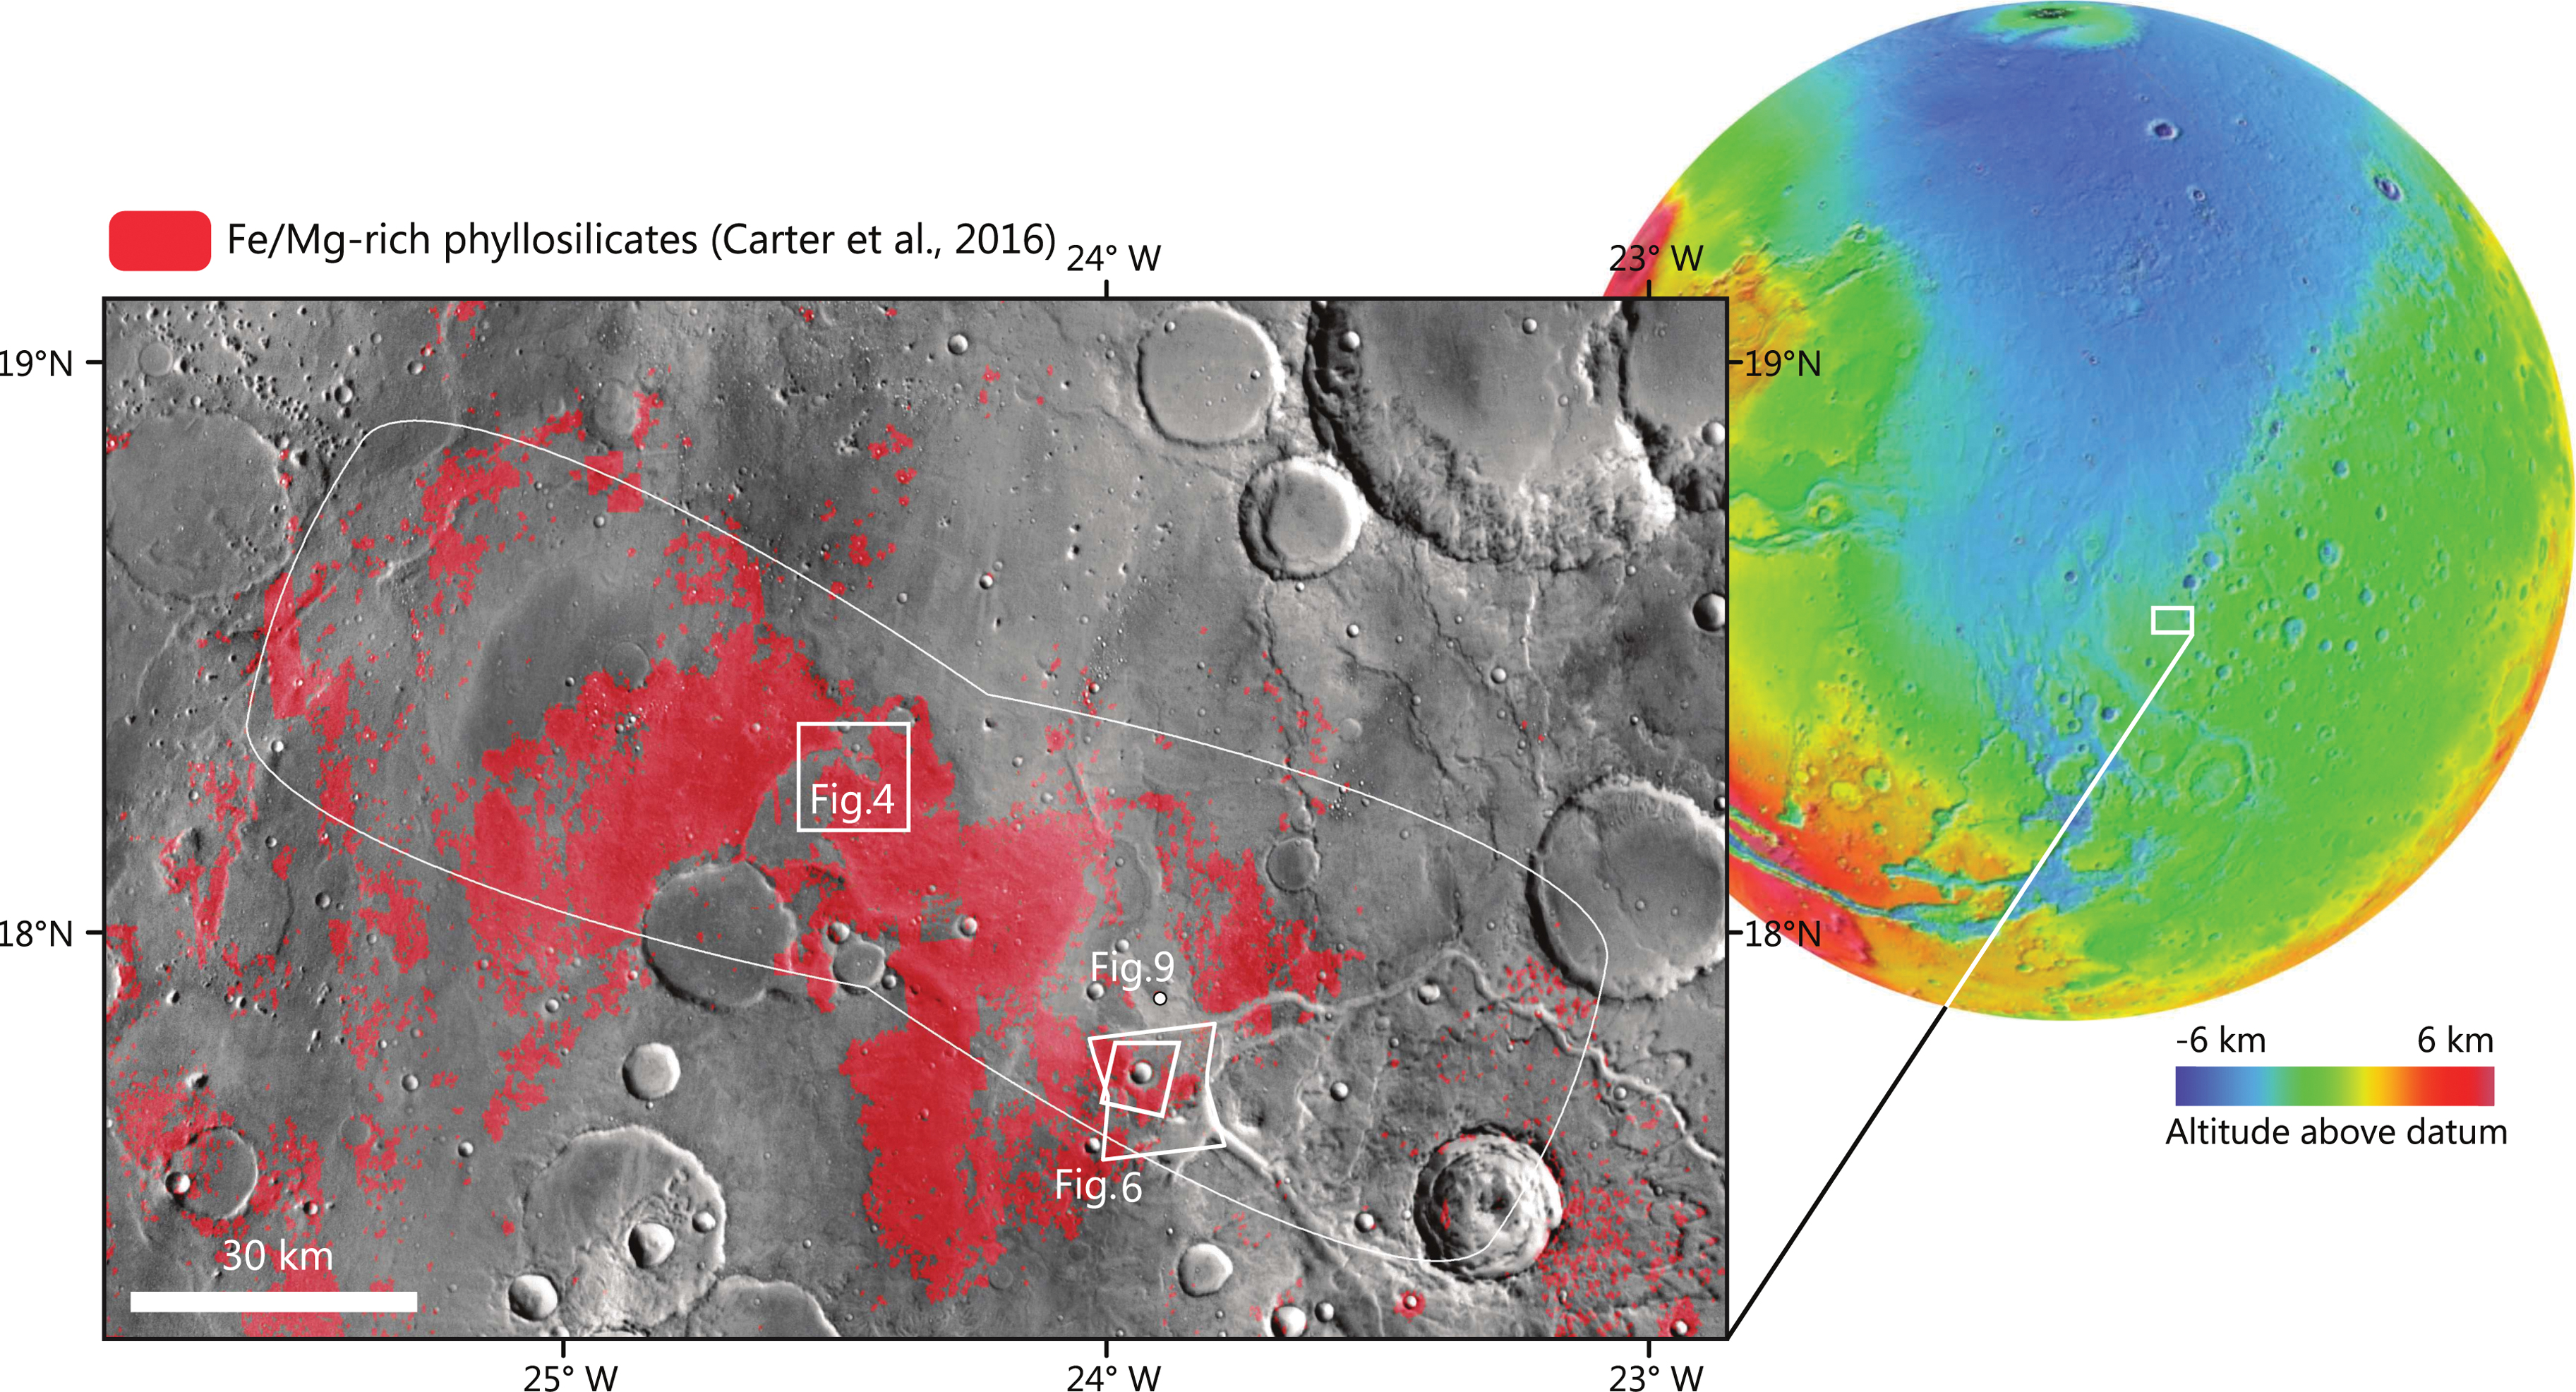
Localization of Oxia Planum on MOLA global topographic map. The close-up is a THEMIS daytime brightness temperature mosaic (Christensen et al., 2004; Edwards et al., 2011). The largest white contour corresponds to the envelope of several landing ellipses for the ExoMars rover, computed for different landing geometries. This area has been certified for landing purpose but does not correspond to the final landing ellipse, the exact size and position of which are still to be determined at the time of writing. MOLA, Mars Orbiter Laser Altimeter; THEMIS, Thermal Emission Imaging System. Color images are available online.
The site exhibits various lines of evidence for a long aqueous history during the Noachian (Carter et al., 2016; Quantin-Nataf et al., 2021). In particular, it shows an extensive (∼2500 km2) layered and fractured clay-bearing unit, potentially of sedimentary origin (Carter et al., 2016; Quantin-Nataf et al., 2021). Quantin-Nataf et al. (2021) showed that in Oxia Planum, ∼1 km of material has been deposited over a large time span, and later underwent erosion at rates higher than today, which indicates the potential for good preservation of organic matter from surface cosmic radiations. Quantin-Nataf et al. (2021) proposed that the observed fractures in the unit may have been caused by burial, which was modeled to be up to 1 km deep. The probability of landing on this clay-bearing unit is high (p > 0.6) (Carter et al., unpublished data), and the probability of landing close enough to drive to a clay exposure is even higher (p > 0.98) (Carter et al., unpublished data).
An ancient delta belonging to the fluvial system of Coogoon Valles (which was probably active during the Noachian) lies on top of the clay-bearing unit in the eastern part of the landing area (Molina et al., 2017; Quantin-Nataf et al., 2021). Another geological unit of interest is the dark resistant unit, which caps the clay-bearing unit at various locations in the landing area. This unaltered unit may be formed by lava flows or late fluvial processes (Quantin-Nataf et al., 2021). Finally, an extensive mantling deposit, plausibly of erosional origin, is covering the clay-bearing unit as well as the deltaic deposits (Quantin-Nataf et al., 2021).
Clay minerals have sheet-silicate structures, which usually behave as traps for organic matter and catalysts for complex organic reaction (e.g., Allison, 1973). Hence, the Noachian clay-bearing unit will be the primary target of the ExoMars rover for in situ geological, mineralogical, and astrobiological characterization. In this contribution, we bring new insights into the formation of this unit by characterizing its stratigraphy with visible high-resolution images and near infrared (NIR) spectral data. We also investigate the morphological and compositional variability of the unit throughout the landing area and provide new guidelines for future in situ exploration by the Rosalind Franklin rover.
2. Datasets and Processing
2.1. Hyperspectral data (CRISM products)
The mineralogy of the different members of the fractured clay-bearing unit is determined by using data from the Compact Reconnaissance Imaging Spectrometer for Mars (CRISM) imaging spectrometer in targeted mode, which produces spectral cubes at spatial resolutions of ∼20 and ∼40 m/pixel (Murchie et al., 2007; 2009). We use data acquired in the NIR spectral range between ∼1.0 and ∼2.6 μm, as this range includes most of the absorptions that allow for the identification of minerals on Mars (Bibring et al., 2005; Ehlmann et al., 2011; Carter et al., 2013). The spectral cubes are processed with the MarsSI application (Quantin-Nataf et al., 2018; available at
To guide our spectral analysis, we compute the spectral index maps that correspond to spectral features of various minerals. Of interest for this study are a Fe/Mg-rich phyllosilicate index and an olivine index. The Fe/Mg-rich phyllosilicate parameter (“Hydr-FeMg-clay_index”) is the one used in the work of Loizeau et al. (2018). It is computed based on the combination of the ∼1.4, ∼1.9, ∼2.3, and ∼2.4 μm band depths of Fe/Mg-rich clay minerals if the ∼2.3 and ∼1.4 or ∼1.9 μm band depths are positive. The olivine parameter is the one used in the work of Mandon et al. (2020); it mainly relies on the ∼1 μm band depth and checks for any convexity of the spectrum around ∼1.3 to 1.4 μm, which is typical of olivine-bearing material (Hunt and Salisbury, 1970).
Many of the available CRISM targeted data of Oxia Planum were acquired recently (Supplementary Fig. S1) and are hence of lesser quality because of the aging of the instrument (Supplementary Fig. S2). In addition, analysis of Oxia Planum site suffers from the lack of recent and high-resolution CRISM data coverage in the NIR range due to the retirement of the infrared (IR) detector in 2018. Therefore, we performed a coanalysis of existing CRISM coverage with High Resolution Imaging Science Experiment (HiRISE) color data, in a method similar to the correlation between the High Resolution Stereo Camera (HRSC) color imagery and the Observatoire pour la Minéralogie, l'Eau, les Glaces et l'Activité (OMEGA) spectral dataset obtained over the Mawrth Vallis region in the work of Loizeau et al. (2010).
2.2. HiRISE color products
The HiRISE camera produces the spatially best resolved images of the martian surface, with a spatial scale ranging from 25 to 60 cm/pixel (McEwen et al., 2007, 2010). The camera carries 14 charge-coupled devices (CCD) that are filtered for different visible wavelength ranges, with three sets of two-CCD overlap for color coverage down the middle of the image. Ten CCDs have a broad “RED” filter applied to them, which covers wavelengths ranging from 550 to 850 nm (McEwen et al., 2007). The RED CCDs produce a full grayscale image with the image swath usually between 5 and 6 km in width, depending on the spacecraft's altitude. In addition to the RED bandpass, the false-color combination is achieved through the BG (Blue-Green) and NIR filters applied to two CCDs each, and overlap with the fifth and sixth RED CCD. The BG and NIR filters cover wavelengths ranging from ∼400 to ∼600 nm and from ∼800 to ∼1050 nm, respectively (McEwen et al., 2007). The color composition products of the three NIR, RED, and BG bands cover ∼20% of the RED swath, yielding a 1–1.2 km color swath. In Oxia Planum, full HiRISE coverage in the RED bandpass has been achieved in the 2020 certified landing area (Quantin-Nataf et al., 2021). Only ∼25% of the area is covered by color data. However, these are evenly distributed throughout the landing site (Supplementary Fig. S1), allowing investigation of compositional changes at local and regional scales. While the HiRISE color products cannot replace hyperspectral data as a means of inferring the surface mineralogy, they highlight color differences that can be correlated with spectral datasets and used to track variations in the broadly ferrous (Fe2+) and ferric (Fe3+) bearing composition of the martian surface at submeter scale (McEwen et al., 2007; Delamere et al., 2010; Loizeau et al., 2010). As the camera acquires images at the same photometric angle between the different bands, there is no variation of color arising from differences in the observation geometry (McEwen et al., 2007). Instead, the effects that may introduce color variation within the same image and that are not resulting from a change in the surface composition may be attributed to illumination effects (e.g., slope; see Supplementary Fig. S3), surface roughness variations, and disparity of dust cover. An additional bias is the atmospheric condition, especially the presence of dust aerosols, which can greatly contribute to the variation of color between two HiRISE images, because of the high ferric iron oxide content of the martian dust (Fernando et al., 2017).
We use HiRISE NIR-RED-BG color products to map exposures of the clay-bearing fractured unit at high resolution and to assess its variability by using high-resolution morphology/texture (e.g., the size of polygonal fracturing) and color criteria. Strongly illuminated slopes and shadows that may induce color variations in the images are easily identifiable and are not mapped.
2.3. CaSSIS color products
The Colour and Stereo Surface Imaging System (CaSSIS) is a visible/near infrared (VNIR) camera onboard ESA's Trace Gas Orbiter (TGO) that is able to produce ∼4 m/pixel images in up to four color bands (Thomas et al., 2017). In addition, CaSSIS is a stereo camera: it was designed to acquire almost simultaneously two images of the surface during a single orbital pass, as a means to produce Digital Elevation Models (DEMs; see Section 2.4) by stereo restitution.
CaSSIS bands cover a similar wavelength range (from ∼400 to ∼1050 nm) to that of HiRISE, though the wavelength range covered by HiRISE's NIR band (>800 nm) is split between two narrower NIR bands: CaSSIS “RED” and “NIR” bands (∼790 to 883 nm and above ∼880 nm, respectively) (Thomas et al., 2017). In contrast to HiRISE, CaSSIS is equipped with a single hybrid CMOS detector operating in a push-frame mode, overlain by bandpass filters to provide color (Thomas et al., 2017). The signal-to-noise ratios (SNRs) at the top of the atmosphere for each band when imaging an average dark surface are as follows: PAN has ∼220, RED/NIR ∼140, and BLU ∼90 to 100 (Thomas et al., 2017). Because of the non-Sun synchronous orbit of TGO, these values can vary greatly depending upon the time of the martian day at the imaged site. The dust content of the atmosphere and the topographic features of the imaged surface also influence the SNR. CaSSIS acquires images at various photometric angles; the impact on band contrast is expected to be relatively small, especially at low-phase angles (e.g., Beck et al., 2012). The images provided by CaSSIS are of a lower spatial resolution than HiRISE (∼4 m/pixel vs. 0.25 m/pixel) and can only resolve the largest fractures at Oxia Planum; however, CaSSIS is able to provide more spatially extended color coverage (Supplementary Fig. S1) and more information on color variability when using all four bands. In contrast to the narrow, ∼1.2 km width of HiRISE color data, CaSSIS can image with a swath width up to ∼9 km in three of CaSSIS's color bands and with a narrower ∼7.4 km swath if all four colors are used simultaneously. This makes CaSSIS useful for augmenting the existing limited coverage of Oxia Planum provided by HiRISE images, both in terms of spectral coverage (resulting from the extra NIR band) and areal coverage. The addition of the extra color band over what is available to HiRISE also allows an improved differentiation of ferric- and ferrous-rich materials through the band ratioing (BR) technique, where the output from one color band is divided by the output from another on a pixel-by-pixel basis (Tornabene et al., 2017). The ability of this method to distinguish between ferric- and ferrous-bearing materials was demonstrated in detail in the work of Tornabene et al. (2017), showing that band ratios aid in the separation of these two surface components, for example, RED/PAN and PAN/BLU for ferric and PAN/NIR for ferrous, allowing for a color band ratio composite (CBRC) image to be produced to readily highlight the potential presence of these two groups. It should be noted that band ratios may be effective at eliminating the illumination and slope effects mentioned in the previous section, thereby extending our ability to map the color/spectrally distinct units and subunits herein.
Because of the influence of atmospheric dust scattering, the apparent ferric- and ferrous-bearing content determined with CaSSIS data, can be dramatically different from the actual content (Wolff et al., 2009; Fernando et al., 2017). Because martian dust contains high amounts of ferric iron, the impact on the estimated concentration of ferrous-bearing units (i.e., those with a high mafic mineral content such as olivine and pyroxene) is heavily modified by high dust optical depths (Fernando et al., 2017). To mitigate atmospheric scattering effects, we apply a Dark Object Subtraction (DOS) method (e.g., Chavez, 1988), which assumes that the darkest pixels within an image should have a high probability of having digital numbers (DNs) of 0 in the absence of atmospheric scattering. By determining the DN for the darkest pixels in the scene and then subtracting their values from the entire image, the influence of the atmospheric effects can be mitigated. However, it is a correction applied to the entire image, while atmospheric opacity may not be uniform. Hence, it is only a first-order correction (Chavez, 1988). Unfortunately, this method is most effective for VNIR images with an estimated dust optical depth of <1.0 (estimated at 900 nm) (see Wolff et al., 2009). The CaSSIS images that cover the various geological units described in the following sections have estimated dust optical depths >1.0 as they were acquired shortly after the great martian dust storm of 2018.
In this study, CaSSIS is used to acquire point spectra for the fractured unit, both to determine how the band values vary across the unit and whether these spectra match the expected mineralogy given by the analysis of this unit when using CRISM. Initially, by using identified exposures of the fractured unit from HiRISE, each exposure is mapped out within the CaSSIS images by comparison with overlapping HiRISE images based on the color and morphological criteria highlighted previously. Spectra are created from the CaSSIS bands from the DOS-corrected images and compared with relevant mineral spectra convolved down to the wavelengths of the CaSSIS bands, selected based on the CRISM spectral analysis. Qualitative comparisons when using the band ratioed images are also made with CRISM spectral maps to determine whether the fractured units correlate with ferric/ferrous signatures within the CaSSIS imagery and hydrated mineralogy (e.g., Fe/Mg phyllosilicates) in CRISM. Most of the images on the landing site were taken with BLU and PAN for both images, with RED/NIR being taken alternately in the stereo pairs. For this reason, only products derived from three bands of CaSSIS can currently be used. In this work, CaSSIS spectra and CBRC image examples are shown by using the BLU, PAN, and NIR bands.
During the review stage of the publication process, a discrepancy in the absolute calibration of the CaSSIS instrument was discovered. The team is currently in the process of making additional star-calibration images to rectify the issue, but these observations will not be possible until 2021. The current assessment is that relative calibration within one filter is excellent, but that the absolute values of the BLU and NIR filters may be incorrect at the 10% level. As such, while CaSSIS band ratios are still effective for presenting spectral variations between ferric- and ferrous-bearing materials within the scene, the CaSSIS spectra are not likely to match up well with both CRISM and laboratory-measured spectra. Despite these issues, and the fact that the CaSSIS coverage in Oxia Planum suffers from high atmospheric dust opacities, the CaSSIS band ratios appear to correlate with, and highlight very well, both ferric- and ferrous-bearing components in the scene (see Section 3). Therefore, the CaSSIS-based results are not deemed to have a significant impact on, nor contradict the results and interpretations based on other datasets presented herein, including the conclusions drawn from this work.
2.4. Digital elevation models
To estimate the thickness of the deposits and obtain the global topography of the region, we use the DEMs mosaic of Quantin-Nataf et al. (2021) that was computed at a scale of ∼10 m/pixel using imagery from the Context Camera (Malin et al., 2007; a new DEM workflow for the MarsSI platform and DEM/orthoimage mosaics of Oxia Planum will be detailed by Volat et al., unpublished data). In this mosaic, the individual DEMs were generated by using the Ames Stereo Pipeline (Beyer et al., 2018) and aligned on the blended HRSC/Mars Orbiter Laser Altimeter (MOLA) topography (Fergason et al., 2018) in the MarsSI application (Quantin-Nataf et al., 2018).
3. Results
3.1. Stratigraphy of the clay-bearing unit
The clay-bearing unit of Oxia Planum consists of a light-toned, layered, and extensively fractured unit ∼50 m thick, with the resolved strata at a submeter scale (Quantin-Nataf et al., 2021). The base of the clay-bearing unit has not yet been observed. However, some large crater ejecta do not exhibit any signature of clay minerals as they might excavate a nonhydrous basement; hence, the clay-bearing unit might not extend to depths larger than several hundreds of meters (Quantin-Nataf et al., 2021). Hereafter, this unit is referred to as “clay-bearing unit” or “fractured unit.”
At high resolution, in both HiRISE and CaSSIS color products, the clay-bearing unit exhibits textural and color variations. In HiRISE false-color images, the fractured and bright material has hues ranging from yellow to blue. In the eastern part of the ellipse, the variation of color clearly corresponds to different stratigraphic levels within the clay-bearing unit, as seen through erosional windows or crater walls: the lowest levels correspond to a subunit characterized by meter- to decameter-sized polygons and a warm hue in HiRISE, varying from yellow, orange, to red (Fig. 2 and Supplementary Fig. S4). On top of this subunit lies a second one, ∼10 to 20 m in thickness and characterized by decameter-sized polygons and a blue hue in HiRISE color infrared products (Fig. 2 and Supplementary Fig. S4). Small polygons are concentrated in the lower subunit at the transition from orange to blue color (Fig. 2b). The correlation between color and polygon size and the consistency of the stratigraphic relationship between the orange and blue terrains make it unlikely that variations of dust cover (which usually appears yellow to tan in HiRISE color products) (Delamere et al., 2010) are responsible for the observed difference of color in HiRISE images. There is a possibility that dust would accumulate differently on the surface based on variable fracture patterns and cause the change of color. Indeed, larger polygons and hence lower fracture densities are observed on blue terrains compared with orange terrains, showing that for the same area there may be less dust related to fractures on blue terrains (see Fig. 2c, d, compared with Fig. 2e). However, as described in the next section, the orange terrains are associated with strong clay spectral signatures, which are normally impeded in the presence of dust cover. All of the above imply that the variation of the hue of the fractured unit is unlikely caused by dust. Apart from illuminated slopes that usually appear yellow, no correlation between the slope and the color variation of the clay-bearing bedrock was observed. At lower elevation (∼300–400 m below the eastern region of the ellipse), in the center and western part of the landing area, the fractured rocks exhibit less textural and color variation within the area of a HiRISE image than in the eastern part. At HiRISE scale, polygons are also typically less clearly defined in the central and western part of the landing area (Fig. 2j, k). No contact between the type of terrains with clear red and blue bedrock alternation (i.e., in the East) and the terrains of the center and western landing site is observed.
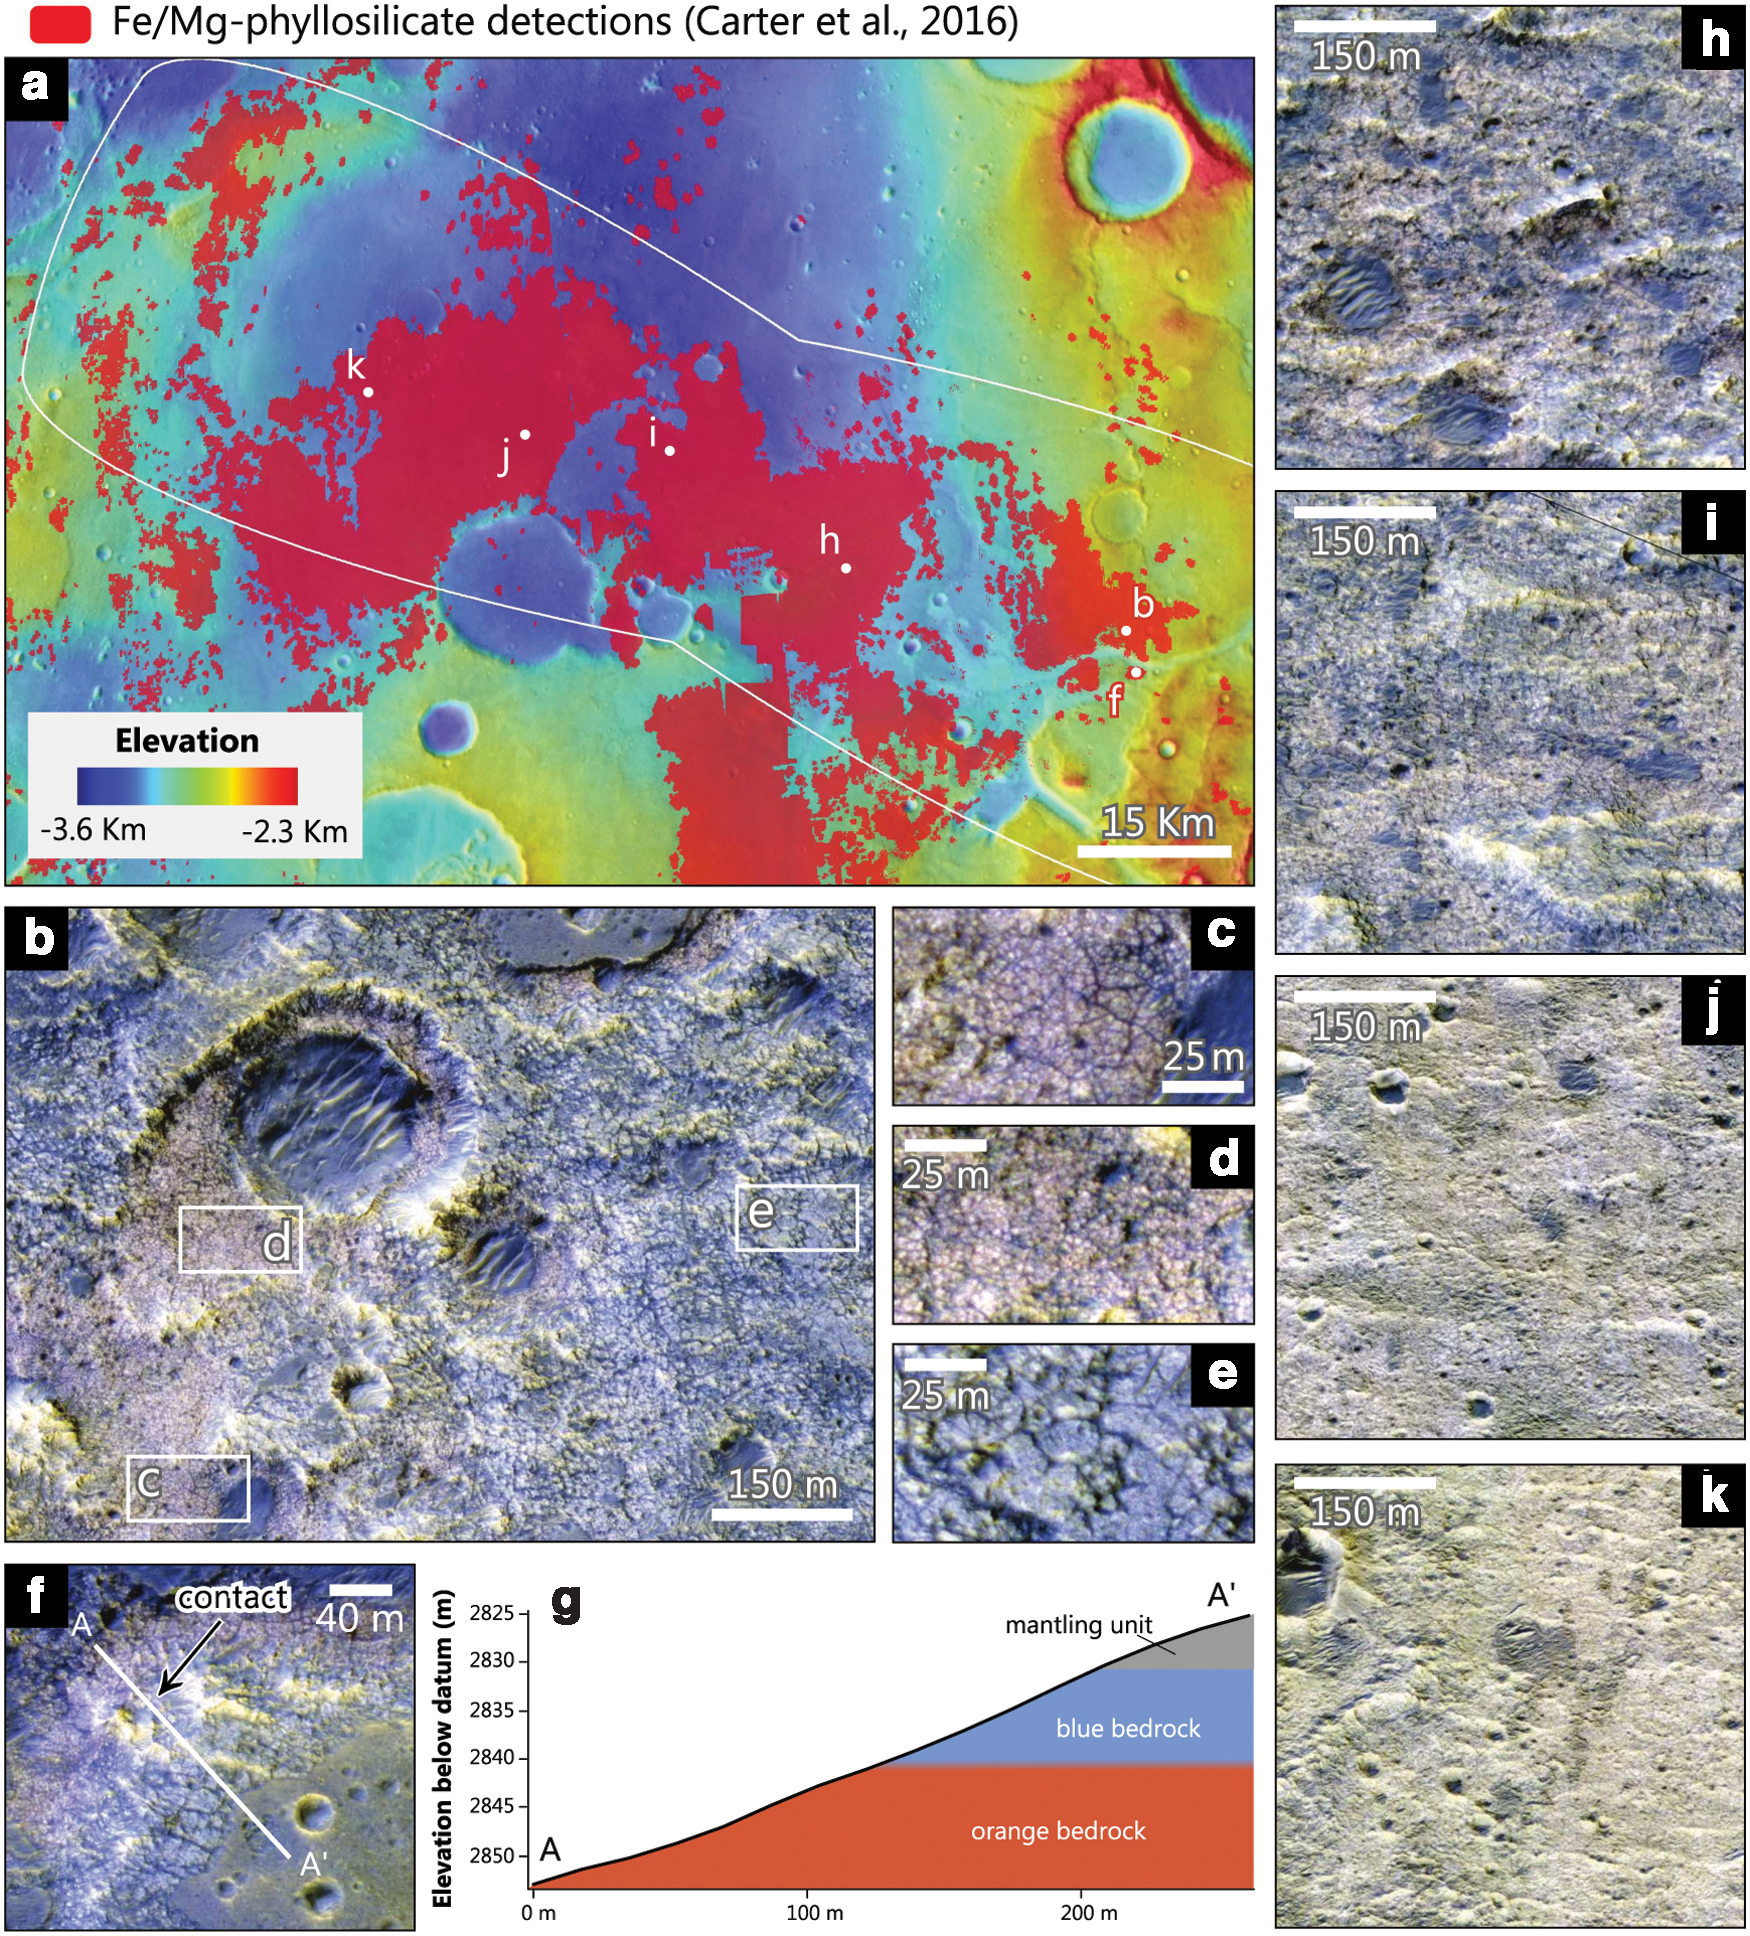
High-resolution images showing textural and color variations, as well as stratigraphic relationships within the fractured clay-bearing unit.
We mapped ∼2000 outcrops of the clay-bearing fractured unit as seen on HiRISE color images and reported their colors. The results are presented in Fig. 3. We found that outcrops of the light-toned fractured unit are widely distributed in the landing area, to a greater extent than previously estimated when using the spectral map indicative of clay-bearing material (Carter et al., 2016). The northern/northeastern part of the landing site, in particular, is extensively covered by the thin mantling unit described in the work of Quantin-Nataf et al. (2021), but the fractured unit is visible at high resolution, exposed in many places between these deposits (Fig. 3b). There, it is mainly the bluish rocks we can observe on HiRISE. We note that there is no clay signature in that region in the map produced by Carter et al. (2016). Outcrops located within the Fe/Mg-rich clay spectral detections of Carter et al. (2016) are associated with at least the presence of orange bedrock, and outcrops located outside of these detections are more often associated with blue bedrock alone (Fig. 3a). Outcrops of the different types of bedrocks are extensive throughout the landing area, with the two types often coexisting at the kilometer scale. Both types of bedrocks are observed at similar elevation ranges, from ∼3.2 to ∼2.7 km below datum, with the blue type being restricted to a slightly wider range (Fig. 3c). The contact between the two types is variable and also observed from approximately −3.2 km to approximately −2.7 km.
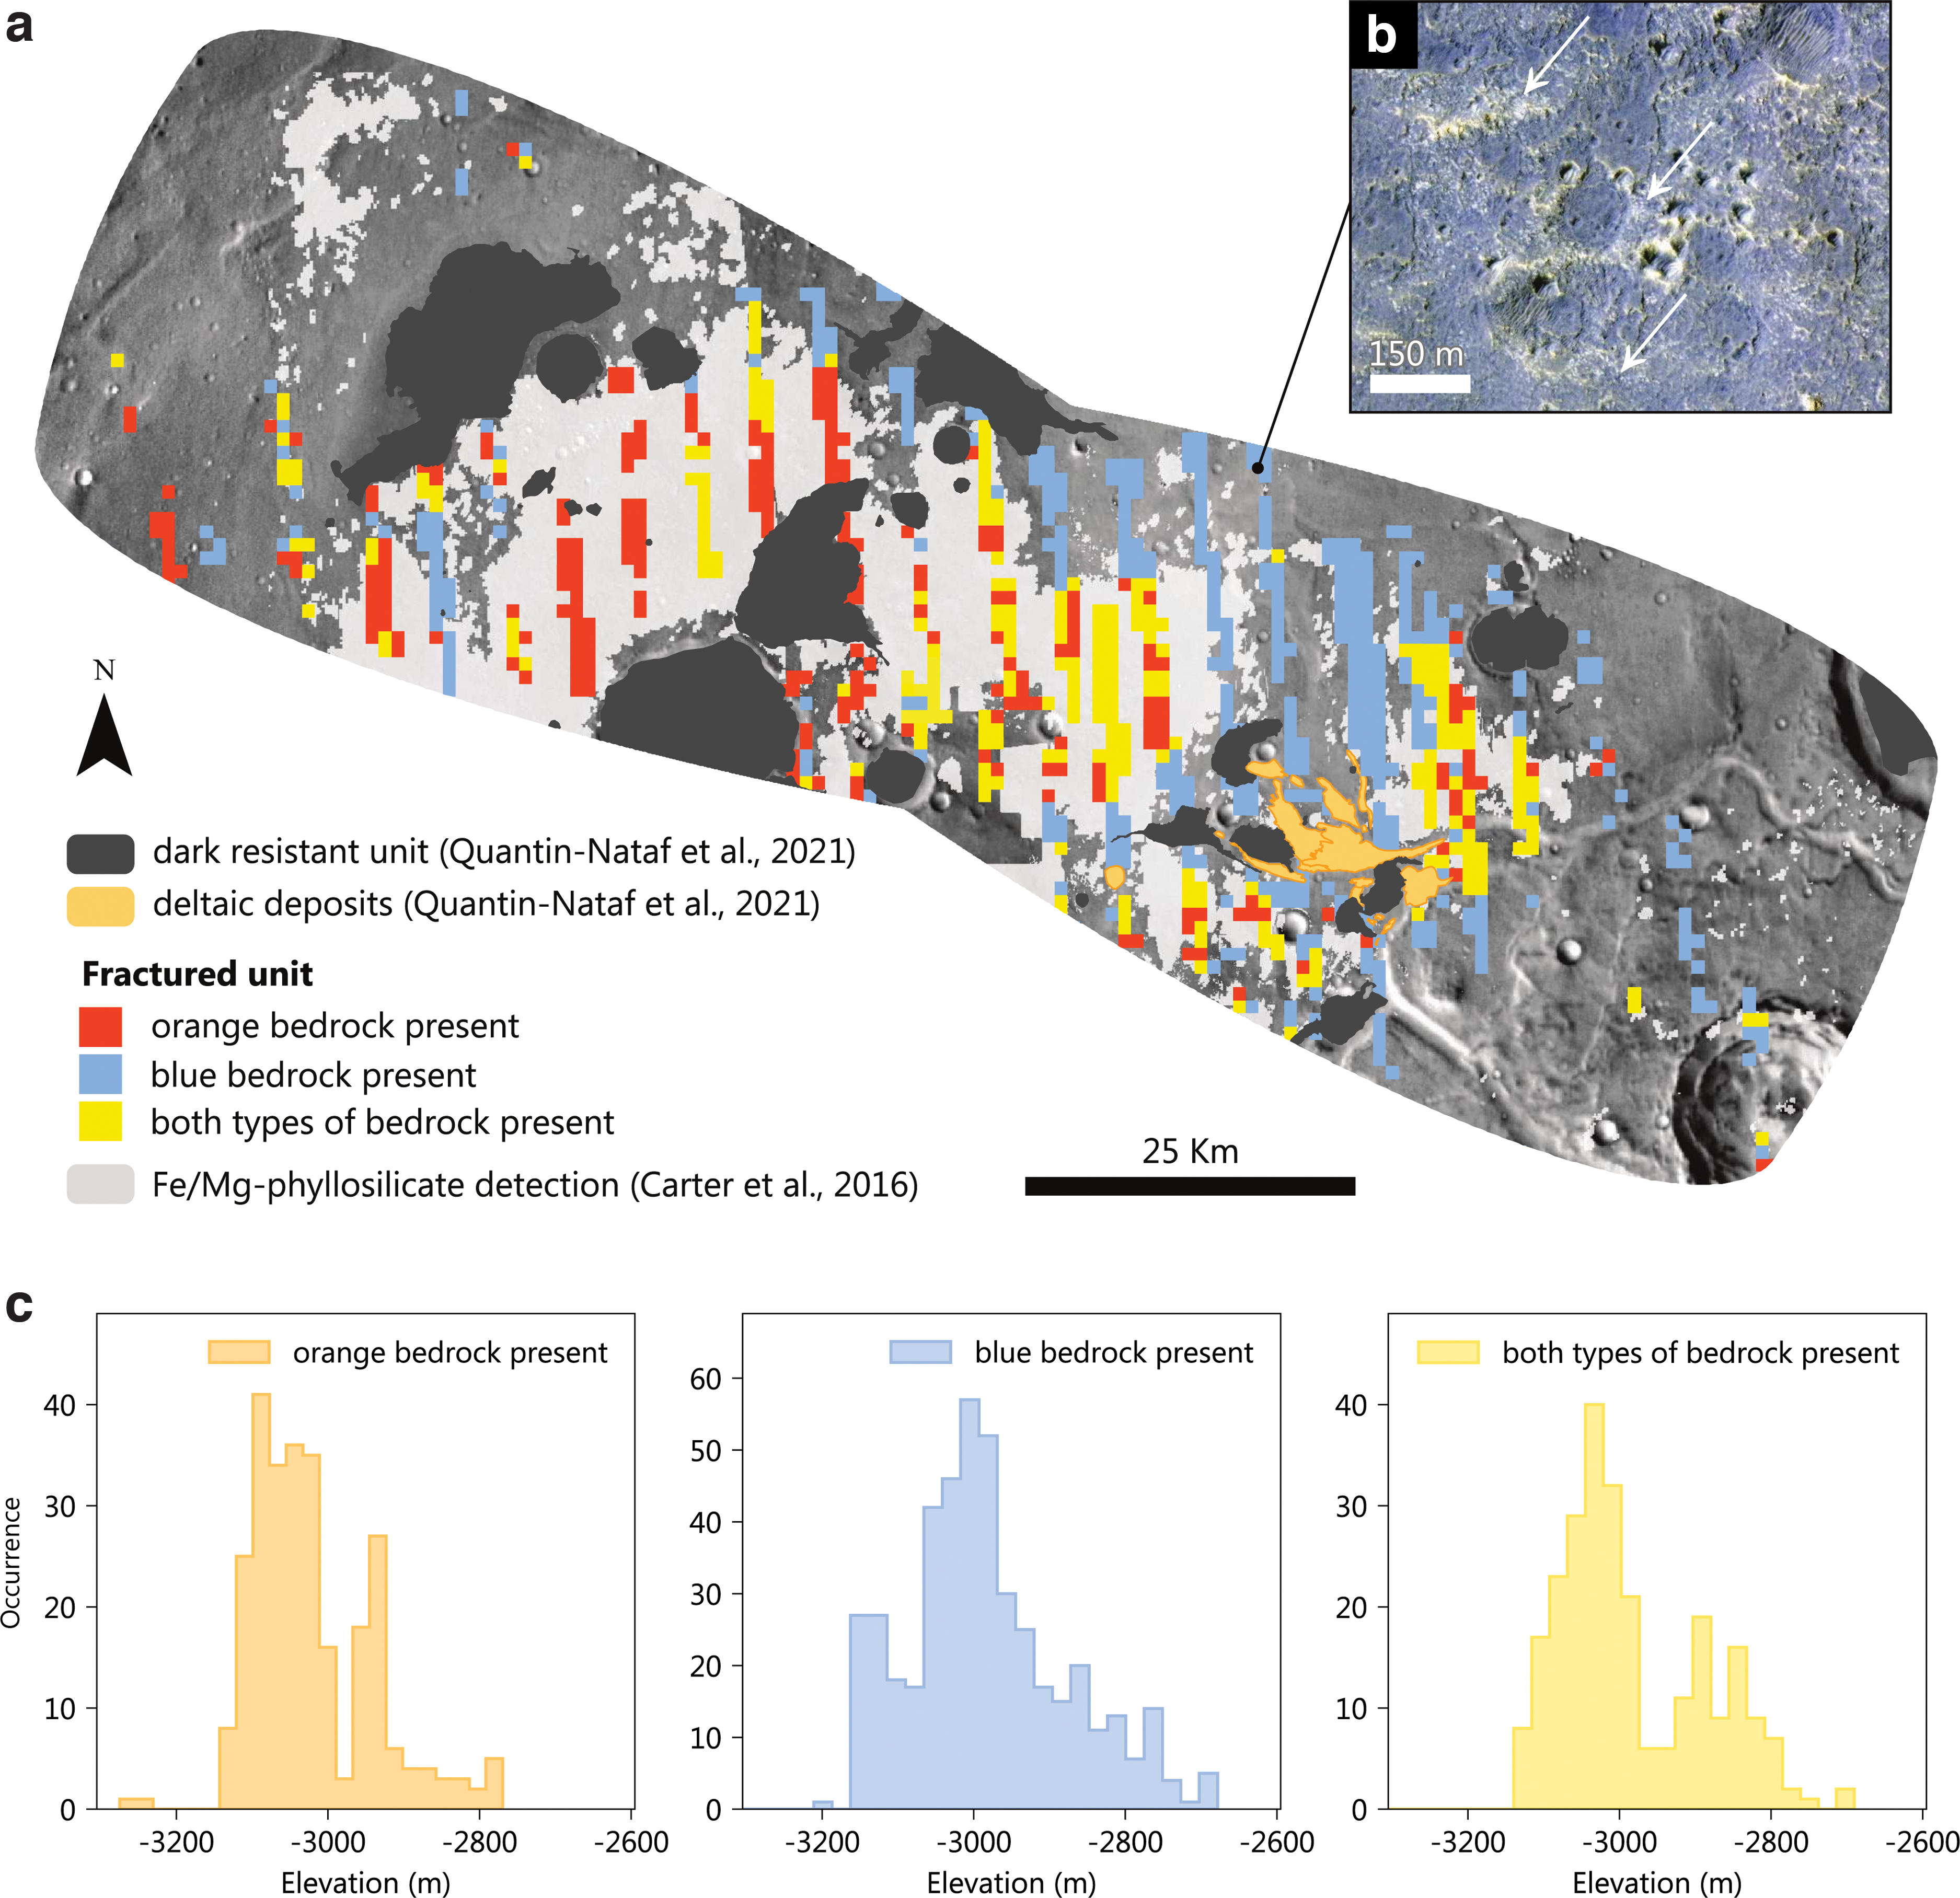
In CaSSIS NIR-PAN-BLU images, a variation of color from orange to blue is also observed. Although the wavelength ranges covered by CaSSIS bands are different from HiRISE's (see Section 2), the orange terrains in CaSSIS images usually correlate with the presence of the terrains of the same hue in HiRISE NIR-RED-BG images. However, CaSSIS blue hue corresponds to diverse types of terrains, from darkest blue to lightest: the dark resistant unit and crater ejecta, the fractured unit bedrocks that are densely covered by materials of the mantling unit, and the terrains that appear blue on HiRISE (Fig. 4).
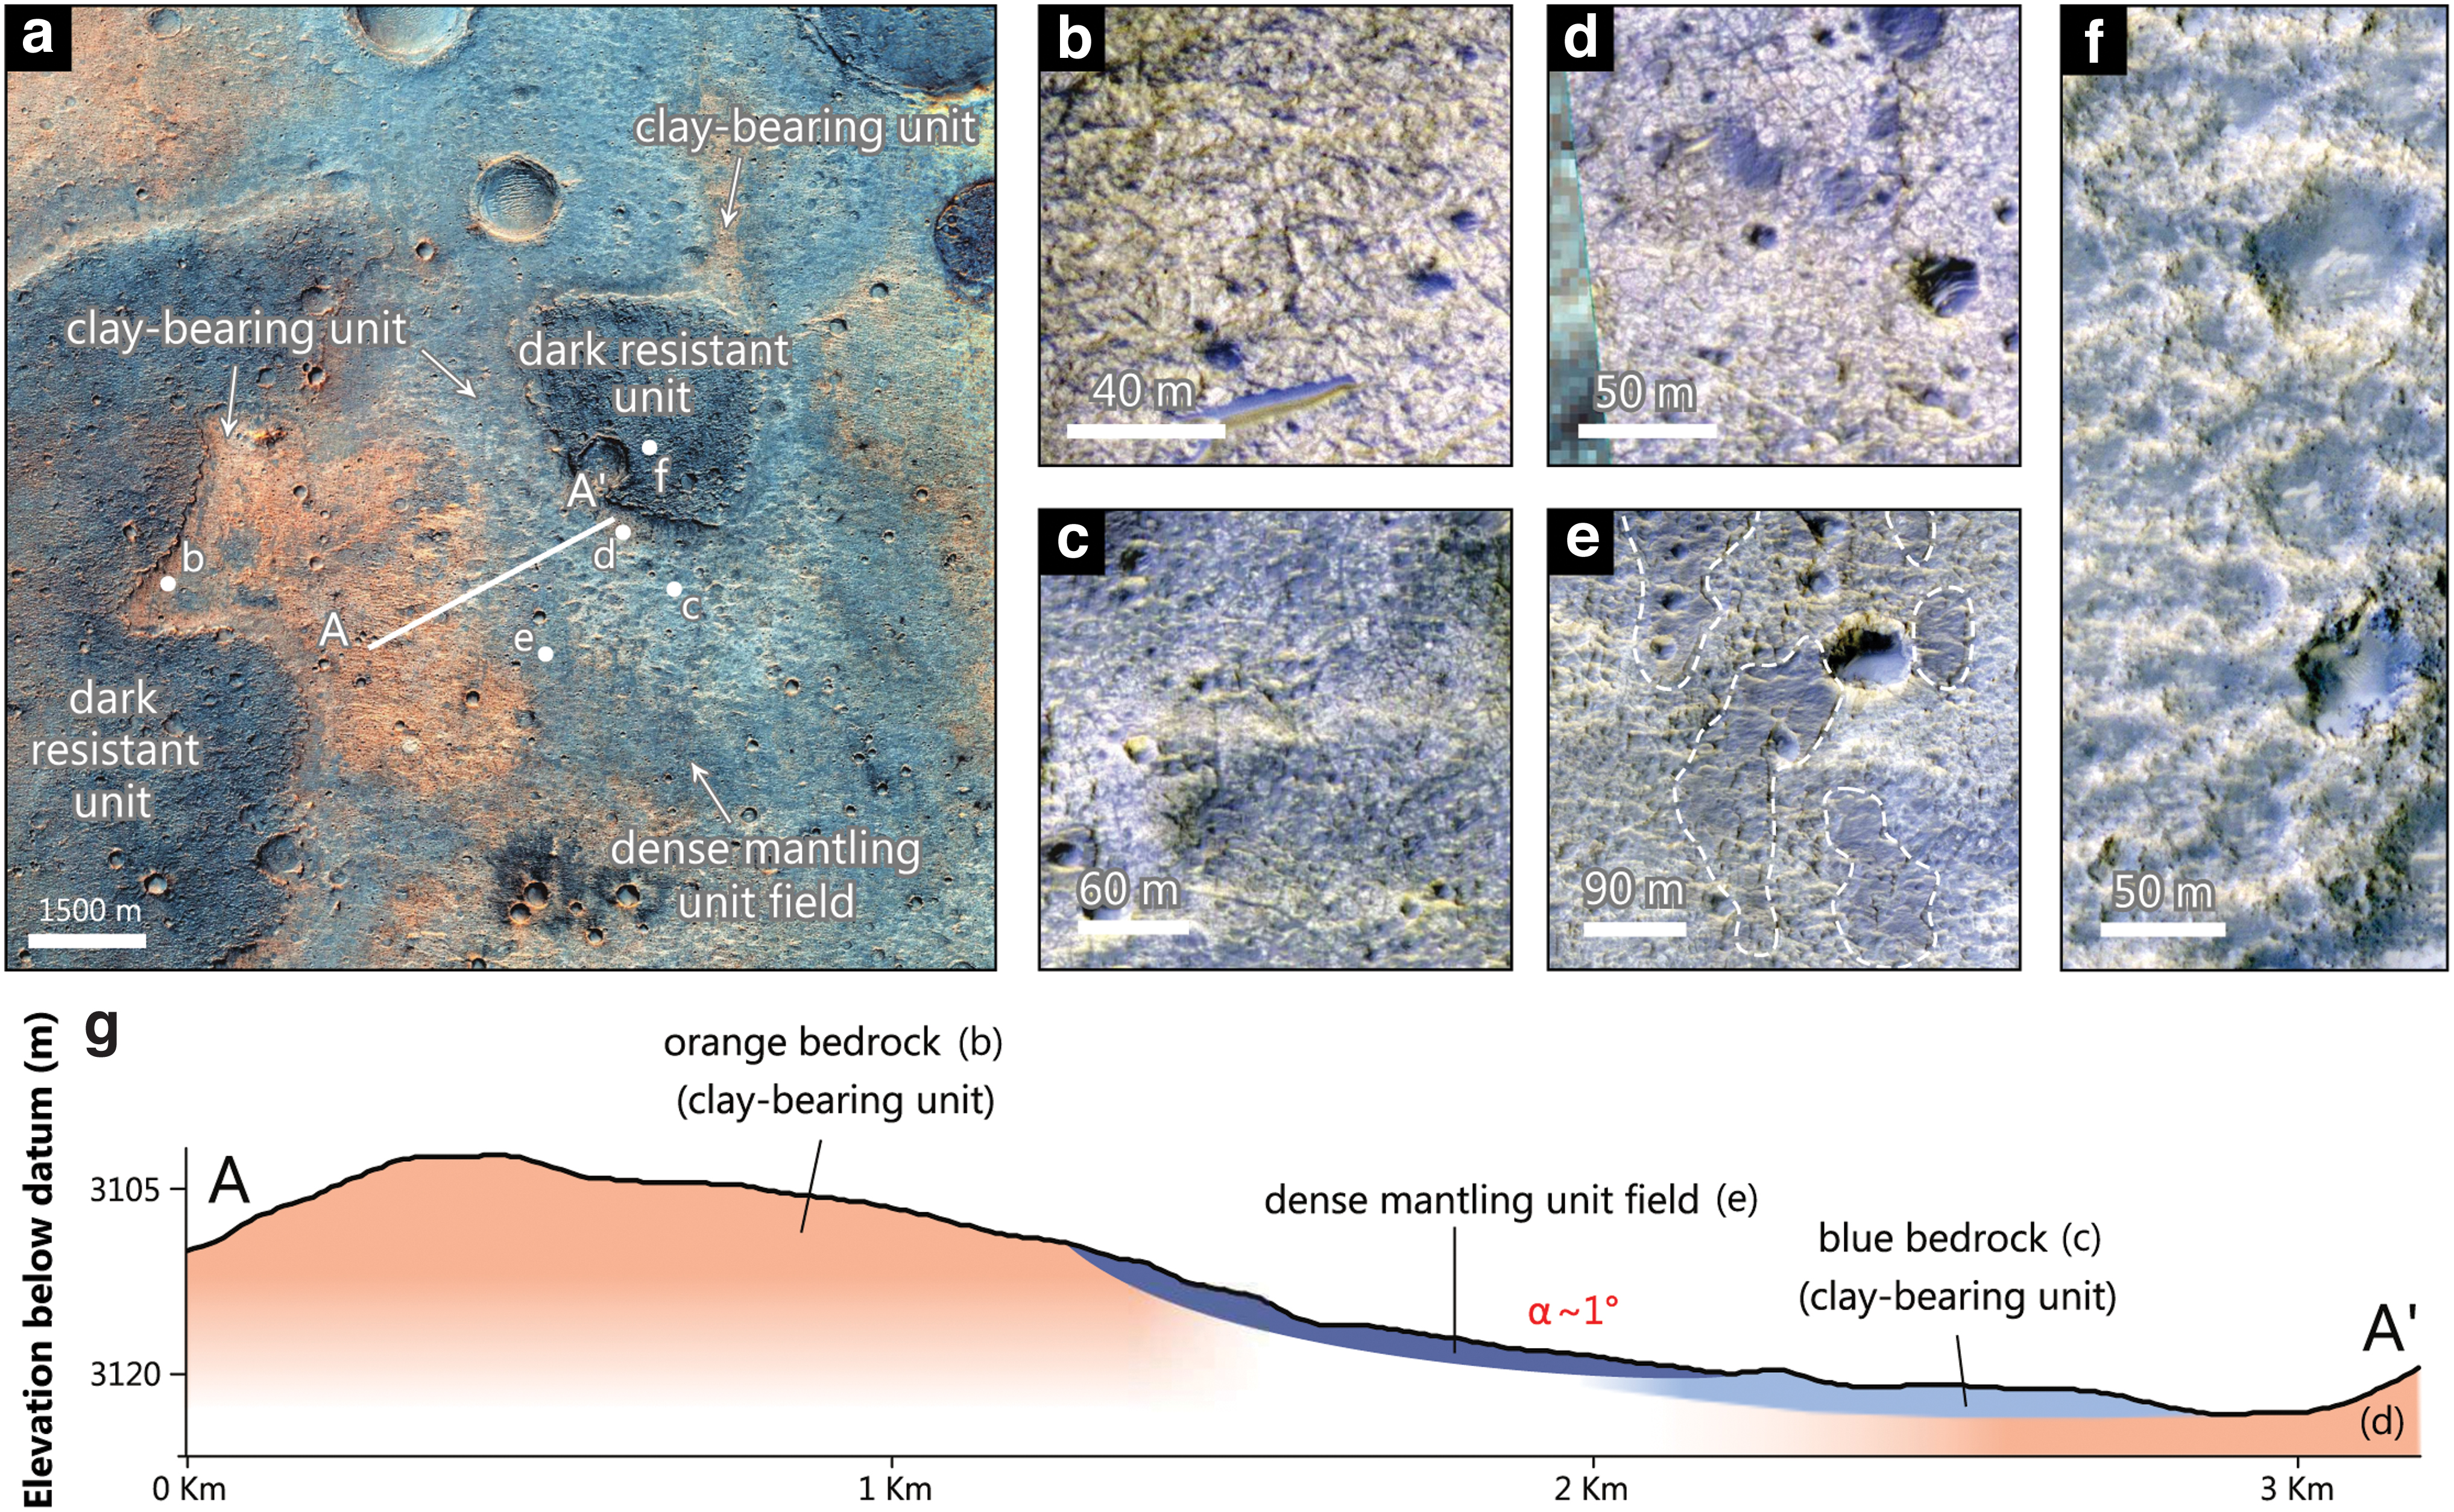
Color and textural variation of the clay-bearing unit near the center of the ExoMars landing area.
In summary, HiRISE and CaSSIS images reveal that the fractured unit at Oxia Planum is not homogeneous at the meter scale and exhibits morphological variability, which might be investigated in situ by the ExoMars rover.
3.2. Spectral diversity of the clay-bearing unit
CRISM spectra of the clay-bearing unit at various locations of the landing area exhibit absorptions at 1.41 μm (associated with O–H bond), 1.92 μm (associated with H–O–H bond), 2.30 μm, and a weak absorption at 2.40 μm (associated with Fe–OH and Mg–OH bonds) (Carter et al., 2016) (Fig. 5). The overall shape of the spectrum in the NIR range, as well as the positions of the absorption bands, are consistent with material bearing Fe/Mg-rich clay minerals (Carter et al., 2016). The closest matches are vermiculite, a phyllosilicate phase with a structure intermediate between mica and smectite, and Fe-bearing saponite, a Mg-rich smectite (Carter et al., 2016) (Fig. 5). The clay mineral detected probably has a Fe3+/Fe2+/Mg composition slightly different from the vermiculite and saponite samples whose spectra are shown in Fig. 5, as the 2.3 μm absorption band (sensitive to Fe2+, Fe3+, and Mg) is slightly shifted to longer wavelengths compared with the vermiculite spectrum shown and to shorter wavelengths compared with the saponite spectrum. There is however some variability observed on Earth in these two species, where variable Fe2+/Fe3+ concentrations influence the 2.3 μm band center and the spectral slope at 1–1.7 μm. The absorption bands related to phyllosilicate are generally stronger in the orange type of bedrock identified in HiRISE imagery than the rest of the fractured bedrocks (Fig. 5).


CRISM detections of mineral and spectral features discussed in this article, overlain on a THEMIS daytime imagery mosaic (Christensen et al., 2004; Edwards et al., 2011) and a CTX DEM mosaic (a new DEM workflow for the MarsSI platform and DEM/orthoimage mosaics of Oxia Planum will be detailed by Volat et al., unpublished data). CRISM footprints and ExoMars landing area are outlined in white polygons. Capitalized IDs correspond to the location of spectra extraction shown in Figs. 5, 7, and 8. Color images are available online.
The ferric-rich mineral detections within the CaSSIS CBRC images correlate very well qualitatively with the clay-bearing unit within the CRISM imagery (Fig. 6), showing that CaSSIS can identify the clay-bearing unit. While the ratioing method should mitigate illumination effects, we note that some of the non-clay-bearing illuminated slopes register as ferric in the CBRC imagery (Supplementary Fig. S6). The ferric component detected by CaSSIS might be caused by the presence of iron oxides, or a mixing of ferric (absorption band at 2.28 μm) and magnesium-rich (absorption band at 2.32 μm) clay minerals, which could account for both the detection of ferric phases by CaSSIS and an absorption band at 2.30 μm.
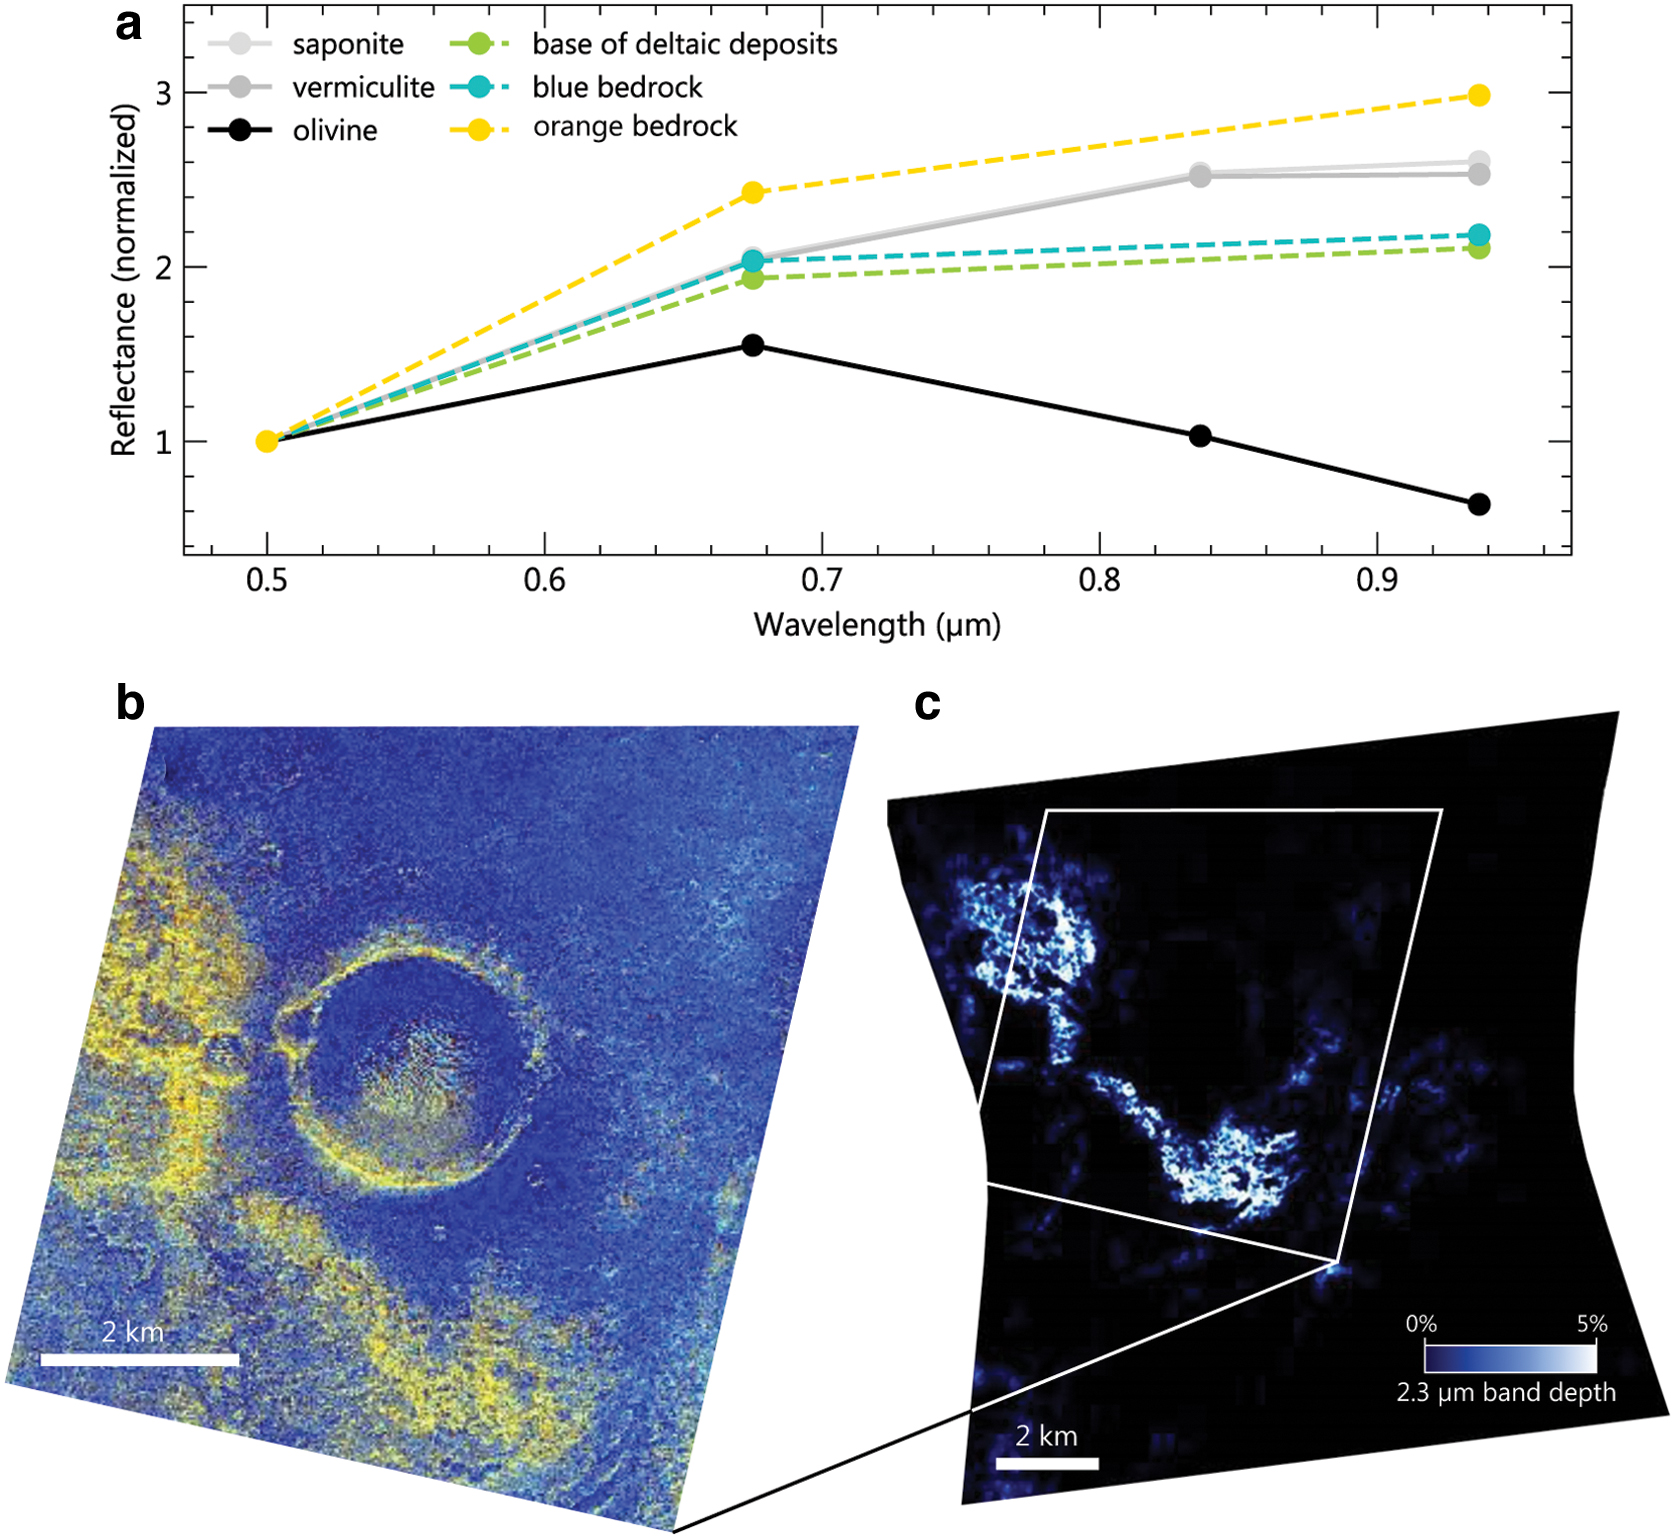
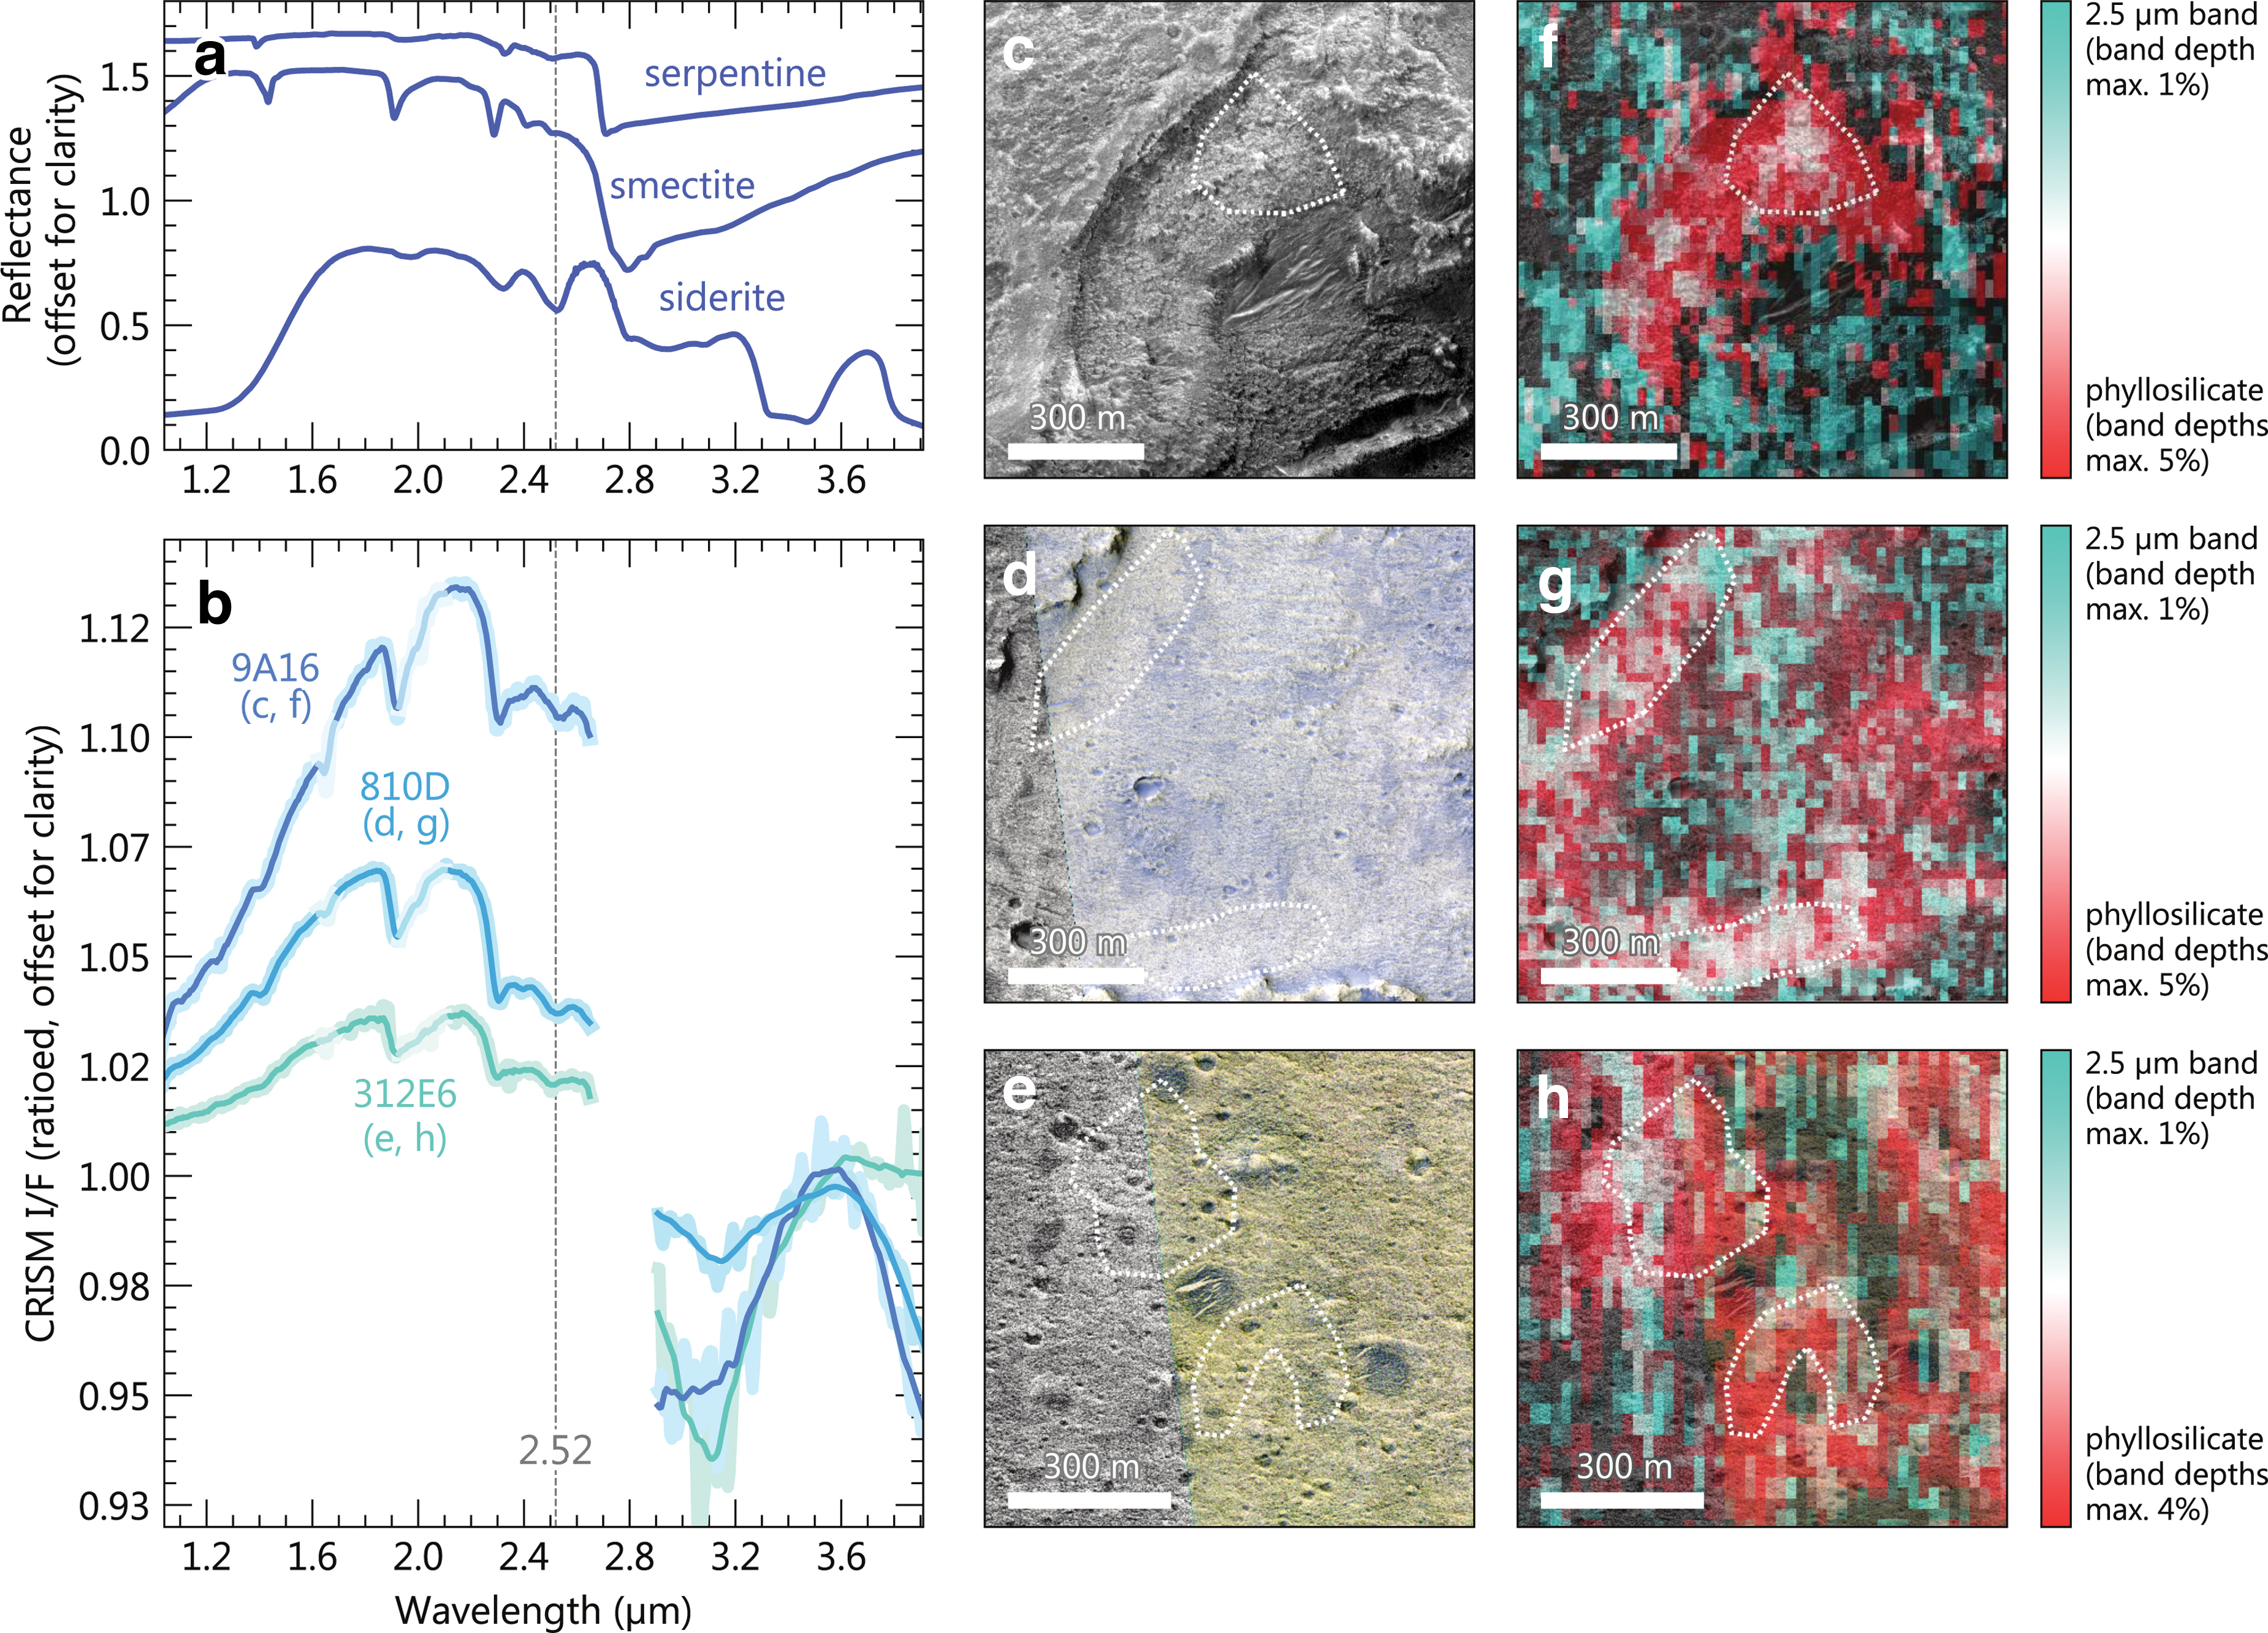
The position of the narrow absorption bands related to Fe/Mg-rich phyllosilicates does not strongly vary throughout the entire landing area, meaning that the clay mineralogy is regionally homogeneous at the site. However, we observed the mixing of this dominant phyllosilicate species with other minerals: - at various locations where the Fe/Mg-rich phyllosilicate signal is strong, the absorption bands of phyllosilicates are associated with an absorption at 2.52 μm (Fig. 7), which can either correspond to vibrational modes of the carbonate ion of a Fe/Mg carbonate or the combination tone of metal–OH bend and OH stretch of an additional phyllosilicate phase (e.g., serpentine, chlorite, or smectite). Carbonates are usually identified with the paired C–O fundamental absorptions at ∼3.4 and ∼3.8 μm (for a review on the various absorptions caused by minerals, see Bishop et al., 2019). In the CRISM spectra, a significant decrease of the reflected light after ∼3.6 μm is observed, making the presence of carbonate minerals more possible than those of an additional phyllosilicate phase (Fig. 7). Only a very subtle absorption at ∼3.4 μm is observed; however, carbonates mixed with hydrous phases (here, the clay minerals) have usually subdued bands at these wavelengths as a result of overprinting by the 3 μm H–O–H absorption band (Ehlmann et al., 2008). The 3–4 μm spectral region in CRISM lacks a thermal correction and suffers from a lower SNR compared with the 1–2.6 μm range commonly used for mineral identification on Mars, hence preventing a definitive identification of the mineral(s) causing this 2.5 μm absorption feature, based on CRISM data solely. Most of the 2.5 μm absorption feature detections in CRISM are associated with a strong spectral signal of clay mineral. We cannot exclude that the phase responsible for this 2.5 μm absorption is widespread in the whole clay-bearing unit but is detectable only over the “freshest” outcrops. - At some locations in the eastern part of the study area, the clay-bearing unit spectra are associated with a broad absorption between 1 and 1.8 μm, in addition to the two narrow absorption bands at 1.92 and 2.30 μm of Fe/Mg-rich phyllosilicates described previously. The wide band between 1 and 1.8 μm is consistent with the presence of olivine in mixture with clay minerals (Fig. 8). The width of this absorption band is a result of either fayalitic (Fe-rich) olivine or large grains of forsteritic (Mg-rich) olivine (King and Ridley, 1987). The reddening of the spectrum between ∼1.4 and 1.8 μm might also be explained by the presence of another iron-rich phase different from olivine, such as a ferroan clay mineral (Bishop et al., 2008); however, olivine is more likely to produce the convex downward shape observed at ∼1.4 μm than a clay mineral. Fe-bearing carbonates (e.g., siderite) can also reproduce the spectra observed, with a wide absorption band between 1 and 1.8 μm and a narrow absorption at ∼2.3 μm. However, at some rare locations, we observe a gradual decrease and disappearance of the 2.3 μm band in CRISM spectra over the fractured unit (Fig. 9c), which is in favor of a mixing with olivine instead of siderite. Beneath the deltaic deposits, a clear olivine signal is associated with weak signatures of phyllosilicate (Fig. 9). At this location, the relative absorption band depths of phyllosilicate over those of olivine seem to increase toward the base of the local stratigraphy, with an associated increase of the absolute reflectance values. Here, the thickness of the fractured layer corresponding to the strong olivine signal is ∼10 m. We report all the detections of olivine over the clay-bearing unit with CRISM data in Fig. 10. They occur at low elevation at the outlet of fluvial channels and are associated with the blue type of fractured bedrock identified with HiRISE color images. However, the blue fractured bedrocks in the center and western landing area do not exhibit the spectral signature of olivine in the available CRISM dataset.
Based on a simple comparison with laboratory spectra resampled to the bandpasses of CaSSIS, CaSSIS image-derived spectra of the orange type fractured bedrock identified in HiRISE imagery are consistent with Fe/Mg-rich clay minerals detected by CRISM, and the spectra of the blue type fractured bedrock have higher BLU-to-NIR ratio, closer to olivine (Fig. 6a). See Supplementary Fig. 7 for examples of CaSSIS CBRC values. The top of the olivine-bearing layer beneath the deltaic deposits has nearly identical spectra to those of the other blue type of fractured bedrock within the image, with slightly lower I/F in the NIR band (Fig. 6a). Yet, in contrast with the results from CRISM, the dip in the NIR band for the CaSSIS data is smaller than what would be expected for olivine. Also, we observed very little difference between this olivine-bearing layer and the blue type of fractured bedrock identified with HiRISE within the CBRC CaSSIS image. The very high atmospheric opacity (>1.0) when the image was taken may have inhibited our ability to differentiate these units, where the enhanced dust opacity leads to an increase in I/F in the IR wavelengths and effectively masks the presence of ferrous-bearing minerals, including olivine, as discussed earlier (Fernando et al., 2017). At the time of the submission of this article, there are no images available of the delta, which were taken at a low atmospheric opacity (<1.0) and with all four color CaSSIS filters.

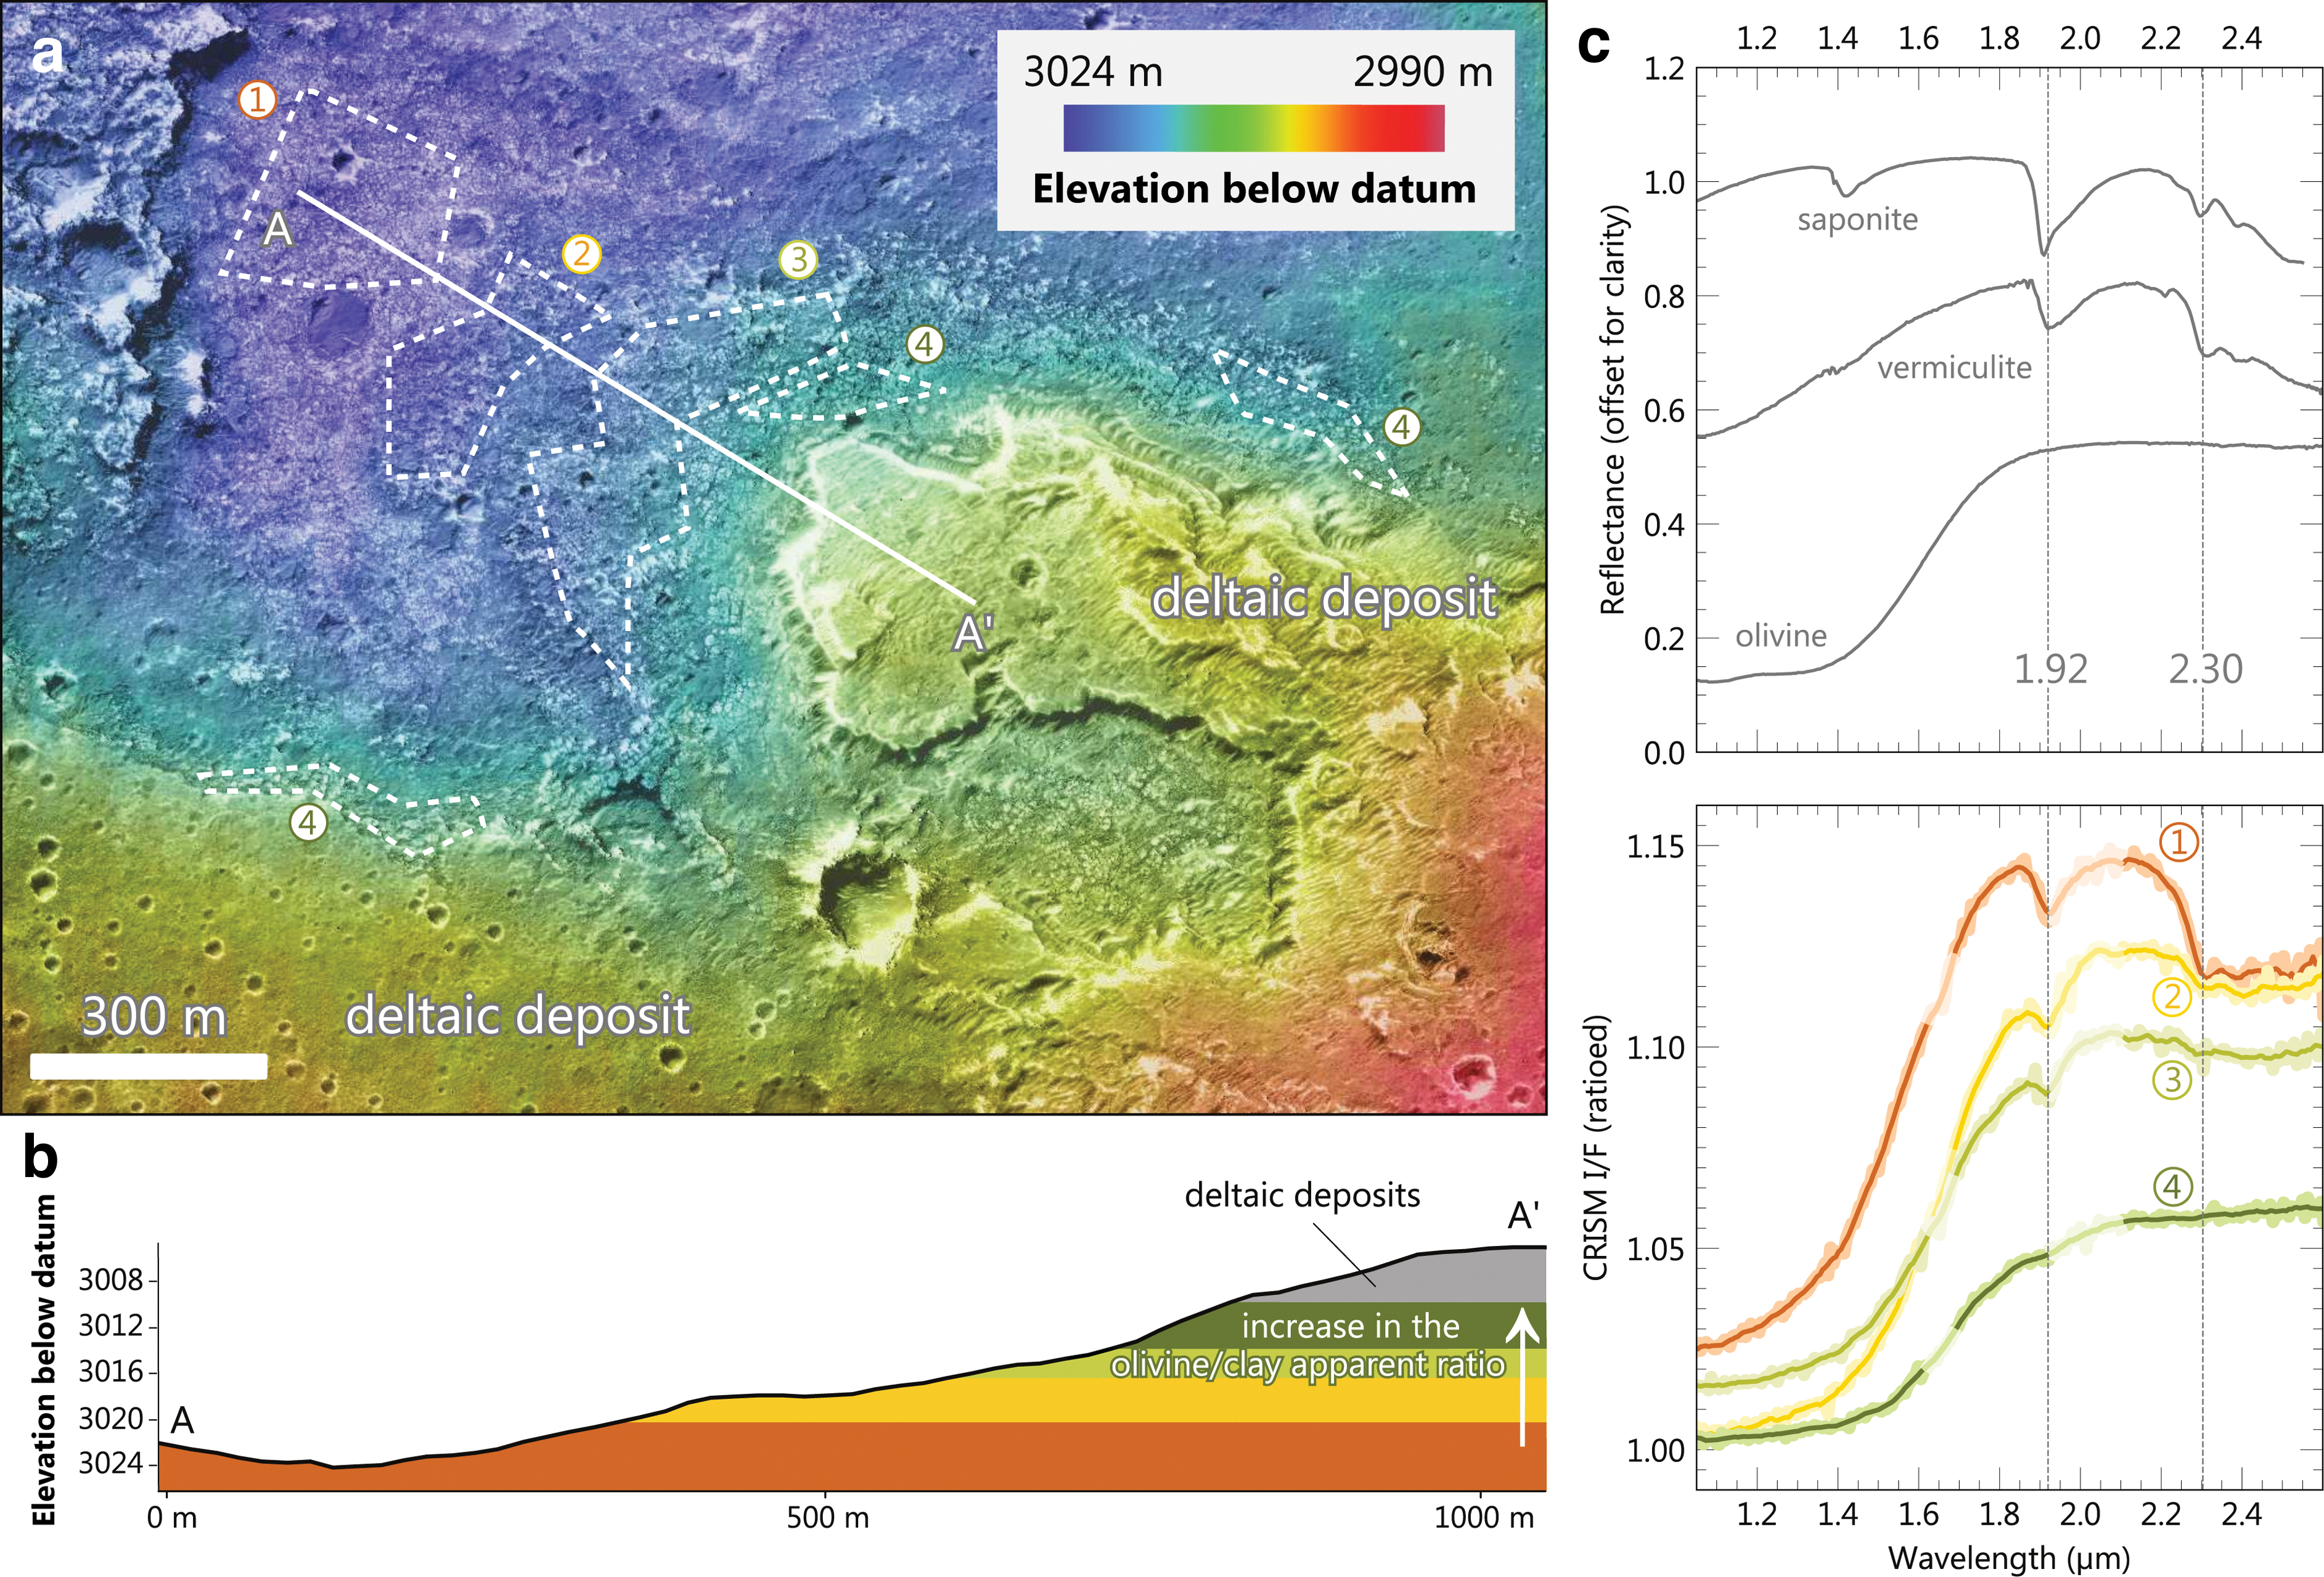
Variation of olivine and clay mineral signature below the deltaic deposits.
4. Discussion
4.1. Interpretation of the fractured unit stratigraphy
From HiRISE and CaSSIS imagery, the stratigraphy can be interpreted in two different ways, whether the heterogeneity of bedrock color reflects differences in the bedrock composition.
4.1.1. Hypothesis 1: color variations represent differences in the bedrock composition
If variations of composition are responsible for the disparity of color in HiRISE datasets, the clay-bearing unit of Oxia Planum is composed of a stack of at least two morphologically distinct subunits, a relatively more orange one and a relatively more blue one (Fig. 11a). The contact between the two subunits is roughly following the current topography, a gentle slope northwestward, as both types of bedrocks often coexist at the kilometer scale throughout the entire landing area (Fig. 3). From CRISM data, most of the exposed stratigraphy consists of hydrous clay-bearing material, while the composition of the top of the fractured unit is in agreement with a spectral mixture between olivine and clay minerals in the eastern parts of the landing site. The terrains that exhibit the strongest signatures of clay minerals appear orange in HiRISE and CaSSIS images, while the terrains that exhibit spectral mixing of olivine and clay appear blue, especially in the eastern part of the landing area. This is in agreement with the usual interpretation of HiRISE and CaSSIS colors, where orange terrains consist of ferric materials and blue terrains ferrous materials (Delamere et al., 2010; Tornabene et al., 2017). The spectral signature may be due to an actual compositional mixture of clay minerals and olivine in the bulk rock mineralogy of the blue bedrock. In that case, the fractured unit would be composed of clay-bearing deposits with varying relative proportions of igneous and alteration minerals (Fig. 11a). As we are observing a diffuse contact between both subunits at various elevations (Figs. 2a and 3), it may indicate that the two subunits are conformably draping a pre-existing topography.

It is challenging to understand the fact that the contact between the two types of bedrocks is observed at several different places and elevations throughout the tens of kilometers of the landing area, despite the high exhumation estimates (Quantin-Nataf et al., 2021). The dark resistant unit, which is today under erosion and might have been more extensive, could have capped and helped preserve this contact. An alternative interpretation is the presence of distinct layers with an orange or blue hue, which alternate repeatedly throughout the clay-bearing unit stratigraphy. It may explain why we observe the contact between the two color types at very distinct elevations in Oxia Planum (Fig. 3c). But so far, no contact with the orange bedrock lying on top of a blue bedrock has been observed in HiRISE images.
4.1.2. Hypothesis 2: color variations are decorrelated with the bedrock composition
Here, the various colors do not represent specific subunits in the stratigraphy but rather highlight varying degrees of exposure of the clay-bearing unit (Fig. 11b). As the orange type of bedrock identified in HiRISE imagery often exhibits denser fracture networks than the blue type, it might currently be more prone to physical erosion and would correspond to the most recently exposed and dust-free outcrops, hence explaining the strong phyllosilicate signal detected at these locations. The bluish deposits would be more resistant to erosion and so more frequently forming cap rocks. However, surfaces covered by dust usually appear red to yellow in HiRISE NIR-RED-BG composites, which is the opposite in this scenario.
There might also be a spatial mixing with olivine-bearing sand concentrating in the fractures of clay-bearing rocks, causing the difference of spectra signature between the two types of bedrocks. As the red and blue rocks exhibit different fracture sizes, they might not be covered equally by sand. In that case, the lower and upper stratigraphy of the clay-bearing unit may actually have the same bedrock composition, with sufficient olivine-bearing sand filling the fractures in the upper parts to be detected from orbit. Given the CRISM spatial resolution limitation at this scale of observation, it is challenging to rule out this hypothesis based on spectral data alone. However, we do not favor a spatial mixing due to olivine-bearing sand, as no olivine was detected in the orange terrains, which usually have higher fracture density than the blue terrains that exhibit signatures of olivine. No unit that could be the primary source of any olivine-bearing sand (e.g., a picritic volcanic unit) was observed. In addition, olivine is clearly detected in association with a small impact crater ejecta (Fig. 8g), showing that it was initially present within the impacted layers.
4.2. Implications for the formation scenarios
The scenarios for the emplacement mechanism of the clay-bearing, layered unit parent deposit proposed by Quantin-Nataf et al. (2021) and Carter et al. (2016) can be subdivided into two main categories:
subaqueous: sediments deposited in a palustrine, lacustrine, or marine environment;
subaerial/surficial: volcanic (lava), airborne volcaniclastics, impactoclastic, or other aeolian deposits.
In the subaqueous scenario, it is challenging to infer if the origin of the clay minerals was authigenic (i.e., formed during sediment deposition) or detrital (i.e., formed in the source region and later transported). In the subaerial/surficial scenario, pedogenesis or groundwater alteration is the most probable scenario to explain the presence of the Fe/Mg-rich clay minerals in the bedrock, since the following scenarios are not favored (Carter et al., 2016):
- shallow hydrothermal alteration was not favored because of the large elevation range of the deposits, and their observed layering and thickness;
- glacial melting was not favored either, since no glacial feature was observed and given the fact that the precipitation of secondary minerals in this low-water/rock ratio setting might not yield mineral abundances detectable from the orbit;
- finally, deep burial/metamorphism was also not favored because of the large elevation range, the sedimentary texture and the layering observed.
If there is no, or poor diversity of mineralogical composition in the clay-bearing unit's bedrock over the various exposed layers of the stratigraphy (stratigraphic hypothesis 2), this geological unit might record stable environmental conditions over time. Weathering by pedogenesis is more likely to produce a vertical variation of the mineralogy in the scale of meters to decameters (e.g., Gaudin et al., 2011). In the stratigraphic hypothesis 2, Oxia Planum clays are homogeneous over tens of meters of the stratigraphy, making the pedogenesis less likely than the groundwater alteration or subaqueous sedimentation scenarios.
Assuming the variations in color and spectral signature reflect variations in the bulk mineralogy (stratigraphic hypothesis 1, favored), we may be observing a continuous transition between the lowest visible parts of the clay-bearing unit that are enriched in secondary minerals, and the top of the unit that presents a more pristine, mafic mineralogy. Since this change in mineralogy is diffuse, the stratigraphic column records a gradual and continuous change of conditions during the deposition and/or alteration of these materials.
If the clay-bearing unit was formed by material sedimentation in a subaqueous environment, the material is either authigenic (i.e., formed in place after the deposition of material or by direct precipitation if the ionic activity is sufficient), or inherited from the highlands drained by the Coogoon Valles system (Fig. 12a). In the authigenic scenario, clay minerals are neoformed in the system. The addition of mafic minerals on top of the stratigraphy requires the input of igneous materials (lava flow or ash deposit) potentially linked to some regional volcanic activity (Fig. 12a). In the detrital scenario, a decrease in the input of altered materials compared with pristine ones is required, as the source watershed might have lacked altered products over time (Fig. 12a). Since olivine can be easily altered in water over geological timescales (Stopar et al., 2006), the presence of detrital olivine would suggest that the water availability and the overprint of diagenesis have been limited during the latest aqueous phases, at least locally. The limited water availability may be due to a climatic condition where the water–rock reaction was kinetically inhibited, or that olivine was injected and buried rapidly enough to remain unaltered in depth. Olivine is detected in the basin at the outlet of the deltaic system as well as further north in another topographic depression. In a subaqueous sedimentary scenario, the olivine-bearing terrains might record a low-water level of the standing body of water, before rapid burying and further fracturing of the whole clay-bearing unit.

Different formation and evolution scenarios for the clay-bearing unit of Oxia Planum, which could explain the distribution of altered and nonaltered phases in the stratigraphic profile, assuming color variations are correlated with the bedrock composition (stratigraphic hypothesis 1).
In the scenario of pedogenetic alteration, secondary minerals concentrate toward the top of the alteration profile. On Mars, pedogenic profiles are usually interpreted when Al-rich phyllosilicates are observed on top of Fe/Mg-rich phyllosilicates, as Al cations are less mobile than Mg and Fe (e.g., Loizeau et al., 2007; Bishop et al., 2008; Carter et al., 2015). In Oxia Planum, no extensive layer enriched in Al-rich clay minerals was observed on top of the stratigraphy. This implies that in case of a pedogenesis alteration scenario, the intensity of leaching was moderate, or that any corresponding layer was removed by erosion. The change of mineralogy observed in the fractured unit of Oxia Planum—in particular, the abundance of olivine at the top of the profile—would record a decline in the surface weathering rate (considering a continuous supply of olivine to the surface) or an increase in the deposition rate of the volcanic, impactoclastic, or sedimentary deposits over time. The early deposits would have been partially altered into secondary minerals through pedogenesis alteration, while later deposits would have preserved their primary minerals (Fig. 12b).
Groundwater circulation is compatible with the formation of secondary minerals in depth and is also a scenario unchallenged by the stratigraphy inferred at Oxia Planum (Fig. 12c). In the case of a groundwater alteration, the contact between the two subunits probably records the upper water table level, which in the landing area would show lateral variation of several hundreds of meters (Fig. 3c). Such significant variation of groundwater level could reflect different times when the subsurface alteration occurred.
In the case of deposition of subaqueous clay-bearing sediments, the formation of clay minerals would predate or be contemporaneous of material deposition, so any alteration would have occurred during the Noachian (the age of the clay-bearing unit) (Quantin-Nataf et al., 2021). The timing of alteration in the pedogenic and groundwater alteration scenarios is less constrained, but as the clay-bearing deposits are currently in erosion (Quantin-Nataf et al., 2021) and as no modern process can account for a widespread formation of clay minerals, the alteration would have probably happened before the exhumation of the site—unless the main exhumation occurred very early in the history of the site.
As detailed previously and in the work of Quantin-Nataf et al. (2021), the fractured-bearing unit did not experience deep burial/metamorphism processes. This makes the presence of serpentine or chlorite highly unlikely, as they form in high-temperature settings (e.g., Khalepp and Burd, 1985; Inoue et al., 2010). Hence, the 2.5 μm feature observed in association with Fe/Mg clay minerals is most likely caused by the presence of the remaining mineral candidates: carbonate (consistently with Bultel et al., 2019) or another type of smectite.
4.3. Implications for the ExoMars mission and summary
The ExoMars landing site Oxia Planum displays a geological record that is attractive for the search for biosignatures on Mars and understanding of its early climate. The rover will be able to drill up to 2 m in the surface and provide, through Raman, chromatography, and infrared spectroscopy, an overview of the mineralogical and organic matter content of these promising terrains. From orbit, the clay-bearing exposures at Oxia Planum exhibit variations of mineralogical composition, most probably caused by diversity in the bedrock (rather than variable surficial dust or sand cover). The center (where the probability to land is the highest) and the western part of the landing area expose the portion of the clay-bearing unit stratigraphy with the strongest spectral signal of clay minerals, which are the primary scientific target of the mission as these minerals are relevant for the search of ancient life. The spectral signature of the clay mineral identified within the landing area, a close match to vermiculite or saponite, is representative of the widespread Fe/Mg-rich clay mineral previously identified on Mars (Ehlmann et al., 2011; Carter et al., 2013). For this reason, landing in the center or western part of the landing site would allow for investigations that can give insights into the global martian alteration history.
Landing in the eastern part of the landing area would provide a lower probability of access to the bedrock with the strongest signature of clay minerals but would still be valuable since the clay-bearing unit is extensively exposed there as well. We showed that the clay-bearing unit is likely more widespread than the NIR spectral detections of clay minerals and will probably be accessible for drilling in the event of a landing outside of the strong clay detections (i.e., in the northern part of the landing area). In most of the area, different subunits are often reachable within a few hundreds of meters (i.e., well within the rover traverse capability).
In addition to the typical absorption of the dominant Fe/Mg-phyllosilicate phase at Oxia Planum, an absorption at 2.5 μm was detected locally on the clay-bearing unit. This feature can correspond to the presence of either carbonate or another type of smectite. If carbonate phases are present, the site might have been preserved from any acidic environments, which improves its exobiological potential.
Footnotes
Acknowledgments
We thank E. Hauber and another anonymous referee for improving the quality of the article with their helpful feedbacks. Charlotte Marriner is thanked for guidance in CaSSIS mission image planning and funded by UKSA grants ST/R003025/1 and ST/V002295/1. We are grateful to the teams of the HiRISE, CaSSIS, and CRISM instruments for the work done to release the data used in this work.
Author Disclosure Statement
No competing financial interests exist.
Funding Information
L. Mandon and C. Quantin-Nataf have been supported by the Agence Nationale de la Recherche (ANR, ANR-18-ERC1-0005) and by the Centre National d'Études Spatiales (CNES) in France. P. Beck has been supported by the H2020 European Research Council (ERC, SOLARYS ERC-CoG2017\_771691). A. Parkes-Bowen was funded by an STFC studentship. CaSSIS is a project of the University of Bern and funded through the Swiss Space Office through ESA's PRODEX program. The CaSSIS instrument hardware development was also supported by the Italian Space Agency (ASI, ASI-INAF Agreement No. I/018/12/0), INAF/Astronomical Observatory of Padova, and the Space Research Center (CBK) in Warsaw. Support from SGF (Budapest), the University of Arizona (Lunar and Planetary Lab.), and NASA is also gratefully acknowledged. In this contribution, the CTX, HiRISE, and CRISM data have been processed with the MarsSI application (
Supplementary Material
Supplementary Figure S1
Supplementary Figure S2
Supplementary Figure S3
Supplementary Figure S4
Supplementary Figure S5
Supplementary Figure S6
Supplementary Figure S7
Supplementary Table S1
Abbreviations Used
Associate Editor: Jack Mustard
References
Supplementary Material
Please find the following supplemental material available below.
For Open Access articles published under a Creative Commons License, all supplemental material carries the same license as the article it is associated with.
For non-Open Access articles published, all supplemental material carries a non-exclusive license, and permission requests for re-use of supplemental material or any part of supplemental material shall be sent directly to the copyright owner as specified in the copyright notice associated with the article.