
Abstract
Calcium sulfates are known to be potential reservoirs of organic compounds and have been detected on Mars. However, not all data that indicate the presence of sulfates collected by the Mars Exploration Rovers (Spirit and Opportunity) and Curiosity rover can be explained by the different calcium sulfate polymorphs, and therefore, mixtures of calcium sulfates with other single sulfates must be considered. In addition, the presence of mixed calcium sulfates supports the data and indicates that the molar ratio of sulfate/calcium is >1. To obtain adequate spectroscopic information of mixed-cation sulfates to be used in the interpretation of data from Mars in the next few years, the thermodynamically stable syngenite (K2Ca(SO4)2·H2O) and görgeyite (K2Ca5(SO4)6·H2O) mixed-cation sulfates have been studied along with the interrelationships in the gypsum–syngenite–görgeyite system to understand their possible formation on Mars. Raman spectroscopy and Visible–Near Infrared–Shortwave Infrared (VisNIR) spectroscopy have been used for their characterization to increase the databases for the two future Mars exploration missions, Mars2020 and ExoMars2022, where both techniques will be implemented. These VisNIR data can also help with the interpretation of spectral data of salt deposits on Mars acquired by the OMEGA and CRISM spectrometers onboard the Mars Express and Mars Reconnaissance orbiters. This work demonstrates that syngenite (K2Ca(SO4)2·H2O) easily precipitates without the need for hydrothermal conditions, which, depending on the ion concentrations, may precipitate in different proportions with gypsum. Furthermore, in this study, we also demonstrate that, under hydrothermal conditions, görgeyite (K2Ca5(SO4)6·H2O) would also be highly likely to form and may also be identified on Mars together with syngenite and gypsum.
1. Introduction
Evaporite mineral assemblages (Mg, Ca-sulfates, Fe, Na-sulfates, jarosite, and chlorides) have been found in many areas on Mars (McLennan et al., 2005; Aubrey et al., 2006; Tosca and McLennan, 2006; Arvidson et al., 2014; Nachon et al., 2014). The characterization of these mineral assemblages is important mainly because they are crucial to understand the type of physical and chemical processes that happened millions of years ago (Tosca and McLennan, 2006). These saline minerals might suggest the past presence of water at the martian surface and subsurface (Tosca and McLennan, 2006), and thus, primitive life (e.g., halophilic extremophiles such as microalgae and bacteria) might have existed in these evaporite deposits (Bridges and Grady, 2000; Barbieri and Stivaletta, 2011). This past life could be identified as fossil biosignatures (e.g., chemofossils, biominerals) (Tosca and McLennan, 2006; Barbieri and Stivaletta, 2011) as is the case for evidence of past life identified on Earth. Furthermore, organic molecules such as amino acids and amines have been found preserved for geologically long periods of time in sulfate matrices (Aubrey et al., 2006), and lipids have been found preserved in sulfate minerals (Tan et al., 2018; Johnson et al., 2020). Moreover, microorganisms have been found as microfossils or viable microorganisms in fluid inclusions in gypsum (Benison and Karmanocky, 2014), and Mg-sulfates may protect organic molecules from degradation (François et al., 2016). Thus, regions where evaporites occur are high priority targets to be explored in upcoming orbital and landed missions to Mars (Bridges and Grady, 2000; Tosca and McLennan, 2006).
Tosca and McLennan (2006) suggested two different geochemical environments on Mars: acid-sulfate-dominated environments and mixed carbonate-sulfate-dominated environments. Surface erosion and, thus, solute acquisition would be mainly controlled by chemical weathering of the crustal material. These reactions would be initiated by acid input that would be neutralized as silicate minerals are solubilized from the rock. The major sources of acidity on Mars are CO2 from the atmosphere, volcanic gases rich in SO2, and other minor volatile species such as chlorides. Therefore, the three major anions present in martian fluids are HCO3 −, SO4 2−, and Cl− (Tosca and McLennan, 2006). There are different possible explanations for the secondary mineral formations, but the simple mineralogical assemblages of Fe-Mg-Ca carbonates; gypsum; and other sulfates, halides, and clay minerals suggest, according to some authors (Bridges et al., 2001), that the most plausible pathway for the formation of the secondary minerals involves the evaporation of brines at low temperature (25–150°C). Longer lived and higher temperature hydrothermal systems would imply more silicate alteration and probably more complex mineral assemblages (Bridges et al., 2001). Moreover, solutes from the weathering of parent rocks could depress the melting point of water in a frozen martian environment. Fairén et al. (2009) simulated freezing and evaporation processes of possible martian fluids with a composition resulting from the weathering of basalts. Their study results indicate that a significant fraction of weathering fluids loaded with Si, Fe, S, Mg, Ca, Cl, Na, K, and Al would remain in a liquid state at temperatures below 0°C, which could imply possible saline liquid water activity on the surface of Mars (Fairén et al., 2009).
Calcium sulfates specifically have been identified at the Endeavour and Gale craters on Mars with different states of hydration. The alpha particle X-ray spectrometer (APXS) and PanCam instruments on board Opportunity identified gypsum (CaSO4·2H2O) in calcium sulfate veins crosscutting sediments in the Whitewater lake locality (Arvidson et al., 2014) and Cape York, Endeavour Crater, Mars (Squyres et al., 2012). The APXS and Mössbauer instruments on board Spirit identified the presence of calcium sulfate and magnesium sulfate in the rocks of the West Spur area, Columbia Hill, Gusev Crater (Wang et al., 2006). The chemical (APXS instrument) and mineralogical (CheMin instrument) analyses performed by Curiosity of fractures crosscutting the Stimson sandstone and Murray mudstone, Gale Crater, Mars, detected Ca and probable mixed-cation sulfates (Yen et al., 2017). The ChemCam instrument was able to demonstrate, through laser-induced breakdown spectroscopy (LIBS) measurements on light-toned fracture-fill material within sedimentary deposits at Gale Crater, that this fracture fill consisted of calcium sulfate veins (Nachon et al., 2014). When quantifying the amount of water by using the hydrogen line at 656 nm in LIBS, bassanite (CaSO4·0.5H2O) was proposed as the main compound in such veins (Rapin et al., 2016).
Sulfates have also been measured by APXS (Spirit, Opportunity, and Curiosity) and LIBS-ChemCam (Curiosity) in soils, drilled material, and sandstones at different locations on the Red Planet, and anhydrous and hydrated calcium sulfates primarily have been detected (McLennan et al., 2005; Arvidson et al., 2014; Grotzinger et al., 2014). In some of the measurements of soils, drilled material, veins, and sandstones, the molar ratio of sulfate/calcium was shown to be >1, which suggests the presence of both Ca with other metal sulfates or mixed-cation sulfates (McLennan et al., 2005; Squyres et al., 2012; Arvidson et al., 2014; Grotzinger et al., 2014; Nachon et al., 2014; Rapin et al., 2016; Yen et al., 2017). A wide variety of sulfates that contain a single cation have been prepared and analyzed in the laboratory by Raman spectroscopy and Reflectance Visible-Near Infrared-Shortwave Infrared (VisNIR) spectroscopy, and their spectra are included in the databases of instruments implemented in the Perseverance and Rosalind Franklin payloads. Thus, spectra containing single sulfates (i.e., the different Ca-sulfate polymorphs) or mixtures of single sulfates (i.e., mixtures of Mg- and Fe-sulfates) can be interpreted properly with the available spectroscopic information.
If mixed-cation sulfates can form under evaporitic (hydrothermal and nonhydrothermal) conditions, however, their presence in Jezero Crater (the landing site of Mars2020) and Oxia Planum (the landing site of ExoMars2022), two sites that have contained liquid water for thousands of years, would be expected. We therefore will need to interpret spectra from both sites with a database that contains not only sulfates with a single cation but also sulfates that contain mixed cations. For example, it is possible that, along with anhydrite, bassanite, and/or gypsum, other mixed calcium sulfate salts coexist in those sulfate-rich materials, such as syngenite (K2Ca(SO4)2·H2O) and görgeyite (K2Ca5(SO4)6·H2O), which contain higher SO3% compared with CaO%.
Syngenite and görgeyite are often found in mineral rock salt formations on Earth. For example, syngenite has been observed, when using visible and near-infrared absorption, to be mixed with other sulfates in the Death Valley salt pan (Crowley and Clark, 1992). Syngenite has also been observed to be mixed with gypsum in efflorescent salts on K-bearing sandstones (Alexandrowicz et al., 2014; Alexandrowicz and Marszałek, 2019). In such salts that form on sandstones, the K and Ca sources are considered likely to be the K-bearing potassium feldspar and plagioclase present in the sandstone, which showed signs of dissolution (Alexandrowicz and Marszałek, 2019). Syngenite has also been found in metamorphic evaporite deposits (Borchert and Muir, 1964) and in a volcanic cave due to interactions with guano (Benedetto et al., 1998).
The very rare K and Ca sulfate-containing mineral görgeyite has also been found in a variety of terrestrial natural settings, as reviewed by Kloprogge et al. (2004), which include the Ischler Salt Deposit in Salzburg (Austria) (Mayrhofer, 1953), Lake Inder (Kazakhstan) (Mokievsky, 1953; Fleischer, 1955; Meixner, 1955; Nefedov, 1955), a Triassic evaporite sequence in Western Greece (Smith et al., 1964; Smith and Walls, 1980), salt deposits in Germany (Mötzing, 1988), lower middle Triassic polyhalite rocks in Nongle in Sichuan Province (China) (Cai et al., 1985), and playa sediments in Iran (Ghadimi and Ghomi, 2013). Görgeyite has also been found to be associated with syngenite in a geothermal field in Italy (Cavarretta et al., 1983) and in guano deposits in South Australia (Snow et al., 2014). Potassium-bearing salts are, therefore, observed in terrestrial environments that may be of relevance to Mars.
Examination of K-bearing salts is particularly critical given recent observations from Mars that indicate higher concentrations of K than previously observed on the planet. Mars was once considered to be a largely basaltic planet (McSween et al., 2009), but then evidence of K-rich fluids was found preserved in martian meteorites (Goodrich et al., 2013; Combs et al., 2019), and alkali feldspars were detected in NWA 7034 (Agee et al., 2013; Santos et al., 2015). In addition, recent measurements acquired with the APXS, ChemCam, and CheMin on the Mars Science Laboratory Curiosity rover indicate the presence of K-bearing volcanic and sedimentary rocks, including a K-bearing martian mugearite (Stolper et al., 2013) and alkaline volcanic rocks (Sautter et al., 2015; Cousin et al., 2017). Measurements of sedimentary rocks by CheMin and APXS revealed the prevalence of sanidine, a K-rich feldspar (Thompson et al., 2016; Treiman et al., 2016), and measurements by ChemCam indicated an increase in K concentration upward through the stratigraphic section (Deit et al., 2016).
Therefore, syngenite and görgeyite might also be found in the new landing sites Jezero Crater and Oxia Planum, where sulfates have already been detected by orbiters (Ayala and Itzel, 2016; Salvatore et al., 2018). Future missions to these sites will incorporate Raman together with VisNIR spectrometers in their rovers, enhancing their capability to detect such mixed-cation sulfate minerals.
In the present study, the synthesis of two stable calcium–potassium sulfates—syngenite (K2Ca(SO4)2·H2O) and görgeyite (K2Ca5(SO4)6·H2O)—was described together with the study of the gypsum–syngenite–görgeyite system to understand their possible formation on Mars. This work considers mixed-cation sulfates that contain potassium and calcium, which are stable under evaporite conditions; future work will consider Na-Ca-sulfates, K-Mg-sulfates, Mg-Fe-sulfates, copiapite-group minerals, and other mixed-cation sulfate-chloride minerals for which the Raman and VisNIR spectra and interrelationships will be considered. In this work, the synthesis is based on thermodynamic calculations to simulate the conditions at which syngenite and görgeyite can form with the intent to learn more about sulfates that may coexist with gypsum. In addition, syngenite and görgeyite were characterized by Raman spectroscopy and VisNIR spectroscopy to increase the databases for both spectroscopic techniques that are implemented on the rovers of two future Mars exploration missions, Mars2020 and ExoMars2022. Furthermore, VisNIR data can help with the interpretation of spectral data of salt deposits on Mars acquired by the OMEGA and CRISM spectrometers on board the Mars Express and Mars Reconnaissance Orbiter, respectively. To corroborate our results and obtain a semiquantitative ratio of the salts formed, the salts were also analyzed by X-ray diffraction (XRD).
2. Experimental Procedure
2.1. Preparation of the reactant solutions
The synthesis of syngenite and görgeyite was performed by mixing adequate volumes of different previously prepared stock solutions from pure solid reagents, K2SO4 (99% pure; Panreac, Barcelona, Spain), KCl (99% pure; Panreac), CaCl2·2H2O (99% pure; Merck, Darmstadt, Germany), and MgSO4·H2O (99% pure; Panreac).
To prepare different proportions of K+, Ca2+, and SO4 2−, we selected the different reagents according to the following reasoning. When high SO4 2− concentrations were required, we added MgSO4 instead of K2SO4 without increasing the K+ concentration. As a Ca2+ input, gypsum was not used because, at the required Ca2+ concentrations, gypsum is nearly insoluble. Instead, CaCl2·2H2O was used because of its high solubility for the high Ca2+ concentrations needed for the synthesis of syngenite. KCl was added when high K+ concentrations were required together with low SO4 2− concentrations. In both cases, the counter ion, Cl−, was selected since it is one of the major anions expected in martian brines (Tosca and McLennan, 2006). MgSO4·H2O was also added to reproduce a more realistic geochemical system and to check for the possible presence of other common mixed-cation sulfates, that is, polyhalite (K2Ca2Mg(SO4)4·2H2O), in the precipitates obtained in the syntheses.
2.2. Synthesis procedure
The different stock solutions of the reactants, prepared as described in Section 2.1, were either mixed at room temperature (RT) or the mixture was heated to the boiling point on a heating plate (∼100°C). To complete the precipitation process, two methodologies were used. In the first case, the solutions were left at RT (20–25°C), and in the second case, the reactant mixtures in flasks were introduced into a temperature-controlled water bath to maintain constant temperature at 90°C for 8 h and discern whether these salts could also precipitate under hydrothermal conditions. The flasks introduced into the water bath were linked to a refrigeration column to avoid complete evaporation (Fig. 1). The water bath was heated with a thermostat (DIGITERM TFT-200 JP SELECTA, Spain), and a stirrer was used to maintain the same temperature throughout the entire water bath (Fig. 1).
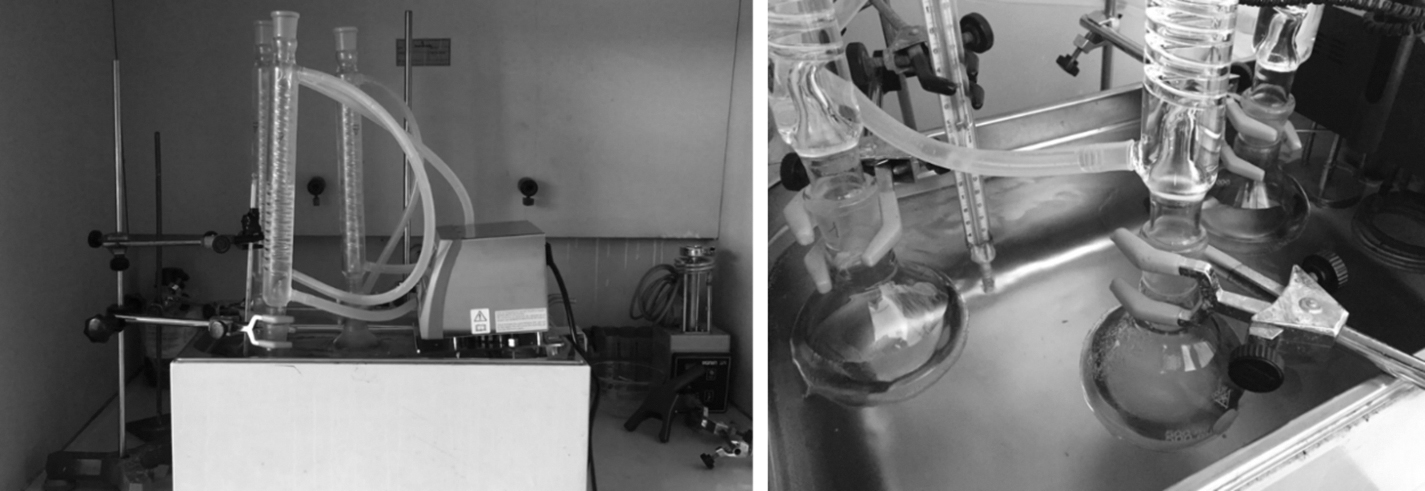
One of the experiment batches containing three flasks with three different concentrations of the ions, submerged in the water bath, and heated to 90°C.
To select the chemical conditions under which the formation of syngenite is theoretically most favored, different thermodynamic simulations were performed by using the MEDUSA software (Puigdomenech, 2009a) at 25°C. The logK data at 25°C contained in the Hydra (Puigdomenech, 2009b) database were complemented with specific formation constant values extracted from the Visual MINTEQ software (Gustafsson, 2013). Hydra is linked to the MEDUSA software, generating the chemical system which is then used to create the specific diagrams in MEDUSA. MEDUSA can create varying types of diagrams that include fraction diagrams, logarithmic diagrams, and predominance area diagrams, and the overall process is based on the SOLGASWATER (Eriksson, 1979) and HALTAFALL (Ingri et al., 1967) algorithms.
Once the concentrations at which syngenite should be thermodynamically stable were defined, different combinations of the ion concentrations at which the precipitation of syngenite theoretically occurs were tested. To assess all the possibilities for each experiment batch, three different combinations of the ions involved in the synthesis were selected. Each experiment batch was subjected to different precipitation conditions (flasks 1, 2, and 3), reproducing one of the best conditions designed to obtain pure syngenite derived from the MEDUSA simulations. All the concentration combinations and synthesis conditions employed are described in Tables 1 and 2, and the distribution diagrams used to visualize the best chemical conditions to produce syngenite are shown in Figs. 2 and 3.

Molar fraction diagrams at 25°C showing different concentrations of ions at which syngenite (K2Ca(SO4)2·H2O) is thermodynamically favored to precipitate.

Molar fraction diagrams at 25°C showing different concentrations of ions at which syngenite (K2Ca(SO4)2·H2O) is thermodynamically favored to precipitate.
Synthesis Conditions of the Different Experiment Batches and Ion Concentrations Used in Each Flask and the XRD (wt %) and Raman Results for Each Obtained Solid for Syngenite Synthesis
EB = experiment batch; F = flask; Gör = görgeyite; Gp = gypsum; NP = no significant precipitation of solid; RT = room temperature; Syn = syngenite;
Synthesis Conditions of the Different Experiment Batches and Ion Concentrations Used in Each Flask and the XRD (wt %) and Raman Results for Each Obtained Solid for Polyhalite Synthesis
The obtained solids were filtered under vacuum through filter paper (25–30 μm pore size and 70 mm diameter [FILTER-LAB, Spain]) for quantitative analysis, and the collected solids were kept in glass vials until their analysis after drying them at 40°C for 2 h.
2.3. Characterization of the salts
The major and minor mineral phases present in the solid precipitates were characterized by Raman microscopy using an inVia Raman microspectrometer (Renishaw, Gloucestershire, United Kingdom). This instrument is equipped with a Peltier-cooled charge coupled device detector (−70°C). The spectrometer is coupled to a DMLM Leica microscope, which can use a variety of lenses (5 × , 20 × , 50 × , and 100 × ). The microscope is equipped with a motorized XYZ positioning stage (Renishaw). Excitation diode lasers of 785, 633, and 532 nm can be used for measuring.
In this work, the 532 nm laser was used to characterize the obtained salts as it is the excitation wavelength of the Raman lasers that will be sent to Mars on both Mars2020 (the SuperCam instrument) and ExoMars2022 (the Raman laser spectrometer [RLS] instrument). Point by point measurements were carried out, setting the acquisition times and number of scans to optimize the signal-to-noise ratio. The laser power was modulated to avoid thermal decomposition and chemical or mineralogical transformations. The same conditions of an acquisition time of 10 s, 10 accumulations, and 10% of laser power (1.56 mW for the 50 × lens employed) were used for all the solids to enable comparisons between the obtained spectra. The calibration of the equipment was performed daily with the 520.5 cm−1 silicon band. For data analysis and interpretation, WiRE 4.2 software (Renishaw) was used. The identification of the detected mineral phases was performed by comparison of the obtained spectra with the spectra obtained for pure standards that are available in the free online database RRUFF (Downs and Hall, 2002) and bibliography.
To corroborate the Raman and VisNIR results and obtain a quantitative estimate of the mineral compositions in each synthesis, the solids were characterized by XRD. For the characterization by XRD, each sample was powdered and homogenized with an agate mortar and pestle. The XRD measurements were performed with a PANalytical Xpert PRO diffractometer (Almelo, Netherlands) equipped with a Cu tube (λCuKαmedia = 1.5418 Å, λCuKα1 = 1.54060 Å, and λCuKα2 = 1.54439 Å), a vertical goniometer (Bragg–Brentano geometry), a programmable divergence slit, a secondary graphite monochromator, a PixCel detector, and an automatic sample exchanger. The measurement conditions were 40 KV and 40 mA with a range of 5–70°2θ. The treatment of the obtained diffractograms and the identification of the phases were performed with the PANalytical X'pert HighScore and the database PDF2 from the ICDD, respectively.
The quantitative estimate of the mineral phases was performed by using the reference intensity ratio (RIR) values contained in the PDF sheets of the database. The RIR value corresponds to the intensity (height) ratio of the most intense peak of the mineral phase contained in the PDF from the database to the most intense peak of a standard, corundum (trigonal Al2O3) in a mixture of 50% by weight of each of the mineral phases. In this way, the different diffraction power of the different mineral phases is corrected, and if all the mineral phases are identified in the samples, a semiquantitative analysis can be performed by using the RIR values and the intensity (scale factor) of the most intense peak of each detected mineral phase in the samples. This semiquantitative method is limited because all the identified phases sum to 100%; thus, if amorphous material was present in the samples or other crystalline phases remained unidentified, the obtained values would only represent the relative proportions among the identified phases. Another limitation arises from the fact that quantification is only based on one peak, the most intense one, and its intensity can be greatly affected by the preferred orientation of the crystals in the sample carrier. In this work, this effect could be significant due to the morphology of the obtained crystals, needle-shaped crystals, which can lead to a preferred orientation, enhancing in this way the intensity of some peaks with respect to others. It must also be considered that RIR values may change from some PDF sheets to others and that some old PDF sheets do not contain the RIR values for some mineral phases. That is why we prefer to consider these calculations as “semiquantitative estimates of concentrations” instead of “quantitative concentrations.”
The salts were also characterized by VisNIR spectroscopy with an ASD High-Resolution FieldSpec 4 spectroradiometer (Analytical Spectral Devices, Inc.). A halogen lamp (ASD Illuminator) was used as the light source. This VisNIR device works in the wavelength range of 350–2500 nm and is composed of three detectors for the different spectroscopic ranges: 350–1000 nm (silicon photodiode array for VisNIR), 1001–1800 nm (InGaAs photodiode for SWIR1), and 1801–2500 nm (InGaAs photodiode for SWIR2). The spectral resolution is 3 nm in the visible region and 6 nm in the near-infrared region. Sensor optimization and calibration were achieved with a Spectralon® white reference standard scanned once before each measurement. Each spectrum was collected from an average of 20 scans. The reflectance was calculated by comparing near-infrared energy reflected from the sample with the standard reference. Spectra were collected with the RS3 software (ASD, Inc.) and analyzed with the ViewSpec Pro software (ASD, Inc.).
3. Results
The best concentration combinations of the ions SO4 2−, Ca2+, K+, and Mg2+ in solution at 25°C to precipitate syngenite (K2Ca(SO4)2·H2O) are those shown in the diagrams obtained with the MEDUSA software that can be observed in Fig. 2 (solutions without magnesium) and in Fig. 3 (solutions containing Mg2+and higher SO4 2− concentrations).
Figure 2 shows the effect of increasing the Ca2+ concentration with constant sulfate and varying K+. The precipitation of syngenite competes with the formation of gypsum, but syngenite is favored at low calcium and high potassium concentrations if the concentration of Ca2+ is lower than the concentration of SO4 2−([Ca2+] < [SO4 2−], Fig. 2A–C). However, when the concentration of Ca2+ is equal or higher than the concentration of SO4 2−([Ca2+] > [SO4 2−]), gypsum becomes the most favored compound (Fig. 2D). However, the formation of syngenite is partially inhibited by the aqueous KSO4 − complex, which is the main compound at all the K+ concentrations when low Ca2+ is employed (Fig. 2A, B) and is still very important under conditions shown in Fig. 2C. This means that the aqueous KSO4 − complex competes for the added K+ with the solid calcium–potassium sulfate.
Concentrations shown in Fig. 2A–C were the ones used for the three flasks comprising each experimental batch for the syngenite synthesis. The red line indicates the final concentration of K+ that was selected according to the concentration at which syngenite was the predominant solid compound and taking into account experimental limitations such as the total volume that could be added to the available flasks while still being able to use the temperature-controlled water bath. The different experimental batches, always containing the three flasks with the concentrations marked in Fig. 2, were subjected to different synthesis conditions that are shown in Table 1.
With the aim to reproduce a more realistic geochemical system, Mg2+, an expected compound in martian fluids (Tosca and McLennan, 2006), was added to the system, and under these conditions, the best ion combinations to obtain the precipitation of syngenite were studied. The fraction diagrams for some of the simulated ion combinations at 25°C are shown in Fig. 3. In this case, not only the aqueous KSO4 − complex but also the soluble MgSO4 complex compete with the formation of syngenite (and gypsum).
At a fixed concentration of 200 mM SO4 2− (Fig. 3A–C), syngenite predominates at higher Ca2+ concentration if [Ca2+] < [SO4 2−]. The increase in Mg2+concentration reduces the formation of syngenite because of the formation of the soluble MgSO4 complex. Under these conditions, the K+ concentrations must be above 600 mM to favor syngenite formation.
However, if the concentration of dissolved sulfate is increased, even when Mg2+ concentrations are up to 100 mM, the amount of precipitated syngenite is increased, especially if Ca2+ concentration is kept at 200 mM (Fig. 3D, E). As syngenite precipitation is favored with increasing sulfate concentrations, the effect of increasing it up to 500 mM, while maintaining the Mg2+ and Ca2+ concentrations at 100 mM, was also examined. As shown in Fig. 3F, the precipitation of syngenite starts to be less important due to the formation of a new solid sulfate compound, the hydrated mixed potassium–magnesium–calcium sulfate called polyhalite (K2MgCa2(SO4)4·2H2O).
In the experiments performed, a concentration of 600 mM of K+ was used in most cases (the K+ concentration employed is indicated with a straight red line in Figs. 2 and 3) to have a concentration high enough to obtain the precipitation of syngenite, but not so high as to be unrealistic relative to the abundance of other ions under earlier martian conditions.
3.1. Characterization of the salts
The precipitated salts were first visually characterized under the microscope coupled to the Raman device. As can be appreciated in Supplementary Fig. S1, the precipitated salts were highly crystalline with a needle-like shape.
XRD, Raman spectroscopy, and VisNIR spectroscopy were used for the characterization of the salts. The synthesis conditions for each experiment batch (concentrations as defined in Figs. 2 and 3), the XRD semiquantitative results, and the minerals identified by Raman spectroscopy are shown in Tables 1 and 2. Raman results are expressed as pure crystals (e.g., syngenite) if only one mineral is present in the spectra or as several mineral phases when two or more minerals are determined in the same Raman spectrum as, for example, syngenite with gypsum.
In experiment batch 1, when the reactants were mixed and left to precipitate at RT (∼20°C), the predicted results shown by the molar fraction diagrams (Fig. 2A–C), calculated at a temperature of 25°C, were obtained as shown in Table 1. The conditions in flask 3 (Fig. 2C) are the best ones for synthesizing syngenite as shown in Table 2, with the highest syngenite percentage obtained according to XRD results. Raman measurements also show the presence of pure syngenite and other crystals of pure gypsum. In Fig. 4, one of the pure syngenite spectra acquired for the solid precipitate obtained in flask 3 from experiment batch 1 is shown, where all the major and minor bands of syngenite are clearly present. In concordance with the molar fraction diagrams (Fig. 2A), the flask 1 concentration mixture also leads to the formation of syngenite but to a lesser extent, as the XRD wt % and Raman results indicate in Table 2. The obtained experimental XRD percentages of syngenite and gypsum in flask 1 of almost 50% for each compound are more or less in agreement with the predictions from the molar fraction diagrams; both solids are expected at 50% in Fig. 2A at a slightly lower theoretical K+ concentration (550 mM) than the experimental (600 mM) one. Deviations are expected due to experimental uncertainties, different RTs depending on the day, and so on. In Fig. 3C, at 900 mM K+, syngenite is expected in a slightly higher amount than gypsum as is experimentally observed (Table 1, experiment batch 1, flask 3).

The Raman spectrum of syngenite (K2Ca(SO4)2·H2O) acquired in the characterization of the solid precipitate obtained for the experiment batch 1, flask 3, and an extended spectrum of the same point showing the bands at higher wave numbers due to the O-H of the water contained in its structure.
As predicted in the molar fraction diagrams (Fig. 2), the predominance of the soluble KSO4 − complex seems to prevent (or at least minimize) the precipitation of solids, especially at low Ca2+ concentrations (Fig. 2B). This is likely the reason why, in experiment batch 1, flask 2, the amount of solid precipitated was so small that it was impossible to recover any significant amount of solid after filtration (Table 1).
Table 1 shows that precipitates are independent of concentrations when the reactants are heated in the water bath at 90°C for longer (8 h, experiment batch 2) or shorter (3 h, experiment batch 3) times. In all cases, the major compound that precipitates is gypsum. Furthermore, when reducing the heating time in the experiment (batch 3 vs. batch 2), the amount of syngenite obtained is slightly increased from 4% to 7% according to the XRD results. In many measured points by Raman spectroscopy, the two mineral phases, gypsum and syngenite, were found together. In Fig. 5, two Raman spectra from the solid obtained in experiment batch 3, flask 3, are shown. As can be observed in these spectra, the syngenite Raman bands appear together with the gypsum bands and are more intense under the conditions shown in Fig. 5A than in Fig. 5B.
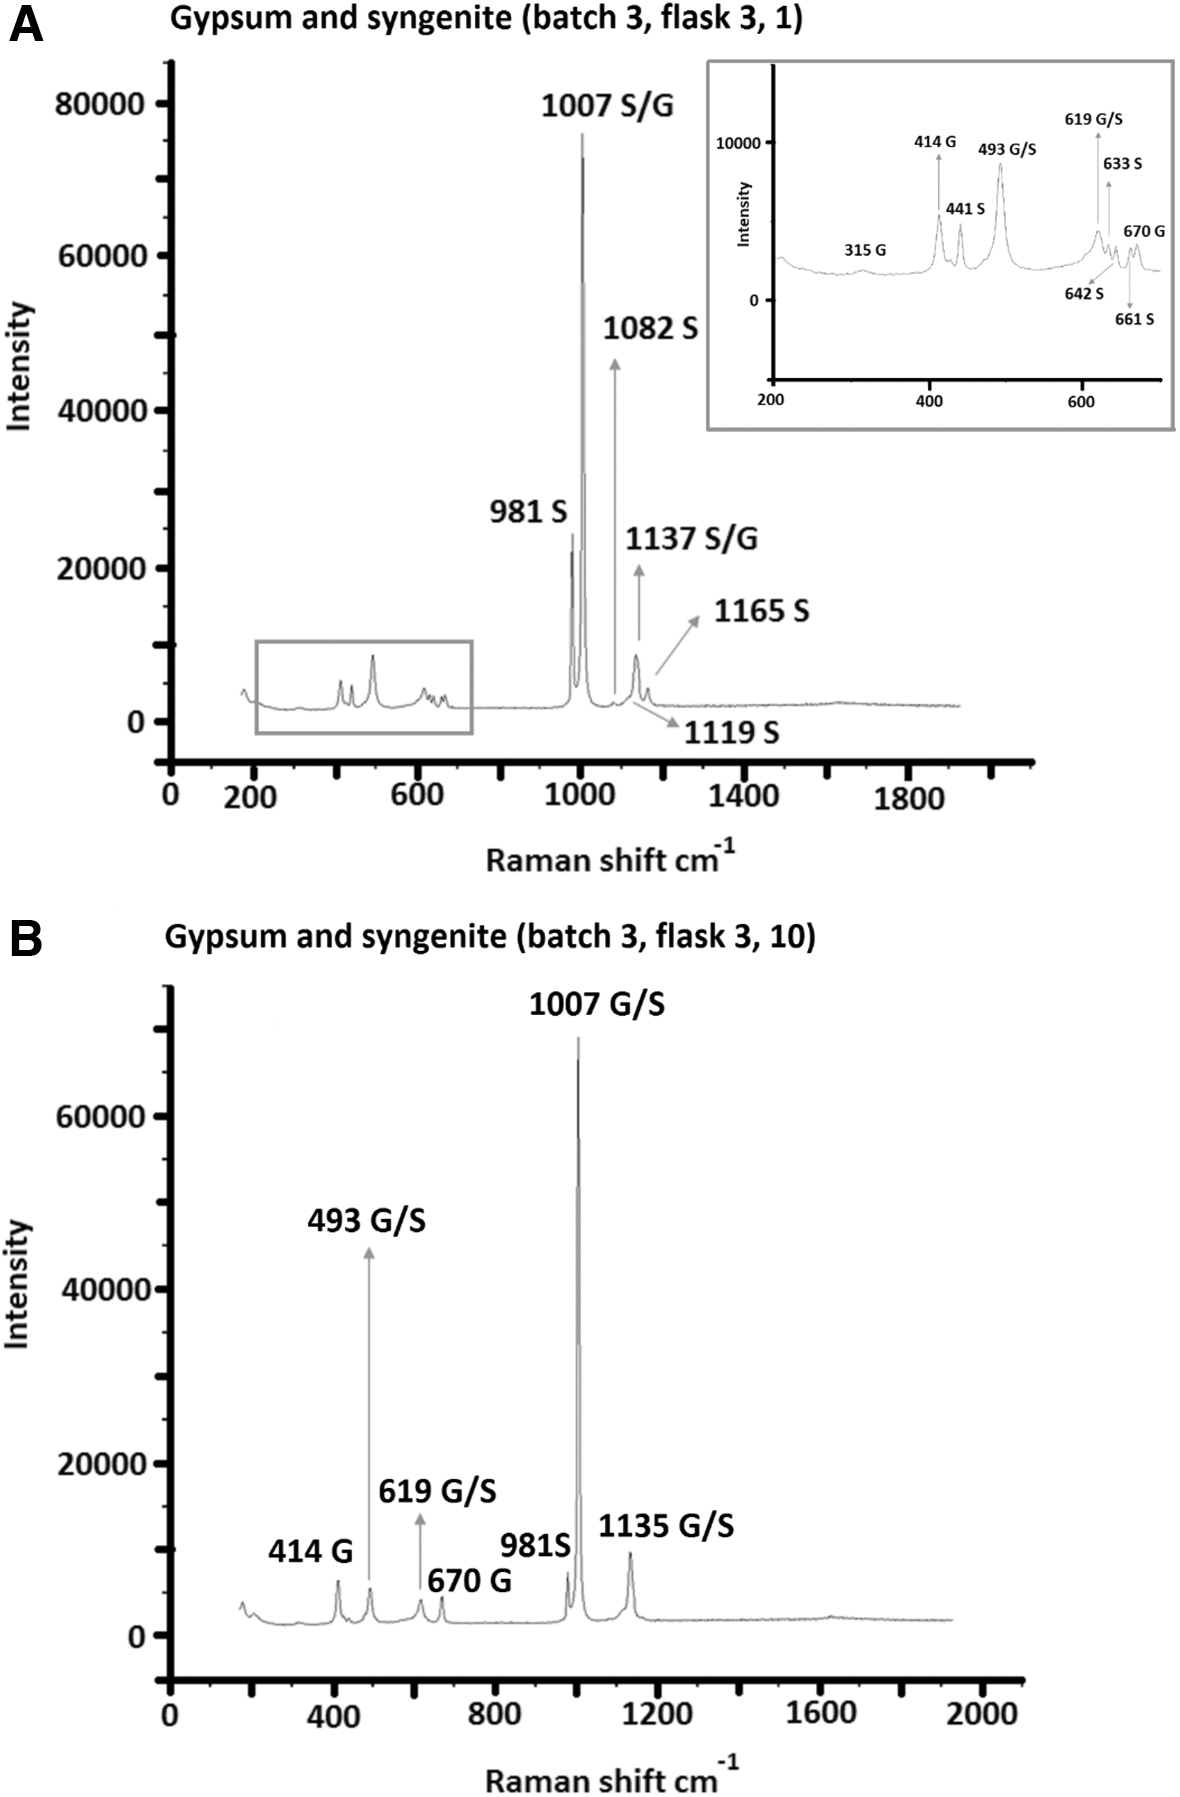
Raman characterization of the solid precipitate obtained for experiment batch 3, flask 3
According to these first three experimental batches, it seems that heating favors the precipitation of gypsum rather than favoring syngenite precipitation. In fact, the best conditions for synthesizing syngenite were those employed in flask 3 without any heating, the experimental results of which were close to those predicted by the molar fraction diagrams for those concentrations at 25°C.
Two more experiments—batches 4 and 5—were run with these same three flask conditions (Fig. 2). In these cases, the reactants were mixed on a heating plate and then kept at their boiling point for 1 h with the aim to study the effect of temperature on the nature of precipitated compounds that contain the same concentrations. As part of this heating process, some of the water was evaporated because no refrigeration system was used to condensate back the solvent. In experiment batch 4, the solid obtained after this heating process was analyzed, and very pure syngenite was obtained, especially in flask 2, when under the same conditions at RT when no precipitate was obtained (experiment batch 1, flask 2). It seems that, under these experimental conditions, the temperature and water evaporation favor the formation of syngenite over the soluble KSO4 − compound.
When comparing the results from experiment batch 4 with those of experiment batches 2 and 3, where the heating was for a longer period and solvent evaporation was avoided by using a refrigeration column, it can be observed that the formation of syngenite was also favored when the heating process was short and water evaporation was employed. If, after the initial heating process, the reactants were heated in the water bath at 90°C for 8 h and with refrigeration (experiment batch 5), the syngenite percent in the obtained solid would have diminished in all the flasks, due to the formation of görgeyite (K2Ca5(SO4)6·H2O). Moreover, in flask 3 of experiment batch 5, görgeyite was the main compound, making up ∼80% according to the XRD results. During Raman analyses, the bands of görgeyite were also detected in the solid obtained in flask 3 but not in the other flasks, probably due to the low content of görgeyite in flasks 2 and 3. Figure 6 shows the Raman spectrum for pure görgeyite (single crystals from the solid in flask 3 of experiment batch 5, zoomed in on its characteristic doublet at 1007 and 1013 cm−1). In flask 3 (Fig. 2C), the amount of added Ca2+ was the highest of all the experimental conditions, which also seems to have favored the formation of görgeyite, a compound with a slightly lower molar Ca content than sulfate in its structure.
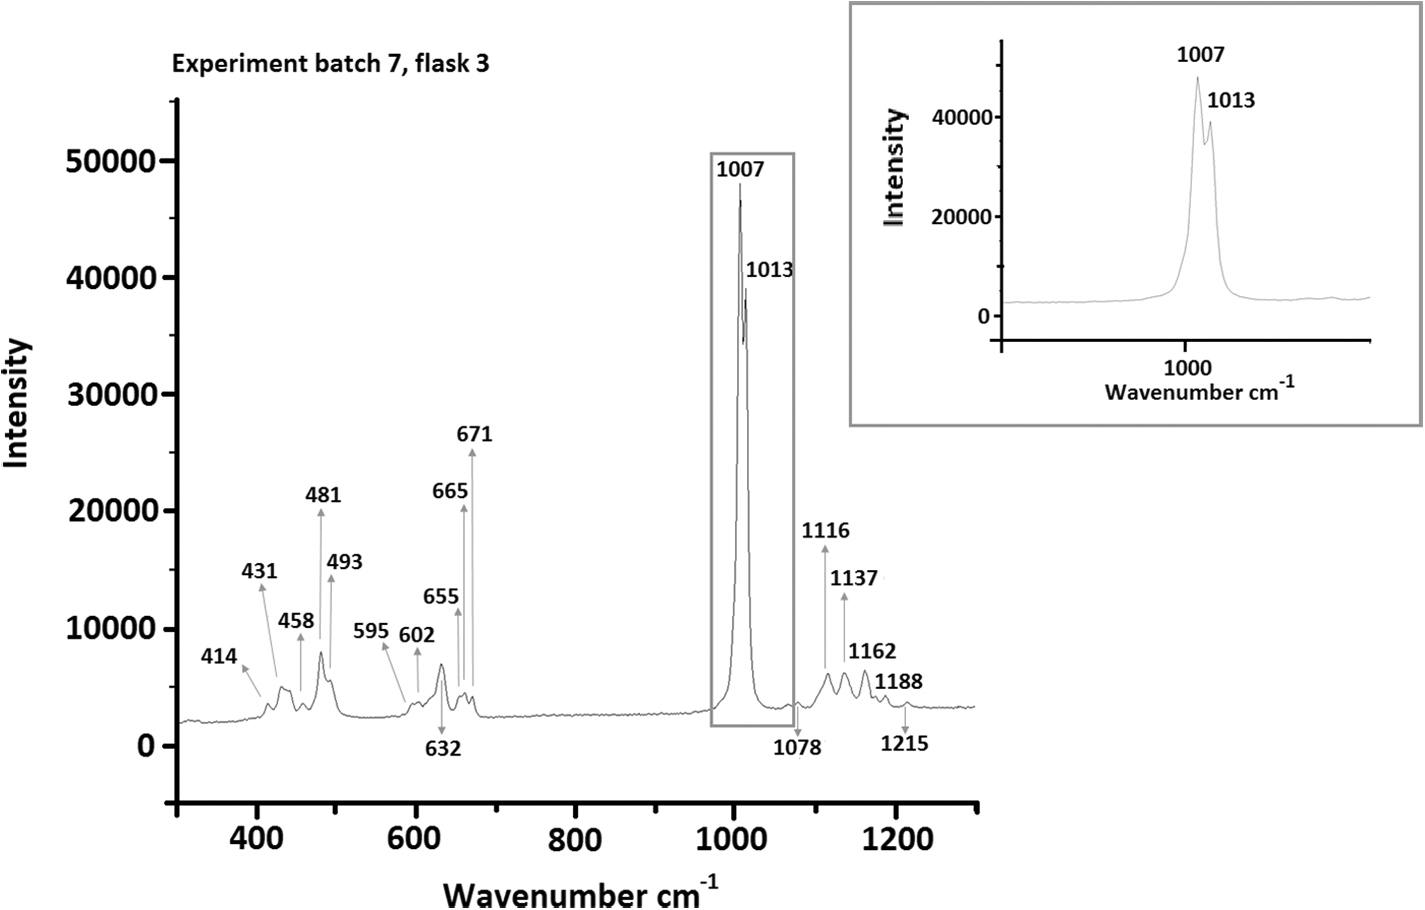
The Raman spectrum of görgeyite (K2Ca5(SO4)6·H2O) acquired in the characterization of the solid precipitate obtained for the experiment batch 7, flask 3, with a zoomed in inset of its characteristic doublet at 1007 and 1013 cm−1.
With the aim to simulate more realistic ion concentrations in the possible fluids of early Mars, Mg was added to the system in the following four different experiment batches (experiment batches 6–9). In experiment batches 6 and 8, where the reactants were mixed and left to precipitate at RT, the obtained results (Table 2) agree with the predicted ones in the molar fraction diagram shown in Fig. 3.
When the sulfate concentration was increased from 200 to 400 mM (experiment batch 8 in flasks 1 and 2), syngenite became more important than gypsum and was the main precipitated compound, especially in flask 1, in which the Ca2+ concentration was lower. When the sulfate concentration was increased slightly, up to 500 mM, as in flask 3, with 100 mM of Ca2+, at the high concentration of 800 mM of K+, the only compound precipitating was syngenite, as predicted in Fig. 3F.
When the concentrations used in the three flasks employed in experiment batch 6 were heated (experiment batch 7), syngenite formation was more favored with respect to gypsum than when reactants were left to precipitate at RT, and görgeyite also precipitated. However, when the reactants employed in experiment batch 8 were heated (experiment batch 9), the precipitation of gypsum was more favored in flasks 1 and 2, but syngenite was still the only compound precipitating in flask 3 at high sulfate, Ca2+, and K+ concentrations; under these conditions, the heating process did not lead to the formation of görgeyite.
The precipitated salts were also characterized by VisNIR, as this spectroscopy is also on board the rovers of the Mars2020 and ExoMars2022 missions. These data may also help in the interpretation of the NIR spectra from the orbiters OMEGA and CRISM. In particular, the VisNIR spectrum characterization of görgeyite, to the authors' knowledge, has not been previously reported.
In Figure 7, the VisNIR spectra of the synthesized salts gypsum, syngenite, and görgeyite are shown. The spectrum of gypsum (Fig. 7A) is characterized by a quite weak band at 996 nm due to the combination of the first overtone of the O-H stretching and the first overtone of the H-O-H bending mode. A slightly stronger band around 1200 nm is due to the combination of the H-O-H bending and the first overtone of the O-H stretching mode. The triplet at 1446, 1494, and 1540 nm is mainly due to the first overtone of the O-H stretching mode. The broad band around 1750 nm is due to the presence of several signals corresponding to the combination of H-O-H bending, O-H stretching, and low frequency vibration modes of structural water molecules. The strong band, composed of two bands at 1942 and 1968 nm, is also due to the presence of several signals attributed to the combination of the O-H stretching and the H-O-H bending modes (Crowley, 1991). According to the work of Liu (2018), the combination bands around 1700 nm and the ones around 2200–2300 nm are assigned to the combination modes of SO4 2− and H2O vibrations.

The VisNIR spectra of the synthesized salts
The spectrum of syngenite (Fig. 7B) is characterized by bands at 1256 nm (a combination of the H-O-H bending mode and the first overtone of the O-H stretching mode), two overlapped bands at 1498 and 1577 nm (the first overtone of the O-H stretching mode), and 1775 nm (a combination of the H-O-H bend and the O-H stretch and vibration modes of the water molecules), and 1990 and 2082 nm could be associated with the combination of the O-H stretching and the H-O-H bending modes. Finally, the bands at 2190, 2329, and 2422 nm are due to the combination of the O-H stretch with the first overtone of the water vibration modes (Crowley, 1991).
Finally, the VisNIR spectrum of görgeyite (Fig. 7C) is reported here for the first time. Even though it cannot be compared with any previous spectra, it is likely that the observed bands are similar to the vibrations observed for gypsum and syngenite. Therefore, the following assignments are proposed for the görgeyite VisNIR spectrum: 984 nm is proposed to be due to the combination of the first overtone of the H-O-H bending and the first overtone of O-H stretching modes, and 1178 and 1340 nm are proposed to be associated with the combination of the H-OH bending and the first overtone of the O-H stretch modes. As for gypsum and syngenite, the bands around 1400 nm (specifically 1444, 1489, and 1566 nm) are proposed to be associated with the first overtone of the O-H stretch modes, and the bands at 1753 and 1800 nm that form a doublet are proposed to be related to the combination of the bend of H-O-H, the stretch of O-H, and vibration of the water molecules. Bands at 1932, 1990, and 2081 nm are due to the combination of water together with the O-H stretching mode, and bands at 2187 and 2429 nm are attributed to a combination of the O-H stretch and the first overtone of the water and the combination modes of SO4 2−.
Due to the lower hydration levels, syngenite and especially görgeyite show narrower bands, which is indicative of fewer water molecules per formula unit. In consequence, less absorption band overlapping is observed in comparison to the gypsum VisNIR spectrum (Crowley, 1991).
4. Conclusions
The study of sulfate systems is very important because some organic compounds such as amino acids and amines are likely to be preserved for geologically long periods in sulfate matrices (Aubrey et al., 2006), and therefore, they are one of the main targets to be explored in the upcoming orbiting and landed missions on Mars. As demonstrated here, under the proper ion concentrations in solution, syngenite (K2Ca(SO4)2·H2O) easily precipitates without the need for hydrothermal conditions. Depending on the ion concentrations, it precipitates as the major compound or together with gypsum in different proportions. There are several instances reported in the literature where the formation of syngenite in efflorescent salts, which also occur under low temperatures, is described. Syngenite has been found in black crusts in the walls of the Belgrade Fortress, Serbia (Matović et al., 2012), in decayed mortars affected by marine aerosols in buildings of the Basque Coast (Morillas et al., 2015), in efflorescence salts in the House of Gilded Cupids, Pompeii, Italy (Prieto-Taboada et al., 2018), and in white crystalline speleothems in Tausoare Cave in Romania (Onac et al., 2016). These observations show how different terrestrial atmospheric conditions can lead to the formation of syngenite if adequate concentrations of dissolved ions are present to reach saturation.
Thus, it is highly possible that syngenite could also be found with gypsum on Mars without the need for a hydrothermal environment to have been present. In particular, as discussed in Section 1 of this article, calcium sulfates at Endeavour and Gale craters that have sulfate/calcium molar ratios >1 (McLennan et al., 2005; Squyres et al., 2012; Arvidson et al., 2014; Grotzinger et al., 2014; Nachon et al., 2014; Rapin et al., 2016; Yen et al., 2017) could be a mixture of sulfates, such as gypsum and syngenite.
It must also be highlighted that, at higher temperatures, görgeyite (K2Ca5(SO4)6·H2O) is another possible sulfate that might be formed and should be taken into account when considering sulfates formed under hydrothermal conditions.
The spectroscopic characterization of these three salts demonstrates the possibility to differentiate among them when using Raman spectroscopy and/or VisNIR spectroscopy. Furthermore, if two of the salts are simultaneously present, this could be detected by using band decomposition to obtain the individual spectroscopic bands or by fitting the experimental spectra to the theoretical spectra obtained by assuming a given percentage (i.e., X %) for one of the salts and (100-X) % for the other. Whatever the procedure is, we need to have standard spectra of the pure compounds in our databases that will help in the identification of these minerals on Mars, especially if organic remains are going to be detected in such mineral matrices as suggested by some authors (Bridges and Grady, 2000; Aubrey et al., 2006; Barbieri and Stivaletta, 2011; Benison and Karmanocky, 2014; François et al., 2016; Tan et al., 2018; Johnsons et al., 2020).
Footnotes
Acknowledgments
P.R.-G. and I.T.-F. are grateful to the UPV/EHU for their predoctoral contracts, as J.H. is to the Basque Government for her predoctoral contract. J.A., L.G.-N., and C.G.-F. thank the postdoctoral contracts from the UPV/EHU.
Author Disclosure Statement
No competing financial interests exist.
Funding Information
This work has been supported through the Raman On Mars project: “Contribution of the Raman spectroscopy to the exploration of Mars and Martian Moons: ExoMars, Mars2020 and AMX missions (RamOnMars)” (Grant No. PID2019-107442RB-C-31), funded by the Spanish Agency for Research (funded by the Spanish Ministry of Science and Innovation, MICINN, and the European Regional Development Fund FEDER), and the Strategic Project “Terrestrial and Planetary Alteration Processes” (Grant No. UPV/EHU PES18/57) funded by the University of the Basque Country (UPV/EHU).
Supplementary Material
Supplementary Figure S1
Abbreviations Used
References
Supplementary Material
Please find the following supplemental material available below.
For Open Access articles published under a Creative Commons License, all supplemental material carries the same license as the article it is associated with.
For non-Open Access articles published, all supplemental material carries a non-exclusive license, and permission requests for re-use of supplemental material or any part of supplemental material shall be sent directly to the copyright owner as specified in the copyright notice associated with the article.