
Abstract
Traces of life may have been preserved in ancient martian rocks in the form of molecular fossils. Yet the surface of Mars is continuously exposed to intense UV radiation detrimental to the preservation of organics. Because the payload of the next rovers going to Mars to seek traces of life will comprise Raman spectroscopy tools, laboratory simulations that document the effect of UV radiation on the Raman signal of organics appear critically needed. The experiments conducted here evidence that UV radiation is directly responsible for the increase of disorder and for the creation of electronic defects and radicals within the molecular structure of S-rich organics such as cystine, enhancing the contribution of light diffusion processes to the Raman signal. The present results suggest that long exposure to UV radiation would ultimately be responsible for the total degradation of the Raman signal of cystine. Yet because the degradation induced by UV is not instantaneous, it should be possible to detect freshly excavated S-rich organics with the Raman instruments on board the rovers. Alternatively, given the very short lifetime of organic fluorescence (nanoseconds) compared to most mineral luminescence (micro- to milliseconds), exploiting fluorescence signals might allow the detection of S-rich organics on Mars. In any case, as illustrated here, we should not expect to detect pristine S-rich organic compounds on Mars, but rather by-products of their degradation.
1. Introduction
Today, the surface of Mars resembles a hyper-arid desert. This is in stark contrast to what is recorded in the late Noachian to early Hesperian rocks of the Southern Hemisphere: valley networks, paleolakes, and canyons all point to Mars being more habitable in its geological past (Fassett and Head, 2008; Grotzinger et al., 2014; Wordsworth, 2016; Ramirez and Craddock, 2018). Because Mars currently lacks global plate tectonics, a unique record of ancient biological processes has thus possibly remained in the subsurface of Mars in the form of molecular fossils (McMahon et al., 2018). Identifying on Mars the geological formations that potentially preserved organic biosignatures and studying them with appropriate instrumentation, both in situ and after their return to Earth, are now strategic priorities. This is why both NASA and ESA-Roscosmos are sending rovers to Mars (the NASA Mars 2020 Perseverance rover will land on Mars in February 2021, and the ESA-Roscosmos ExoMars Rosalind Franklin rover will take off in 2022), with the primary goal of searching for ancient traces of life likely under the form of organic compounds (Farley and Williford, 2017; Vago et al., 2017).
Historically, no organic compounds were detected in martian soils by the pyrolysis gas chromatograph mass spectrometer (GCMS) on board the Viking landers besides small Cl-rich compounds which were interpreted back then as contamination (Biemann et al., 1976, 1977). About 30 years later, the Phoenix lander reported the widespread presence of perchlorates (Hecht et al., 2009), leading Navarro-González et al. (2010) to suggest that the Cl-rich compounds detected by the Viking landers were produced by reactions of martian organic materials with perchlorates during the pyrolytic measurements. This view has since been supported by laboratory experiments (Steininger et al., 2012; Glavin et al., 2013; Miller et al., 2015; François et al., 2016; Guzman et al., 2018) and confirmed by the detection of Cl-rich organics by Sample Analysis at Mars (SAM), the pyrolysis GCMS on board Curiosity (Leshin et al., 2013; Ming et al., 2014; Freissinet et al., 2015; Eigenbrode et al., 2018; Szopa et al., 2020). In addition, diverse pyrolysis products, including S-rich organics, were recently detected by SAM (Eigenbrode et al., 2018), confirming the presence of organic compounds in the subsurface of Mars.
Still, the surface of Mars is known to be hostile for organic molecules: it is bombarded by ionizing radiation that can alter organic compounds (Fornaro et al., 2018; Fox et al., 2019). The thin CO2 atmosphere of Mars absorbs most X-rays and far-UV radiation, but it lets mid- and near-UV photons in the range 190–410 nm, γ-rays, solar energetic protons, and galactic cosmic rays reach the surface (Patel et al., 2002; Dartnell et al., 2007; Hassler et al., 2014). Even though UV photons do not penetrate that much below the surface (Carrier et al., 2019), they can degrade organic compounds in timescales shorter than higher-energy particles capable of penetrating up to 2 m (days vs. hundreds of millions of years; Fornaro et al., 2018; Fox et al., 2019). Although UV radiation can be responsible for the production of photoresistant compounds in some cases (such as benzenehexacarboxylic acid-trianhydride; Stalport et al., 2009), a number of studies, mostly relying on gas chromatography–mass spectrometry or Fourier transform infrared spectroscopy (FTIR), or both, have shown that the exposure to UV radiation leads to the rather fast photodecomposition of organic compounds (ten Kate et al., 2005; Stalport et al., 2009, 2019; Hintze et al., 2010; ten Kate, 2010; Poch et al., 2013, 2014; Fornaro et al., 2018), which implies that the quest for organics relies on their preservation in deeper levels of the regolith. To this purpose, upcoming missions to Mars will embark Raman spectroscopy instruments (Abbey et al., 2017; Rull et al., 2017; Wiens et al., 2017; Sapers et al., 2019; Beyssac, 2020) combined with excavating tools. In the present study, we thus examine how S-rich organics such as cystine would react when freshly excavated and exposed to UV radiation, with a focus on the modifications of the Raman and luminescence signals.
2. Materials and Methods
2.1. Irradiation experiments
For the present study, we exposed pure cystine (SCH2CH(NH2)CO2H)2, Sigma-Aldrich, purity ≥98%, to UV radiation. Cystine is a dimer of amino acids and is composed of two cysteines linked by a disulfide bond. S-rich organics have been found on Mars (Eigenbrode et al., 2018), and amino acids are common in chondrites (Kvenvolden et al., 1970; Martins et al., 2007, 2015), which justifies the selection of cystine for these experiments.
We used a mechanical press to form stubs of compressed polycrystalline samples (40 mg of cystine was pressed at 2 tons onto a stub 1 cm in diameter, leading to a final thickness of about 0.5 mm). Irradiation experiments were conducted in a dedicated Mars chamber built by the Cellule Projet @ Institut de Minéralogie, de Physique des Matériaux et de Cosmochimie (IMPMC) in which samples are exposed to UV radiation under controlled pressure and temperature conditions.
Here, experiments were conducted at 0°C under a primary vacuum. ten Kate et al. (2006) demonstrated that a martian atmosphere (6 mbar of CO2) has no influence on the UV-induced degradation of amino acids. Thus, a martian-like CO2 atmosphere was not introduced into the chamber to prevent absorption of UV by CO2 and contamination from air. Samples were exposed to UV produced by a 150 W Xenon lamp (©LOT-ORIEL). Of note, this is the exact same lamp on which the Mars Organic Molecule Irradiation and Evolution (MOMIE) setup relies (Stalport et al., 2009, 2019; Poch et al., 2013, 2014). This lamp delivers a UV spectrum (190–400 nm) with a pattern similar to that of the martian surface radiation spectrum (Patel et al., 2002; Dartnell et al., 2007; Hassler et al., 2014) but with a higher flux (Stalport et al., 2009, 2019; Poch et al., 2013, 2014), which thereby accelerates processes compared to true martian conditions.
The Raman signatures and fluorescence lifetimes of cystine samples were measured before and after 10, 100, and 1000 min of exposure to UV radiation directly in the Mars chamber, that is, under the conditions of the irradiation experiments. After 1000 min of irradiation, samples were removed from the chamber and measured with attenuated total reflectance Fourier transform infrared (ATR-FTIR) and electron spin resonance (ESR) spectroscopies. The comparison with spectra of pristine cystine allowed for documentation of the impact of UV radiation of the chemical structure and radical content of this S-rich dimer of amino acids. Note that the contribution of the volume of irradiated cystine to the measured signals differed from one technique to another, challenging a straightforward comparison between the data.
2.2. Time-resolved Raman spectroscopy
The remote configuration of a customized time-resolved Raman and luminescence spectrometer built at IMPMC was used for the present study (Fau et al., 2019). Relying on a conventional Schmidt-Cassegrain telescope (Celestron-C8 ∼ 202 mm diameter Schmidt plate), this instrument allows for Raman signal collection of pristine and irradiated samples without removing them from the chamber in which the irradiation experiments are conducted. The laser is a nanosecond-pulsed 532 nm diode-pumped solid-state (DPSS) laser (1.2 ns full width at half maximum [FWHM], 1 mJ per pulse) with a 10–2000 Hz repetition rate. The fine control and synchronization of both time delay and gating time of the camera allows sub-nanosecond time resolution experiments.
For the present study, the laser was collimated at the sample surface (at 8 m from the telescope Schmidt plate) on a spot of ∼6 mm diameter, corresponding to a preservative irradiance of about ∼1010 W · m−2 (Fau et al., 2019). The Raman signal was collected by the telescope from a surface with a slightly lower diameter than the co-aligned incident laser beam. A Notch filter was used to cut off the Rayleigh scattering below ∼90 cm−1, and the signal was collected by an optical fiber and sent into a modified Czerny-Turner spectrometer (Princeton IsoPlane 320) coupled with a Princeton PIMAX4 intensified charge-coupled device (ICCD) camera. This spectrometer has three motorized gratings that can be selected depending on the spectral window and spectral resolution requested for the analysis.
We collected Raman and fluorescence signals using a 1.2 ns ICCD gate centered on the laser pulse. To maximize the signal-to-noise ratio, we accumulated the signals corresponding to 500,000 laser shots. The fluorescence lifetime of cystine samples (i.e., the characteristic time spent by fluorescing centers to return from excited states to ground states; Beyssac 2020; Pasteris and Beyssac 2020) was investigated by collecting the background signal obtained and using a 1.2 ns ICCD gate for different delays after the laser pulse with a time resolution of 0.1 ns.
2.3. ATR-FTIR measurements
ATR-FTIR spectra of cystine samples were collected directly on the stubs, before and after exposure to UV radiation for 1000 min, over the 500–4000 cm−1 range with a 1 cm−1 resolution using a Nicolet 6700 FTIR spectrometer fitted with a KBr beam splitter and a detector for Fourier transform spectroscopy (DTGS)-KBr detector operating at IMPMC (Li et al., 2014; Bernard et al., 2015). The spectra shown here correspond to the average of 100 scans obtained in an attenuated total reflectance (ATR) geometry using a Specac Quest ATR device fitted with a diamond internal reflection element.
2.4. ESR measurements
ESR spectroscopy, also called electron paramagnetic resonance (EPR), allows for investigation of the presence of unpaired electrons and provides detailed information on structure bonding of paramagnetic species in samples exposed to ionizing radiation. ESR investigations were conducted at ambient temperature on powdered pristine cystine and cystine irradiated for 1000 min, using a BRUKER ESP 300E spectrometer operating at IMPMC (Sorieul et al., 2005). Samples were filled in a pure silica tube (Suprasil grade), and the microwave power was set at 1 mW, while the amplitude and frequency of the magnetic field modulation were 0.5 mT and 100 kHz, respectively. The signal was collected over the 0.3200–0.3800 T range. The effective g-factor of the observed signals was determined by using the relation: hν = gβH where ν is the microwave frequency, H the magnetic field, h the Planck constant, and β the Bohr magneton. A diphenyl-picryl-hydrazyle (DPPH, g = 2.0037 ± 0.0002) standard was used for calibration.
3. Results
3.1. Raman spectroscopy and fluorescence
The Raman spectrum of pristine cystine exhibits a large number of bands that result from the stretching, bending, and rocking of O-C = O, C-S, C-H, and N-H bonds (Fig. 1). In particular, it displays a quite intense band at 499 cm−1 (Fig. 1) that results from the stretching of disulfide bridges (S-S bonds), an important component of the structure of proteins (Annis et al., 1997). The exposure to UV does not lead to the appearance of any new Raman band. With increasing exposure to UV radiation, the continuous background contribution increases (by a factor of 5 after 1000 min of exposure to UV), while the intensities of the Raman bands of cysteine decrease (down to 1/3 of the initial intensities after 1000 min of exposure to UV) (Fig. 1). Such decrease in intensity appears similar for all modes, even though S-S bonds are known to be less strong/resistant than C-C and C-H bonds (Annis et al., 1997; Nagy, 2013). Given the short time gate used in these experiments, the background signal may correspond to light diffusion processes related to disorder and/or to the intrinsic fluorescence of the cystine samples investigated. The intrinsic fluorescence of organic compounds (molecular fluorescence) represents a quantum process where an absorbed light quantum is reemitted as light, generally at a different frequency (Weiss, 1943). In contrast to the signal that corresponds to light diffusion, which is contemporaneous of the laser pulse and can thus be modeled by a Gaussian function as a function of time, a fluorescence signal can be modeled by an exponential law as a function of time (Berezin and Achilefu, 2010). Here, the measured signal can be decomposed into a sum of a Gaussian function and an exponential function:

Raman spectra centered at 1200 (
with I
0.1 and I
0.2 the maximal intensity at t = 0 and τ1 and τ2 the lifetimes of the light diffusion and of the fluorescence signals. In such a scheme, the contribution of light diffusion to the measured signal corresponds to

Semi-log diagram of the signal intensity as a function of the time after the laser pulse for pristine and irradiated cystine samples. Data are normalized to their maximum intensity, and t = 0 is defined for the maximum intensity of the signal. Dotted lines represent the model described in Eq.1. Fitted τ1 values are 2 ns for pristine cystine and cystine irradiated for 10 min and 1.6 ns for cystine irradiated for 100 and 1000 min. Fitted τ2 values are 4.4 ns for pristine cystine and cystine irradiated for 10 min and 4.3 ns for cystine irradiated for 100 and 1000 min. Color images are available online.
3.2. Complementary characterization using ATR-FTIR and ESR spectroscopy
Irradiated cystine samples were removed from the chamber after exposure to UV to be measured by FTIR and ESR spectroscopies. The FTIR spectrum of pristine cystine exhibits a number of sharp and intense peaks below 1800 cm−1 as well as some large and less intense bands above 2000 cm−1, attributed to the stretching, bending, and rocking of S-S, O-C = O, C-S, C-H, and N-H bonds (Fig. 3; Li et al., 2014; Bernard et al., 2015). All these features are still present in the spectrum of cystine irradiated for 1000 min, and no new feature is noticed (Fig. 3). Still, exposure to UV radiation impacted the shape of the absorption features: irradiated cystine exhibits less intense but broader signals than pristine cystine (Fig. 3). For instance, the intensity of the peak at 539 cm−1, attributed to the rocking mode of O-C = O bonds, is 4 times higher for pristine cystine, while its FWHM is 2 times larger for irradiated cystine.

ATR-FTIR spectra of pristine cystine and cystine irradiated for 1000 min. Note that spectra were not shifted in intensity (y axis). The indexation of infrared bands is based on (1) Zhu et al., 2011; (2) Pawlukojć et al., 2005. Color images are available online.
The ESR spectra of irradiated cystine mostly display two overlapping anisotropic signals (Fig. 4) similar to those previously observed by Thomsen and Nielsen (1972) in UV-irradiated cystine dihydrochloride. Radical I displays the following principal values of the g-tensor: gx = 2.052, gy = 2.027, and gz = 2.004; while radical II is characterized by gx = 2.060, gy = 2.034, and gz = 1.995 (Fig. 4). Although radical I was initially ascribed to a monosulfide species, further investigations (Hadley and Gordy, 1974; Nelson and Symons, 1975) and modeling (Engström et al., 2000) have indicated that these two radicals correspond to paramagnetic disulfide species. The spectrum of pristine cystine displays similar paramagnetic signals at lower intensity. The shape of this spectrum, however, differs from that of the irradiated sample, with an anisotropic broadening of the gx components and a more pronounced contribution at gx = 2.065. The observed changes of g-values could be related to modifications of the charge state (cationic, anionic, neutral) or geometric configuration of the molecular environment of disulfide bridges (Engström et al., 2000). The ESR spectrum thus reveals a slightly different environment and an increase in the concentration of disulfide paramagnetic species in irradiated cystine (Fig. 4). Quantifying these concentration changes is unfortunately not possible here because the volume of sample effectively affected by the UV radiation remains difficult to determine.
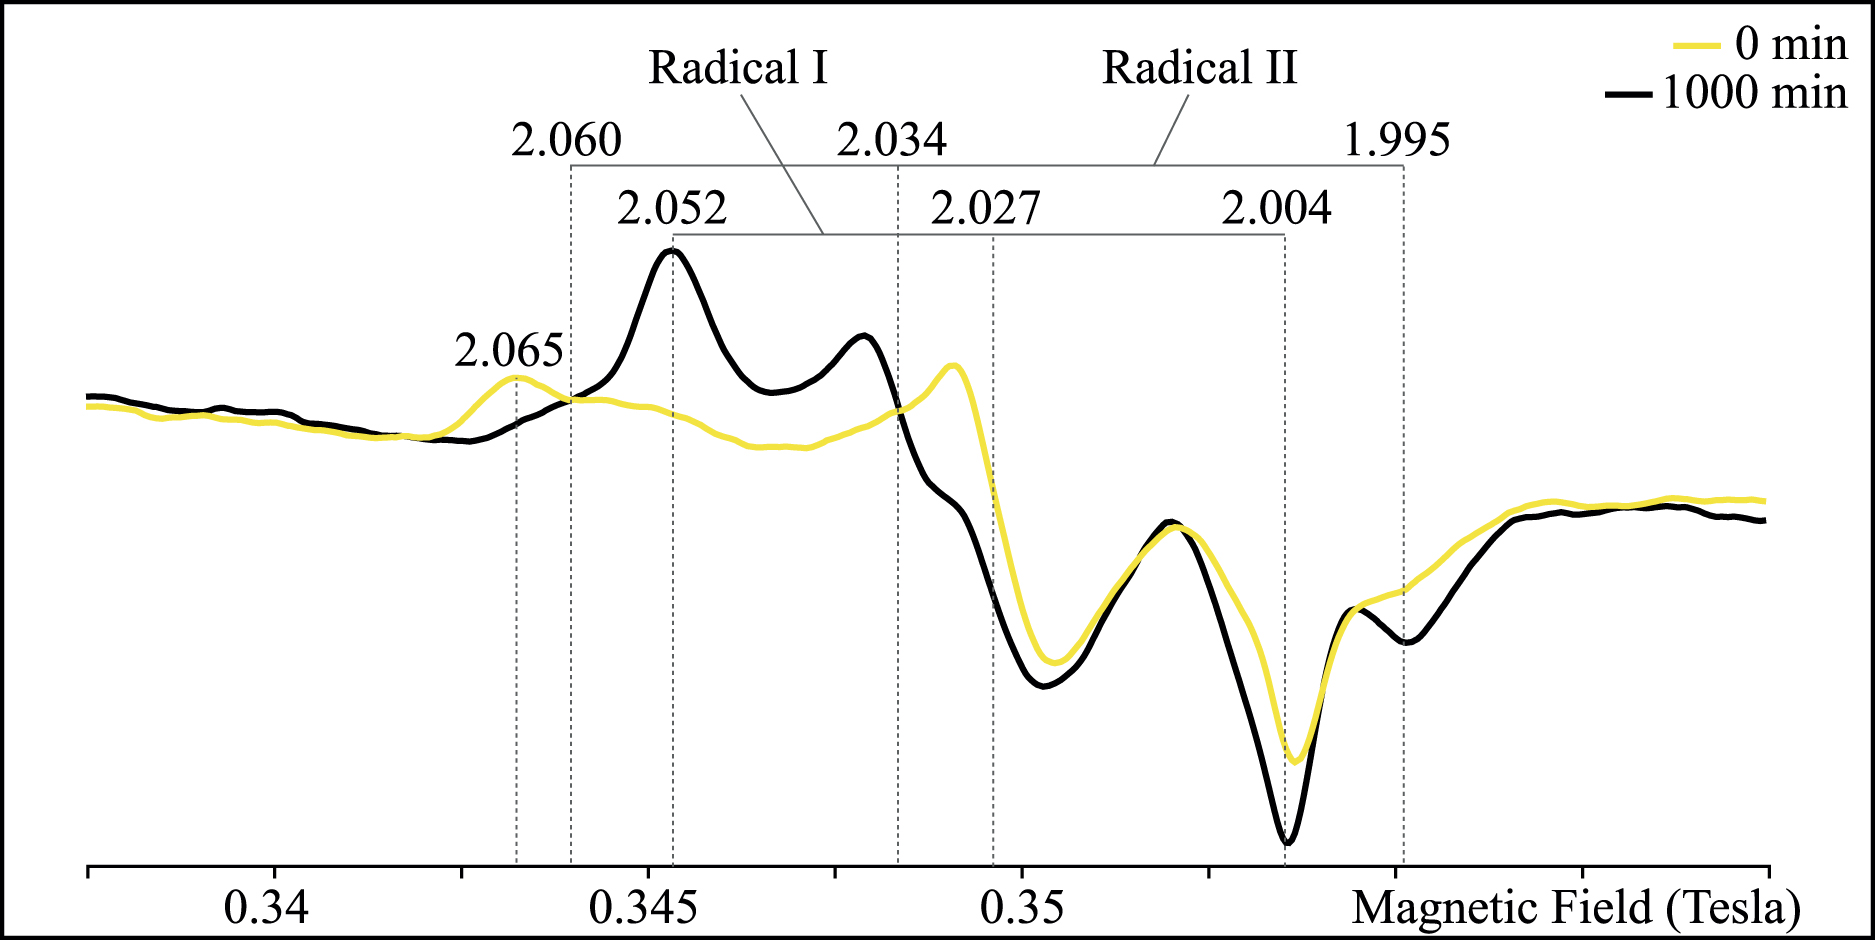
ESR spectra of pristine cystine and cystine irradiated for 1000 min. Indexations correspond to the principal values of the g-tensor. Color images are available online.
4. Discussion
4.1. Impact of exposure to UV radiation
The Raman and FTIR spectra of cystine irradiated for 1000 min under Mars conditions still exhibit all the features observed in the Raman and FTIR spectra of pristine cystine (Figs. 1 and 3). Still, the multi-technique approach adopted for the present study demonstrates that exposure to UV radiation strongly impacts cystine samples by triggering the creation of defects and radicals within the molecular structure of cystine. The cystine samples turned yellow during exposure to UV radiation, which suggests the creation of defects or colored centers, or both, and potentially explains the evolution of Raman and FTIR signals. These defects do not seem to be fluorescing centers; in such a case, one would expect an increasing contribution of fluorescence to the collected Raman signal with increasing duration of exposure to UV radiation (Winkler et al., 1998; Dumeige et al., 2004). Plus, concentration quenching would decrease the lifetime of fluorescence, as reported for both organic and inorganic materials (Chen and Knutson, 1988; Ju et al., 2013; Meza et al., 2014; Green and Buckley, 2015; Fau et al., unpublished data), which is not the case here. Still, the broadening of Raman and FTIR bands is consistent with a higher concentration of point defects in irradiated cystine compared to pristine cystine (Fig. 3). Such broadening was previously reported in a number of materials exposed to ionizing radiation (e.g., Fourdrin et al., 2009). Consistently, the differences between the ESR spectra of pristine and irradiated cystine demonstrate that exposure to UV radiation was responsible for the creation/formation of a new population of radicals associated to disulfide bridges. Whether the radicals detected by ESR are the defects responsible for the broadening of Raman and FTIR bands remains difficult to determine, recalling that only the paramagnetic fraction of a defect population can be detected when using ESR. Obviously, quantitatively documenting the response of cystine to exposure to UV radiation will require monitoring the mass loss as a function of the dose.
4.2. Need for additional aging experiments
Our results suggest that long exposure to UV radiation would ultimately be responsible for the total degradation of the Raman signal of cystine. It follows that the detection of S-rich organics at the surface of Mars may be problematic, especially considering the many unknowns that remain. Here, we exposed crystalline cystine to UV radiation, but the response of amorphous cystine may be different. Also, as previously demonstrated, different organics do not react in similar ways when exposed to UV (ten Kate et al., 2005; Stalport et al., 2009, 2019; Hintze et al., 2010; ten Kate, 2010; Poch et al., 2013, 2014; Fornaro et al., 2018). The effect of exposure to UV radiation on the Raman signal of other organic compounds thus will need to be further investigated. The same is true for the impact of other types of radiation. In fact, γ-rays, solar energetic protons, and galactic cosmic rays are not absorbed by the thin CO2 atmosphere of Mars and can penetrate the martian subsurface to several meters of depth, potentially altering organic compounds (Kminek and Bada, 2006; Dartnell et al., 2007; Hassler et al., 2014; Fox et al., 2019). In addition, because minerals may play a key role in the UV-induced degradation of organics (Poch et al., 2015; dos Santos et al., 2016; Ertem et al., 2017; Fornaro et al., 2018), it appears crucial to investigate the effects of mineral matrices typical of martian soils. Finally, many other aging processes likely act simultaneously at the surface of Mars, including oxidation (Lasne et al., 2016) and degradation induced by fluid circulation (Viennet et al., 2019). The impact of all these processes will have to be taken into account for the proper interpretation of future data.
4.3. Detection of S-rich organics on Mars using Raman
Here, we demonstrate that the detection of S-rich organics using Raman is achievable in freshly excavated martian samples, even though such samples would be quickly degraded by UV radiation. Note that the Raman instruments on board Perseverance and Rosalind Franklin will rely on different setups and strategies (Abbey et al., 2017; Rull et al., 2017; Wiens et al., 2017; Sapers et al., 2019; Beyssac, 2020). The RLS instrument on board Rosalind Franklin is a continuous Raman system that relies on a 532 nm laser, the SuperCam instrument on board Perseverance is a time-resolved Raman luminescence spectrometer that uses a pulsed 532 nm laser, and the SHERLOC instrument on board Perseverance will be a deep UV Raman and fluorescence spectrometer (Abbey et al., 2017; Rull et al., 2017; Wiens et al., 2017; Sapers et al., 2019; Beyssac, 2020). Here, we show that the Raman spectrum of cystine that has been exposed to UV radiation for a relatively short period of time still exhibits the Raman spectral features of pristine cystine as well as a fluorescence signal that remains similar in intensity and lifetime. These results thus suggest that it should be possible to detect freshly excavated S-rich organics on Mars, that is, S-rich organics only exposed to UV for a short time, when using any of the Raman instruments on board the upcoming rovers, provided that such S-rich organics are present in concentrations above the detection limits and that the fluorescence of the mineral matrix does not dominate the signal. In addition, given the very short lifetime of the intrinsic molecular fluorescence of S-rich organics such as cystine (nanoseconds) compared to most mineral luminescence (micro- to milliseconds), SuperCam and SHERLOC may also be able to detect S-rich organics on Mars by exploiting fluorescence signals. In any case, we should not expect to detect pristine S-rich organic compounds on Mars, but rather by-products of their degradation.
Footnotes
Acknowledgments
We acknowledge the support of the IMPMC spectroscopy platform, and we thank Elisabeth Malassis (IMPMC) for administrative simplification. We acknowledge financial support from the program Emergences Alliance Sorbonne Université (Project MarsAtLab—PI: S. Bernard). The authors declare that there is no conflict of interest.