
Abstract
The search for organic biosignatures on Mars will depend on finding material protected from the destructive ambient radiation. Solar ultraviolet can induce photochemical degradation of organic compounds, but certain clays have been shown to preserve organic material. We examine how the SHERLOC instrument on the upcoming Mars 2020 mission will use deep-ultraviolet (UV) (248.6 nm) Raman and fluorescence spectroscopy to detect a plausible biosignature of adenosine 5′-monophosphate (AMP) adsorbed onto Ca-montmorillonite clay. We found that the spectral signature of AMP is not altered by adsorption in the clay matrix but does change with prolonged exposure to the UV laser over dosages equivalent to 0.2–6 sols of ambient martian UV. For pure AMP, UV exposure leads to breaking of the aromatic adenine unit, but in the presence of clay the degradation is limited to minor alteration with new Raman peaks and increased fluorescence consistent with formation of 2-hydroxyadenosine, while 1 wt % Mg perchlorate increases the rate of degradation. Our results confirm that clays are effective preservers of organic material and should be considered high-value targets, but that pristine biosignatures may be altered within 1 sol of martian UV exposure, with implications for Mars 2020 science operations and sample caching.
1. Introduction
The search for biosignatures on Mars is a primary objective for NASAs Mars 2020 mission, and the mission's rover (recently named Perseverance) will be exploring Jezero Crater, the site of an ancient lake and river delta that are rich in minerals with high biosignature preservation potential (Goudge et al., 2015; Hays et al., 2017; Horgan et al., 2020).
Perseverance is equipped with multiple scientific instruments designed to detect organic material that may be evidence of ancient and/or extant life on the Red Planet (Williford, 2018). One of these instruments is SHERLOC (Scanning Habitable Environments using Raman and Luminescence for Organics and Chemicals), a robotic arm-mounted deep-ultraviolet (DUV) Raman and fluorescence spectrometer designed to investigate surface targets in the rover's workspace, mapping them in terms of their mineral and organic composition at the submillimeter scale (Beegle et al., 2015; Beegle et al., 2020). The use of techniques such as DUV spectroscopy, which can analyze a target in situ without breaking, consuming, or destroying it, is essential to the mission's goal of identifying and selecting samples of high scientific value for caching and eventual return to Earth (Beaty et al., 2019).
SHERLOC's combined functionality for both Raman and fluorescence spectroscopy provides sensitivity to chemical structure and detection of organics even at low concentrations. The specificity of Raman peaks to molecular vibrations produces effectively unique spectra that allow structurally similar molecules to be distinguished spectroscopically, even in the presence of mineral phases (Asher, 1984; Tarcea et al., 2007; Sapers et al., 2019; Razzell Hollis et al., 2020b; Martin et al., 2020). SHERLOC uses a DUV laser as an excitation source (λex = 248.56 nm), which coincides with the strong ultraviolet (UV) absorption band of many aromatic organic molecules that are relevant to biological processes on Earth.
This leads to strong fluorescence, which is less specific to chemical structure but can be detected at concentrations <1 ppm (Bhartia et al., 2008; Beegle et al., 2015; Abbey et al., 2017), and also permits molecular resonance, a phenomenon that increases Raman scattering from the aromatic unit by ∼1000 times versus nonresonant excitation (Long, 1977; Asher, 1984). The use of DUV excitation also avoids the spectral overlap of Raman and fluorescence that is problematic for visible excitation Raman, as DUV Raman peaks occur in a narrow wavelength range (circa 250–275 nm) before the onset of fluorescence (Asher, 1984; Beegle et al., 2015; Abbey et al., 2017; Beegle et al., 2020).
One of the key challenges faced by Mars 2020 and the search for martian biosignatures in general is the likelihood that organic material produced by biological processes 3–4 billion years ago will be sufficiently preserved to be detectable to instruments such as SHERLOC onboard Perseverance. Organic molecules on the surface of Mars are subject to intense oxidative and photochemical degradation driven by the harsh martian environment, with UV being a major contributor to degradative stress (Benner et al., 2000; Yen et al., 2000; ten Kate et al., 2005; Hecht et al., 2009; Moores and Schuerger 2012; Fornaro et al., 2018b). Present-day Mars' thin atmosphere and lack of a protective ozone layer mean that the surface experiences ∼10 × more damaging UV radiation than on Earth (Cockell, 2000). This comes in the form of UVB (280–315 nm) and UVC (200–280 nm) irradiation, which are sufficiently energetic (>4 eV or >400 kJ/mol) to damage biomolecules such as DNA and kill microorganisms (Cockell et al., 2005). This damage occurs through the breaking of chemical bonds, the formation of radicals, and other photochemical reactions that will make it difficult to assess the origin and/or biological significance of any organics detected.
To mitigate this, Perseverance will use an abrasion tool to expose the subsurface (>1 cm) of a target, where UV light is less likely to penetrate (Williford, 2018). The depth at which organic material will be protected from UV depends on the composition of the rock and its ability to attenuate UV: Fe-bearing minerals are particularly effective at blocking UV light within 500 μm (Chen et al., 1979), while 500–1000 μm of basaltic/palagonitic dust provides a similar level of shielding (Mancinelli and Klovstad, 2000; Muñoz Caro et al., 2006; Marschall et al., 2012). A recent study found that for four minerals relevant to Jezero Crater (gypsum, kaolinite clay, Bishop Tuff pyroclast, and the ubiquitous martian dust), there was still detectable UV at a depth of 500 μm (Carrier et al., 2019). Even when subsurface organic material is sufficiently shielded by overlying rock that it can be preserved over geological timescales, the moment that subsurface material is exposed by Perseverance's abrasion tool, it may be completely destroyed within as little as 5 martian solar days (sols) once exposed to direct UV radiation (Ertem et al., 2017).
The presence of certain minerals can also have a marked impact on the photochemical stability of organic biosignatures with respect to UV radiation—several studies have shown that various minerals can act to promote or inhibit degradation of organic molecules (Fornaro et al., 2013, 2018a, 2018b; Hays et al., 2017; Laurent et al., 2019). Minerals rich in TiO2, Fe2+, and Fe3+ can shield organic molecules from UV light by absorption, but photocatalyze the generation of reactive oxidants that destroy amino acids (Stalport et al., 2010; dos Santos et al., 2016), while chemical and/or physical interaction between organic molecules and mineral surfaces can act to stabilize the molecule against excitation/reaction (Scappini et al., 2004).
Clay minerals are of particular interest to biosignature detection, as they possess a large surface area and have been detected in several aqueously altered locations on Mars, including Jezero Crater (Goudge et al., 2015). Smectite clays, such as montmorillonite and nontronite, consist of weakly bound phyllosilicate sheets and are known to preserve organic material through direct diffusion of smaller organic molecules into their expandable interlayer spaces (Poch et al., 2015; Ertem et al., 2017). Fornaro et al. (2018a) demonstrated that UV-induced organic degradation occurs in few hundreds of martian years for important biomarkers of extant life like nucleic acid components adsorbed on photoprotective minerals such as serpentine phyllosilicates. Sulfate- and carbonate-bearing minerals can also protect organic molecules from photochemical alteration by isolating individual molecules during crystallization (dos Santos et al., 2016).
The stability and detection of organic biosignatures can also be compromised by the presence of ∼0.5–1% by weight perchlorate in martian regoliths (Hecht et al., 2009; Kounaves et al., 2014; Carrier, 2017; Sutter et al., 2017). The Curiosity rover has previously identified indigenous organics in the lacustrine clay-bearing mudstones of Gale Crater, similar in age to Jezero, when using pyrolytic mass spectrometry (Glavin et al., 2013; Freissinet et al., 2015; Eigenbrode et al., 2018). However, laboratory experiments have shown that perchlorates decompose during pyrolytic extraction, forming reactive species that oxidize and/or chlorinate any organics present, which may account for the predominance of chlorohydrocarbons observed by Curiosity (Freissinet et al., 2015).
These adverse reactions have since been proposed as an explanation for the early Viking landers' failure to detect organic material when using similar pyrolytic techniques (Navarro-González et al., 2010). There is also mounting evidence that perchlorates may also decompose under UV irradiation (Wadsworth and Cockell, 2017), and so it is essential that we also consider whether the presence of perchlorate will affect the photochemical stability of organics under either ambient UV exposure or during interrogation by DUV spectroscopy.
Although degradation may be minimized by going to great lengths to strategically position the 75 cm diameter turret on Perseverance's robotic arm, so that it shields the abraded target from direct sunlight, understanding how the detectable properties of potential biosignatures evolve with UV exposure in different minerals means that we will be able to time surface operations, so that characterization and caching are done on pristine material before the onset of significant photodegradation. In this study, we have chosen to focus on samples representing a plausible biosignature that might be encountered by Perseverance in Jezero Crater; that is, adenosine 5′-monophosphate (AMP) mixed with Ca-montmorillonite, a smectite clay mineral. AMP is a ribonucleotide and one of the building blocks of terrestrial RNA, while montmorillonite has been identified as a potential preserver of organic material and is expected to form in a lacustrine environment such as Jezero Crater (Hays et al., 2017; Horgan et al., 2020). Adenosine has already been identified as a major contributor to the DUV Raman spectrum of DNA, as well as microbial cells, and should be considered a high-value biosignature as detectable by SHERLOC (Sapers et al., 2019). This study will examine how the spectral signature of this molecule is probed by a SHERLOC-like instrument when mixed with clay, and whether that signature is altered by interaction with clay, perchlorate, and with exposure to UV. While previous SHERLOC studies have used mechanical mixtures (Abbey et al., 2017), we used equilibrium adsorption to deposit organics in the clay matrix to create a more realistic distribution of the molecule within the test sample, maximizing molecular interactions with mineral surfaces through molecular diffusion into the clay mineral's interlayer spaces. This method is considered more representative of the natural processes of adsorption that occur in aqueous environments. This work is highly complementary to an earlier study done by Fornaro et al. (2020) on similar samples, studying how the near-infrared (NIR) signature of AMP (along with phenylalanine, glutamic acid, and phthalic acid) is influenced by organic–mineral interactions and UV irradiation.
2. Materials and Methods
2.1. Sample preparation
This experiment focused on three solid samples with the following compositions: pure adenosine 5′-monophosphate (AMP), montmorillonite clay impregnated with 5 wt % AMP, and montmorillonite first spiked with 1 wt % magnesium perchlorate, and then impregnated with 5 wt % AMP. AMP was purchased from Sigma-Aldrich (≥99%) and used as received. Montmorillonite clay SAz-1 was purchased from the Clay Mineral Society and treated to extract any organic contaminants that may have been present. Purification consisted of mixing powdered clay with the following solvents at 150 g/L and sonicating for 30 min each time: (1) 100% methanol, (2) 40% acetone in water, (3) 0.1 M sodium pyrophosphate 10-hydrate, and (4) pure water. Each extraction was followed by centrifugation to separate the clay from the supernatant. The purified clay was finally dried in an oven at 50°C. A portion of the purified clay was spiked with 1 wt % magnesium perchlorate by suspending the powdered clay in an aqueous solution of magnesium perchlorate hexahydrate (99.0%; Sigma-Aldrich) in Milli-Q water and agitating the suspension by using a magnetic stirrer to ensure homogeneous mixing.
The mixture was then dried in an oven at 40°C. Both the purified clay and the perchlorate-spiked clay have been thoroughly characterized in earlier publications (Fornaro et al., 2020). The purified and perchlorate-spiked clays were impregnated with 5 wt % AMP by dissolving the necessary mass of pure AMP in a sufficient volume of Milli-Q water and mixing the resulting solution with 100 g/L of powdered clay. Each mixture was vortexed, and then placed on a test tube rotator for ∼12 h to ensure equilibrium adsorption. Previous studies have shown that this is sufficient to allow diffusion of the organic into the interlayer spaces of smectite clays such as montmorillonite (Poch et al., 2015; Fornaro et al., 2020).
The mixtures were then dried in an oven at 40°C to remove any excess moisture. The pure AMP and the perchlorate-spiked clay mixed with 5 wt % AMP were compressed into two solid pellets to provide a flat surface for ease of characterization. Powder from each sample mixture was pressed under 3 tons of pressure into a pellet of 1.3 cm diameter encased with an aluminum cup, and the cups and press cylinder were cleaned with methanol before each pressing to avoid contamination from the workspace and between samples (Abbey et al., 2017). The purified clay mixed with 5 wt % AMP was characterized as a loose powder as there was insufficient material to prepare a pellet.
2.2. DUV spectroscopy
Raman and fluorescence spectra were measured with MOBIUS (Mineral and Organic Based Investigations using Ultraviolet Spectroscopy). MOBIUS is a custom DUV spectrometer at the NASA Jet Propulsion Laboratory with a 3-axis motorized stage for sample scanning. MOBIUS uses a 248.579 nm NeCu pulsed laser (Photon Systems, Inc.) reflected off a 248 nm RazorEdge ultrasteep long-pass edge filter (Semrock, Inc.) focused onto the sample through a chromatically corrected f/4 objective lens (ThorLabs LMU-5x-UVB). Raman scattering and fluorescence were collected in a 180° back-scattering geometry by using a Horiba 550i spectrometer with a slit width of 250 μm and recorded by a Horiba Symphony e2v 42-10 CCD liquid nitrogen-cooled (−140°C) detector.
Fluorescence measurements were performed using a 300 lines per millimeter grating with a spectral range of 250–410 nm and a spectral accuracy of 0.16 nm, while Raman measurements were performed using an 1800 lines per millimeter grating with a spectral range of 620–4200 cm−1 and a spectral binning of 3.8 cm−1 per pixel. Before data collection, wavelength values were calibrated by validating the position of the primary and secondary laser lines at 248.58 and 252.93 nm, respectively. During measurements, the laser was fired at 40 pulses per second with a pulse width of 40 μs, and the output energy of each laser pulse was recorded by a photodiode at the exit aperture of the laser, previously calibrated to the value measured previously at the sample by an Ophir sensor, and measured an average pulse energy of 2.8–3.0 μJ during this study.
Based on reported dimensions of the annular laser spot (Razzell Hollis et al., 2020b), the effective beam area (using the 1/e 2 definition) is ∼3540 μm2, and a 2.8 μJ pulse equates to an energy dosage of 0.075 J/cm2. Cosmic rays were identified as outliers in the distribution of intensity values in each Raman shift channel and replaced by the value of adjacent points (Uckert et al., 2019). Further processing was done by in-house Python scripts utilizing Numpy (Van de Walt et al., 2011), SciPy (Jones et al., 2001), and LMFIT (Newville et al., 2014) packages. Processing included outlier removal, defined by any spectrum where >10% of the spectrum was more than two standard deviations from the sample average, followed by recalculation of the average and standard deviation by using remaining spectra.
Background fluorescence was removed from Raman spectra by polynomial baseline subtraction and least-squares regression, followed by a recalibration of Raman shift values based on the position of the atmospheric N2 peak relative to its literature position of 2331 cm−1, and finally normalization to the maximum in the 800–1800 cm−1 range. See Supplementary Fig. S1 in the Supplementary Information for visualization of all processing steps. A context image was taken for each sample before scanning with a Canon camera, and microscopy was done by using the MOBIUS optics.
2.3. Ex situ characterization
Initial characterization of the samples occurred under ambient conditions, with the sample on a clean aluminum wafer in a Linkam temperature-controlled sample chamber that was not sealed. Raman scans consisted of 100 measurements done in a 10 × 10 grid with a spacing of 100 μm, for a total area of 1 mm2. Fluorescence scans consisted of 400 measurements in a 20 × 20 grid with a total area of 4 mm2. Each fluorescence measurement was integrated over 5 laser pulses and each Raman measurement over 100 pulses, with a delay between acquisitions of 0.625 and 15 s, respectively.
2.4. In situ exposure experiments
For the measurement of spectral evolution during UV exposure, the sample was placed on a clean aluminum wafer in a Linkam sample chamber under either ambient conditions or vacuum purging using an Edwards XDS5 pump with an ultimate pressure of 0.07 mbar. Each sample was purged for ∼1 h before the first dosage to remove any adsorbed gas/water. For both Raman and fluorescence, the same locations were repeatedly exposed to the laser by using a series of 5 × 5 scans, with 100 laser pulses per measurement, up to a total exposure of 1500 pulses per location. The delay between acquisitions was 2.5 s, and the total time between repeat scans was on the order of 3–4 min. The 25 spectra for each scan were averaged, and the incident DUV energy received by the sample was determined by using the average of the total laser pulse energy recorded during each measurement, to account for any variability in laser output between exposures.
2.5. Ambient UV modeling
Daily UV dosages were calculated by using the Complutense and Michigan Mars Radiative Transfer model (COMIMART) (Vicente-Retortillo et al., 2015), which includes wavelength-dependent radiative properties of the dust suspended in the martian atmosphere. UV properties were derived from Mars Color Imager (MARCI) observations (Wolff et al., 2010). The model was fed with Mastcam opacities obtained during the first three martian years of the Mars Science Laboratory mission (Lemmon et al., 2019), reducing the effect of year-to-year variations in opacities. Finally, we have calculated the mean of the UV dosages per sol in different UV bands.
2.6. Density functional theory simulations
To assign Raman peaks to specific vibrational modes and identify the product of degradation, AMP and several possible oxidation products were simulated with density functional theory (DFT) methods. Chemical structures were first geometrically and electronically optimized, and then Raman vibrational frequencies were calculated by using the Becke three hybrid exchange and the Lee–Yang–Parr (LYP) correlation functional and a basis set that employs polarization functions [B3LYP 6-31g(d,p)] (Lee et al., 1988; Becke, 1993). All calculations were carried out by using the Gaussian 09 analytical package (Frisch et al., 2009). To enable accurate comparison with experimental spectra, an empirical scaling factor of 0.961 was applied to the simulated spectra (Alecu et al., 2010).
3. Results
3.1. The DUV spectra of AMP
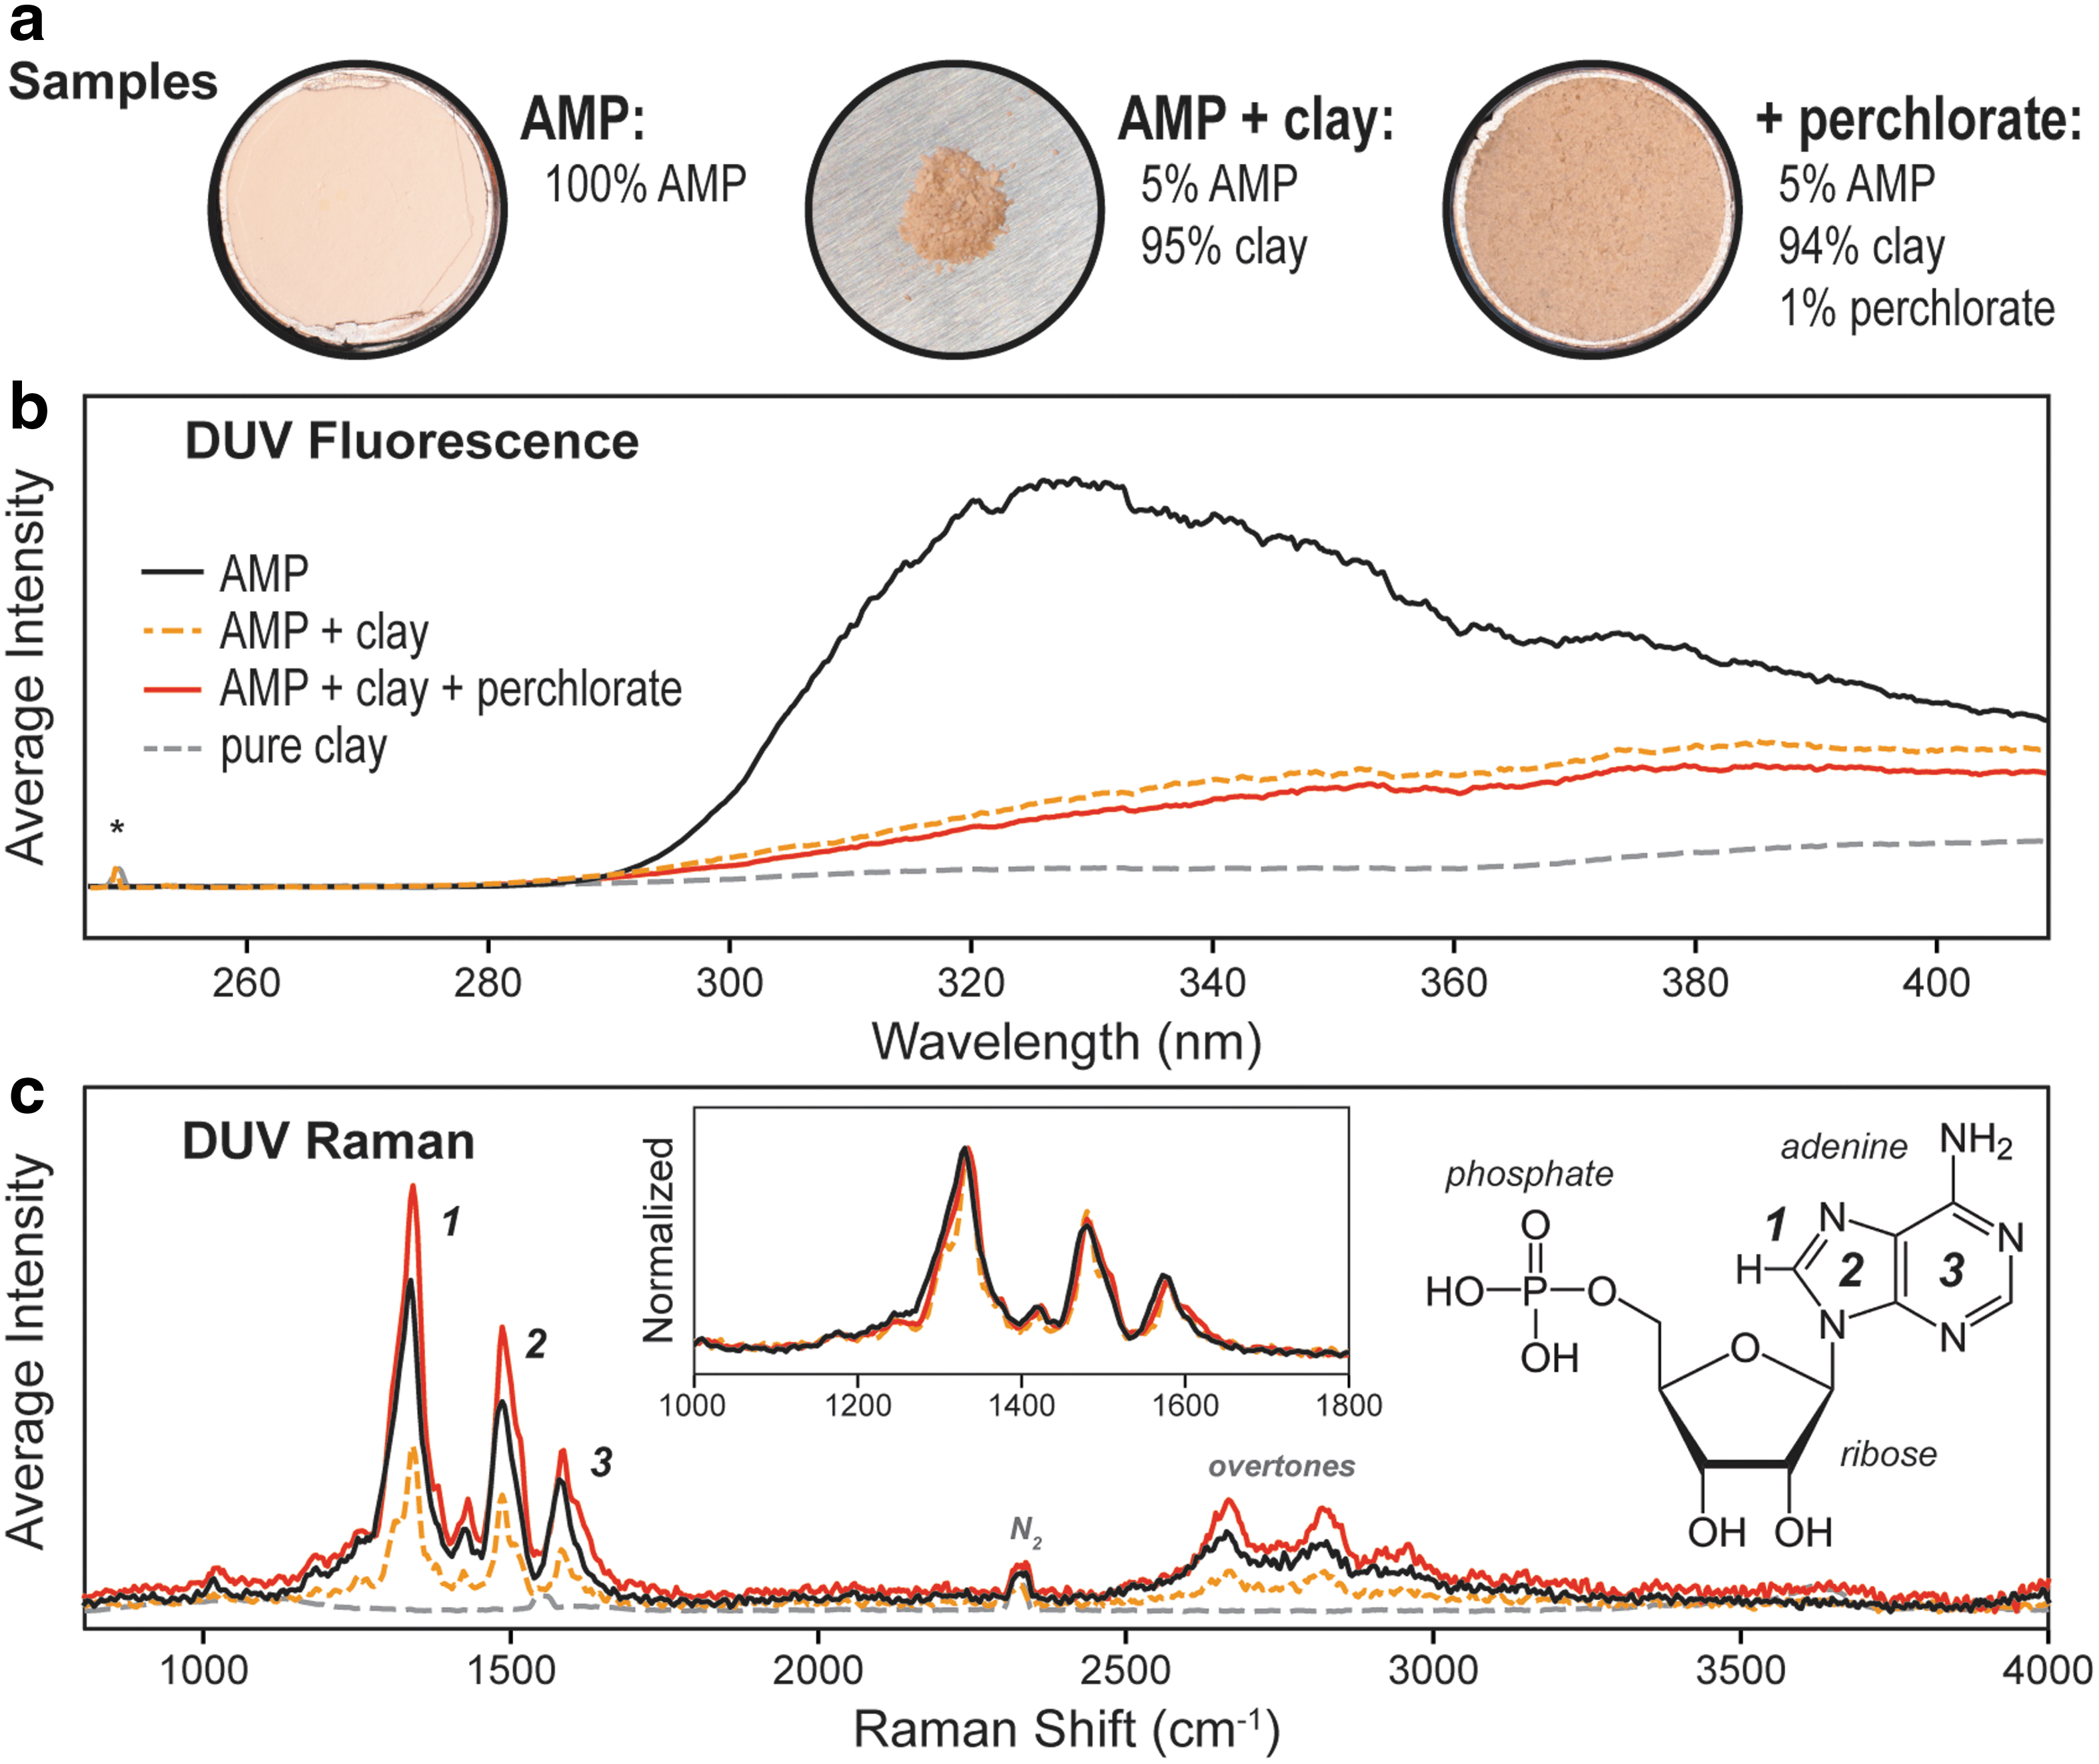
The samples investigated in this work consisted of three material combinations: (1) pure AMP, (2) purified clay impregnated with 5 wt % AMP, and (3) purified clay first spiked with 1 wt % magnesium perchlorate and then impregnated with 5 wt % AMP. The clay used (Montmorillonite SAz-1) comes from a natural source and was contaminated with ∼0.11 wt % organic carbon according to isotope ratio mass spectrometry (IRMS), as previously reported (Fornaro et al., 2020). The organic carbon was removed by solvent extraction before sample preparation, reducing the carbon content below the detection limit of IRMS. The sample preparation process and its validation have been described in greater detail in an earlier article (Fornaro et al., 2020). Of the three samples prepared, the pure AMP and AMP adsorbed onto perchlorate-spiked clay were prepared at a sufficient quantity (>0.5 g) to make compressed pellets, providing a flatter, more consistent surface for characterization (Fig. 1a). For AMP adsorbed on purified clay, characterization was done on the uncompressed powder.
Spectroscopic measurements were acquired by the SHERLOC laboratory analog instrument and prototype, known as MOBIUS. The MOBIUS instrument operates in a similar manner to SHERLOC, except that the Raman and fluorescence regions on MOBIUS are measured separately by using different diffraction gratings (1800 and 300 L/mm, respectively), while SHERLOC obtains a single spectrum that includes both Raman and fluorescence regions by using a single grating (300 L/mm). MOBIUS therefore has different spectral resolutions for Raman and fluorescence spectra, 3.8 cm−1 per pixel and 0.16 nm per pixel, respectively, compared with SHERLOC's single value of 9 cm−1 (0.07 nm) per pixel (Abbey et al., 2017; Beegle et al., 2020).
The initial characterization of each sample consisted of separate Raman and fluorescence scans done under ambient terrestrial conditions, and average intensities were corrected to account for any variation in incident laser energy. To minimize the impact of laser-induced photochemical degradation of the sample, Raman and fluorescence spectra were acquired over short exposures of 5 and 100 laser pulses, respectively. The average DUV fluorescence spectrum of pure AMP (shown in Fig. 1b) has one primary peak with a λmax of ∼330 nm, and a second, weaker contribution ∼360–400 nm. The 330 nm peak is associated with the π–π* transition of the aromatic adenine unit, and the λmax of 330 nm is very typical of a purine-derived nucleobase. When AMP is adsorbed onto clay, the overall fluorescence intensity is reduced, the primary peak is broadened and red shifted to a new λmax of ∼355 nm, and the contribution at 360–400 nm is significantly increased.
Raman measurements were done with longer exposures of 100 pulses due to the much lower yield of Raman scattering compared with fluorescence (Long, 1977). All three samples have very similar normalized spectra, dominated by three major peaks at 1330, 1480, and 1575 cm−1. These peaks were assigned to specific vibrational modes of the adenine fused ring unit of AMP, based on DFT simulations of adenine and AMP (Supplementary Fig. S5) and vibrational assignments for adenine as reported in the literature (Toyama et al., 1994). Peak 1, the dominant peak, is assigned to the N7 = C8 stretching mode coupled to the C8–H waggling mode; Peak 2 is assigned to a collective stretching mode of the five-member imidazole ring; Peak 3 is assigned to a collective stretching mode of the six-member pyrimidine ring. The higher shift shoulder on Peak 3 corresponds to stretching of the C6–NH2 bond. Vibrational modes of the ribose occur across the 1300–1500 cm−1 range, but could only be distinguished by a minor peak at ∼1400 cm−1 (between Peaks 1 and 2).
DFT simulations indicate that vibrational modes of the phosphate group should appear in the 700–1000 cm−1 range, but these were not distinguishable in the DUV Raman spectrum, which we ascribe in part to the selective enhancement of only those vibrations associated with the part of the molecule involved in light absorption (the chromophore), which in this case is the aromatic adenine unit. We do note that the spectrum of pure AMP between 1000 and 1600 cm−1 cannot be fully described by using only three peak functions (Supplementary Fig. S5), and therefore includes contributions from many minor vibrational modes. Beyond 2000 cm−1, we observed a set of second-order overtones of the major modes in the 2600–3000 cm−1 range, and a minor peak at 2330 cm−1 due to atmospheric N2 was visible in all spectra.
Some minor peaks in the mixed samples could be identified as contributions from the clay matrix, based on comparisons with the spectrum of purified clay: an Al–OH stretching mode at 3615 cm−1 and two minor SiO4 modes at 1040 cm−1 (narrow) and 1105 cm−1 (broad). Although the dominant vibrational mode of montmorillonite is reported to occur at ∼700 cm−1 (Wang et al., 2015), that peak could not be resolved in our spectra as it overlaps with a secondary laser emission line at 690 cm−1. The contribution of clay to the overall spectrum was also reduced as clay is nonresonant with DUV excitation and is therefore its Raman scattering is orders of magnitude weaker than that of AMP.
Like many other evaporite minerals, perchlorate salts tend to have strong DUV Raman peaks assigned to vibrations of the oxyanion (Gu et al., 2009; Abbey et al., 2017; Razzell Hollis et al., 2020a), which we were able to observe at 933 and 1108 cm−1 for a sample of pure Mg perchlorate (Supplementary Fig. S2). However, for the purified clay spiked with 1 wt % perchlorate these modes appeared very weak and overlapped with peaks from the clay (see Supplementary Fig. S3 for spectra).
Prolonged exposure to the UV laser (∼1200 laser pulses per point) was found to cause a discoloration of the surface of the pure AMP sample (Fig. 2a). The region of discoloration precisely matched the parameters of the previous scan, forming a 5 × 5 grid of elliptical spots spaced 100 μm apart (Fig. 2b). A subsequent fluorescence scan (at 5 pulses per point) revealed a clear difference in fluorescence between exposed and unexposed areas, which was highlighted by principal component analysis (PCA) (Fig. 2c). PCA identified three clusters (see Supplementary Fig. S6 for further details), the average spectra of which are shown in Fig. 2d. The two clusters associated with the unexposed area had fluorescence spectra similar to those of pristine AMP (marked red and green in Fig. 2c), with slightly different intensities, while the third cluster (blue in Fig. 2c) was localized on the exposed area and showed significantly reduced intensity at ∼330 nm and significantly increased intensity at >360 nm. No discoloration was observed for samples of AMP mixed with clay after 1200 pulses per point, but the discoloration was likely obscured by the color of the clay itself, and previously scanned areas could still be identified by PCA as a localized change in fluorescence (Supplementary Fig. S4).

3.2. Laser dosage analysis
Because the MOBIUS laser profile has already been characterized in detail (Razzell Hollis et al., 2020b), it was easy to determine the area that was exposed to the laser and therefore calculate the effective dosage received in terms of energy per unit area. The annular spot generated by the MOBIUS laser can be approximated as a Gaussian-blurred ellipse, whose parameters are summarized in Table 1. Using this model, we were able to estimate the effective area that was exposed to the beam by simulating the incident intensity distribution (Fig. 3a) at a resolution of 0.1 μm. We chose to use the 1/e 2 definition for effective beam area, also known as D4σ for more conventional Gaussian profile lasers, where the beam area is the region where local intensity is >13.5% of the maximum, which in our case represents an elliptical ring bounded by ±2σ (the dashed lines in Fig. 3a).
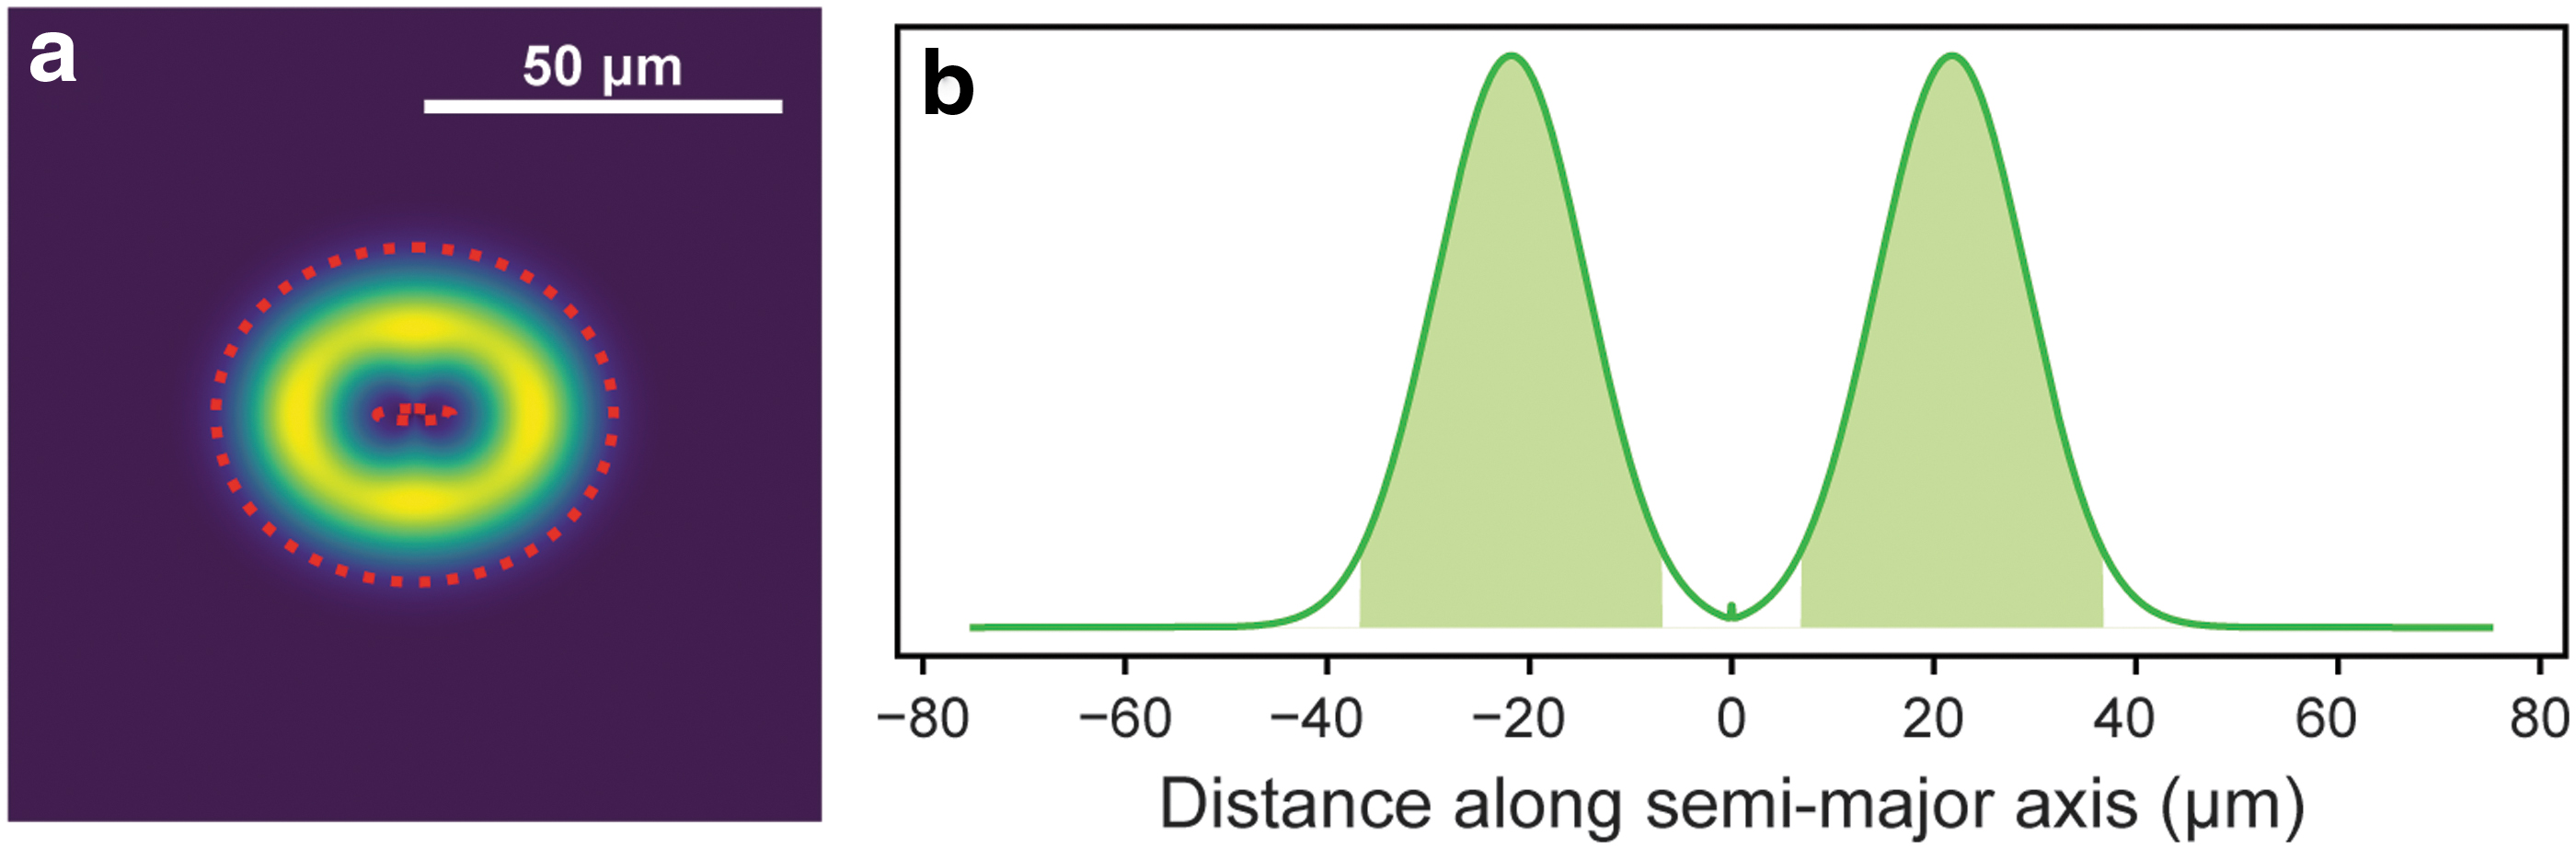
This region encompasses an area of 3540 μm2 and 95% of the total incident intensity (Fig. 3b), such that for a single laser pulse of 2.8 μJ the effective beam area is subject to an average fluence (dosage) of 0.76 J/cm2. The exposures used to obtain the fluorescence and Raman spectra in Fig. 1 are therefore equivalent to dosages of 0.38 and 7.6 J/cm2, respectively, while the 1200 pulse exposure that produced the discoloration in Fig. 2 is equivalent to a dosage of 91 J/cm2.
SHERLOC uses a similar laser with an annular spot approximately double the size of MOBIUS, having an effective beam area of 7640 μm2. As the laser pulse energy is anticipated to be ∼8 μJ at the target at the start of mission, the effective dosage provided by the SHERLOC laser is estimated to be 0.1 J/cm2 per pulse, compared with 0.075 J/cm2 for MOBIUS. The initial operation of SHERLOC anticipates acquisition of a spectrum from each location of a scanned area by using either 5 laser pulses or 400 pulses, referred to as a survey scan and a detail scan, respectively. We estimate the dosage received by the sample to be 0.5 J/cm2 for a survey scan and 40 J/cm2 for a detail scan.
For the purposes of this article, we used radiative transfer modeling to predict the spectral dosage of UV irradiation that would be received per sol in Jezero Crater (Table 2). By focusing on the chemically damaging UVB + C range (200–315 nm), the model predicts an average daily maximum of 7.9 W/m2 in Jezero Crater, which equates to an average dosage of 20 J/cm2 per sol. For validation purposes, the modeled value for the maximum total flux in Gale Crater was compared with the daily maximum flux measured by Rover Environmental Monitoring Station (REMS) after performing dust and angular response corrections (Vicente-Retortillo et al., 2020), which obtained a relative standard deviation of 7.5% in the ratios of the daily maxima. UV values are also similar to previous simulations (Cockell, 2000; Patel et al., 2002; Schuerger et al., 2006), with discrepancies caused by differences in modeling assumptions.
The Average Mid-day Flux and Dosage per sol for Ambient Ultraviolet Irradiation Received in Jezero Crater (Latitude: 18.38° N) and Gale Crater (4.95° S), Using the COMIMART Radiative Transfer Model (Vicente-Retortillo et al., 2015)
UV = ultraviolet.
3.3. In situ degradation
To further investigate the photodegradation of AMP and identify how its Raman and fluorescence spectra evolve with cumulative exposure, we conducted a series of experiments of repeated, short scans, exposing the same area to the UV laser over and over again in situ. Each scan consisted of 25 points covering 0.5 × 0.5 mm, exposing each point to 100 pulses each time (with a typical dosage of ∼7.6 J/cm2), up to a total of 1500 pulses (a cumulative dosage of ∼114 J/cm2). Each exposure was equivalent to ∼0.38 sols of ambient martian UV, up to a cumulative total of 5.7 sols, and the results for the experiments performed under terrestrial atmosphere at room temperature are shown in Fig. 4. For context, the broadband UV irradiation experiments that were conducted in a previous study of the same samples involved cumulative dosages from 1.4 to 440 J/cm2 of UVB + C under nitrogen purging at room temperature, equivalent to 0.07–22 sols of ambient UV (Fornaro et al., 2020).

The evolution of DUV Raman
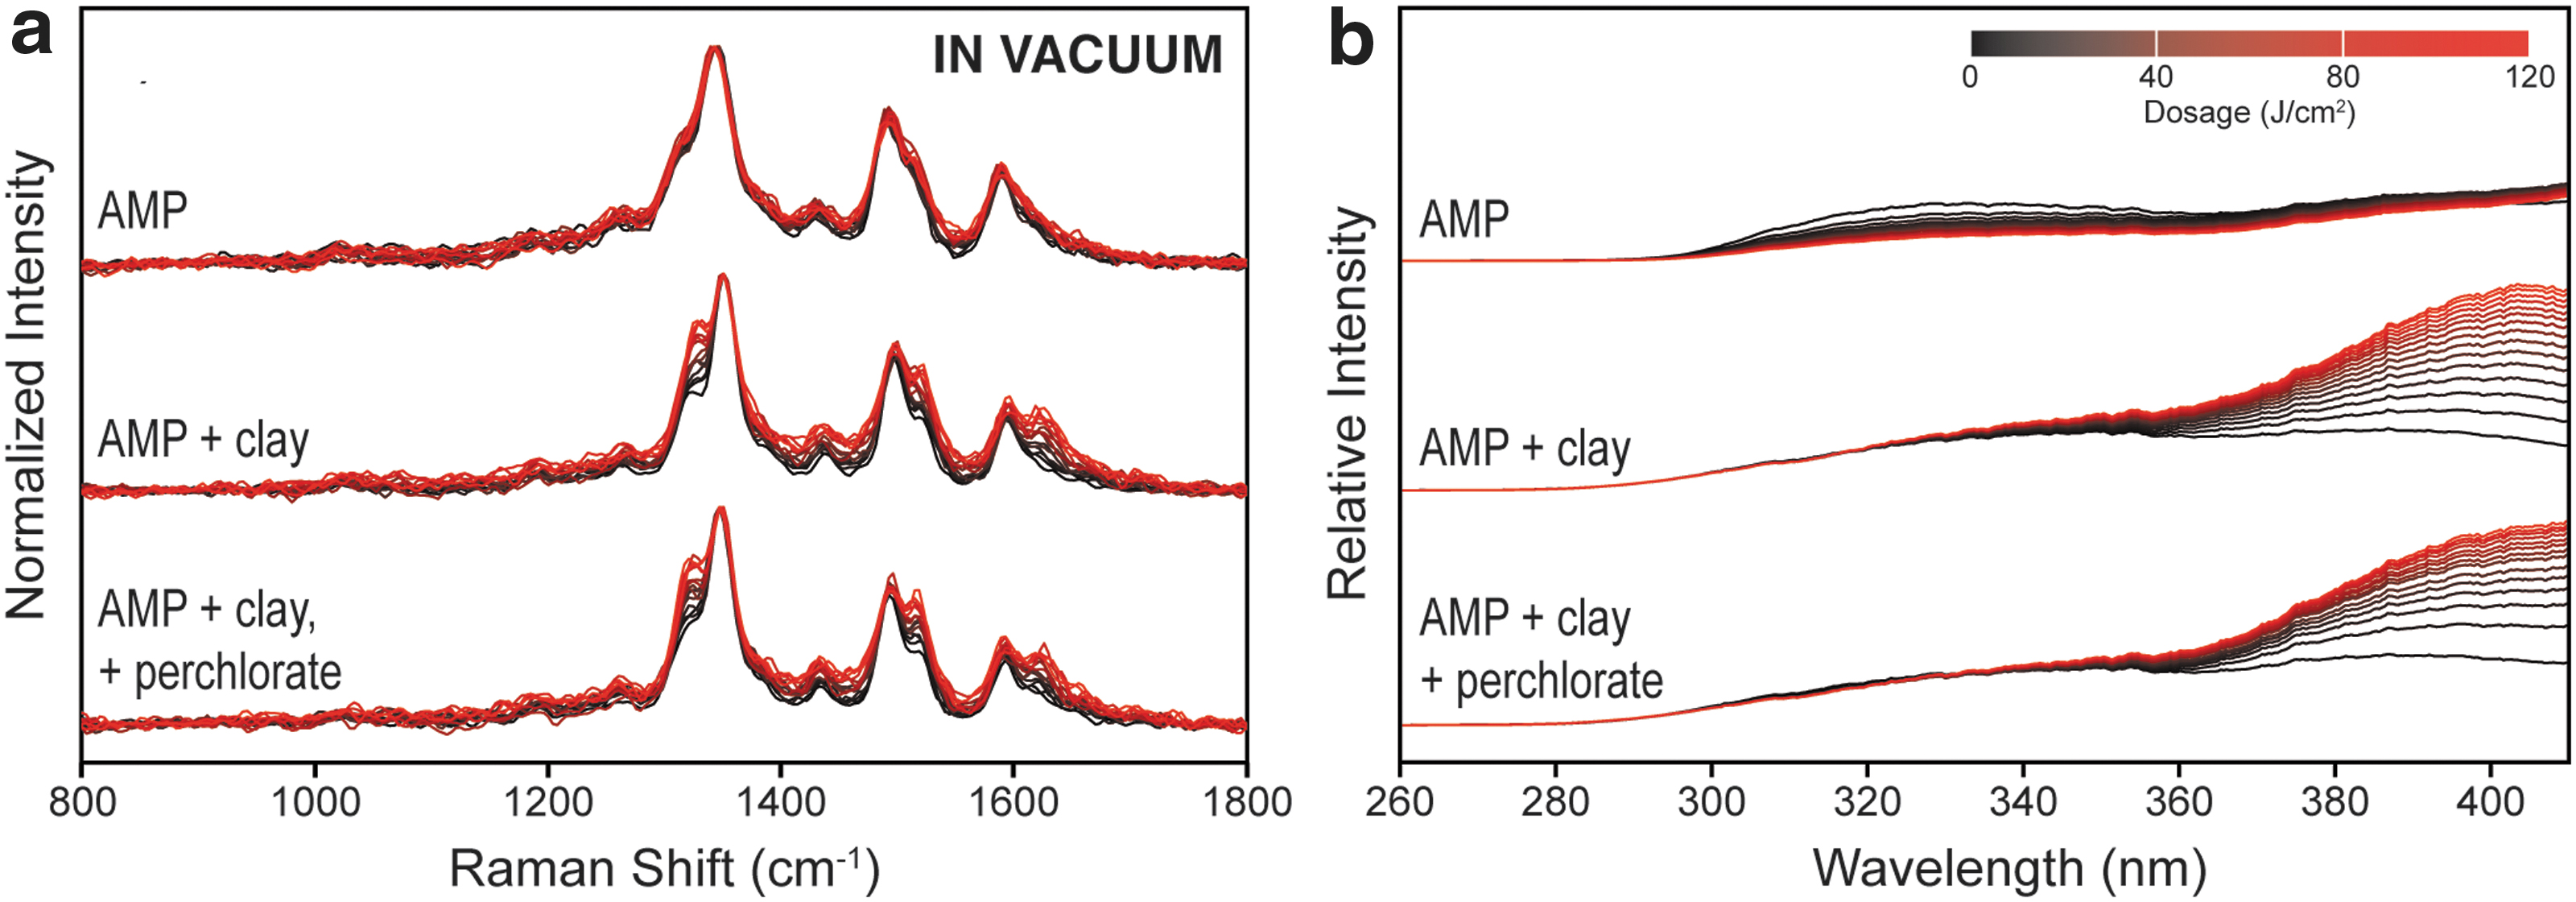
Under ambient terrestrial conditions, the Raman spectrum of pure AMP demonstrated no apparent change over the course of the experiment, while the spectra of AMP adsorbed on clay developed new peaks at 1312, 1498, and 1610 cm−1 that strengthened with increasing UV exposure. These peaks appear to be paired with the original peaks 1, 2, and 3 of pristine AMP, suggesting that UV exposure alters the vibrational frequency of Peak 1 by −18 cm−1, Peak 2 by +22 cm−1, and Peak 3 by +33 cm−1. In terms of fluorescence (Fig. 4b), pure AMP showed a general decrease in fluorescence across the entire spectrum during exposure to UV, while AMP adsorbed on clay showed little change in fluorescence at ∼330 nm but a significant increase in fluorescence >360 nm.
We then repeated our in situ experiments under vacuum, first purging each sample for 1 h under vacuum to remove as much adsorbed oxygen/water as possible, to approximate the desiccated, anaerobic environment of the martian surface. Figure 5 demonstrates that each sample underwent similar spectral changes to those observed under terrestrial atmosphere, suggesting that AMP is being degraded in a similar manner under vacuum as in air. Pure AMP showed no apparent change in its normalized Raman spectrum but a decrease in overall fluorescence, while AMP adsorbed on clay exhibited the appearance of the same shifted Raman peaks and large increase in fluorescence at >360 nm.
The evolution of DUV Raman
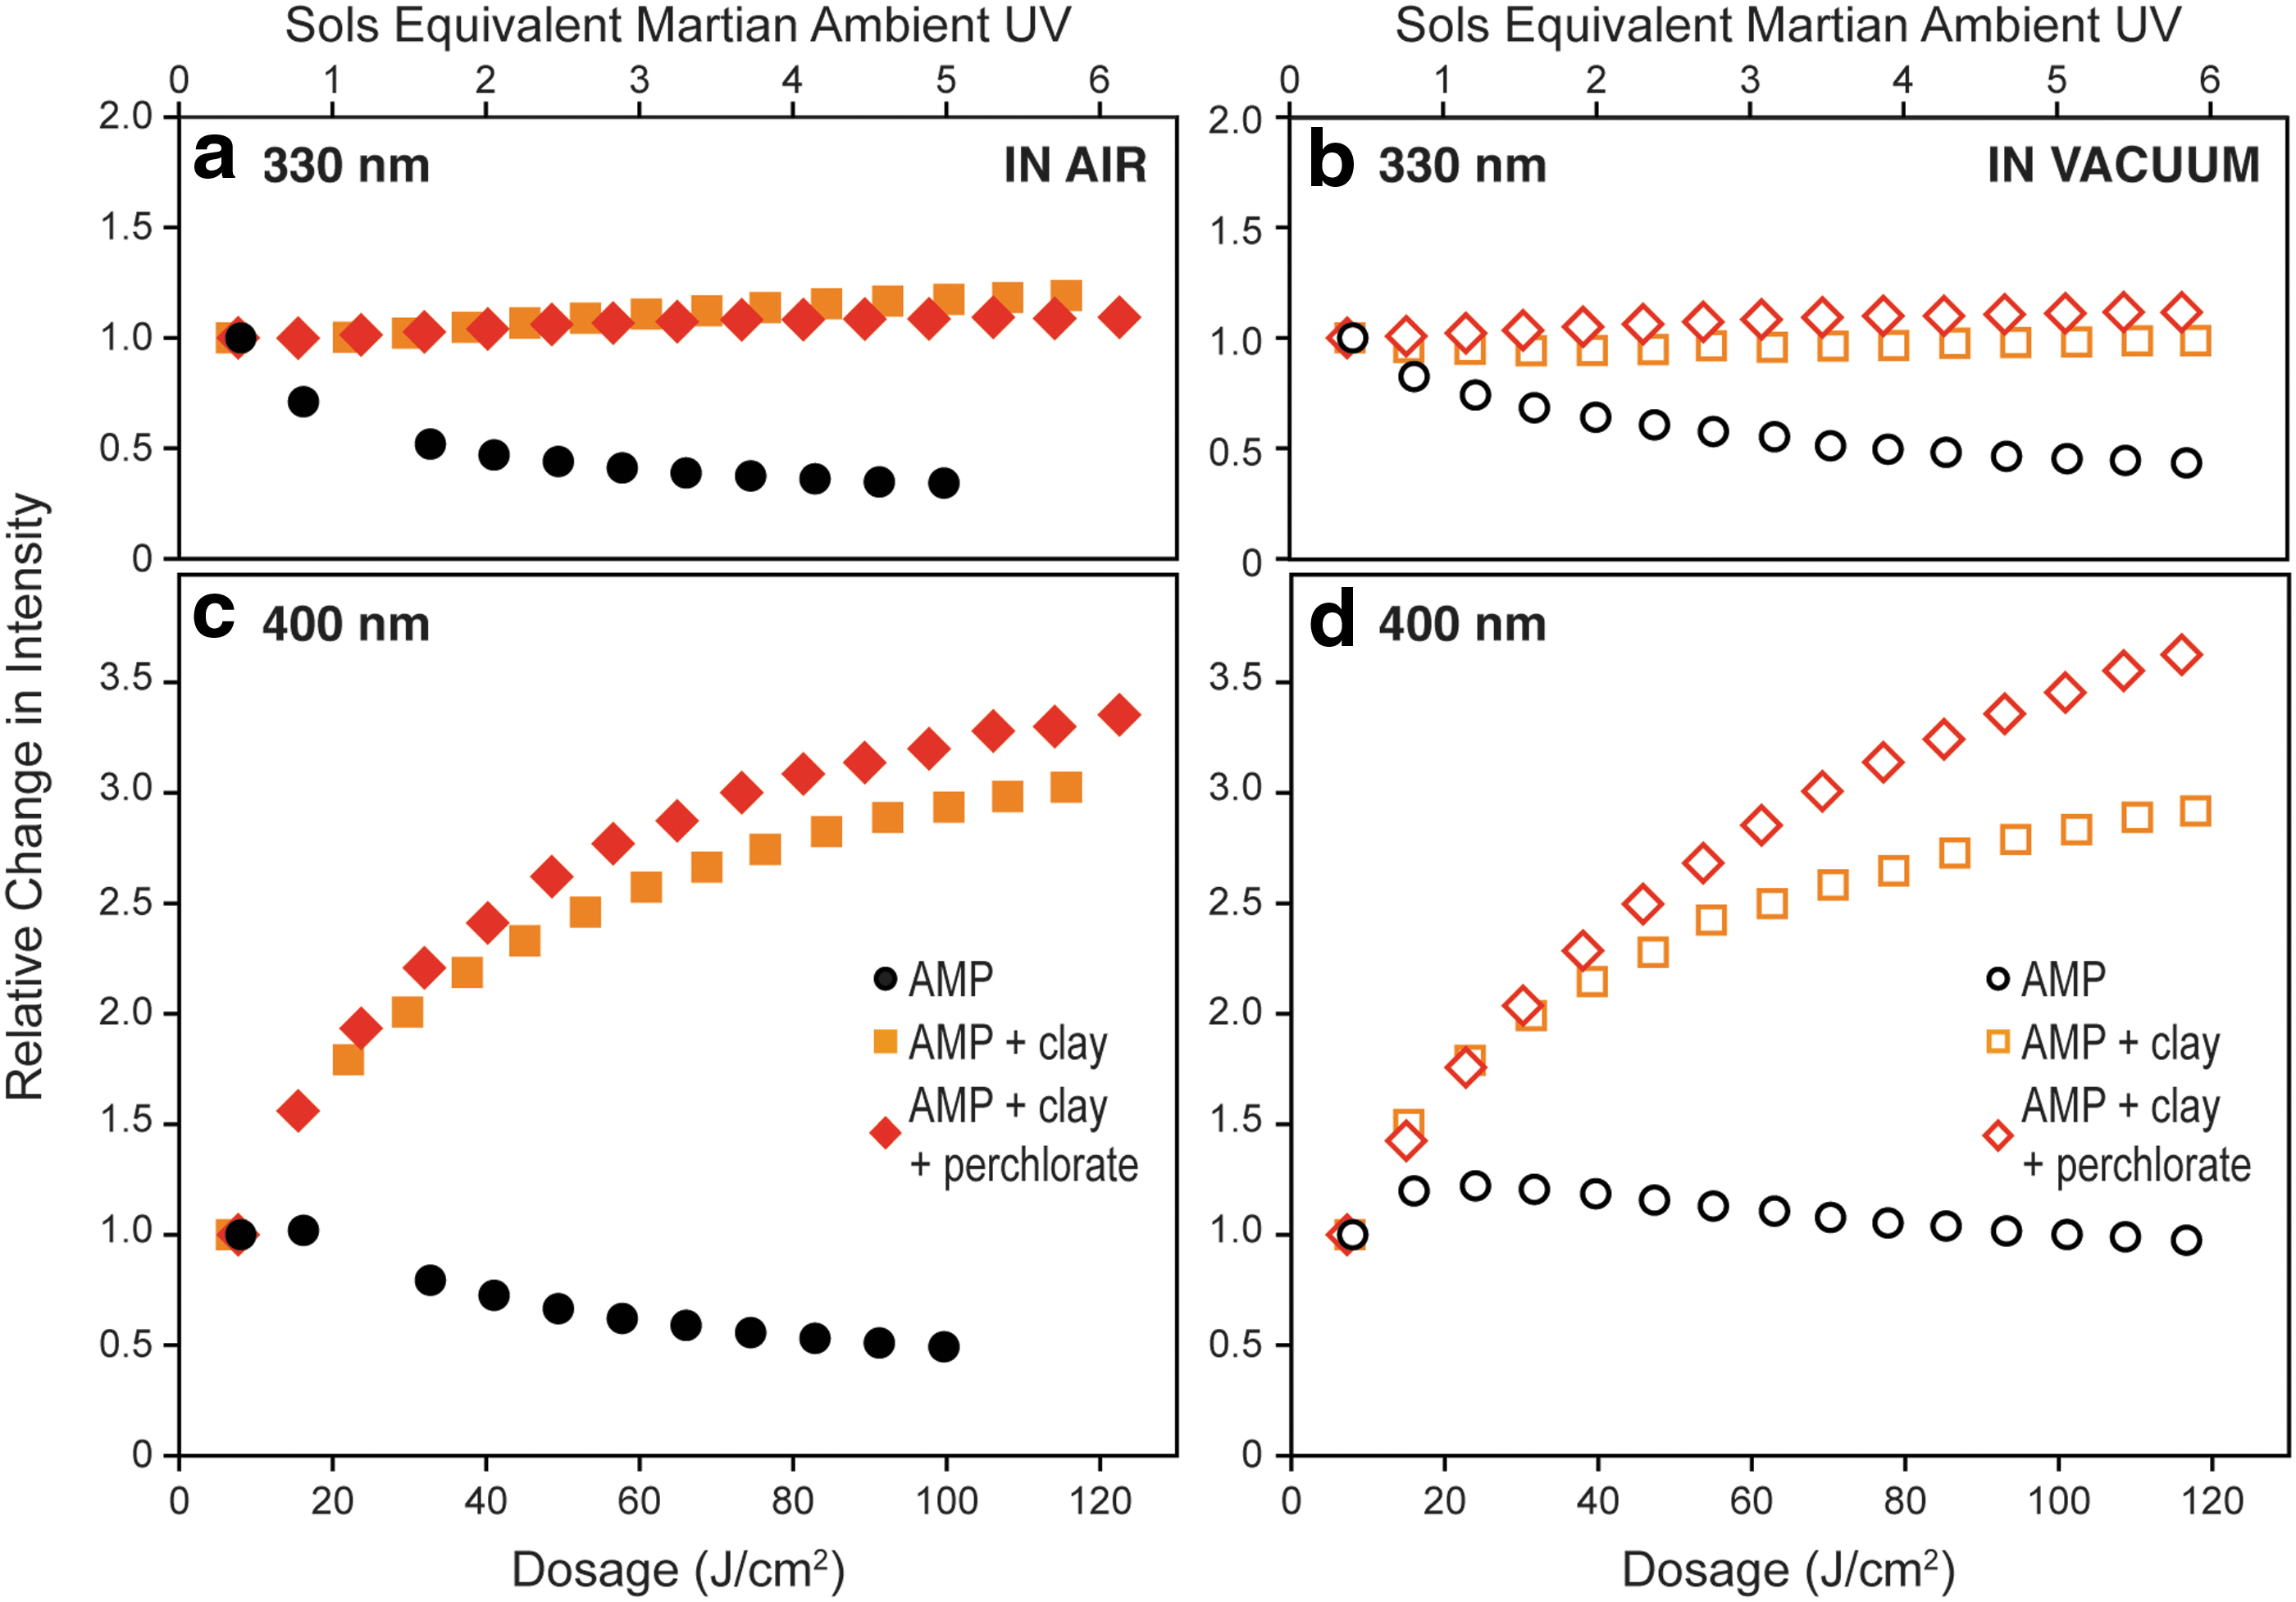
Figure 6 illustrates how the fluorescence intensity at 330 and 400 nm evolves with cumulative exposure in air and under vacuum. For pure AMP, fluorescence intensity at 330 nm decreased rapidly upon UV exposure, reducing by 66% in air and 57% in vacuum by the end of the experiment (100 and 120 J/cm2, respectively). Intensity at 400 nm increased slightly upon initial exposure (13–26 J/cm2), by 2% in air and 22% in vacuum, but then decreased with further exposure, reducing by 51% and 24%, respectively, after 120 J/cm2. The loss of fluorescence for pure AMP was much slower under vacuum purging, with a spectral half-life (the exposure needed to reduce the fluorescence intensity at 330 nm by half) of ∼76 J/cm2 in vacuum, versus only ∼36 J/cm2 in air, equivalent to 3.8 and 1.8 sols of ambient UV, respectively.
The evolution of fluorescence intensity at 330 nm
For AMP adsorbed on purified clay, the intensity at 330 nm was relatively unaffected by prolonged exposure to the UV laser, increasing by 19% in air but remaining unchanged in vacuum. The intensity at 400 nm, which we associate with altered AMP*, increased rapidly upon exposure to UV, and after 120 J/cm2 of exposure in air it had reached 3.03 times its original intensity, versus 2.91 in vacuum. AMP adsorbed on perchlorate-spiked clay exhibited similar behavior: intensity at 330 nm increased by only 9% in air, versus 11% in vacuum, while intensity at 400 nm increased 3.35 times in air, versus 3.62 in vacuum. We note that in all four experiments done on AMP adsorbed onto clay (with and without perchlorate, in air and under vacuum) the fluorescence intensity at 400 nm had doubled after only 30–35 J/cm2 of exposure, equivalent to ∼1.5 sols of ambient UV exposure.
3.4. DFT simulations of oxidized intermediates
We attempted to use the vibrational changes observed in Raman to identify the altered molecule formed by the degradation of AMP adsorbed on clay. DFT simulations were done for several plausible structures of the altered molecule (see Supplementary Fig. S5 for more details) in the gas phase, and their theoretical Raman spectra were calculated. Although other studies on the UV degradation of adenosine phosphates have identified photolytic mechanisms where UV photons directly break bonds on the phosphate and ribose units (Ito and Saito, 1988; Schuerger et al., 2008; Fornaro et al., 2020), we are concerned with the alteration of the adenine unit as that is where we have observed vibrational changes. The adenine unit has a strong UV absorption band, and when the absorption of UV light leads to a highly energetic electronically excited state localized on the aromatic rings, it may then react irreversibly with a nearby electron acceptor, for example, O2, to produce an oxidized molecule (Razzell Hollis et al., 2014).
Our results indicate that the altered AMP* molecule retains its aromaticity, preserving its fluorescence and general Raman pattern, so we considered 10 plausible products where an oxidized group is formed without breaking the aromatic structure of the fused ring system: 5 isomers of hydroxyadenosine (where the adenine is modified by the formation of a C–OH group), 2 isomers of oxoadenosine (the formation of a C = O group), and 3 of hydro-oxoadenosine (the formation of a C = O group and an adjacent N–H). The 10 altered products and their structures are summarized in the Supplementary Fig. S5. We note that due to the nitrogen-rich nature of the adenine unit, all of these structures can be classed as either amides or imidic acids, and many are tautomers of each other, that is, readily capable of interconverting (Cysewski et al., 1995).
We note that these structures do not provide any indication as to the origins of the additional oxygen atom, and due to the complexity of the samples it may be a combination of perchlorate, O2, H2O, and the clay itself.
4. Discussion
4.1. The impact of clay on the DUV spectra of AMP
The chromophore of AMP is the aromatic adenine unit, which has a strong absorption band in the UV that coincides with our chosen excitation wavelength, leading to resonant enhancement of Raman scattering and efficient fluorescence. The major Raman peaks between 1000 and 1800 cm−1 are assigned to the various resonance-enhanced vibrational modes of the adenine unit, while peaks for vibrations localized on other nonresonant parts of the molecule (the ribose and phosphate units) are weak by comparison. In terms of fluorescence, the adenine unit has a dominant fluorescence peak associated with the π*–π transition of the adenine unit, with a λmax of 330 nm that is typical of a purine-derived nucleobase.
When AMP was adsorbed onto clay, we observed some additional minor Raman peaks and an increase in relative fluorescence at longer wavelengths (>360 nm). The overall Raman signal contributed by the clay was much weaker than AMP despite the predominance of clay in the sample, as clay is nonresonant with DUV excitation and is therefore its Raman scattering is orders of magnitude weaker than that of AMP. The increased fluorescence >360 nm was at least partially attributed to the mineral component itself, as the montmorillonite clay used in this study has its own fluorescence maximum at ∼400 nm. This may be the result of trace organic contamination, as the sensitivity of MOBIUS means that even 10−4 wt % of polyaromatic is still detectable (Bhartia et al., 2015). Spiking the sample with 1 wt % perchlorate had no impact on either Raman or fluorescence spectra, suggesting that the contribution from the perchlorate was negligible.
When the DUV Raman spectra for the three samples were compared, we found that the position of Peak 1 shifted slightly when AMP was adsorbed on clay, from 1330 to 1335 cm−1. This shift is comparable with the spectral binning of our instrument (∼3.8 cm−1) and may just be an artifact of the measurement rather than conclusive vibrational evidence of interaction between AMP and clay. Previous work has shown that the adsorption of AMP onto clay particles does cause vibrational changes observable in NIR measurements, but that the largest shifts in vibrational frequency were of modes assigned to the phosphate unit and the NH2 group of adenine (Fornaro et al., 2020). However, these modes could not be distinguished in the DUV Raman spectra of pure AMP nor AMP adsorbed onto clay, as the scattering from these vibrations is weak relative to the main peaks.
The negligible shift in frequency we observed for Peak 1 and the lack of change in position for Peaks 2 and 3 suggest that there is limited interaction between the adenine unit and the clay; for example, the adenine is not involved in any adsorption mechanism that would alter its electronic/vibrational properties. No modification of the clay peaks could be identified as a result of interaction with AMP, which was consistent with NIR measurements (Fornaro et al., 2020). As with fluorescence, there was no change in the Raman spectrum of AMP as a result of the addition of 1 wt % perchlorate, suggesting that there is no meaningful interaction between AMP and perchlorate that would perturb the vibrational modes of AMP.
4.2. Impact of UV exposure
Although there was no significant shift in the positions of the Raman peaks of AMP as a result of interaction with clay, we did observe some variation in the shapes of the major peaks between pure AMP and AMP adsorbed onto clay: a shoulder appeared on Peak 3 at ∼1610 cm−1, while Peaks 1 and 2 appeared to be more bimodal in nature. However, these spectral changes were more pronounced in regions that had experienced prolonged exposure to the UV laser, and will be described in detail later. The impact of UV exposure on these samples was first discovered as a visible discoloration on the surface of the pure AMP pellet that matched a previously scanned area, comprising a 5 × 5 grid of elliptical spots whose size and shape were consistent with the annular laser profile of the MOBIUS and SHERLOC instruments that we have recently described in detail (Beegle et al., 2020) (Razzell Hollis et al., 2020b).
Using the effective beam area calculated from the measured spot parameters in Table 1, we estimated that the discoloration was caused by ∼91 J/cm2 of UV exposure. Based on the highly localized discoloration and altered fluorescence, it is clear that prolonged exposure to the DUV laser results in degradation of AMP through a photochemical reaction that must involve altering and/or breaking the chemical bonds of the fluorescent adenine unit, which changes its spectral signature.
To interpret these dosages in terms of exposure to ambient UV on the surface of Mars, we need to estimate how much damaging UV irradiation reaches the surface. The thin atmosphere of present-day Mars is much less effective at blocking UV than the atmosphere of Earth, particularly the higher energy UVB and UVC radiation (see Table 2 for wavelength ranges) that is more damaging to organic molecules and potential biosignatures such as DNA (Cockell, 2000).
The total UV flux that reaches the surface will vary depending on several factors, including time of year, time of day, latitude, cloud cover, and the optical depth of atmospheric dust, τ (Gómez-Elvira et al., 2014). Multiple theoretical studies of the ambient UV environment on Mars have sought to address this, with two separate investigations predicting that at the equator, during the vernal equinox, the total UV flux at mid-day is ∼50 W/m2 (Cockell, 2000; Patel et al., 2002). Cockell (2000) estimated that chemically damaging UVB + C accounts for ∼13.2 W/m2 of the total mid-day flux, and that at Mars' equator the surface receives a typical UVB + C dosage of 36.1 J/cm2 per sol.
Although a sum UVB+UVC value does not account for any wavelength-dependent variation in the biological impact of UV radiation within this range, we note that the biological effect of martian UV on DNA damage has been reported to be relatively constant between 200 and 300 nm (Cockell, 2000). Measurements done in Gale Crater (latitude: 4.95° S) by Curiosity's REMS put the average mid-day UV flux at ∼20 W/m2 over 100 sols between late southern winter and early spring (Gómez-Elvira et al., 2014), but have since been corrected upward to account for dust coverage and other factors (Vicente-Retortillo et al., 2020).
Based on the modeled intensities of ambient UV irradiation that would be received per sol in Jezero Crater (Table 2), Perseverance will encounter an average daily maximum of 7.9 W/m2 of chemically damaging UVB + C (200–315 nm) in Jezero Crater, which equates to an average dosage of 20 J/cm2 over 1 sol. This level of UV flux is more than sufficient to render bacteria nonviable in a matter of minutes, though individual biological molecules may survive longer (Schuerger et al., 2003, 2006; Cockell et al., 2005).
The initial fluorescence (0.38 J/cm2) and Raman measurements were equivalent to ∼0.019 and ∼0.38 sols of ambient UV irradiation, while the discoloration in Fig. 2 was caused by the equivalent of 4.6 sols of ambient, suggesting that any organic biosignatures revealed by Perseverance's abrasion tool may be significantly affected by ambient UV exposure during surface operations. Similar studies on the degradation of organic material under martian ambient conditions have shown significant degradation over similar timescales of simulated martian ambient UV exposure, though the actual half-life of organic material is highly dependent on the organic in question as well as several other factors (Schuerger et al., 2008; Fornaro et al., 2013, 2018a; Poch et al., 2015; dos Santos et al., 2016; Ertem et al., 2017). In Schuerger et al.'s, (2008) study of adenosine triphosphate, which shares an adenine chromophore with AMP and has a similar UV absorption coefficient, the authors measured the half-life dosage for degradation at 118.3 J/cm2, which we can equate to ∼6 sols of ambient UVB+C.
The in situ experiments for each sample (Figs. 4 and 5) show that the presence of clay has a profound impact on how the spectral signature of AMP is altered by UV exposure. In terms of Raman, pure AMP demonstrated no apparent change in spectrum over the course of the experiment, while the samples of AMP adsorbed on clay developed new peaks that strengthened with increasing UV exposure and appear similar to the spectral changes initially observed for AMP when adsorbed onto clay in Fig. 1.
However, the original peaks do not shift monotonically to their new positions with increasing exposure, instead the new peaks appear as shoulders on the original peaks that gradually increase in intensity, indicating that we are observing two vibrationally distinct molecules that are changing in relative concentration as a result of UV exposure: pristine AMP and a photochemically altered compound with shifted vibrational frequencies, which we will refer to as AMP*. As vacuum purging had no effect on the spectral changes induced by UV exposure in each sample, we can conclude that we are exploring the same degradation mechanisms under vacuum as in air.
It is clear from both Raman and fluorescence spectra that the presence of clay has a significant impact on the photochemical alteration of AMP induced by UV exposure. For pure AMP, the rapid loss of fluorescence across the spectrum indicates that the molecule's chromophore (the adenine unit) has been broken, for example, losing its aromaticity and therefore no longer able to absorb incident light and/or fluoresce. For AMP adsorbed onto clay, the increase in fluorescence at longer wavelengths (>360 nm) indicates that the chromophore's aromaticity is preserved.
However, the increased fluorescence at a different wavelength and the appearance of new Raman peaks suggest that the molecular structure of the chromophore has still been altered (e.g., formation of AMP*). This alteration must be localized on or near the adenine unit, to perturb its electronic and vibrational properties in a way that produces the observed shift in both fluorescence wavelength and vibrational frequencies. No changes were observed in the normalized Raman spectrum of pure AMP because once the chromophore is broken it ceases to absorb incident light and no longer meets the conditions for molecular resonance, therefore Raman scattering from any broken molecules will be several orders of magnitude weaker than that from any remaining molecules of pristine AMP (Long, 1977).
Vacuum purging had a marked impact on the extent of degradation for pure AMP (defined by the relative change in fluorescence in Fig. 6), suggesting that adsorbed molecules of ambient O2 and H2O (which should be removed under vacuum) may play a key role in the alteration of pure AMP, likely acting as oxidizers for the photoexcited aromatic unit—as has been observed for other aromatic molecules in similar in situ studies (Razzell Hollis et al., 2014). The fact that the alteration is not stopped entirely would therefore suggest that the pure AMP sample still has a significant population of adsorbed O2 and H2O even after vacuum purging.
For AMP adsorbed onto clay, the extent of alteration (in terms of fluorescence at 400 nm) at a given UV dosage was similar whether the sample was in air or under vacuum, which suggests that vacuum purging has a minimal impact on the amount of available oxidizer in the clay samples. This may indicate that either (1) there is a large population of relatively nonlabile O2 and H2O adsorbed within the clay that cannot be removed by vacuum, or (2) the clay itself is acting as an oxidizer for AMP in these samples. Both explanations have merit: phyllosilicates such as montmorillonite have large internal surface areas and are known to readily accept small molecules into their interlayer spacing, but there is also a known physicochemical interaction between AMP and the phyllosilicate that could instigate redox reactions (dos Santos et al., 2016; Fornaro et al., 2020).
The presence of perchlorate results in a larger increase in fluorescence at 400 nm, consistent with reports that perchlorate forms powerful oxidizers under UV illumination (Fornaro et al., 2013; Wadsworth and Cockell, 2017). The impact of perchlorate on the extent of AMP alteration was greater under vacuum versus in air, which may indicate that adding 1 wt % perchlorate represents a larger increase in available oxidizer under vacuum. However, we cannot be certain how much alteration is the result of oxidation by perchlorate versus O2 and H2O versus the clay itself.
4.3. Mechanism of degradation
Of the plausible alteration products of AMP that we simulated with DFT, the predicted spectral changes for formation of 2-hydroxyadenosine were the most consistent with the experimentally observed changes for AMP* (Fig. 7). The presence of the OH group at the second position of the pyrimidine ring does not break aromaticity of the adenine unit but does mildly perturb its electronic structure, resulting in altered bond lengths and shifted vibrational frequencies across the fused ring system, including the key modes we assigned to Peaks 1, 2, and 3.

The introduction of a new C–OH bond results in a new, Raman-active vibrational mode (Peak 4) involving both the rings and the C–O bond with a predicted frequency of ∼1350 cm−1, which we tentatively associate with increased signal at ∼1425 cm−1 based on similar assignments for 2-hydroxyadenosine in the literature (d'Amico et al., 2015). For the oxoadenosines we simulated, the introduction of a carbonyl C = O group dramatically changed the distribution of electron density and bond lengths across the fused ring system, leading to a very different pattern of vibrational modes that exclude them as explanations for the observed photoproduct (Supplementary Fig. S5). Although we cannot ignore the possibility of other minor photo-oxidation mechanisms occurring at the same time, we can conclude that formation of 2-hydroxyadenosine is the best explanation available for the spectral changes we have observed when using DUV Raman spectroscopy.
Based on the intensity versus exposure curves plotted in Fig. 6, we propose that the UV-induced degradation of AMP (as observed by UV spectroscopy) follows a two-step degradation mechanism (illustrated in Fig. 7c). The first step is the minor alteration of AMP to an intermediate, hydroxy-AMP, which does not lose its aromaticity but exhibits new Raman peaks and increased fluorescence at 400 nm; the second step is a more extensive alteration that ends up breaking the aromatic rings, suppressing both fluorescence and resonant Raman scattering.
In pure AMP, both steps are apparent: a brief initial increase in fluorescence at 400 nm as AMP starts being converted to hydroxy-AMP, followed by a decrease in general fluorescence as the hydroxy-AMP is altered further. The greater buildup of fluorescence for pure AMP under vacuum versus in air (black circles in Fig. 6d vs. 6c) can be explained as a direct result of the second step being slower under vacuum for pure AMP, as evidenced by the longer spectral half-life.
For AMP adsorbed on clay, the first step is very apparent in the monotonic increase in fluorescence and the rapid development of new Raman modes due to formation of hydroxy-AMP, while the second step (the breakdown and loss of aromaticity) does not occur at all; no subsequent decrease in fluorescence apparent over the range of dosages we have explored.
It appears that the hydroxy-AMP intermediate is stabilized in the presence of clay such that it does not degrade any further. Additional experiments are needed to determine whether the second step of degradation is completely inhibited by the presence of clay or merely slowed—the latter would still present a challenge for the preservation of biosignatures over geological timescales on the martian surface.
Our conclusions are consistent with another UV Raman study that investigated oxidative damage to the nucleobases of DNA, which also found that oxidation of adenosine leads to the formation of 2-hydroxyadenosine (D'Amico et al., 2015). It is worth noting that we cannot be sure that degradation explores a single mechanism, or various mechanistic pathways occur. However, our technique is simply more sensitive to the products of certain mechanisms (e.g., alterations of the resonant aromatic unit) and less sensitive to mechanisms that may instead alter the ribose or phosphate units of AMP. Similarly, the techniques used in other studies, such as mass spectrometry, IR spectroscopy, and chromatography, are simply more sensitive and/or selective for other products, such as small molecule fragments generated by photolysis, for example, breaking of the ribose–phosphate bond (Ito and Saito, 1988; Schuerger et al., 2008; Fornaro et al., 2020).
The difference in selectivity between techniques demonstrates the utility of analysis through multiple techniques, as what is undetectable to one instrument may be easily measured by another, and hence emphasizes the importance of sending novel instruments to Mars that complement more established techniques (e.g., pyrolytic mass spectrometry) in the search for biosignatures.
While preservation of a detectable spectral signature is obviously preferential to its loss, our results suggest that SHERLOC's ability to identify pristine organic material may be quickly compromised by ambient UV exposure even for biosignatures preserved in clay, as both the Raman and fluorescence spectra of AMP adsorbed in clay show significant evidence of hydroxylation after only 1 sol (∼20 J/cm2) of exposure. This has clear implications for surface operations during the Mars 2020 mission, as there may be a delay of ∼1 sol between abrasion of a targeted surface and detailed characterization by SHERLOC and other proximity science instruments, during which any organic material may start to degrade if exposed directly to incoming solar radiation.
This delay is necessary to ensure that there is time for the downlink of decisional data and imagery of the abraded area, assessment by the Mars 2020 operations team, and planning of proximity science activities, and so it may be necessary to adapt surface operations to reduce ambient UV damage to the abraded area by, for example, using the turret assembly to shade it from direct sunlight. We must also acknowledge that the anticipated parameters for SHERLOC survey and detail scans equate to exposures of 0.025 and 2.0 sols worth of ambient UV. As such, care must also be taken when planning SHERLOC operations to avoid overexposure of the sample at the risk of damaging any organic material present.
5. Conclusions
In this study, we investigated how a plausible biosignature, the biologically significant molecule AMP adsorbed on montmorillonite clay, would be probed by DUV Raman and fluorescence spectroscopy using the SHERLOC instrument during NASAs upcoming Mars 2020 mission, and how the observed spectral signature is affected by the presence of Mars-analog clay and perchlorate salt. We found that the DUV spectra of AMP did not change upon adsorption on clay, which suggests that the adenine unit is not involved in organic–mineral interactions and implies that, for certain organic molecules at least, accounting for interactions with the mineral matrix may not be necessary when identifying organics by their spectra. The presence of 1 wt % Mg perchlorate salt in the sample also had little impact on the Raman and fluorescence spectra of AMP, and the only spectral changes observed were found to be a result of exposure to the UV laser.
Using repeated exposures to the UV laser (at 248 nm), we studied the photodegradation of AMP under UV irradiation in terms of alterations to its DUV spectra, finding that AMP exhibits very different spectral changes depending on whether it is adsorbed on clay. Pure AMP showed no apparent change in Raman but a general loss of fluorescence, consistent with breaking of the aromatic rings of adenine, and we found that it was much slower in vacuum, suggesting that ambient O2 and H2O are the dominant oxidizers present in pure AMP. However, AMP in clay exhibited new Raman peaks and increased fluorescence at 400 nm, consistent with a minor change in chemical structure that preserves the aromatic rings rather than breaking them, and we found the extent of degradation was relatively independent of vacuum, which may suggest that either significant O2 and H2O remain trapped in the clay, or the clay itself is acting as the oxidizer.
To explain the new Raman peaks that appear during photoalteration in the presence of clay, we simulated several possible oxidation products using DFT, finding that the best match was 2-hydroxyadenosine. We propose that the dominant degradation pathway of AMP in these samples is a two-step process: first forming a 2-hydroxyadenosine intermediate, which is followed by more extensive oxidation that result in ring breaking and loss of fluorescence, and that clay inhibits the second step of that reaction, preserving the chromophore and fluorescence signal.
Our results are consistent with other reports that smectite clays such as montmorillonite can act to preserve organic compounds against extensive UV-induced degradation, and that clays should be considered high-value targets in the search for preserved biosignatures on Mars (Scappini et al., 2004; Poch et al., 2015; dos Santos et al., 2016; Ertem et al., 2017). However, it is worth noting that clay does not appear to preserve AMP perfectly, and that some alteration (i.e., hydroxylation) is still observed even after relatively short exposures.
By using a modeled dosage of 20 J/cm2 ambient UVB+UVC per sol in Jezero Crater, our experiments represent the first 6 sols of ambient UV exposure for a freshly abraded surface target, and thus demonstrate that ∼1 sol is sufficient to have a detectable impact on the DUV spectra of AMP. We believe that it may be necessary to position the rover's robotic arm, so that the 75 cm diameter turret shields the abraded target from direct sunlight, to minimize subsequent UV irradiation and ensure pristine material is preserved long enough for characterization by SHERLOC and/or sample caching for eventual return to Earth. We estimate that the DUV laser exposure during a SHERLOC detail scan may be sufficient to damage certain organics present within the target. This is an important consideration when selecting targets for SHERLOC activities, especially when sample caching is a priority.
Footnotes
Acknowledgments
The work described in this article was carried out at the Jet Propulsion Laboratory, California Institute of Technology, under a contract with the National Aeronautics and Space Administration.
Author Disclosure Statement
No competing financial interests exist.
Funding Information
This work was funded by a NASA Postdoctoral Program Fellowship awarded to Joseph Razzell Hollis, administered by the Universities Space Research Association on behalf of NASA, and Teresa Fornaro was supported by the Geophysical Laboratory of the Carnegie Institution of Washington and the Italian Space Agency (ASI) grant agreement ExoMars number 2017-48-H.0. William Rapin was funded by an MSL-Curiosity Participating Scientist grant to Bethany Ehlmann. © 2019. California Institute of Technology; government sponsorship acknowledged.
Supplementary Material
Supplementary Figure S1
Supplementary Figure S2
Supplementary Figure S3
Supplementary Figure S4
Supplementary Figure S5
Supplementary Figure S6
Abbreviations Used
Associate Editor: Nita Sahai
References
Supplementary Material
Please find the following supplemental material available below.
For Open Access articles published under a Creative Commons License, all supplemental material carries the same license as the article it is associated with.
For non-Open Access articles published, all supplemental material carries a non-exclusive license, and permission requests for re-use of supplemental material or any part of supplemental material shall be sent directly to the copyright owner as specified in the copyright notice associated with the article.