
Abstract
Understanding the distribution of trace organic material in a rocky environment is a key to constraining the material requirements for sustaining microbial life. We used an ultraviolet laser-induced fluorescence (LIF) spectroscopy instrument to characterize the distribution of organic biosignatures in basalts collected from two Mars-analog environments. We correlated the fluorescence results with alteration-related sample properties. These samples exhibit a range of alteration conditions found in the volcanic environments of Hawai'i Volcanoes National Park, Hawai'i (HI), and Craters of the Moon National Monument, Idaho (ID), including fumarolic systems. LIF mapping of the sample surfaces and interiors showed a heterogeneous distribution of areas of highly fluorescent material (point[s]-of-interest [POIs])—with fluorescence characteristics indicative of organic material. Results suggest that POIs are associated with secondary alteration mineral deposits in the rock's vesicles, including zeolites and calcite. Scanning electron microscopy with electron-dispersive X-ray spectroscopy was used to characterize the mineralogy present at POIs and support the evidence of carbon-bearing material. Overall, samples collected proximate to active or relict meteoric fumaroles from Hawai'i were shown to contain evidence for organic deposits. This suggests that these minerals are measurable spectroscopic targets that may be used to inform sample-site selection for astrobiology research.
1. Introduction
1.1. Mars instrumentation
Key priorities of future missions to Mars include assessing the environment's habitability and actively searching for signs of extant or extinct life (MEPAG, 2015; Carrier et al., 2020). The detection of organic materials in rocks is important to the search for life on Mars, as organic material may be indicative of past or present biological activity (Summons et al., 2007; Westall et al., 2015). Accordingly, a number of instruments have been proposed or are currently in use for this purpose.
Some crucial considerations in the design and inclusion of any instrument on a Mars mission are the need for sample preparation, the distance required between the sample surface and the instrument, and whether the analyses cause damage to the sample, which may prevent further analysis of the same target location. Laser-induced fluorescence (LIF) spectroscopy is a nondestructive, stand-off technique (i.e., the instrument is not directly in contact with the sample) that enables exploratory mapping of organic-bearing materials on an outcrop surface that requires no sample preparation, making it ideal for future Mars missions to potentially habitable regions.
LIF operates on the basis of using a laser source to excite a molecule, followed by detection of the emitted photons of characteristic higher wavelengths when the molecule relaxes back to its ground state. A deep-ultraviolet (DUV, wavelength = 100–280 nm) laser source has been shown to emphasize the fluorescence of organic materials, including those adsorbed to or mixed with mineral material (Bhartia et al., 2008, 2010; Beegle et al., 2015, 2016). A DUV LIF system can thus be used to scan or map a rock sample surface and locate organic material in situ.
In addition, time-resolved fluorescence (TRF) detection at sub-ns resolution can further differentiate between organic and inorganic fluorescence. Organic materials fluoresce strongly within 1–3 ns of excitation, but the intensity of the fluorescence decays quickly, reaching levels close to background in <10 ns (Skulinova et al., 2014; Abedin et al., 2015; Eshelman et al., 2015, 2018). In contrast, minerals have fluorescence decay times that are orders of magnitude higher, due to the presence of trace transition or rare-earth metals in their crystal lattices (Blacksberg et al., 2010; Gaft and Panczer, 2013; Eshelman et al., 2015). Thus, an instrument with a sub-ns-resolution detector delay system can resolve the differences in fluorescence lifetimes between organic and inorganic fluorescing material, confirming the presence of organic material in a strongly fluorescent area of a sample.
Previous work has demonstrated the applicability of LIF for detecting organic materials in Mars-analog samples (Smith et al., 2014; Groemer et al., 2014; Abedin et al., 2015; Eshelman et al., 2015, 2018; Eshelman, 2016). However, these studies did not focus on characterizing the spatial distribution of organics within the whole-rock environment, and thus the distribution and other geological features associated with organics are not well constrained. In an effort to identify such features (e.g., mineralogical and/or physical) that may be commonly associated with organics and hence represent additional astrobiology targets, we employed a DUV LIF instrument capable of both mapping sample surfaces and performing sub-ns TRF measurements. We focused on observations of the physical or mineralogical properties of the rock sample (such as vesicle size/distribution or the presence of alteration minerals) that contained organic signatures. Our work will contribute to sample targeting efforts by improving our understanding of the spatial and material relationships between organic matter and geological features.
The newest NASA rover to explore the martian surface has an instrument with such LIF capabilities. NASA's Perseverance rover includes the Scanning Habitable Environments with Raman and Luminescence for Organics and Chemicals (SHERLOC), a 248.6 nm ultraviolet Raman and LIF spectroscopy instrument (Beegle et al., 2015, 2016; Abbey et al., 2017; Eshelman et al., 2019). DUV Raman—similarly to LIF—has been shown to be useful for the detection of organic molecules in rock samples (Eshelman et al., 2014, 2015; Skulinova et al., 2014; Abbey et al., 2017). SHERLOC uses both LIF and Raman to scan sample surfaces, including small drill cores representing up to 6 cm below the subsurface collected by the rover and up to 2.5 cm depth within the borehole, for in situ organic material (Beegle et al., 2015).
1.2. Organic materials in basalts
Previous research has demonstrated that syn-emplacement (high-temperature interaction with volatiles during eruption) and/or postdepositional ambient weathering of basalts leads to alteration features (e.g., minerals, vesicles) that may impact microbial colonization and the diversity of organisms present (Ivarsson and Holm, 2008; Fairén et al., 2010; Warner and Farmer, 2010; Lineweaver and Chopra, 2012; Hausrath and Tschauner, 2013; Cousins, 2015; Payler et al., 2017). Basalts that have undergone different alteration types and/or degrees of alteration will have different geochemical and physical properties (Hughes et al., 2019), and are expected to contain variable amounts of microbial biomass. For example, highly altered basalts (such as those derived from fumaroles) have ready availability of the chemical energy needed for microbial metabolism, and have been shown to host microbial colonies throughout the world (Mayhew et al., 2007; Wall et al., 2015; Hynek et al., 2018). Furthermore, some alteration minerals found in basalts offer structural support for microbial colony growth (Léveillé et al., 2000; Boston et al., 2001; Ivarsson et al., 2008, 2015; Léveillé and Datta, 2010; Cuadros et al., 2013). Basalts that exhibit different types and degrees of alteration (ranging from unaltered to highly altered) are hypothesized to demonstrate variation in microbial biomass and organic material that may be detectable with spectroscopic instruments.
The relationship between biomass and alteration features that may be more readily measured through orbit and/or rover-based instruments (and thus used for organic-detection sample selection) has not been well characterized. Therefore, the objective of this work was to characterize the relationships between the geological properties of Mars-analog volcanic rocks and the spatial distribution of associated organic matter as measured with LIF. In doing so, this work will contribute to our understanding of the geochemical and physical properties within a rock that are preferentially inhabited with a verified agnostic signature of life, and influence future astrobiology sample-site selection and sample measurement procedures.
2. Materials and Methods
The experimental design for this study was based on characterizing geochemical and physical traits (e.g., vesicle distribution, mineralogy, degree and type of alteration) and organic abundance and distribution (location, intensity, association with physical traits) of the basalt samples used for comparison. To that end, a number of instrumental methods were used. No IRB approval was required for this study due to the lack of living specimens involved.
2.1. Sample collection and preparation
This study uses samples of terrestrial basalt collected during the 2016 deployments of the NASA Biologic Analog Science Associated with Lava Terrains (BASALT) research project (Lim et al., 2019). Samples were collected from two Mars-analog environments: Craters of the Moon National Park and Monument, Idaho, USA, and Hawai'i Volcanoes National Park, Hawai'i, USA. A thorough description of the geological context and geochemistry of the two sampling sites is provided in the work of Hughes et al. (2019). Samples were collected during BASALT extravehicular activities as described in the works of Beaton et al. (2019), Brady et al. (2019), Lim et al. (2019), and Stevens et al. (2019). Sample types representing distinct alteration styles were chosen by the BASALT science team to study any trends in hypothesized microbial habitation based on their type of alteration (Cockell et al., 2019). Field observations and visual characteristics (e.g., color, vesicles) were used to assess and categorize alteration types during collection (Brady et al., 2019; Stevens et al., 2019).
During the Hawai'i 2016 (HI2016) deployment to Mauna Ulu, the following sample types were collected: active meteoric fumaroles, characterized by active steam venting at the sample site and a temperature measurement of >70°C; relict meteoric fumaroles, characterized by evidence of previous fumarolic activity like precipitate deposits and highly altered surfaces, but with temperatures similar to ambient; and unaltered rocks, showing no dramatic color change or mineral deposition on the surfaces.
Samples from the Idaho 2016 (ID2016) deployment fell into three major categories: high-temperature syn-alteration, which occurs during eruption as volcanic gases cause oxidation to the fresh lava and is characterized by color changes from black to red or yellow; low-temperature alteration, caused by the slow weathering process of basalts exposed to ambient climate conditions (e.g., aqueous alteration); and unaltered.
Throughout our study process, all efforts were made to preserve the in situ characteristics of the rock samples and prevent organic contamination. Samples were collected from the rock outcrops (Fig. 1) with flame- and alcohol-sterilized rock hammers, handled with sterile surgical gloves, and placed immediately into sterile bags. They were frozen on site and remained frozen during transport. When received at McMaster University in Hamilton, Ontario, Canada, the samples were freeze-dried to preserve their field conditions for future analyses at ambient temperature. Nine samples—replicates of which were prioritized by the BASALT science team for analyses at other institutions (Cockell et al., 2019)—were transferred to the York University Planetary Instrumentation Laboratory (PIL) in Toronto, Ontario, for subsequent laboratory analyses.

In situ photographs of sample locations.
At PIL, analyses were conducted on samples at ambient indoor atmospheric conditions. When removed from their original sterile collection bags, samples were handled with gloves. Tools such as the rock saw, clamps, and tweezers were sterilized with isopropanol before and after each use. No coolant fluid or water was used so as to not expose the samples to contaminants. Samples were returned to their bags and kept in a locked cabinet when not in use.
Each sample was cut into slices ∼1 cm thick with two parallel, flat surfaces (for ease of analysis) by using a Metkon Geocut rock saw with a diamond blade. Three-dimensional samples were cut into “two-dimensional” slices from multiple orientations, such that slices could represent a variety of interior and exterior microenvironments within a heterogeneous sample. Individual slices chosen for analysis were adhered to standard glass slides with Loctite® brand 0151 Hysol Epoxi-Patch adhesive and left to cure for ∼24 h. Slides were labeled with the sample number—the original bag label—and an individual letter, for example, MU100620 Slide A.
2.2. Visual characterization
Sample properties were characterized visually with the aid of a Nikon® SMZ 745T microscope. Microscope images were recorded with the attached Infinity 1 camera using InfinityAnalyze software. The images were stitched together to create a composite image of the basalt sample surface, including the area to be mapped. The samples' colors, approximate vesicle size and distribution, and any visible alteration patterns such as in-filled vesicles or discoloration were recorded and presented in a tabular form (Supplementary Data).
2.3. LIF spectroscopy
The instrument setup described in the works of Eshelman (2016) and Lymer (2017) was modified for use during this study (Fig. 2). The original laser source was replaced with a TEEM Photonics™ 266 nm Nd:YAG PowerChip™ laser pulsed at 1 kHz for maximum power output at source (∼15 mW). In addition, at the collection optics setup the beam is reflected through a 15 × UV objective (Thorlabs LMM-15x-P01), to the stage with the secured sample. This creates an elliptical spot size when focused on the sample surface of 0.64 mm (x axis)/1.36 mm (y axis). The system is equipped with an Andor iStar™ DH334t iCCD camera, controlled digitally with the supplied Andor Solis™ software. The LIF instrument is also furnished with a triaxis motorized stage (ThorLabs MTS25/M-Z8), with an attached manual rotating stage mount, enabling easy focusing and positioning of the sample at the beam's focal point.

Labeled photograph
2.3.1. LIF mapping
A key objective of this study was to examine the spatial distribution of organic material in the basalt samples. To that end, raster maps of a sample surface were created by combining stage movement and spectral measurements in an automated program [as in Lymer (2017)]. For this study, a 1 cm2 area was chosen on each slide for analysis. The map site was chosen to represent the heterogeneity of that particular slide and contribute to the interpretation of the sample as a whole. The following criteria were set out for map site selection: (1) at least one map per sample was taken along an exposed or weathered edge of the rock slice; (2) at least one map was taken in the middle of the rock slice; and (3) depending on the sample's heterogeneity or areas of visible alteration, a map would include boundaries or transitions between visually different materials in the rock.
Once an area for mapping was chosen, a drop of correction fluid was applied to the upper right corner of the map area to act as a starting point reference. The slide was secured to the rotating stage with stage clamps, and the stage rotated such that the mapped area would be as inclusive as possible of variations within the rock. The angle of rotation was recorded. The stage would move stepwise by the distance indicated in the automation program (0.25 mm/step), and the Andor iStar would take a LIF measurement at each step [see Lymer (2017)]. As the step size was smaller than the laser spot size, each discrete measurement window (laser spot size) would overlap spatially with the next.
The data from each LIF measurement taken at each step were recorded in a single 1024 × 2 matrix .asc file, with the first column holding the range of detectable wavelengths from 255 to 515 nm and the second column holding the fluorescence intensity at each wavelength. With 1600 steps to create a 40 step2 pixel map (1 cm2), there would thus be 1600 .asc files per map. Using code compiled in MathWorks® MATLAB™ software, we converted these 1600 .asc files to a single 40 × 40 matrix file, where each entry in the matrix was the integral of the intensity values over the entire wavelength range for that point in the map.
A map matrix would then be displayed as a binned raster heat map image, and by using a blue-to-red color scheme, fluorescence intensity ranging from near-background levels to high (0 to 1.057 × 10⁹ arbitrary units [au]) would be displayed as blue, high-intensity (1.057 × 10⁹ to 1.823 × 10⁹ au) fluorescence would be displayed as yellow, and very high-intensity (>1.823 × 10⁹ au) fluorescence would be displayed as red. These bin values were calculated based on taking the mean intensities from all points on all the maps. Low cutoff (1.057 × 10⁹ au) represents the mean 50%-of-max value between 0 and the mean maximum intensity, and the high cutoff (1.823 × 10⁹ au) is the mean 75%-of-max intensity value from all maps. This absolute scale allows for the objective comparison of the number of high- and very high-intensity fluorescent points between maps. Clusters of yellow (high-intensity) and red (very high-intensity) pixels indicated an area with strongly fluorescent material compared with background. These areas were chosen as point[s]-of-interest (POIs) for further investigation. The highly-fluorescent area corresponding to the correction fluid point was used to orient the map raster to the composite slide image (see Visual Characterization section). Fluorescence values associated with this correction fluid point were not integrated into final analyses of total map fluorescence.
2.3.2. LIF time-resolved measurements
TRF measurements were taken from these POIs to evaluate the growth and decay rates of fluorescence intensity, as a means of distinguishing organic fluorescence from mineral fluorescence. Data from these measurements were processed in MATLAB to create contour plots displaying fluorescence intensity as a function of time and wavelength. High-fluorescence intensity is depicted in warmer colors (yellow to red), while low intensity is shown in cooler colors (green to blue). The contour plots again use an absolute color scheme for better comparison, where the maximum intensity of all of the values from the TRF datasets (5.52 × 10⁶ au) is applied as the maximum (dark red) to every plot.
2.4. Scanning electron microscopy
Scanning electron microscopy (SEM) with electron-dispersive X-ray spectroscopy (EDS) was used to determine elemental concentrations within POIs identified in basalt samples. A Tescan VEGA3 SEM was operated under low-vacuum conditions (50 Pa) and medium- to high voltage (10–20 kV) for imaging and analyses. Samples were left uncoated to prevent organic contamination. Images of the LIF-characterized POIs (see LIF Mapping section) and surrounding material were taken at ∼400–700 × magnification. Additional images of the rock matrices outside of the LIF mapping areas were taken for comparison.
Ten to 15-point measurements were taken within each POI by using a Bruker QUANTAX EDS and automatically quantified with the Bruker ESPRIT software to include only major rock-forming (O, Si, Ti, Al, Fe, Mn, Mg, Ca, Na, K, P, Cr) elements, as well as carbon. The weight percentage (wt%) value of each element was recalculated to the appropriate weight percentage oxide and normalized to the sum of all weight percentage oxides in each point (Jackson et al., 1967). Due to the difficulty measuring light elements such as C with EDS (Newbury, 2009), carbon dioxide concentrations in these results were interpreted as indicating the presence or absence of carbon-bearing material (either organic or inorganic), and not as true quantifications of elemental abundance.
2.5. Porosity
A Micromeritics AccuPyc II 1340 He-gas pycnometer was used to measure the skeletal volumes of the samples (Vskel.rock
), and a Bruker SKYSCAN-1272 micro-computerized tomography (μCT) scanner was used to measure the bulk volumes (Vbulkrock
). The porosity of the samples was calculated as follows:
3. Results
A total of nine basalt samples were investigated: four samples from HI2016 (10 slides in total—one to three slides per sample) and five samples from ID2016 (18 slides in total—three to four slides per sample). Of the 28 slides mapped, 12 sample slides representing six samples—only those samples with LIF maps that contained POIs (between one and three per sample)—were further examined with SEM-EDS. Data and figures from all samples are presented in the Supplementary Data. Two representative sample slides are described here to illustrate the findings: MU100620 (relict meteoric fumarole) slide A from HI2016; and BC317 (unaltered basalt) slide C from ID2016. LIF results from these slides and EDS analyses are shown in Figs. 3 and 4 and Tables 1 and 2, respectively. The LIF results are generally presented in the figures as follows: image (a) is a photograph of the slide being presented. Image (b) is a composite microscopic photograph (see Visual Characterization section) of the mapped area of the slide, with any POIs identified and labeled. Image (c) is the same composite photograph, overlain with the relative-scale LIF map in the binned color scheme (see LIF Mapping section), with the POIs identified and labeled. Images (d) through (g) in Fig. 3 and image (d) in Fig. 4 show the TRF contour plots (see LIF Time-Resolved Measurements section) of the POIs present in those maps. This order of images is similar for all other samples.

LIF spectroscopy results from slide A of sample MU100620, collected from a relict meteoric fumarole in Hawai'i (HI2016).
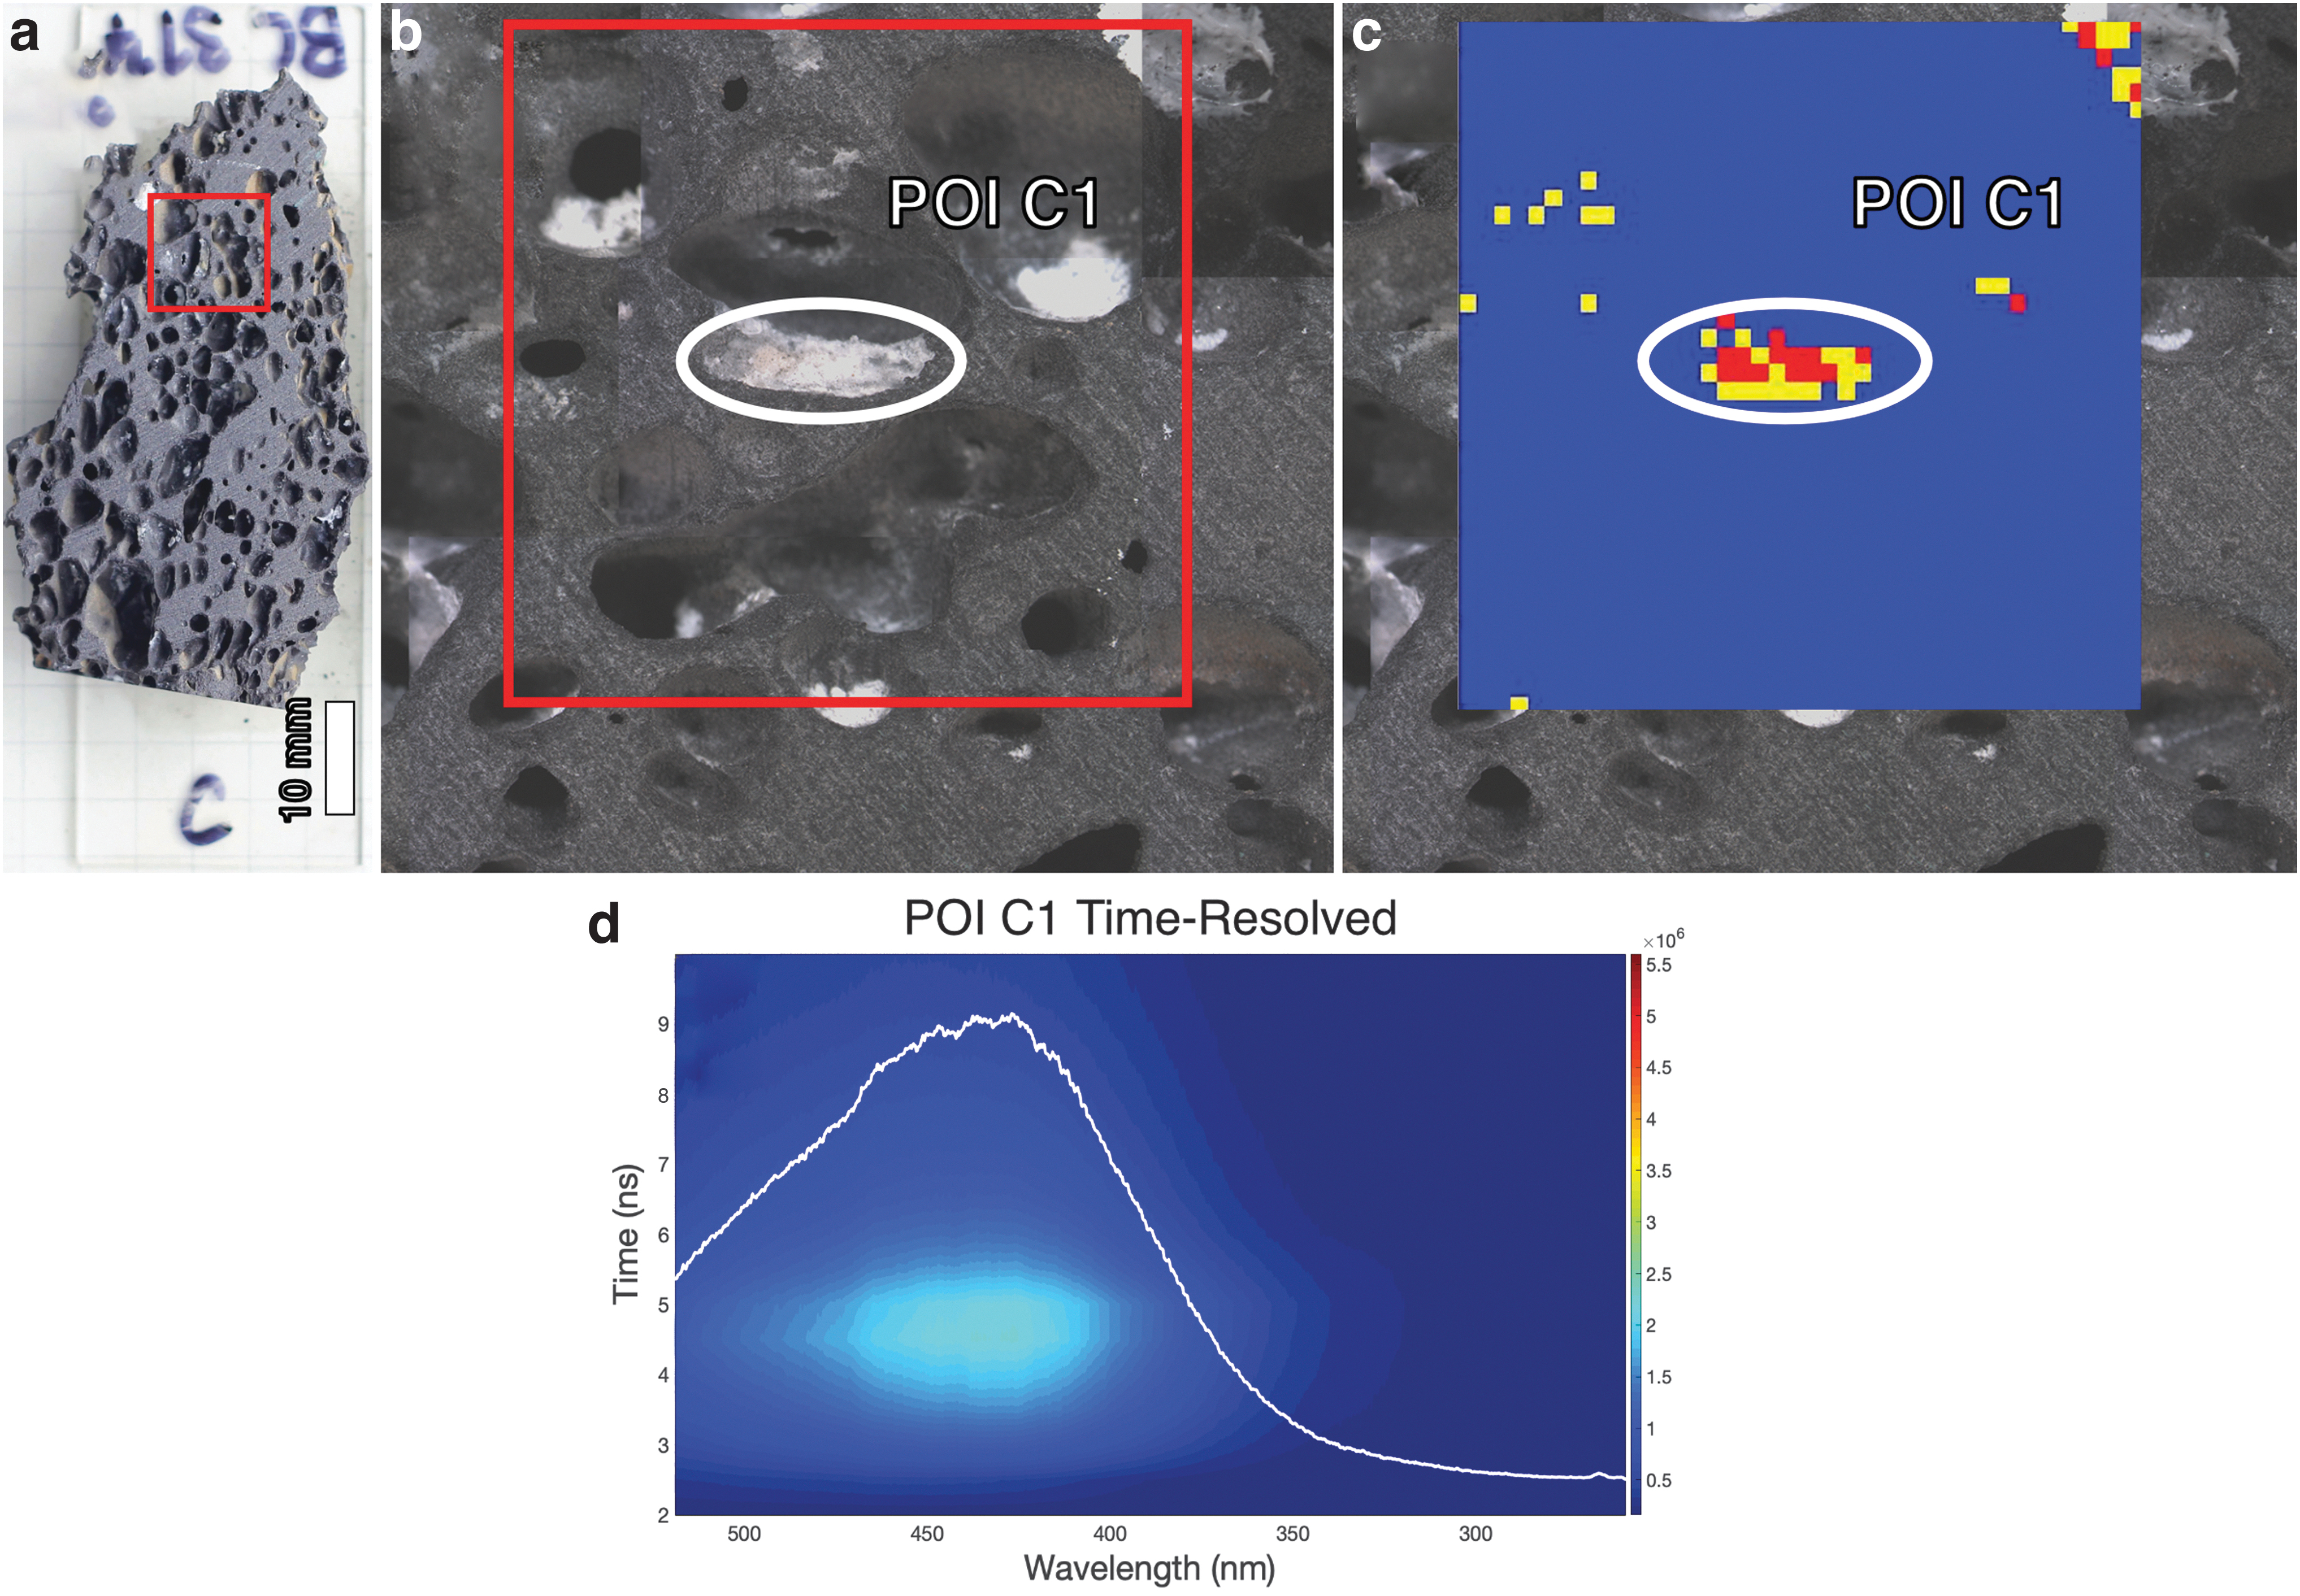
LIF results from slide C of sample BC317, collected from Craters of the Moon National Monument (ID2016).
Example Electron-Dispersive X-Ray Spectroscopy Point Analysis Results and the Associated Mineral Identification in Sample HI2016 MU100620
Results are reported in weight percentage oxides, normalized. All iron is assumed to be present as FeO.
POI, point-of-interest; HI2016, Hawai'i 2016.
Example Electron-Dispersive X-Ray Spectroscopy Point Analysis Results and the Associated Mineral Identification in Sample ID2016 BC317
Results are reported in weight percentage oxides, normalized. All iron is assumed to be present as FeO.
POI, point-of-interest; ID2016, Idaho 2016.
After each LIF result figure, the EDS table of elemental abundances (as weight percentage oxides) for the sample POIs is provided, including the mineral determinations. The values from the elemental quantifications were compared with expected weight percentage oxide values for common igneous and alteration minerals derived from literature data (Van Olphen and Fripiat, 1979; Deer et al., 1992).
3.1. HI2016—MU100620 (Relict Fumarole)
Sample MU100620 was cut into three slides, with three 1600-point, 1 × 1 cm maps produced through LIF mapping. Map A (Fig. 3) was taken near an exposed edge, and included many vesicles containing greenish-white crystalline material. The absolute fluorescence intensity map A (Fig. 3c) showed a total of 67 red pixels and 103 yellow pixels (excluding those from the correction fluid mark), with a combined approximate area of 42.5 mm2, based on the map step size of 0.25 mm. These POIs were all associated with unidentified white crystalline mineral (WCM) deposits present in the vesicles. POIs A1, A2, and A3 all had very similar spectral signatures, with a main peak located at ∼440 nm, similar maximum intensities, and similar decay times of ∼2.5 ns. POI A4 had a similar shape at its maximum intensity to POIs A1, A2, and A3, but much lower maximum-intensity value. POIs A3 and A4 also showed a significant secondary peak at ∼350 nm with a decay period extending beyond the measured time. This longer emission peak wavelength is consistent with the zeolite minerals stilbite and heulandite as reported in Joshi and Bhoskar (1983). As noted earlier, long fluorescence decay times are associated with inorganic minerals, thus the rapidly decaying peaks combined with longer duration fluorescence in the same spectra suggest a mixture of both organic and inorganic fluorescent materials in the POIs.
Table 1 gives EDS results from various POIs throughout the entire sample MU100620. The EDS measurements of areas around the WCM show common basaltic minerals: amphibole, orthopyroxene, glass, and plagioclase. EDS measurements directly taken from WCM show chlorite and some material with very high (>50 wt %) carbon concentrations, such that other elemental concentration values could not provide reliable mineral estimates.
3.2. ID2016—BC317 (unaltered)
Sample BC317 was cut into three slides, with three 1600-point, 1 × 1 cm maps produced through LIF mapping. Map C (Fig. 4) was taken near an exposed edge, and included a dense, black matrix and vesicles containing a light coating of WCM. The absolute fluorescence intensity map C (Fig. 4c) showed a total of 15 red pixels and 27 yellow pixels, with a combined approximate area of 10.5 mm2, based on the map step size of 0.25 mm. POI C1 showed a strong spectral signature with a single broad peak located at ∼440 nm. This peak reached its maximum intensity at 4.5 ns and decayed within 2.5–3 ns. This rapid fluorescence decay implies the presence of organic material.
Table 2 gives EDS results from various POIs throughout this slide. The EDS measurements of areas around the WCM show basaltic minerals: amphibole, olivine, and plagioclase. EDS measurements directly taken from WCM show calcite.
3.3. Comparisons between alteration style and fluorescent/organic properties
The following figures show comparisons between alteration style and both fluorescent and carbon-rich material in the samples. The samples were grouped into six alteration styles: Active Fumarole (MU100089, MU100074), Relict Fumarole (MU100620), Hawai'i Unaltered (MU100110), High-temperature Alteration (HF437, BC459), Low-temperature Alteration (HF257), and Idaho Unaltered (HF256, BC317).
3.3.1. Alteration style and carbon component
Figure 5 compares carbon concentrations (as wt% CO2), taken on average from all the POIs on each sample, with the assigned alteration style. The single relict fumarole sample from HI2016, MU100620, had the highest measured carbon component overall: an average of 28.4 wt% CO2 from eight POIs. The lowest average carbon component of those measured came from the ID2016 Unaltered suite, with an overall mean of 3.91 wt% CO2 from seven maps; although the single POI measured in this group, BC317 C1, had a relatively high CO2 value (27.3 wt%) on average from four measurements of the POI. The short fluorescent decay times shown in TRF measurements of these POIs (Figs. 3–4 and Supplementary Data) do suggest that some of this carbon component is likely organic (Eshelman et al., 2015, 2018). In addition, the EDS-measured concentrations of other elements, such as high wt% SiO2 and Al2O3, indicate that this carbon is not part of a carbonate mineral (e.g., calcite, dolomite, siderite). The exception is the ID2016 sample BC317, which conclusively shows calcite in POI C1.

Chart comparing the alteration style of a sample and the average (mean) weight percentage of carbon dioxide measured in each POI by the EDS. Black bars represent the average measurement from each individual POI, while colored bars represent the overall average for that sample type. Moderate-T alteration and low-T alteration, from the ID2016 suite, both had no POIs measured, so are not represented in the EDS measurements. EDS, electron-dispersive X-ray spectroscopy; HI, Hawai'i; ID, Idaho; POI, point-of-interest; T, temperature; wt%, weight percentage. Color graphics available online.
3.3.2. Alteration style and fluorescent pixel counts
In Fig. 6, the average number of high- and very high-fluorescence pixels in each LIF map, representative of the total area of the map composed of highly fluorescent material, is compared with the alteration style of the sample. The relict fumarole sample MU100620 again had the highest mean number of pixels at 84.7, by a large margin compared with the second and third highest (active fumarole and unaltered Idaho samples, respectively).

Chart comparing the alteration style of a sample and the number of high- or very high-fluorescence intensity points measured in each map. Black bars represent the number of red and yellow pixels measured in each map, while colored bars represent the overall average for that sample type. HI, Hawai'i; ID, Idaho; T, temperature. Color graphics available online.
3.3.3. Alteration style and maximum fluorescence intensity
Figure 7 illustrates the maximum fluorescence intensity of each POI measured during time-resolved analyses. The active meteoric fumarole samples from HI2016, MU100074, and MU100089 showed on average the highest maximum-intensity value of 3.19 × 10⁶ au. Again, with no POIs to measure, the moderate- and low-T alteration samples from ID2016 automatically had the lowest values. Of those POIs actually measured, the high-T alteration ID2016 sample HF437 showed the lowest maximum intensity.
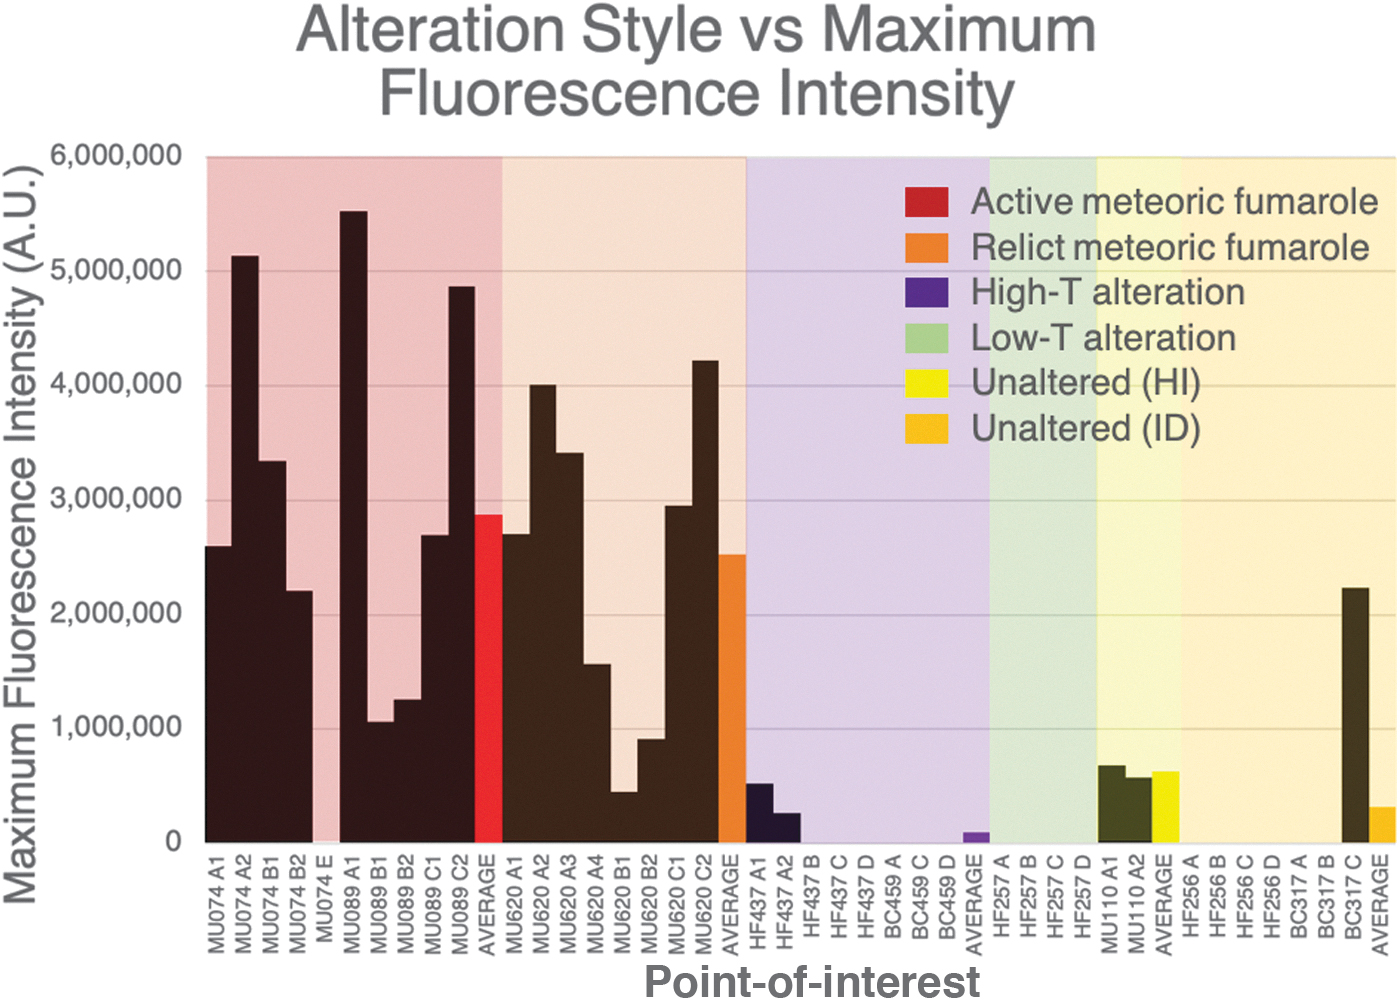
Chart comparing the alteration style of a sample and the average maximum fluorescence intensity measured in each POI during time-resolved measurements (in arbitrary units). Black bars represent the maximum measurement from each individual POI, while colored bars represent the overall average (mean) for that sample type. HI, Hawai'i; ID, Idaho; POI, point-of-interest; T, temperature; A.U., arbitrary units. Color graphics available online.
3.4. Fluorescent material associations with physical properties
Table 3 shows POI locations and associations with materials in the samples. POIs are almost always associated with the presence of WCM either coating or completely filling a vesicle (the exception is HF437), although not all WCM is fluorescent enough to be a POI. Based on EDS analyses of the WCM (Tables 1 and 2 and Supplementary Data), the material was determined to most likely be a zeolite (heulandite or stilbite) or clay mineral (possibly illite) in the HI2016 samples, and clay (montmorillonite, illite) and calcite in the ID2016 suite. In addition, the number of high- and very high-fluorescence pixels in the LIF maps was compared with the maps' locations (edge or interior) within the samples, to show whether sample edges or sample materials were favored for deposition of organic material. Based on these data, there is a slight preference for sample edges as sites of organic material deposition.
Locations of Points of Interest with Respect to Sample Physical Characteristics
The average of the fluorescence component (i.e., the sum of yellow [high-intensity fluorescence] and red [very high-intensity fluorescence] pixels) for each map location (edge or interior) is calculated based on the mean value of pixels per map over the total number of maps per map location.
Maps MU074 A and MU110 A had larger pixel sizes and fewer overall pixels per map (900 and 400, respectively), so the number of red and yellow pixels counted in each map was normalized based on a 1600-pixel map.
WCM, white crystalline mineral; mx, matrix; POI, point-of-interest.
The porosity fractions of the samples were compared with average carbon content for all POIs in a sample in one plot, and average number of red + yellow pixels in all maps of a sample in a second plot (Supplementary Data). The plots demonstrated a lack of correlation, with R 2 values of 0.0103 and 0.021.
4. Discussion
4.1. Correlations between alteration style and fluorescent/organic properties
Carbon content and fluorescence appear to show a correlation with alteration style; in particular, the highest values of these measurements were identified in fumarolic samples (both active and relict). A relative ranking scheme (Table 4) was developed to compare samples across the parameters tested—alteration style versus carbon content (Fig. 5), fluorescence component (Fig. 6), or fluorescence intensity (Fig. 7). Each metric used to compare the different alteration styles (i.e., concentration of carbon measured by the EDS, number of high- or very high-intensity fluorescence pixels in each map, maximum TRF intensity measured at each POI) was assigned a value from 1 to 6, with 1 representing the highest average value measured per sample alteration type and 6 representing the lowest.
Rankings of Alteration Styles Compared with the Carbon/Fluorescent Measurements Illustrated Above: Weight Percentage Carbon Dioxide in Each Point-of-Interest, Fluorescent Pixel Counts Per Map, and Maximum Time-Resolved Fluorescence Intensity Per Point-of-Interest
Lower numbers indicate stronger evidence of organic material.
HI, Hawai'i; ID, Idaho; TRF, time-resolved fluorescence; wt%, weight percentage; POI, point-of-interest; T, temperature.
The weighted average value of the rank scores for each alteration style was calculated, with 40% weight being applied each to the maximum TRF intensity per POI and the number of high- or very high-intensity pixels, and 20% weight being applied to the maximum average weight percentage CO2 per POI. These weights were nominally based on the reliability of the different measurement methods. EDS measurements of carbon concentration in a POI provide only an estimated value because of the limitations of this technique (Newbury, 2009), whereas fluorescence measurements are highly sensitive to the presence of organic compounds (Skulinova et al., 2014; Eshelman et al., 2015, 2018; Shkolyar et al., 2018). An overall ranking of 1 (highest evidence of organic material) to 6 (lowest evidence of organic material) was applied based on the lowest to highest mean values of these individual ranking scores.
This ranked comparison underscores the hypothesis that fumaroles, as sites of hydrothermal activity and sources of chemical energy, would be more likely to host microbial communities than unaltered rocks (Costello et al., 2009; Wall et al., 2015; Medrano-Santillana et al., 2017). The sub-10 ns fluorescence activity shown in TRF measurements of the POIs from these samples is additional compelling evidence for the presence of organic material. Similar spectral ranges and decay times are observed for pure samples of some aromatic amino acids and polycyclic aromatic hydrocarbons in the work of Eshelman et al. (2015)—however, as our samples likely contain multiple organic components in different concentrations, we were unable to individually identify them. In general, the samples from HI2016 showed much higher evidence of organic material than those from ID2016. This suggests that the current conditions in Hawai'i—tholeiitic lavas with a more primitive composition and active hydrothermal alteration (Hughes et al., 2019)—are more preferable for habitation than the conditions in Idaho—no hydrothermal activity and a more evolved lava composition (Stout et al., 1994; Hughes et al., 2019). Interestingly, the single sample from ID2016 displaying the most evidence for organic material, BC317, was field classified as unaltered. Potential explanations for this finding are addressed in correlations between physical properties and organic material distribution section.
While our experiments were not designed to attempt to measure biomass or genetic material in these samples, Cockell et al. (2019) did so in a complementary study using replicates of our HI2016 samples collected during the same field excursions. They used molecular methods to estimate biomass in powdered sample replicates. These biomass estimates were used as a proxy for comparison with our fluorescence data, where it was hypothesized that higher biomass in a sample would correlate to greater evidence of organic material as detected by the LIF. Cockell et al. analyzed a replicate of sample MU100620 (relict fumarole) and found that it contained the highest estimated biomass of all the alteration types measured, in accordance with our finding of the highest evidence for organic material in this sample. These results suggest that fumarolic systems should be targeted for future astrobiology investigations.
The amount of estimated biomass from the MU100110 (unaltered) replicate in the work of Cockell et al. (2019) was almost twice as high as the amount in the active fumarole sample replicates, and very close to the reported amount in the relict fumarole replicate. This is in contrast to the relatively low carbon and fluorescent components measured in our unaltered sample, which is contrary to the assumption stated above. These compared results for the unaltered sample replicates suggest that biomass may not be distributed in this rock in such a way that it is easily detected by the LIF system. The unaltered sample is homogeneous in color (mineralogy) and distribution of WCM; thus, we believe that the biomass detected by Cockell et al. (2019) may have been similarly homogeneously distributed, rather than concentrated in certain more favorable areas of the sample. Without concentration of organic matter into a small area (i.e., a POI), the LIF system is unable to discriminate the material compared with background readings.
The fumarole-derived samples are much more heterogeneous in terms of mineralogy and distribution of WCM. The biomass present in these samples may be similarly concentrated in small areas associated with these alteration products, and therefore be detectable by the LIF. Several studies have shown that microenvironmental conditions, such as small-scale variations in mineralogy, permeability, and distribution of alteration products, will affect the distribution of biomass throughout the rock (Garcia-Pichel et al., 2003; Vos et al., 2013; Kelly et al., 2014; O'Brien et al., 2016; Gentry et al., 2017). Indeed, this heterogeneous distribution is supported in the work of Cockell et al. (2019).
4.2. Correlations between physical properties and organic material distribution
Table 3 demonstrates the distribution of suspected organic material within the physical environment of the sample. The analysis of mineralogical associations indicates a clear preference for the secondary alteration products found in the vesicles of these rocks: phyllosilicates, calcites, and zeolites. These minerals have been extensively reported as support structures for microbial habitation in basaltic environments, both in the surface and in the subsurface (Léveillé et al., 2000; Boston et al., 2001; Ivarsson et al., 2008, 2015; Léveillé and Datta, 2010; Cuadros et al., 2013). The strong fluorescence signatures with short decay times observed in association with these minerals indicate the likely presence of organic material in these POIs. These findings suggest that within terrestrial basalts, biosignatures of microbial communities may more likely be identified within altered material; in particular, associated with vesicles that contain secondary minerals such as calcite, zeolites, or phyllosilicates. All of these minerals are detectable with rover-based instruments.
The preference for organic material to be located near the exposed exterior surface of a sample compared with the interior again emphasizes the importance of a rock's microenvironment for habitability. A weathered exterior would typically accumulate secondary alteration products at a higher rate than the interior of a rock; indeed, many of our altered samples did show heterogeneity in the distribution of alteration products, with a greater concentration toward the edges and tapering off into the interior.
Despite an association between organic material and vesicles, there was no relationship with porosity. This suggests that porosity in and of itself is not an indicator of a rock's habitability and should not be used as a criterion for sample selection during future biosignature investigations. These results also support the other findings in this study, indicating that microbial colonization is associated strongly with alteration products in the vesicles and not the actual basalt matrix. However, it should be noted that the porosity measurements taken in this study do not account for permeability or the distribution in size and shape of vesicles. It is possible that different permeabilities or vesicle size may affect the distribution of organic or fluorescent material, as it would place restrictions on movement of material between pore spaces and the growth of deposited secondary material. Future work is needed.
4.3. Fluorescence as a tool for detection of organic material
While DUV fluorescence-based instruments have been shown through numerous experiments to be sensitive to organic materials in Mars-analog samples (Bhartia et al., 2010; Abedin et al., 2015; Beegle et al., 2015; Eshelman et al., 2015, 2018), there are dangers of false positives associated with the presence of fluorescing minerals in these samples. Calcite, chlorite, stilbite, and heulandite have all been documented to produce fluorescence emission when excited with UV LIF instruments (Joshi and Bhoskar, 1983; Bozlee et al., 2005; Wang et al., 2011). In particular, stilbite and heulandite emission spectra are consistent with the longer duration fluorescence peaks found in some of our samples [e.g., MU100620—see HI2016—MU100620 (Relict Fumarole) section].
However, our application of TRF measurements to these materials is an effective means of distinguishing mineral from organic fluorescence. As discussed, minerals have fluorescence decay times that are orders of magnitude higher (μs to ms) than those of organic materials (<10 ns) (Blacksberg et al., 2010; Gaft and Panczer, 2013; Skulinova et al., 2014; Abedin et al., 2015; Eshelman et al., 2015, 2018). In the example of sample MU100620 (Fig. 3), the TRF contour plots (Fig. 3f, g) show peaks with different intensities and decay periods: a high-intensity, quick-decay peak at ∼425–430 nm, believed to represent organic material fluorescence; and a low-intensity, long-decay peak at ∼350–360 nm, believed to represent mineral fluorescence.
Additional evidence to support the distinction between organics and minerals with this method is the fact that some visible patches of WCM within the sample maps did not have high enough fluorescence intensity to be considered as POIs (see Supplementary Data; Figs. SM6–8 and SM10–11). These patches were measured with the EDS and found to be composed of the same minerals as POIs—chlorite, clays, and zeolites—but their fluorescence properties were different. Relative fluorescence intensity is another distinguishing feature of organic material, with the complexity of organic molecules enhancing the fluorescence intensity compared with minerals (Eshelman et al., 2015, 2018; Lymer, 2017). We therefore infer that these non-POI patches of WCM did not contain adsorbed organic material.
A recent study (Shkolyar et al., 2021) has demonstrated that the presence of Ce3+ in Mars-analog geological samples may mimic the <10 ns fluorescence decay time and the emission wavelengths typically associated with organic materials. This is a confounding factor that must be taken into consideration during a Mars mission. In our samples, while there is no evidence of Ce3+, Cockell et al. (2019) have confirmed the presence of biological material. Thus, we posit that our measurements indicate true biosignatures.
TRF is a valuable tool in any LIF-Raman system intended for potential biosignature detection. While our instrument is capable of sub-ns resolution for TRF measurements, the Perseverance rover's SuperCam instrument has a 40 ns-maximum resolution for time gating and SHERLOC relies solely on its DUV wavelength to discriminate organic materials from minerals (Beegle et al., 2016; Wiens et al., 2016, 2017; Eshelman et al., 2019; Caffrey et al., 2020).
4.4. Implications for astrobiology
Overall, the findings of this study suggest that the young, hydrothermally active, primitive, water-adjacent lavas of Hawai'i are readily colonized by microbial life, even if these lavas are not extensively altered (e.g., MU100110), and thus might be more likely to contain preserved organic biosignatures. Conversely, the older, nonfumarolic, evolved, high-desert environment lavas of Idaho show less evidence for wide distribution of organic material.
The evidence here moreover shows that secondary mineral deposits within the vesicles of these rocks are the primary targets for microbial colonization, rather than the rock itself—suggesting that secondary minerals and the presence of vesicles may be used as part of the strategic selection of potential samples for more detailed astrobiology investigations. The sample from Idaho showing the highest evidence of organic material was field classified as unaltered but contained deposits of calcite that showed similar fluorescence characteristics to the zeolite and clay deposits in the vesicles of the HI2016 samples, implying that some alteration had occurred. This emphasizes the importance of alteration conditions that facilitate the deposition of these secondary minerals, rather than inherent lava geochemistry, in promoting the habitability of volcanic rocks; and further suggests basaltic rocks with identifiable alteration features such as secondary minerals are potential high-yield targets for astrobiology investigations.
The small-scale variations in organic material distribution, along with weak correlations between organics and physical properties, demonstrate the need for the collection and analysis of a large and diverse sample suite during Mars exploration. Visual interpretation at the outcrop scale or measurements taken from a remote instrument are insufficient for fully assessing the potential for past inhabitation and preservation of organic biosignatures. The LIF/TRF mapping technique utilized here, in contrast, is especially suitable for this task, and may aid in triaging targeted outcrops and/or collected samples. Millimeter-scale mapping of a sample or outcrop surface can reveal concentrated areas of fluorescent material, highlighting the heterogeneous distribution of potential biosignatures. TRF measurements can subsequently be used to distinguish between organic and inorganic fluorescence. Biosignature-mimicking compounds such as Ce3+ (discussed in Shkolyar et al., 2021) must be taken into consideration at this stage, however, further underscoring the fact that complementary analyses by different instruments must be utilized before a true biosignature can be confirmed.
5. Conclusion
In this study, an experimental LIF instrument with TRF capabilities was used to examine the distribution of organic materials in Mars-analog basalts. Basalts were collected from two analog Mars volcanic environments representing different environmental and alteration conditions. LIF maps were created of sample surfaces that showed areas of highly fluorescent material compared with background. These areas were further examined with TRF and SEM-EDS techniques, confirming the presence of organic matter at these highly fluorescent points. The organic matter was found to be associated with secondary alteration minerals located in vesicles. Rocks that contained these minerals were mostly found in Hawai'i Volcanoes National Park, a hydrothermally active young volcanic environment, although a single sample from Craters of the Moon National Monument also showed strong evidence of organic material associated with calcite deposits in the vesicles. This demonstrates the importance of targeting rocks showing visible signs of alteration and secondary mineral deposits during astrobiological investigations on Mars.
Footnotes
Authors' Contributions
C.H.R. contributed to conceptualization, methodology, software, data curation, investigation, writing—original draft, writing—review and editing, visualization. M.G.D. performed supervision, conceptualization, validation, resources, writing—review and editing, project administration, funding acquisition. A.L.B. contributed to conceptualization, resources, writing—review and editing, funding acquisition. G.F.S. performed conceptualization, resources, writing—review and editing, project administration, funding acquisition, supervision. D.S.S.L. contributed to project administration and funding acquisition.
Acknowledgments
We acknowledge the many contributions of members of the Planetary Instrumentation Laboratory at York University for assistance with lab instrumentation setup and analytical techniques, especially Kristen Cote, James Freemantle, Dylan Hickson, Emmanuel Lalla, and Elizabeth Lymer. Keagan Lee was an invaluable research assistant during the summer of 2018. We thank the Craters of the Moon National Monument and Preserve (Permit #CRMO-2014-SCI-0004), their staff, and the community of Arco, Idaho, all located on the traditional lands of the Shoshone-Bannock tribes. We also thank the staff of Hawai'i Volcanoes National Park (Permit #HAVO-2016-SCI-0023) and the Kilauea Military Camp, which are located on the lands of the Kanaka ‘Oiwi people. Finally, we acknowledge the anonymous reviewer and the Editor-In-Chief of Astrobiology for their insightful comments and revision suggestions. This is BASALT Publication Number BASALT-2021-001.
Author Disclosure Statement
No competing financial interests exist.
Funding Information
This work was supported by the Canadian Space Agency FAST grant awarded to G.F.S. and the NASA Planetary Science and Technology Through Analog Research (PSTAR) Program (NNH14ZDA001N-PSTAR) grant (14-PSTAR14_2-0007) to D.S.S.L.
Supplementary Material
Supplementary Data
Abbreviations Used
References
Supplementary Material
Please find the following supplemental material available below.
For Open Access articles published under a Creative Commons License, all supplemental material carries the same license as the article it is associated with.
For non-Open Access articles published, all supplemental material carries a non-exclusive license, and permission requests for re-use of supplemental material or any part of supplemental material shall be sent directly to the copyright owner as specified in the copyright notice associated with the article.