
Abstract
To determine microbial evolutionary strategies to low-pressure (LP; 5 kPa) growth, an environmental condition not experienced on Earth until ∼20 km in altitude, a previously described evolutionary experiment was conducted. The resulting LP evolved strain WN1106, isolated from the terminus of the experiment, was shown to have several genomic mutations absent in the ancestral strain, WN624. Three of the mutations were in regulatory genes: resD, walK, and rnjB. Here we report on transcriptional microarray data from the LP-evolved WN1106 and compare those results with the previously reported ancestral WN624 transcriptional array data at either 5 or 101 kPa. At 5 kPa, WN1106 differentially expresses signals that are under the control of regulators ResD, WalK, and RnjB compared with (1) itself at ∼101 kPa and (2) WN624 at 5 kPa. These results were further confirmed by quantitative reverse transcriptase–polymerase chain reaction of a target transcript from each regulon. This work indicates that the three mutated coding regions had transcriptional control effects on each respective regulon.
1. Introduction
Current robotic missions to extraterrestrial environments, such as the Mars Science Laboratory (MSL), pose possible planetary protection concerns as outlined by international planetary protection regulations established by the Committee on Space Research (COSPAR) (Rummel et al., 2002; Bruckner et al., 2009; Nicholson et al., 2009). The concern of a terrestrial microorganism surviving interplanetary transit conditions on a spacecraft is reasonable, as several spore-forming bacteria including Bacillus spp. are common contaminants of spacecraft and their assembly facilities. These environments are considered extreme in nature as they are constantly exposed to low-humidity, low-nutrient conditions and exposure to disinfection by chemicals and ultraviolet (UV) (Venkateswaran et al., 2001; Nicholson, 2009).
As the most visited body, the extreme conditions at the surface of Mars are of primary focus in extreme environmental survivability experiments. Air temperature at the surface averages −61°C and ranges from −113°C to −39°C (Martínez et al., 2017). However, at local noon the ground temperature can transiently climb as high as +17°C to +28°C, as measured by the MER-1 and MER-2 rovers, respectively (Martínez et al., 2017). The atmosphere is dominated by CO2 (96%), with lesser amounts of N2 (1.9%), Ar (1.9%), O2 (0.15%), and traces of other gases (Mahaffy et al., 2013). The atmospheric pressure of Mars averages ∼0.6 kPa; this is 168 times lower than Earth's sea-level atmospheric pressure of ∼101.3 kPa.
Under most of the pressure-temperature conditions on present-day Mars, water is mostly locked up as ice either at the polar caps or in the regolith, and a small and variable amount sublimates into the atmosphere as vapor. However, abundant evidence exists indicating that liquid water once flowed on the martian surface (Malin and Edgett, 2003), pointing to an ancient potentially habitable Mars. Moreover, the recent detection by radar of a large (20 km) lake of liquid water located 1.5 km below Mars' southern ice cap (Orosei et al., 2018) revives the possibility that present-day microbial life may exist there, in a manner similar to that seen in subglacial Arctic and Antarctic lakes (Laybourn-Parry and Pearce, 2016; Rutishauser et al., 2018).
Low pressure (LP) (hypobaria) is not an extreme environmental condition at which life is typically found on Earth; the pressure at the top of Mt. Everest is ∼33 kPa. Terrestrial life is believed to have evolved within the troposphere, where the lower pressure limit is ∼10 kPa. To determine the effect of LP on bacterial growth, Bacillus spp. known to be spacecraft contaminants were exposed to a range of pressures from ∼101 to 2 kPa (Schuerger and Nicholson, 2006). Cells were significantly impaired in their ability to grow at pressures <10 kPa, and the lowest pressure at which growth was observed in any of the Bacillus spp. was 2.5 kPa (Schuerger and Nicholson, 2006). However, multiple examples exist of bacteria capable of growth at close to the average Mars surface pressure, 0.7 kPa (Nicholson et al., 2013; Schuerger et al., 2013; Schuerger and Nicholson, 2016). These organisms were identified from environmental samples and are mostly not well characterized, making them at the present moment poor choices for which to study molecular effects of LP on cells. Only one of the previously described organisms, Serratia liquefaciens, has been characterized for an LP transcriptional response (Fajardo-Cavazos et al., 2018).
Owing to the lack of a natural hypobaric (<10 kPa) environment and no model organism with which to study LP responses, an evolution experiment was conducted to determine whether a model microorganism, Bacillus subtilis, could adapt (defined here as cellular changes because of long-duration exposure) to a lowered pressure at which it initially grew poorly (Nicholson et al., 2010). In brief, Luria-Bertani media was inoculated with B. subtilis strain WN624 (Table 1) and cultured at 5 kPa for ∼1000 generations (Nicholson et al., 2010). Daily optical density measurements showed an increase in growth ability during the course of 1000 generations. At the termination of the experiment, strain WN1106 was isolated from the culture. Strain WN1106 was shown to be capable of outcompeting the ancestral strain WN624 at LP (5 kPa), but not at normal atmospheric pressure (∼101 kPa) (Nicholson et al., 2010). Subsequent whole genome resequencing of LP-evolved strain WN1106 revealed eight mutations (seven single nucleotide polymorphisms and one 9-nt deletion) that had occurred during the evolution experiment and which were not present in the ancestral strain WN624 (Waters et al., 2015).
Bacillus subtilis Strains and Plasmids Used in This Study
→, transformation.
BGSC, Bacillus Genetic Stock Center.
Of these eight mutations, three occurred in the coding regions of transcriptional and post-transcriptional regulators: resD, walK, and rnjB. Here we report investigation into known targets of these systems by reanalysis of the ancestral WN624 transcriptional microarray results (Waters et al., 2014) and comparing them with the transcriptomes of LP-evolved strain WN1106 cultivated at ∼101 and 5 kPa. Quantitative reverse transcriptase–polymerase chain reaction (qRT-PCR) analyses confirmed the results of the microarray experiments and lend further support that these three mutations affected global gene-expression profiles of strain WN1106 at 5 kPa when compared with (1) the ancestor, WN624, and (2) itself at ∼101 kPa.
2. Materials and Methods
2.1. Bacterial strains, media, and growth conditions
B. subtilis strains and plasmids used in this study are listed in Table 1. The ancestral strain WN624 (trpC2, amyE::spc) was derived from the laboratory strain 168 (Maughan et al., 2006). LP-evolved strain WN1106 (trpC2, amyE::spc) was derived after evolution of strain WN624 for 1000 generations of growth at 5 kPa (Nicholson et al., 2010). Strains PB153 and PB344 were generous gifts from Chet Price. Strains were constructed by transformation using chromosomal DNA isolated from the donor strains (Harwood and Cutting, 1990) to transform the recipient strains as described previously (Boylan et al., 1972).
For routine cultivation and most experiments, Miller LB medium (Miller, 1972) was used. For plates, liquid medium was solidified with agar (1.5% final concentration). Where appropriate, medium was supplemented with the following antibiotics (final concentration): chloramphenicol (Cm; 5 μg/mL); erythromycin (Erm; 5 μg/mL); neomycin (Neo; 5 μg/mL); or spectinomycin (Spc; 100 μg/mL). For sporulation experiments, cells were cultivated in a modified Spizizen minimal medium (Spizizen, 1958) containing the appropriate auxotrophic requirements at a final concentration of 50 μg/mL and supplemented with the “Sporulation Salts” from Schaeffer sporulation medium (Schaeffer et al., 1965).
Cells were grown in 125 mL Klett flasks under pressure conditions of 1 atmosphere (∼101 kPa) or 5 kPa as described in detail previously (Nicholson et al., 2010; Fajardo-Cavazos et al., 2012). Cultures were shaken at moderate speed (∼170 rpm) on a rotary shaker at 27°C. Optical density was measured with a Klett-Summerson photometer fitted with the No. 66 (660 nm; red) filter. Under these conditions, 100 Klett units = 1 OD660 = ∼1 × 10⁸ cells/mL.
2.2. RNA isolation
An equivalent mass of cells (10 or 100 mL from overnight cultures grown at ∼101 or 5 kPa, respectively) were harvested by centrifugation (∼2000 × g), the supernatants removed by aspiration, and the cell pellets frozen at −70°C. Approximately 4 × 10⁹ cells were obtained from each sample, estimated from culture optical densities determined before centrifugation. Total RNA was extracted from cells and treated with RNase-free DNase using the RiboPure Bacteria Kit (Ambion) following the manufacturer's protocol. The resulting RNA sample concentrations and purity were determined by UV absorbance measurements at 260 and 280 nm (Sambrook et al., 1989). RNA integrity number (RIN) values (Schroeder et al., 2006) were obtained on an Agilent 2100 Bioanalyzer (Agilent Technologies) using the RNA 6000 Nano Assay. The average RIN value of the samples was 9.71, indicating the high quality of the RNA preparations.
2.3. Transcription microarray experiments
Downstream processing of total RNA, performance of microarrays, and analysis of data were described in detail previously (Waters et al., 2014) and are reiterated briefly here. Total RNA samples were sent to the University of Florida Interdisciplinary Center for Biotechnology Research (UF-ICBR) for fluorescent labeling with Cy3 or Cy5 and microarray analyses. A custom glass slide microarray (GE 8x15K 60-mer; Agilent Technologies) was designed and built using the B. subtilis strain 168 genome sequence (Kunst et al., 1997). For each sample, ∼12 μL of RNA at a concentration of 500 ng/μL was loaded for a total RNA content of 6 μg. For sample layouts, refer to Table 2.
Microarray Experimental Probe Layout
2.4. Microarray data analysis
Gene names, locations, and descriptions were cross-referenced using the GenoList archive server (
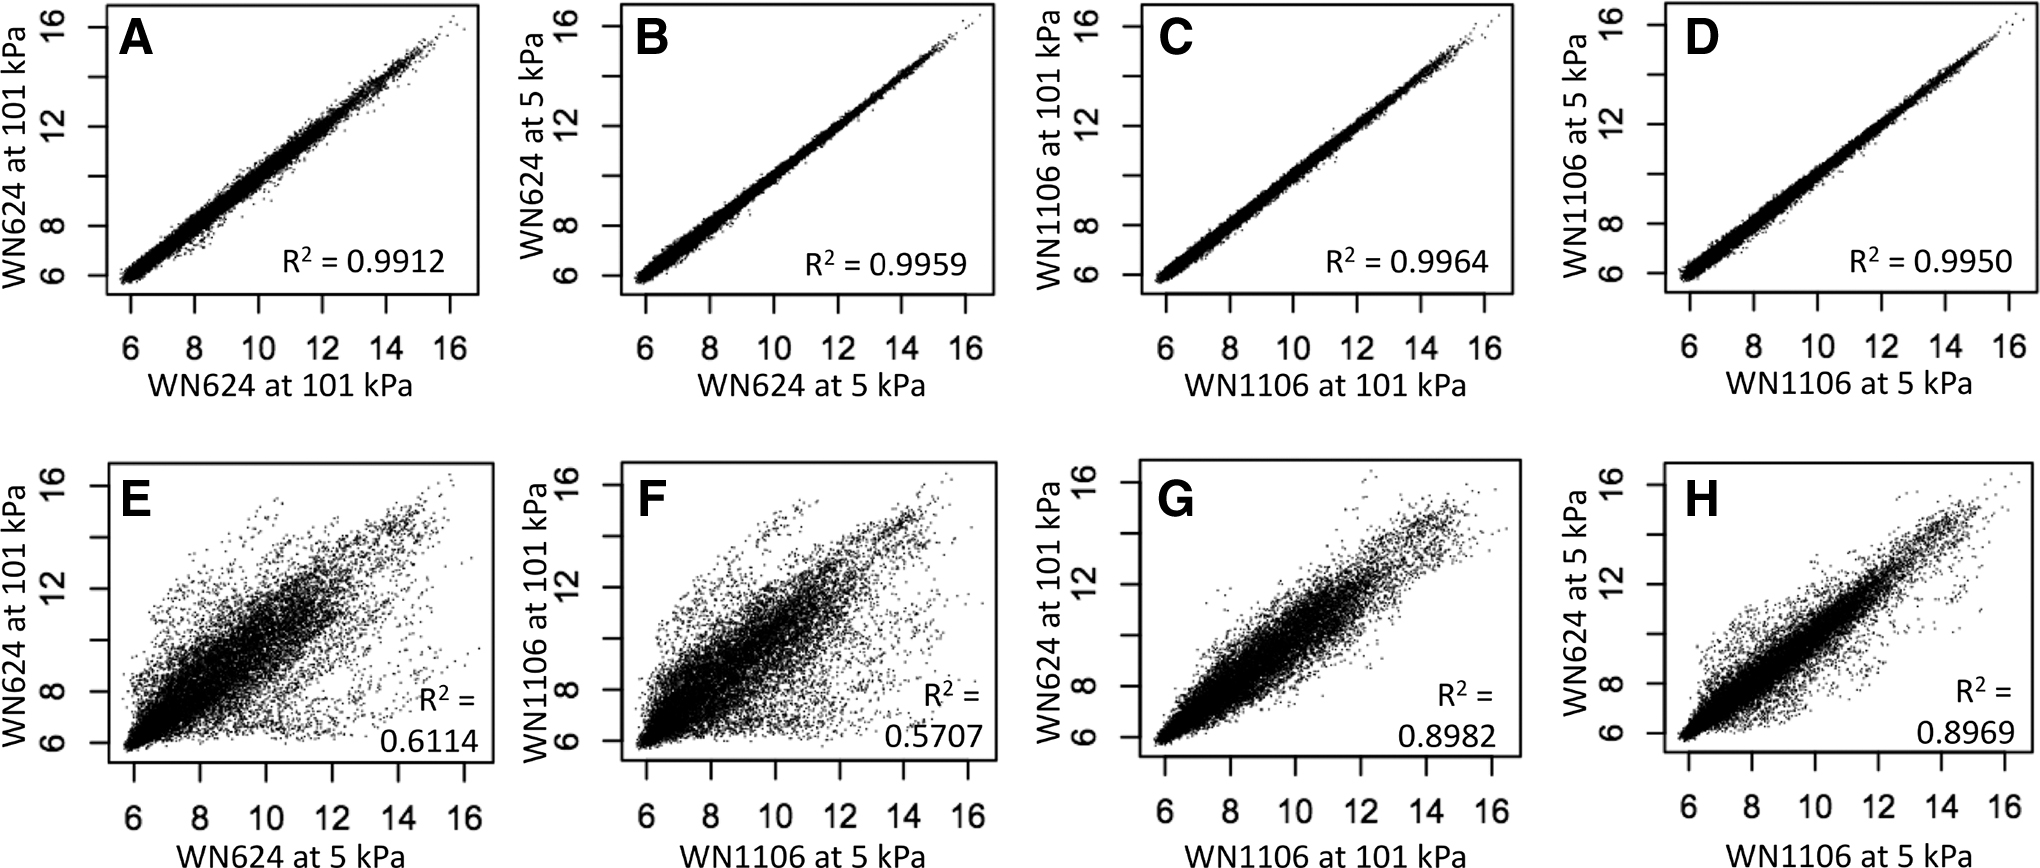
Plots of Cy3 versus Cy5 log fluorescent intensity for microarrays. See text for details. Results of panels
Variations between the replicate microarray experiments were removed with quantile normalization (Bolstad et al., 2003). The analysis of differential gene expression was performed using the Linear Models for Microarray Analysis (Ritchie et al., 2015) package (freely available at
2.5. Quantitative reverse transcriptase–polymerase chain reaction
qRT-PCR was conducted by standard methods as described previously (Fajardo-Cavazos et al., 2012). In brief, primers (Sigma) were used to amplify target transcripts from cultures grown under conditions of ∼101 or 5 kPa. cDNAs were generated and amplified using the SuperScript III Platinum SYBR Green One-Step qRT-PCR kit (Invitrogen) according to the manufacturer's protocol. For each condition, three technical replicates of biologically duplicate cultures were performed and averaged (Fig. 2). Reactions were performed in a MiniOpticon real-time PCR detection system (Bio-Rad) and each product was confirmed by melting curve analysis. Expression changes were calculated with the 2−(ΔΔCt) method (Livak and Schmittgen, 2001).
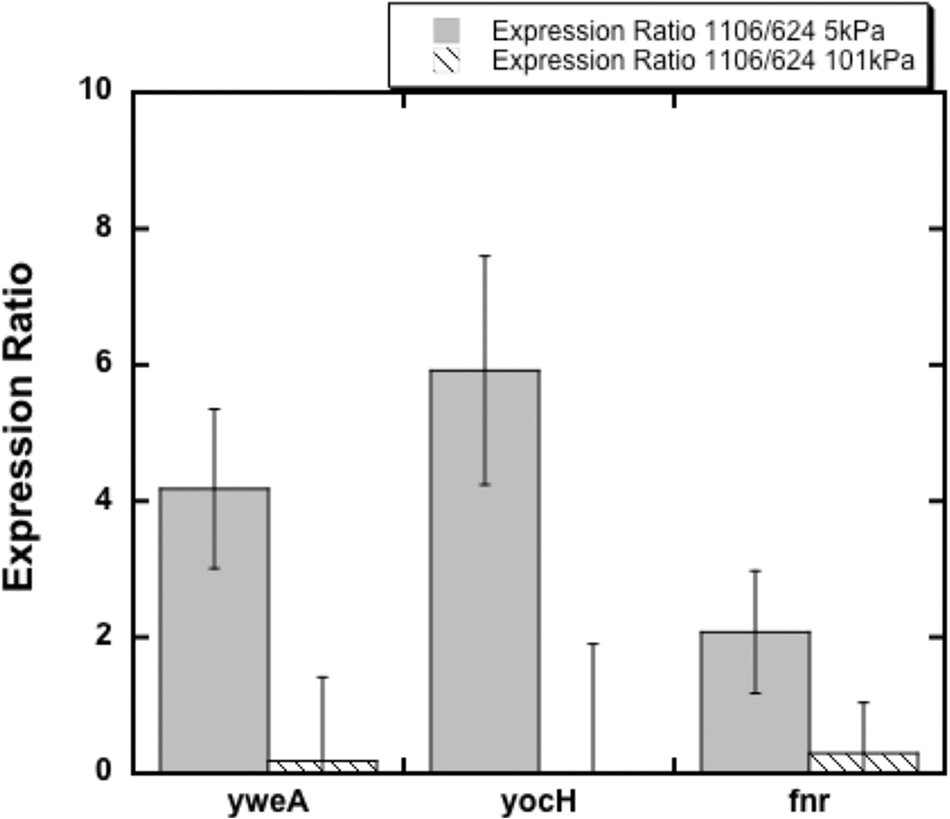
qRT-PCR of yweA, yocH, and fnr expression ratios in WN1106 to WN624 at 5 kPa (gray bars) and 101 kPa (striped bars). Error bars represent standard error of averages of technical triplicates of experimental duplicates. All differences in expression of the same gene at the two different pressures were significant (ANOVA; p < 0.05). ANOVA, analysis of variance; qRT-PCR, quantitative reverse transcriptase–polymerase chain reaction.
2.6. β-galactosidase assays
Constructed strains carrying the sigB-dependent, general stress response (GSR)-inducible ctc-lacZ gene fusion (Table 1) were first tested for induction of β-galactosidase activity by ethanol, a known inducer of the GSR (Boylan et al., 1993). Cultures were grown in liquid LB at 27°C to early logarithmic phase (∼30 Klett units) then split. To one subculture was added ethanol to a final concentration of 5%, and incubation was continued for 45 min. To test for LP induction of ctc-lacZ expression, cultures were inoculated into LB at ∼5 Klett units, grown at 27°C to early logarithmic phase (∼20 Klett units). A zero-time sample was taken, then the cultures were split into twelve 2 mL subcultures, of which six were incubated at ∼101 kPa and six were incubated at various LP conditions (5, 10, 25, or 50 kPa) for a further 2.5 h. Culture OD660 values were determined, then a 1 mL sample from each tube was centrifuged and the resulting cell pellet frozen at −20°C for subsequent β-galactosidase assay. Thawed cells were lysed and assayed for β-galactosidase activity as described previously (Nicholson and Setlow, 1990). β-galactosidase activity is expressed in Miller units (Miller, 1972).
2.7. Competition experiments
Competition experiments were performed as described previously (Nicholson et al., 2010; Fajardo-Cavazos et al., 2012). In brief, triplicate cultures of the two strains to be tested were co-cultivated in 125 mL flasks containing 10 mL LB medium without antibiotics at 27°C with shaking, either at ∼101 or 5 kPa. On day 0, strains were each inoculated at an initial OD660 of ∼0.015. On each succeeding day, fresh cultures were prepared by 1:100 dilution of the previous day's culture into 10 mL of sterile LB. For each day of the competition, including day 0, viable counts were determined by plating serial 10-fold dilutions made in phosphate-buffered saline (PBS) buffer (52) onto LB agar plates containing the appropriate antibiotic. Competition experiments were conducted for 7 days (∼50 generations) and relative fitness values were calculated as previously described (Woods et al., 2011; Nicholson, 2012).
2.8. Sporulation frequency
Triplicate flasks containing 10 mL Spizizen minimal media with 1 × sporulation salts were inoculated to ∼0.015 OD660 from overnight cultures and incubated at either 5 or ∼101 kPa with shaking at 27°C. At 24, 48, and 72 h, 1 mL samples were removed, diluted serially 10-fold in PBS, and plated before and after heat shock (80°C, 10 min). Frequency of sporulation was determined by dividing spore titers (after heat shock) by total viable titers (before heat shock).
2.9. Data availability
The complete set of microarray data were deposited in the Gene Expression Omnibus (GEO) database at the National Center for Biotechnology Information (
3. Results
3.1. Microarray analysis of global gene expression of B. subtilis strains WN624 and WN1106 at 5 kPa
To gain a greater understanding of the global gene expression changes occurring in strains WN624 and WN1106 in response to growth at LP, the two strains were compared by using a series of transcriptional microarrays. The data are summarized as scatter plots in Fig. 1. First, to confirm RNA integrity and consistency of probe labeling, four control microarrays were run by using the same RNA sample labeled with Cy3 versus Cy5. In each case the data were tightly clustered and displayed high correlation coefficients (R 2) of 0.9912, 0.9959, 0.9964, and 0.9950, respectively (Fig. 1A–D). Next, two types of experimental microarrays were run (Table 2). The first type compared the transcriptomes of the same strain grown at atmospheric pressure (∼101 kPa) versus LP (5 kPa) in ancestral strain WN624 (Fig. 1E) and LP-evolved strain WN1106 (Fig. 1F).
The data showed a profound alteration of the global transcriptomes of both strains, affecting the transcript levels of hundreds of genes. The large dispersion of the data were evident both visually and by the lower R 2 values of 0.6114 and 0.5707, respectively (Fig. 1E, F). The second type of experiment compared the transcriptome of ancestral strain WN624 versus LP-evolved strain WN1106 when they were cultivated at the same pressure, either ∼101 kPa (Fig. 1G) or 5 kPa (Fig. 1H). Under both conditions considerable dispersion could also be visualized in the data, indicating that the global transcriptomes of strains WN624 and WN1106 differed substantially at ∼101 kPa (R 2 = 0.8982) (Fig. 1G) and at 5 kPa (R 2 = 0.8969) (Fig. 1H).
All transcripts displaying greater than a twofold difference in expression and a value of p ≤ 0.05 were collected in Supplementary Tables S1–S4. A total of 983 signals were significantly upregulated, downregulated, or both, across the arrays, representing ∼25% of the B. subtilis genome; some signals were significantly differentially up or down between WN1106 when compared with the ancestor WN624 at either 5 or ∼101 kPa. Of note, there was a far more robust upregulation in both strains at 5 kPa compared with downregulated signals. There were differences in the transcript levels within functional pathways as well; for example, WN1106 highly upregulated desKR (Fajardo-Cavazos et al., 2012), whereas the ancestor WN624 did not.
Although the overall differences between the two strains at LP is interesting, here we investigated transcripts under control of the ResDE and WalRK two-component systems (TCS) and transcripts under maturation and degradation control by the RnjA/B complex (Table 3). These three systems were previously reported to have been mutated in WN1106 (Waters et al., 2015). In addition, phenotypes of spore formation and the GSR at LP were compared between the two strains, as signals related to these were shown to be differentially expressed between the two strains in the microarray data. Owing to a strong induction of the SigB-dependent GSR, previously reported to be induced by LP growth in the ancestral strain WN624 (Waters et al., 2014), and also shown to be upregulated in strain WN1106, LP SigB-induction and gene-knockout studies were conducted in the LP strain WN1106 and compared with the ancestor results. Both strains were tested for the ability to form spores under LP conditions, as spores of Bacillus are a concern of terrestrial extreme microbial survival in extraterrestrial environments.
Differentially Expressed Transcripts of the ResDE and WalKR Two-Component Systems and of the RnjA/RnjB Complex
Bold values indicate p > 0.05.
Ye et al. (2000); Mäder et al.
3.2. ResDE and the anaerobic response
In both strains, there was observed a robust anaerobic response due to the lowered partial pressure of dissolved oxygen in the media under LP conditions; signals from the LP microarrays have been reported before to be differentially expressed in low-oxygen and aerobic gene expression studies of B. subtilis (Ye et al., 2000). mRNA signals for genes involved in nitrate and nitrite respiration (narIJHG, narK, nasD) and genes involved in the hypoxic response (fnr, resDC) are upregulated in either one or both WN1106 and WN624 at 5 kPa (Table 3). Due to the induction of fnr and resD, both of which are regulator signals involved in the low-oxygen response of B. subtilis, the corresponding signals they regulate are also differentially expressed. However, there is a significant difference in expression of some of these genes between the two strains. For example, WN1106 upregulated the narIJHG operon sevenfold greater than WN624 at 5 kPa, indicating that there may be a regulation change in the anaerobic response of WN1106 at LP conditions.
Differences in the low-oxygen response between the two strains may be due to the mutation (P110Q) previously reported in WN1106 that occurs in the coding region of resD (Waters et al., 2015). As previously discussed in Waters et al. (2015), structural alignments showed the P110G in ResD, an OmpR-like response regulator, corresponds to a stretch of amino acids involved in homodimerization in this group of proteins (Solá et al., 1999; Waters et al., 2015). ResD does not form homodimers (Zhang and Hulett, 2000), yet there are multiple binding sites for ResD at some ResD-dependent promoters, such as the promoter of ctaA (three binding sites) (Zhang and Hulett, 2000), which are required for full expression. This indicates potential molecule–molecule interactions at such promoter regions.
Here we investigated whether a signal under control of the ResDE TCS is differentially expressed in LP-evolved WN1106 compared to WN624 at 5 kPa. For this purpose, fnr was used; this target gene was chosen for qRT-PCR due to the fact that there is only one ResD binding site at the promoter region of the gene, compared to other ResDE-dependent genes. The reason for this choice was that, if there were multiple effects of the mutation, that is, molecule–molecule interactions at promoter regions, as well as DNA-binding and signaling interactions, a gene whose regulation was only dependent on one ResD complex binding the promoter region would simply indicate whether the P110Q mutation affected the complex at LP. The expression ratio of fnr between WN1106 and WN624, though not highly pronounced is significantly different as determined by ANOVA pairwise comparison (Fig. 2). The LP microarray and qRT-PCR data indicate that there is a low-oxygen response difference between the two strains when grown at 5 kPa. This difference between the two strains could be due to the mutational change in resD in strain WN1106.
3.3. WalRK and membrane fluidity
Paralleling homeoviscous membrane adaptations documented in piezotolerant and piezophilic bacteria, hypobaria most likely affects membrane lipid bilayers and their fluidity (Allen et al., 1999; Meersman and Heremans, 2008; Oger and Jebbar, 2010). Therefore, it is not unexpected that genes involved in fatty acid desaturation (des, desR, and desK) are differentially expressed at LP in WN1106 (Supplementary Table S2). However, a previous investigation into the fatty acid desaturation genes in LP-evolved WN1106 did not reveal a change at the local genomic level to explain the differences at 5 kPa in WN1106 compared to ancestral WN624 (Fajardo-Cavazos et al., 2012). And though a des mutant of WN1106 grew more poorly than wild-type WN1106 at LP, the des mutant still had a higher fitness than WN624, indicating changes in other genomic regions in WN1106, outside of the fatty acid desaturase response, are responsible for its LP expression changes (Fajardo-Cavazos et al., 2012).
WalK has been reported to respond to fluctuations in membrane fluidity and depletion of WalK in the cell activates the DesKR TCS, resulting in increased des transcription (Bisicchia et al., 2007). Previously it was reported that LP-evolved WN1106 contained a mutation in the coding region of walK (T195M) (Waters et al., 2015). This mutation occurs in one of two transmembrane helix regions that have intermolecular contacts with two regulators of WalK kinase activity, YycI and YycH; further, deletion of these contacting residues has been shown to cause expression changes in targets of the WalKR TCS (Szurmant et al., 2008).
For these reasons, expression levels of the WalKR-dependent gene yocH were compared in WN1106 and WN624 when grown at 5 and ∼101 kPa (Fig. 2) to confirm whether the mutation in walK had a regulatory effect. The expression ratio indicated that yocH levels were indeed significantly increased in strain WN1106 at 5 kPa; this is further supported by the microarray data (Supplementary Tables S3 and S4). These data support that the mutational change in walK does cause a change in regulon expression at LP in WN1106.
3.4. RnjA/B global mRNA processing complex
There was a deletion event that occurred in WN1106's genome of nine nucleotides in the coding region of rnjB; this resulted in a three amino acid deletion of residues A183, K184, and I185 (Waters et al., 2015). rnjB codes for RnjB (RNase J2), which together with RnjA (RNase J1) forms a complex (RnjA/B complex) that is part of one of the major mRNA global processing systems in B. subtilis (reviewed in Condon, 2010). The known primary function of RnjB is that of an endoribonuclease (Even et al., 2005; Mathy et al., 2010) with RnjA, the essential riboenzyme in the complex, having a exoribonuclease function and an endoribonuclease function (Mäder et al., 2008; Condon, 2010; Mathy et al., 2010).
Transcriptional analysis of an RnjB knockout, an RnjA knockdown, and a double RnjA/B mutant have been reported (Mäder et al., 2008; Durand et al., 2012). Our own transcriptional studies were analyzed for differences in signals shown to be affected in an earlier study of a rnjB-deletion mutant (Table 3) (Mäder et al., 2008). In addition, of interest, an earlier study (Mathy et al., 2010) investigated the decay rate of two transcripts, yweA and spoVG, which were upregulated in a double RnjA/B mutant. Both signals were found to be upregulated in WN1106, but not WN624, at 5 kPa (Tables 3; Supplementary Tables S2 and S4) and levels of these two transcripts were lower in WN1106 compared with WN624 at ∼101 kPa (Supplementary Table S3).
To further determine whether the deletion in rnjB affects mRNA signals of known targets, yweA transcript expression levels of WN1106 and WN624 were compared by using qRT-PCR of cells grown at 5 and ∼101 kPa (Fig. 2). yweA expression levels were significantly higher in WN1106 compared with WN624 at 5 kPa, further supporting that the deletion in rnjB may be altering the function of the RnjA/B complex when grown at 5 kPa, but not at ∼101 kPa.
3.5. Differential expression of other cellular regulons at 5 kPa: The GSR and sporulation
The GSR regulon in B. subtilis consists of >150 target genes, expression of which is induced in response to starvation and a variety of environmental stresses (Price, 2002; Höper et al., 2005; Hecker et al., 2007). As previously reported, nearly one-third of the upregulated genes (87 of 298) of the ancestor WN624 at LP belonged to the SigB-dependent GSR, including sigB itself, and this response was determined to be induced in ancestral strain WN624 when pressures dropped to and below ∼10 kPa, as determined by a SigB-dependent ctc-lacZ reporter gene fusion (Waters et al., 2014).
Here, LP-evolved strain WN1106 was also found to strongly induce the SigB-dependent GSR at LP (Supplementary Tables S1–S4). To continue the investigation of LP induction of the SigB-dependent GSR, a ctc-lacZ reporter gene fusion (Brigulla et al., 2003) was similarly introduced into LP-evolved strains carrying either the wild-type allele or a knockout mutation in the sigB gene (Table 1 and Fig. 3), as was previously conducted for the ancestor WN624 (Waters et al., 2014). To assure that ctc-lacZ expression was properly regulated by SigB in the LP-evolved strain (Table 1), we first induced the GSR by the classical treatment of ethanol during exponential growth at a 5% final concentration and assayed for β-galactosidase activity after 45 min (Fig. 3A). This indicated that the ctc-lacZ fusion appeared to be a reliable reporter of the SigB-dependent GSR in the LP-evolved strain.
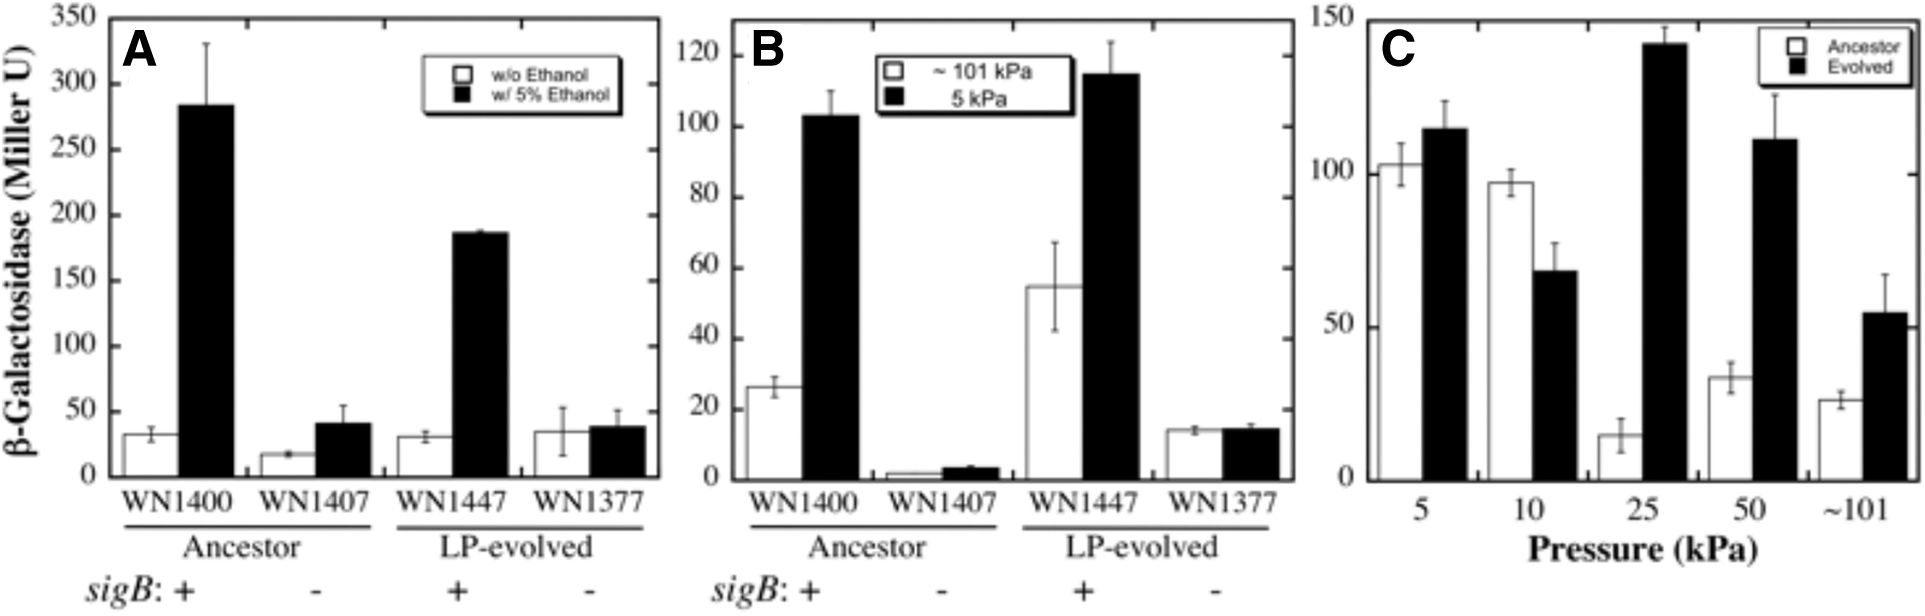
Determination of pressure induction of the SigB-dependent GSR using a ctc::lacZ reporter fusion. Strains used and their relevant genotypes are denoted in the figure. All ancestral expression data reworked from Waters et al. (2014).
Next, the ctc::lacZ reporter in the LP-evolved strain was tested for induction of the GSR by exposure to 5 kPa (Fig. 3B). After exposure to 5 kPa for 2.5 h, ctc-lacZ expression was induced in the LP-evolved strain, corresponding to what was reported previously in the ancestral strain, each of which carry the wild-type sigB + allele (Fig. 3B). In contrast, no LP induction of ctc-lacZ fusion expression was observed in the analogous LP-evolved strain carrying the sigB-knockout mutation (Fig. 3B).
We noted that at normal atmospheric pressure (∼101 kPa), the background level of ctc-lacZ fusion expression was approximately twofold higher in the LP-evolved strain than in the ancestral strain (Fig. 3B). Therefore, expression of the ctc::lacZ fusion was monitored in the LP-evolved strain, carrying the sigB + allele, at pressures of ∼101, 50, 25, 10, and 5 kPa (Fig. 3C). As previously reported, the ancestral strain did not induce ctc-lacZ expression until pressure was lowered to 10 or 5 kPa (Waters et al., 2014) (Fig. 3C). In contrast, it was striking to note that ctc-lacZ fusion expression in LP-evolved strain was strongly induced at higher pressures of 50 and 25 kPa (Fig. 3C). Thus, it appears that the LP-evolved strain WN1106 may have become more sensitive to GSR induction by LP exposure. The underlying reasons for this possible sensitivity are unknown at this time, as whole genome resequencing did not show mutations in regulons outside of rnjB, resD, and walK. Although other mutations, previously analyzed and discussed (Waters et al., 2015), did occur in WN1106's genome, these mutations were determined to not be involved in the GSR or other regulatory roles in B. subtilis.
The microarray data (Supplementary Tables S1–S4) and the results of the ctc-lacZ reporter experiments (Fig. 3) indicated that the SigB-dependent GSR was induced by exposure to LP both in ancestral and LP-evolved strain backgrounds. We were interested in investigating what the significance, if any, a sigB knockout mutant would have on the relative fitness of B. subtilis LP-evolved strains at 5 kPa. It has been previously shown that a sigB null mutant had no noticeable disadvantage compared with the wild-type ancestor when grown at any of the stress conditions (starvation or environmental) known to induce the SigB-mediated GSR (Boylan et al., 1993; Waters et al., 2014). Therefore, as with the other inducing conditions of the GSR, LP could be causing a redundant protective state that has no fitness advantage.
We therefore constructed a congenic derivative of LP-evolved strain WN1106, carrying a sigBΔΔ2::cat insertion–deletion (Table 1), which was used to assess relative fitness at ∼101 and 5 kPa (Fig. 4). To compare relative fitnesses, all constructed strains were used in pairwise competition experiments against a common strain, WN1261, which is congenic to ancestral strain WN624 but which carries an amyE::neo marker (Table 1). Introduction of the sigBΔ2::cat mutation did not significantly affect the fitness of the LP-evolved strain relative to the ancestor at either ∼101 or 5 kPa (Fig. 4). The data thus indicated that the SigB-mediated GSR exerted no significant effect on the competitive fitness of either ancestral or LP-evolved B. subtilis strains at either normal atmospheric pressure or at an LP of 5 kPa. This result is consistent with previous observations that a sigB null mutant has little to no growth disadvantage under other environmental stresses.

Relative fitness values of congenic ancestral strains WN624 (amyE::spc) and WN1232 (amyE::spc, sigBΔ2::cat) and congenic LP-evolved strains WN1106 (amyE::spc) and WN1233 (amyE::spc, sigBΔ2::cat) at ∼101 kPa (open bars) or 5 kPa (shaded bars). Each strain was competed against wild-type strain WN1261 (amyE::neo) for 50 generations and relative fitness values computed as described in Section 2 and previously (Nicholson et al., 2010). Fitness values were compared by ANOVA (n = 21). Ancestor fitness data were adapted from Waters et al. (2014).
Because LP seems to inhibit cellular processes important for normal growth and division, and owing to the differential expression of a number of sporulation-related signals in both strains at LP, it was decided to briefly investigate whether the process of sporulation is inhibited at 5 kPa. To this end, a simple sporulation frequency experiment was conducted in both strains WN624 and WN1106 to compare their ability to form spores at ∼101 and 5 kPa (Fig. 5). Both strains were capable of forming spores after 3 days at 5 kPa; however, this ability was greatly reduced from ∼101 kPa total spore titers and sporulation frequency (Fig. 5). Of interest, the ancestor showed a greater ability to form spores at 5 kPa than the LP-evolved strain. It is noted that LP-evolved WN1106 resulted from an evolution experiment at 5 kPa in LB media and that the sporulation experiment was conducted in Spizizen media containing sporulation salts at 5 kPa; it is unknown what metabolic differences in the presence of various medias the two strains may have.

Average sporulation frequency at 5 and ∼101 kPa of strains WN624 and WN1106 over 3 days.
4. Discussion
Relatively little is known of how LP affects cellular processes, or how microbial life responds to LP. In this communication, transcriptional microarrays were compared from two strains, LP-evolved strain WN1106 and ancestor WN624, to determine (1) genes differentially expressed during hypobaric growth, (2) different LP responses between the ancestor and evolved strains, and (3) genes that may have been affected by mutations that occurred during the 5 kPa evolution experiment in WN1106. The overall transcriptional differences in the LP response of the two strains when grown at 5 kPa indicates that there exist genomic alterations in the LP-evolved strain WN1106 that may be affecting transcriptional and/or post-transcriptional processes, such as what was reported with upregulation of desKR (Fajardo-Cavazos et al., 2012). It is thought that some of these transcriptional alterations are believed to be caused by mutations in the coding regions of resD, walK, and rnjB.
Target genes under control of the ResDE and WalRK TCS were found to be differentially expressed at 5 kPa between the two strains. These differences may be owing to single nucleotide polymorphisms occurring in resD and walK coding regions that have been previously reported (Waters et al., 2015). It was also shown that yweA and spoVG (Table 3), which are processed by the RnjA/B global RNA processing complex, were also differentially expressed. It is thought that these differences may be owing to the 9-nt deletion in rnjB previously reported in WN1106 (Waters et al., 2015). The microarray data were confirmed by using single targets of each complex by qRT-PCR, results of which support that the three mutations may have a regulation phenotype at 5 kPa in the LP-evolved WN1106.
It is not thought that the 9-nt deletion knocks out the full functionality of RnjB because, previously it was reported that a full gene knockout of rnjB does not significantly affect LP-evolved WN1106 fitness at LP or 101 kPa (Waters et al., 2015). Therefore, it is thought that this deletion alters the role of RnjB in the complex, but at this time how the alteration to the RnjA/B complex affects growth at LP is still unknown.
Under normal cellular conditions, WalKR targets are induced or repressed, depending on the target, during exponential growth. We have previously reported that at 5 kPa B. subtilis reaches stationary phase much earlier in optical density, but when cells are returned to standard pressure, there is an immediate return to exponential growth with no lag phase (Nicholson et al., 2010). This could indicate that one or more exponential growth processes are being inhibited at LP (e.g., proper cell division); the mutation in walK could be a cellular target to overcome this inhibitory effect.
Owing to the overlapping environmental conditions of LP and lowered oxygen levels, it is unknown how low-oxygen and LP adaptation and responses would complement each other. Therefore, it is difficult to pull out meaning in the anaerobic response at LP growth in the transcriptional microarrays and the resD mutation in WN1106. However, it is important to note that it is not believed that this mutation is solely relevant to LP conditions. Previous comparisons of WN1106 and WN624 under oxygen-limiting conditions at ∼101 kPa indicated that WN1106 had a lowered relative fitness compared with WN624 (Fajardo-Cavazos et al., 2012). In addition, when nitrate was used as the terminal electron acceptor WN1106 did not grow better than WN624 anaerobically at ∼101 kPa (Nicholson et al., 2010). Any LP phenotype of WN1106 does not seem, at this point, to indicate an overlapping low-oxygen benefit to growth, which has been seen with some other environmental insults, such as extreme desiccation and radiation resistance (Mattimore and Battista, 1996).
Our investigation of the phenotypic difference between the GSR activation at various lowered pressures by reporter gene fusions in both strains revealed that WN1106 induces the GSR at higher pressures than WN624. Strain WN1106 strongly induced the GSR at 50 kPa, the equivalent of ∼5000 m above sea level, the approximate altitude of the city of La Rinconada, Peru (pop. 30,000). In sharp contrast, ancestral strain WN624 has been previously shown to induce the GSR at 10 kPa, the equivalent of an altitude of ∼16,000 m, nearly twice the height of Mt. Everest (8848 m). However, the SigB-dependent GSR does not confer an increased fitness to LP when compared with a knockout sigB strain in either WN624 or WN1106 [this work and Waters et al. (2014)]. Nor does the sigB deletion in WN1106 decrease its relative fitness over the ancestor, WN624.
Investigation into sporulation at LP revealed that WN624 has a greater ability to form spores in Spizizen minimal medium supplemented with sporulation salts compared with WN1106. It is of note that because the 5 kPa evolution experiment that gave rise to WN1106 was conducted in LB media (Nicholson et al., 2010), and other media have not been tested at LP for either strain, the growth in Spizizen media could confound a sporulation–phenotype comparison between the two strains.
5. Conclusion
This is one of the first studies of a terrestrial microorganism's response and transcriptional change to hypobaric conditions, which has relevance to understanding the limits of Earth microorganisms' survivability to extreme extraterrestrial environments. Here we scrutinized a transcriptional microarray experiment, showing >1000 coding regions underwent differential expression at experimental conditions, for changes to three regulons controlled by mutated regulators: resD, walK, and rnjB. Signals from each of these three regulons were shown to have differential expression at LP in WN1106 compared with its ancestor strain, WN624. The microarray experiments were confirmed by qRT-PCR and reveal that single points of change in transcriptional regulatory machinery in the cell may have profound and unexpected results at specific growth conditions, here 5 kPa compared with ∼101 kPa.
Of these three mutated coding regions, the 9-nt deletion in rnjB and the corresponding transcriptional data showed that this nonessential ribonuclease may play a more nuanced role in the RnjA/B complex than previously thought. Deletion studies of rnjB show little to no change in transcript levels that are processed by the RnjA/B complex (Mäder et al., 2008; Mathy et al., 2010). However, these experiments were conducted at standard B. subtilis growth conditions in terms of temperature, pressure, nutrients, and so on. This highlights the importance of evolution experiments in gleaning regions of the genome previously thought of as nonessential, and unrelated to any previously reported stress response, which could produce a phenotype and cellular response at nonstandard or nonoptimal growth conditions.
The data reveal the plasticity of long-term adapted terrestrial, mesophilic organisms to extreme environments and the rather rapid changes (here, within 1000 generations) that occur during such exposures. These results further advance the knowledge of how a microorganism senses and responds to changes in pressure and complements previous experimental data on piezophilic organism adaptations, specifically to the fluidity of the cellular membrane. At higher pressure, the membrane may be forced into a more crystalline or solid state (Winter and Jeworrek, 2009); inversely, LP may cause a more fluid or leaky membrane, however no research has previously shown or pointed to membrane stability issues at LP. Previously, desKR was investigated for genomic changes leading to the increased signal expression at 5 kPa in WN1106 compared with the ancestor, WN624 (Fajardo-Cavazos et al., 2012); however, there were no local changes to the genome to explain the upregulation. The two-component sensor kinase system, WalKR, senses and responds to membrane fluidity changes and connections it makes with other transmembrane proteins affects its regulatory response, including its regulation of desKR transcripts. The point mutation in walK and the corresponding transcriptional changes to the WalKR regulon owing to LP growth are the first works to support the hypothesis that lower pressure affects the cell's membrane possibly in opposite and inverse ways to high pressure.
Singular extreme conditions in environments often have a parallel extreme, such that microbial adaptation to one leads to exposure and survival advantages in the other, for example, desiccation-induced DNA break repair leading to increased UV resistance of Deinococcus radiodurans (Mattimore and Battista, 1996). A more apparent connection can be seen with LP and a reduction in available oxygen. With the exception of an environment where O2 is the dominant atmospheric constituent, lowering pressure is directly coupled to a decrease in available oxygen.
The results of the LP, transcriptional microarrays show an upregulation of the anaerobic response in B. subtilis at 5 kPa, which is the first microbial evidence showing the link between an LP and low oxygen growth environment. The subsequent genomic results revealing a mutation in resD, which codes for ResD of the two-component sensor kinase system ResDE involved in anaerobic regulation, of WN1106 further supports that microbial adaptation to LP in a facultative anaerobe would correspond to oxygen response and regulation. These results also broaden questions about microbial response to LP; for example, what would the cellular response of an anaerobic bacteria grown at LP reveal? Further work on LP and microbial growth studies is needed in the future to fully understand LP as an extreme environment on cellular systems.
Authors' Contributions
W.L.N. established the project. All authors conducted laboratory and computational analyses. S.M.W. wrote the article, which was edited by W.L.N. and J.A.R.-M.
Footnotes
Acknowledgment
The authors thank Chet Price for the generous donation of strains used in this study.
Author Disclosure Statement
No competing financial interests exist.
Funding Information
This research was supported by grants from the NASA Astrobiology: Exobiology and Evolutionary Biology program (NNX08AO15G) to W.L.N., the NASA Planetary Biology Internship (PBI) program to J.A.R.-M., and the NASA Earth and Space Science Fellowship (NESSF) Program (NNX13AP74H) to S.M.W.
Supplementary Material
Supplementary Table S1
Supplementary Table S2
Supplementary Table S3
Supplementary Table S4
Abbreviations Used
Associate Editor: Petra Rettberg
References
Supplementary Material
Please find the following supplemental material available below.
For Open Access articles published under a Creative Commons License, all supplemental material carries the same license as the article it is associated with.
For non-Open Access articles published, all supplemental material carries a non-exclusive license, and permission requests for re-use of supplemental material or any part of supplemental material shall be sent directly to the copyright owner as specified in the copyright notice associated with the article.