
Abstract
The icy moons of the outer Solar System display evidence of subsurface liquid water and, therefore, potential habitability for life. Flybys of Saturn's moon Enceladus by the Cassini spacecraft have provided measurements of material from plumes that suggest hydrothermal activity and the presence of organic matter. Jupiter's moon Europa may have similar plumes and is the target for the forthcoming Europa Clipper mission that carries a high mass resolution and high sensitivity mass spectrometer, called the MAss Spectrometer for Planetary EXploration (MASPEX), with the capability for providing detailed characterization of any organic materials encountered. We have performed a series of experiments using pyrolysis-gas chromatography-mass spectrometry to characterize the mass spectrometric fingerprints of microbial life. A range of extremophile Archaea and Bacteria have been analyzed and the laboratory data converted to MASPEX-type signals. Molecular characteristics of protein, carbohydrate, and lipid structures were detected, and the characteristic fragmentation patterns corresponding to these different biological structures were identified. Protein pyrolysis fragments included phenols, nitrogen heterocycles, and cyclic dipeptides. Oxygen heterocycles, such as furans, were detected from carbohydrates. Our data reveal how mass spectrometry on Europa Clipper can aid in the identification of the presence of life, by looking for characteristic bacterial fingerprints that are similar to those from simple Earthly organisms.
1. Introduction
The global subsurface oceans of Europa and Enceladus (Kivelson, 2000; Thomas et al., 2016; Lunine, 2017), icy moons of Jupiter and Saturn, respectively, are believed to be among the most promising places in the Solar System for extraterrestrial life. The NASA/ESA/ISA Cassini-Huygens mission, on its flybys past Enceladus, identified and sampled the plumes at the South Polar Terrain (SPT) of Enceladus. Apart from small molecules including water and methane (Magee and Waite, 2017; Waite et al., 2017), these plumes were found to contain complex organic matter, with molecular masses above 200 u (Postberg et al., 2018b), as well as smaller reactive nitrogen- and oxygen-bearing molecules (Khawaja et al., 2019).
Europa is also believed to have similar plumes (Roth et al., 2014; Sparks et al., 2016; Jia et al., 2018; Paganini et al., 2020), and it will be the subject of the upcoming NASA Europa Clipper mission (Howell and Pappalardo, 2020). The detection of molecular hydrogen (H2) in the plume of Enceladus (Waite et al., 2017), as well as the detection of nanosilica grains in Saturn's E ring (Hsu et al., 2015; Sekine et al., 2015), is plausible evidence for hydrothermal processes, which raises the possibility of habitable conditions in the subsurface. Methane has also been detected and may have a biological origin (McKay et al., 2012).
On Earth, Archaea and Bacteria have adapted to live in many different types of extreme environments, such as hyper saline lakes, extremes of temperature and pressure, and highly acidic and alkaline habitats (Fiala and Stetter, 1986; Mykytczuk et al., 2013). Extremophiles are also believed to be the earliest form of life that inhabited Earth (Nisbet and Sleep, 2001). Among the living organisms found on Earth, extremophiles are the most likely to be found on icy moons, due to the extreme nature of the environments found there (Merino et al., 2019). Should microorganisms be present on icy moons, it is possible that orbiting spacecraft would be able to detect them in ice grains within the plumes (Porco et al., 2017; Bouquet et al., 2019). Bubble scrubbing could significantly enhance the concentration of bacteria in the plumes, increasing the likelihood of their detection (Blanchard and Syzdek, 1972, 1982).
Mass spectrometry is a powerful tool for the identification of molecules. One of the scientific instruments to be included onboard the Europa Clipper will be the MAss Spectrometer for Planetary EXploration (MASPEX), a high mass resolution (>25,000), high sensitivity (ppb to ppt) time-of-flight mass spectrometer (Brockwell et al., 2016). Similar to the Ion and Neutral Mass Spectrometer (INMS) onboard Cassini, MASPEX will sample and analyze gaseous material as it passes through the potential plumes of Europa. INMS also analyzed fragmentation molecules generated by the impact of material, such as ice grains, on the instrument's antechamber, and was able to detect fragments of large organic molecules believed to originate from ice grains in Enceladus' plume and Saturn's E ring (Postberg et al., 2018b).
In the MASPEX instrument, molecular fragmentation is likely to occur as material, such as ice grains or microorganisms, impacts the MASPEX antechamber walls, or from radiolytic processes from sputtering of Europa's surface. The impact process creates fragments that go on to produce complex mass spectra, which are similar to those obtained by pyrolysis-mass spectrometry (py-MS). For fragmentation to occur, the internal energy of bonds within a molecule must reach the level at which atomic separation leads to dissociation (the dissociation energy).
Internal energy can be gained in several ways, including heating, collision, or adsorption of photons. It is the total cumulative internal energy that can cause dissociation, not the source (Johnstone and Rose, 1996). Molecular fragmentation and the patterns generated are related to the individual bond strengths so they can be reasonably assumed to be more characteristic of molecular structure than of the origin of internal energy. For example, mass spectrometry collision-induced fragmentation mechanisms are often used as a guide to explain pyrolysis fragmentation mechanisms (Meuzelaar et al., 1982). Although different energy-driven dissociation of organic molecules may share similarities based on bond strength, it should be remembered that different techniques have the potential to produce different products.
py-MS is often coupled with gas chromatography, a technique that separates molecular fragments that are dependent on their retention time, resulting in simpler individual mass spectra and enabling a more accurate identification of the analyzed molecules. py-MS has been applied to a wide range of materials, including the analysis of microorganisms (Simmonds, 1970; Meuzelaar and Kistemaker, 1973). In these studies, protein and carbohydrate fragments were detected from different strains of bacteria, and significant differences were observed between the pyrolysates of biological and meteoritic samples.
Characterization and classification of different bacteria strains was carried out using py-MS; however, this has mostly been confined to the popular strains Escherichia coli and Bacillus subtilis (Voorhees et al., 1988, 1997). Cyanobacteria have also been the subject of extensive pyrolysis studies due to their potential use as biofuels (Biller and Ross, 2014; Anand et al., 2016). Mechanisms for the creation of pyrolysis products from different components of bacteria have also been discussed in detail in the literature (Chagas et al., 2016; Gautam and Vinu, 2019).
The Europa Clipper spacecraft will also contain another complementary mass spectrometer, the SUrface Dust Analyzer (SUDA), which will capture and analyze dust grain particles released from Europa's surface by impacts and in its potential plumes (Kempf et al., 2014). Klenner et al. (2020a, 2020b) used analog experiments to investigate the detection of amino acids, fatty acids, and peptides in both water-rich and salt-rich ice grains in an ocean world context, producing impact ionization mass spectra. They also found that up to encounter velocities of 8 km/s, the analyzed complex organic molecules remained largely intact.
In this study, we use pyrolysis-gas chromatography-mass spectrometry (py-GC-MS) to analyze a series of terrestrial Archaea and Bacteria, as analogues of the types of microorganisms that could be present on icy moons. The data generated are converted into mass spectra similar to that which will be obtained by MASPEX. These data could also be potentially applicable to SUDA. The demonstrated ability of MASPEX-like mass spectra to detect and identify fragmentation fingerprints from Archaea and Bacteria encourages optimism for the search for life at Europa and other ocean-bearing moons.
2. Methods
2.1. Sample preparation
Extremophile Bacteria and Archaea strains were purchased in freeze-dried form from DSMZ GmbH. Two Cyanobacteria, Spirulina and Chlorella, were also analyzed. These were purchased in powdered form from Whole Foods Market (Naturya brand, 100% cyanobacteria with no additives). For pyrolysis experiments, 0.4 mg of the sample was placed in a quartz pyrolysis tube plugged with quartz wool at each end; 0.4 mg of bacteria equates to ∼103 cells.
2.2. Pyrolysis-gas chromatography-mass spectrometry
py-GC-MS was performed with a 2000 Pyroprobe fitted via a CDS 1500 valve interface. A schematic of the experimental setup is shown in Fig. 1. Samples were heated to 650°C, at a rate of 20°C/ms, and held there for 15 s, in a flow of helium. The pyrolysis unit was coupled to a 6890 gas chromatograph coupled to a 5973 quadruople mass spectrometer (both Agilent Technologies). The GC inlet was held at 270°C. Separation of molecules, based on their chemical and physical properties, was performed on a DB-5ms ultra inert column (J&W; 30 m × 0.25 mm × 0.25 μm), operated in split mode (10:1) with a helium column flow rate of 1 mL/min.
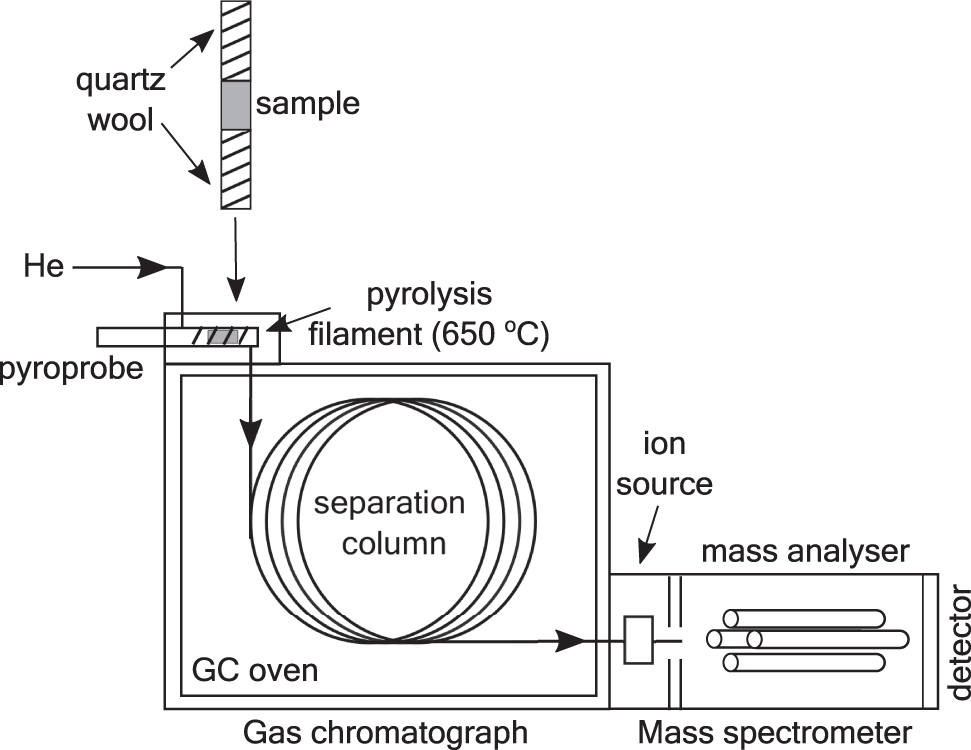
Schematic of the pyrolysis-gas chromatography-mass spectrometry setup.
Split mode is used to prevent overloading of the sample column and to ensure good chromatograph peak shapes. The gas chromatograph oven was held at an initial temperature of 40°C for 2 min, then increased at a rate of 5°C/min to reach a final temperature of 310°C, which was held for 10 min.
Mass spectra of the gases released from the sample were acquired over two different ranges: m/z 10–100 and m/z 45–550. Mass spectra were acquired in two ranges to maximize the signal response for the different m/z values. MASPEX will be able to acquire data up to approximately m/z 600. However, in this study, a maximum of m/z 550 was used as pyrolysis results in the fragmentation of larger molecules. Identification of peaks in the chromatograms was carried out by using the Agilent MSD Chemstation software with comparison to the NIST mass spectral library and also previous literature studies of the pyrolysis of bacteria (Simmonds, 1970; Kebelmann et al., 2013).
At least three repeat experiments using fresh samples were performed for each strain analyzed. Mass spectra were generated by summing all the ions detected in the relevant time range (2–45 min) of the gas chromatogram. The relative intensity of the ions in the mass spectra are, therefore, directly related to their relative abundance in the total ion current.
2.3. Extremophile strains investigated
In total, seven extremophile Archaea and Bacteria strains and two Cyanobacteria strains were analyzed. The Archaea and Bacteria strains analyzed in this study are detailed in Table 1, along with the extremophile type, their place of isolation, and growth conditions. These microbial strains were chosen as they cover a wide range of different extremes of temperature, pH, and salinity, and therefore are relevant to different environments that may be present on icy moons, for example, hydrothermal vents, sea ice, etc.
Archaea and Bacteria Strains Investigated in This Study
Of the three Archaea strains that were analyzed, two of them thrive in high temperatures. Metallosphaera hakonensis is a thermoacidophile isolated from hot springs in Japan (Takayanagi et al., 1996; Kurosawa et al., 2003). M. hakonensis grows in a temperature range of 50–80°C, and acidic environments in the pH range 1.0–4.0. Pyrococcus furiosus is a hyperthermophile, isolated from geothermally heated marine environments, and grows optimally at 100°C (Fiala and Stetter, 1986).
A sulfate-reducing thermophilic bacterium, Thermodesulfovibrio islandicus, was also analyzed. T. islandicus is found in anaerobic niches associated with slightly alkaline thermal springs (Bowman et al., 1997). At the other end of the temperature range, cold-adapted species have also been analyzed. These include the archaeon, Halorubrum lacusprofundi, isolated from the hypersaline (28% w/v) Deep Lake, Antarctica, where it can grow at temperatures as low as −1°C.
Three other cold- and salt-tolerant bacteria were also analyzed: Planococcus halocryophilus, Halomonas halodenitrificans, and Shewanella frigidimarina. P. halocryophilus is able to grow at temperatures as low as −15°C in the permafrost active-layer soil (Mykytczuk et al., 2013). S. frigidimarina is an iron-reducing strain isolated from Antarctic sea ice (Bowman et al., 1997). The cold- and salt-adapted strains, H. lacusprofundi, P. halocryophilus, H. halodenitrificans, and S. frigidimarina, may be able to live in the cold salty water present in the oceans of the icy moons, Europa and Enceladus. P. halocryophilus is also able to survive in alkaline environments, up to pH 11, which is similar to the expected pH of Enceladus' ocean (Glein et al., 2015).
P. furiosus and T. islandicus are able to withstand slightly alkaline conditions, up to pH 9. Hydrothermal vents on the ocean floor may have temperatures suitable to sustain the thermophiles examined in this study: M. hakonensis, P. furiosus, and T. islandicus.
Two Cyanobacteria strains were also analyzed: Arthrospira platensis, commonly known as the dietary supplement Spirulina, and Chlorella. Although these strains are not extremophiles, they present a different type of bacteria that are rich in proteins and low in lipids (Becker, 2007). Both Chlorella and Spirulina grow in alkaline freshwater environments.
3. Results
3.1. py-GC-MS of Archaea and Bacteria
Figure 2 shows the py-GC-MS total ion currents of four different strains analyzed in this study: the archaeon M. hakonensis, the bacteria H. halodenitrificans and S. frigidimarina, and the cyanobacterium Spirulina. For completeness, the py-GC-MS total ion currents of the five other strains analyzed in this study, P. furiosus, T. islandicus, H. lacusprofundi, P. halocryophilus, and Chlorella, are shown in Supplementary Fig. S1.
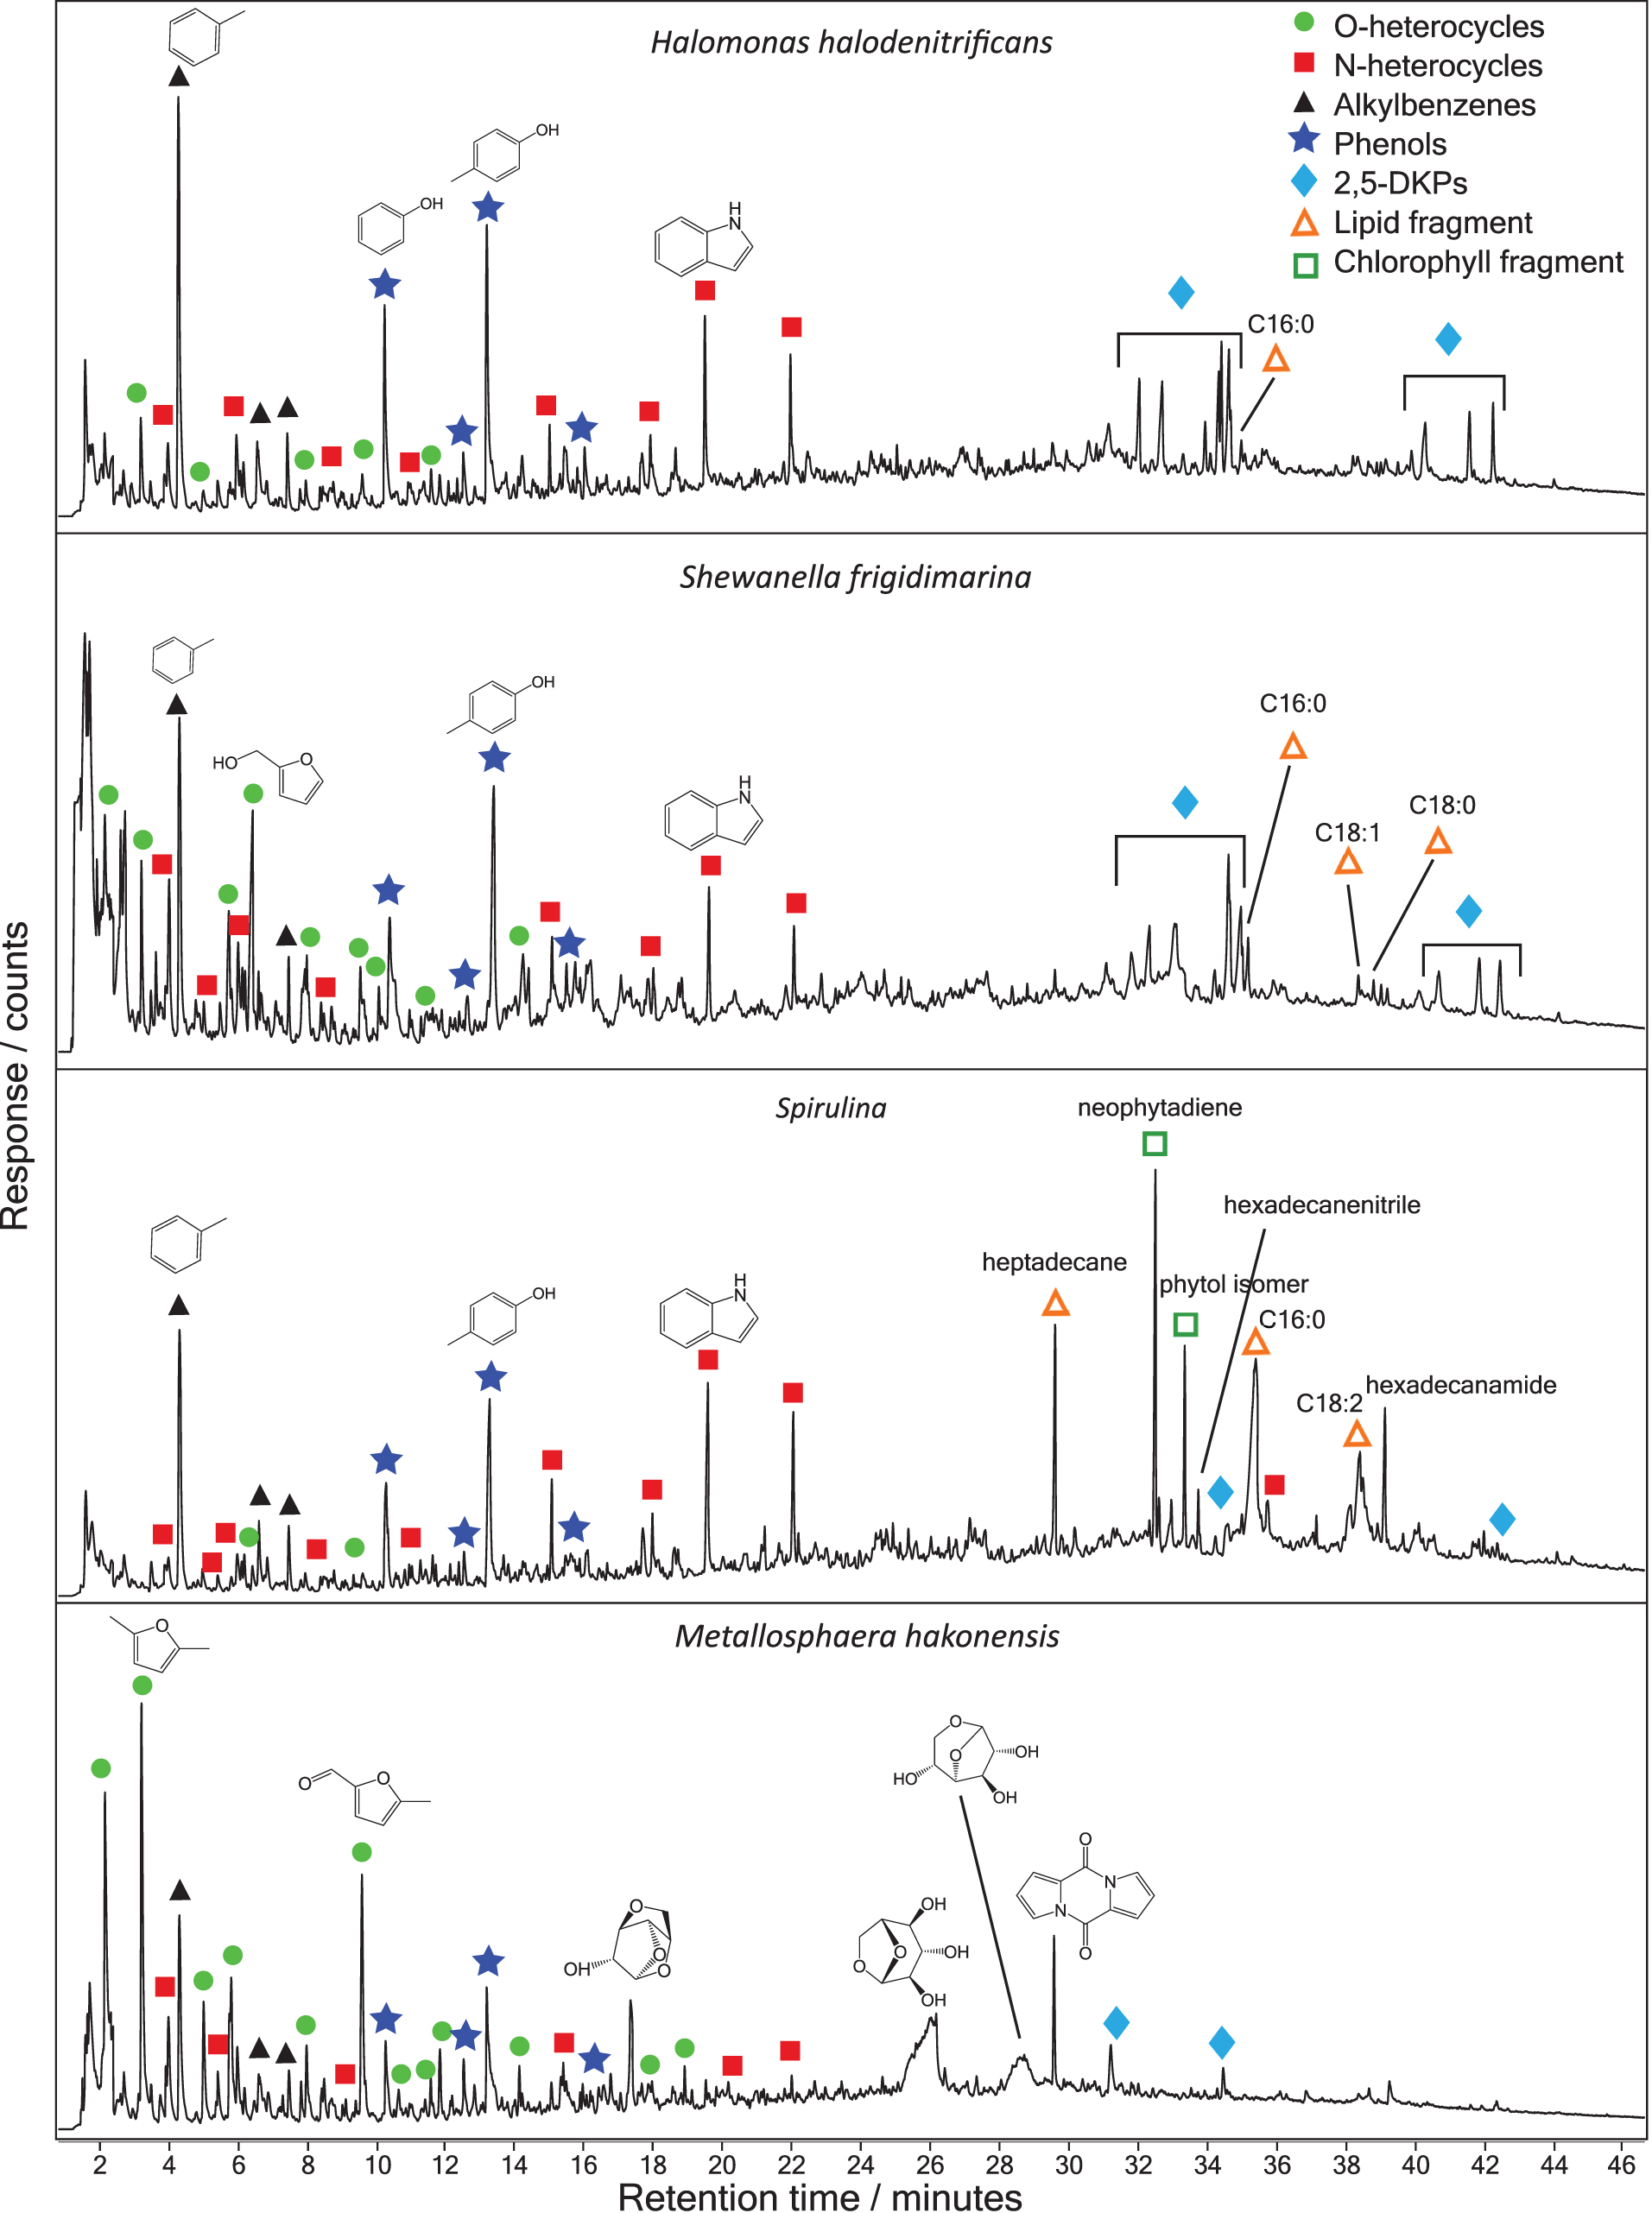
Pyrolysis-GC-MS total ion chromatograms of Halomonas halodenitrificans, Shewanella frigidimarina, Spirulina, and Metallosphaera hakonensis (from top to bottom). Peaks corresponding to different compound families are labeled according to the legend. 2,5-DKPs, 2,5-diketopiperazines; GC-MS, gas chromatography-mass spectrometry. Color images are available online.
As can be seen from Fig. 2, the total ion currents of the different strains show variations although there are common peaks observed in all the strains. In the earlier retention time period, up to 24 min, the total ion currents of S. frigidimarina, Spirulina, and H. halodenitifcans are dominated by toluene, phenolic compounds [phenol and 4-methylphenol (p-cresol)], and the nitrogenated compounds, indole and methyl-indole. Toluene, phenol, and indole are probably degradation products of amino acids and proteins.
Alkylbenzenes can be derived from the amino acid phenylalanine, phenol from the amino acid tyrosine, and indole from tryptophan (Tsuge and Matsubara, 1985). Low abundances of other molecules were observed and assigned to nitrogen containing compounds: pyrrole, pyridine, and benzyl nitrile; the alkylbenzenes styrene and ethylbenzene; and other phenols, including 2-methylphenol (o-cresol) and 4-ethyl-phenol. In the total ion current of S. frigidimarina, a series of other peaks identified as oxygen heterocycles were detected between 2 and 15 min.
These oxygen heterocycles are believed to be the degradation products of carbohydrates (Kochetkov and Chizhov, 1967), and the most abundant detected in S. frigidimarina were 2,5-dimethyl furan and 2-furanmethanol. Furan molecules were also detected in H. halodenitifcans and Spirulina. A list of the molecules detected from the Archaea and Bacteria in this study, and their structures and retention times, is given in Supplementary Table S1.
In the later retention time period, after 28 min, the total ion currents for S. frigidimarina and H. halodenitifcans were very similar and dominated by cyclic dipeptides, also known as 2,5-diketopiperazines. 2,5-diketopiperazines are formed from cyclization of peptides under pyrolysis conditions (Smith et al., 1988; Voorhees et al., 1994; Stankiewicz et al., 1996; Fabbri et al., 2012). The 2,5-diketopiperazines detected here were cyclo(Pro-Ala), cyclo(Pro-Gly), cyclo(Pro-Val), cyclo(Pro-Leu), cyclo(Pro-Pro), cyclo(Pro-Met), and cyclo(Pro-Phe).
The total ion current for Spirulina above 28 min was markedly different from that of S. frigidimarina and H. halodenitifcans, and it was dominated by lipid and chlorophyll fragments. Peaks with relatively large abundances were detected for heptadecane, neophytadiene, 3,7,11,15-tetramethyl-2-hexadecen-1-ol (an isomer of phytol), and the C16:0 and C18:2 fatty acids. Nitrogen-containing peaks, hexadecanenitrile and hexadecanamide, were also detected. A low intensity peak was also detected for dl-α-tocopherol at retention time 53 min, shown in Supplementary Fig. S2.
Neophytadiene and the phytol isomer are decomposition products of chlorophyll (Kebelmann et al., 2013). Fatty acids and alkanes are lipid degradation products. Alkylamides (hexadecanamide) are likely formed from the reaction of fatty acids with nitrogen-containing compounds, and hence alkyl nitriles (hexadecanenitrile) are formed from the dehydration of amides.
Small amounts of fatty acids were also detected in S. frigidimarina and H. halodenitifcans; C16:0 fatty acid was detected in both strains, and C18:0 and C18:1 fatty acids were detected in S. frigidimarina.
The total ion current for the archaeon M. hakonensis is very different from the other strains shown in Fig. 2. Alkylbenzenes, phenols, and nitrogen-containing compounds were detected, but with a relatively low abundance compared with the other strains analyzed. An increased number of oxygen heterocycles were detected, with the most intense peaks in the trace corresponding to 3-methyl furan, 2,5-dimethyl furan, and 5-methyl-2-furancarboxaldehyde.
Anhydrosugars were also formed from the decomposition of carbohydrates and were detected between 16 and 30 min. The anhydrosugars have been identified as 1,4:3,6-dianhydro-α-
The total ion currents for the other five strains analyzed in this study are shown in Supplementary Fig. S1. The two halopsychrophilic strains in Supplementary Fig. S1, P. halocryophilus and H. lacusprofundi, have almost identical total ion currents to the halopsychrophilic bacterium H. halodenitifcans, shown in Fig. 2. The total ion current for the cyanobacterium Chlorella is similar to Spirulina, with lipid and chlorophyll fragments dominating the current. However, there are some differences, such as the absence of the heptadecane peak and the lower abundance of phenol peaks in Chlorella.
The thermophilic archaeon P. furiosus has a similar total ion current to the thermophile M. hakonensis, with many furans detected, although smaller abundances of anhydrosugars were detected. The total ion current of T. islandicus shows similarities to the halopscychrophiles, although a higher abundance of furan peaks was detected.
3.2. Ion series identified from Archaea and Bacteria
In the previous section, we discussed how pyrolysis fragments Archaea and Bacteria samples, breaking them down into smaller molecules, and gas chromatography subsequently separates the pyrolysis products, enabling the identification of individual molecules. Further fragmentation occurs in the mass spectrometer, by electron dissociative ionization, and this produces the fragmentation patterns observed in the mass spectra discussed later. The neutral gas mass spectrometers on board spacecraft such as Europa Clipper and Cassini do not have a separation stage, and the data returned will comprise a summed mass spectrum taken over an experimental run.
This will include fragmentation from processes before and inside the mass spectrometer, akin to the pyrolysis and electron dissociative ionization occurring in the lab. An illustrative figure of the similarities and differences in the experimental procedures in the laboratory and on the spacecraft is given in Fig. 3. To create mass spectra similar to that that will be obtained by MASPEX, all the ions detected in a single strain were summed over the relevant time range of the total ion current.
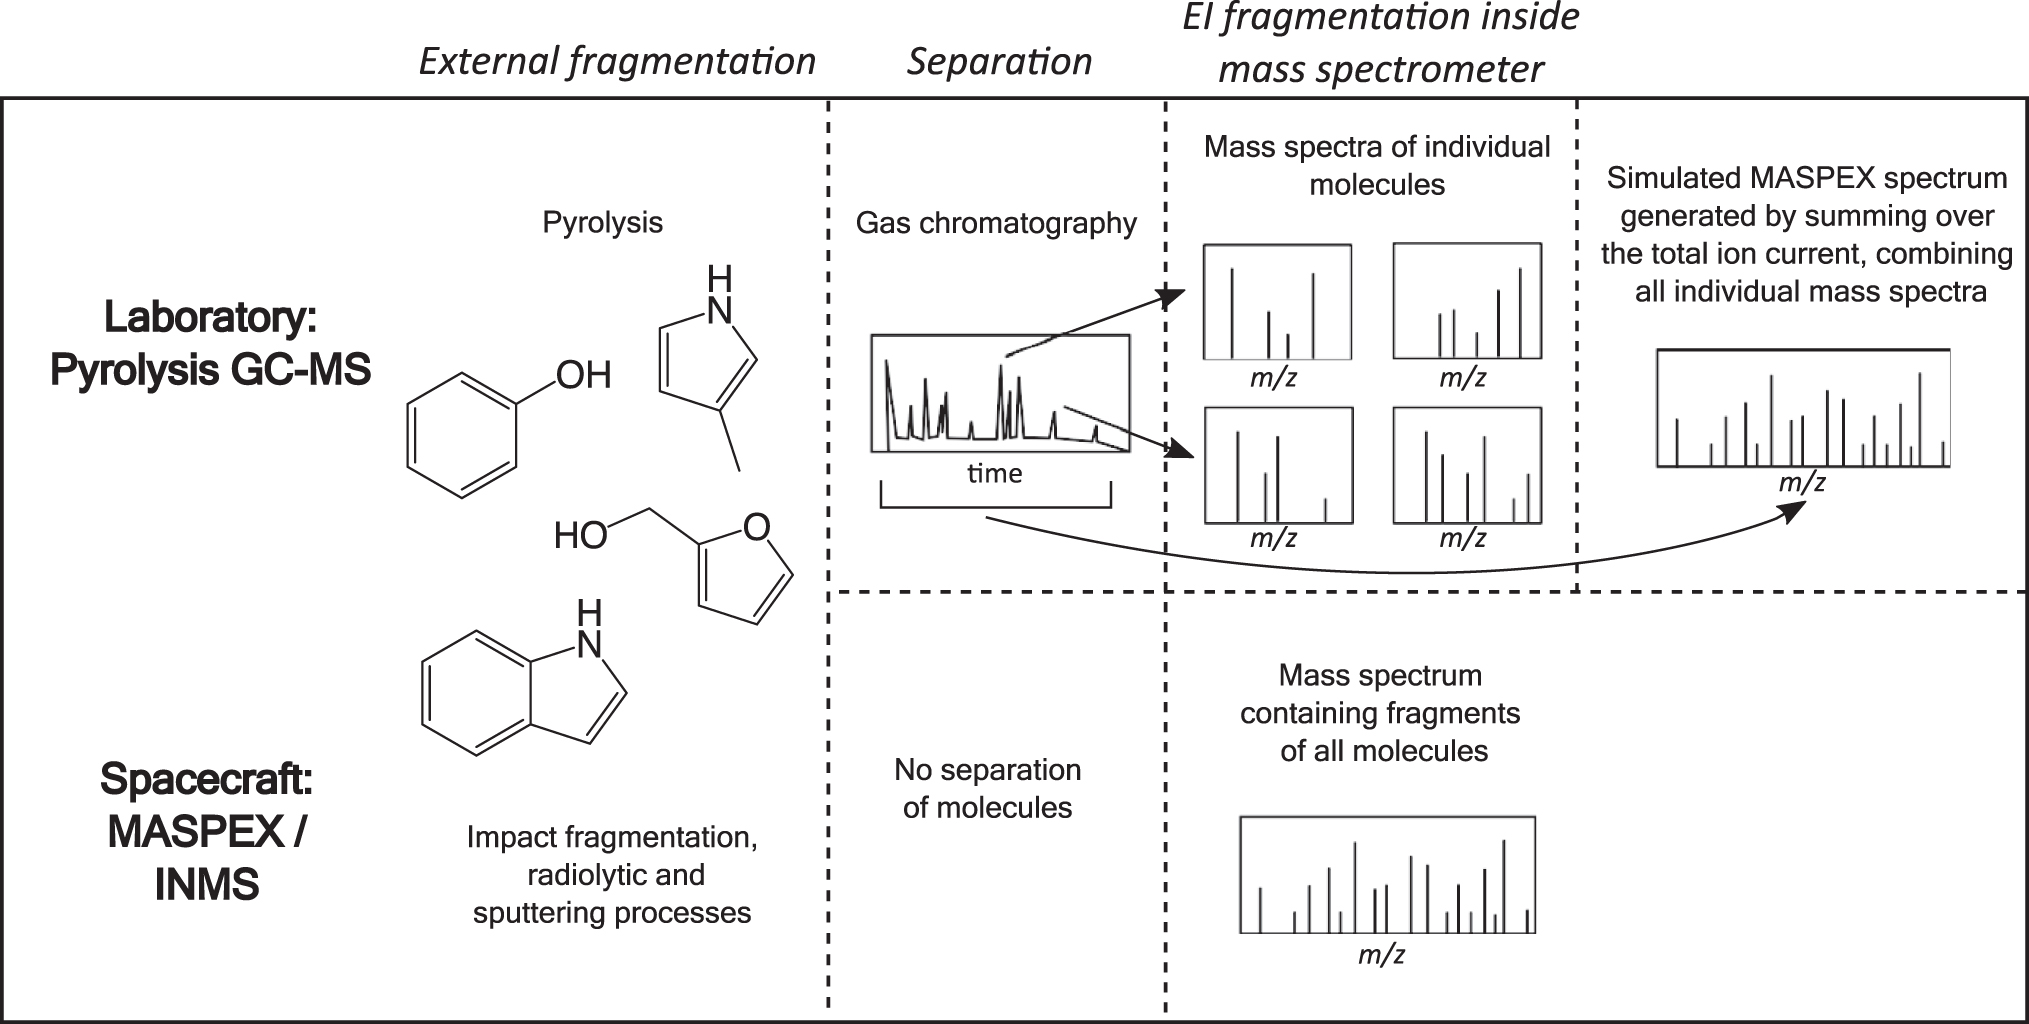
Illustrative figure of the different fragmentation processes and generation of mass spectra occurring in the laboratory experiments and in the mass spectrometers, MASPEX and INMS, onboard spacecraft. In GC-MS, the gas chromatography serves as a means of separating compound classes into a time series since their retention times depend on the volatility of the compound. This orthogonal identification step allows low mass resolution mass spectrometry to be used in tandem with a combination of methodologies, providing excellent compound identification. High mass resolution, such as offered by MASPEX, allows exact mass identification up to masses of around 200 u as an alternative to GC-MS. This methodology is better adapted to fly through techniques where the sample present is very limited but is more susceptible to confusion due to contamination. INMS, Ion and Neutral Mass Spectrometer; MASPEX, Mass Spectrometer for Planetary Exploration.
The summing process creates a complex spectrum containing all the fragment ions detected in a single strain and includes fragmentation due to both pyrolysis breakdown and electron dissociative ionization, as shown in Fig. 3.
Mass spectral data were also acquired in the low mass range between 10 and 50 u. An example mass spectrum is shown in Fig. 4 for S. frigidimarina summed from 2 to 45 min. The mass spectra, for the range 10–50 u, are similar for all the Archaea and Bacteria analyzed, with the same ions detected with similar relative abundances. Fragment ions were detected in the C1 range (m/z 14–18), C2 range (m/z 26–32), and the C3 range (m/z 37–45). The fragment ions are the breakdown products of molecules from all the different compound families, such as furans, nitrogen heterocycles, and alkylbenzenes.

Low mass range (m/z 10–50) MASPEX simulated mass spectrum of Shewanella frigidimarina.
Tentative assignments are hydrocarbons, C2H3 for m/z 27, and C3H3 for m/z 39. However, due to the unit mass resolution of the mass spectrometer used in this study, the identity of some of the ions is more ambiguous, such as m/z 41, which could be C3H5, C2H3N, and/or C2HO, and m/z 43, which could be C3H7 or C2H3O. The high mass resolution capability of MASPEX will aid toward removing the ambiguities in the assignment of these ions, as detailed in Section 4.
Using GC-MS, we determined the pyrolysis fragmentation patterns of individual molecules that are indicative of protein, lipid, and carbohydrate structures. The individual data were then collated together to create a mass spectral library to help us recognize the fragmentation patterns for specific compound families. These fragmentation patterns show characteristic ion series for the different compound types and are listed in Table 2, along with the compound class and original biological structure. These ion series greatly help with the interpretation of complex mass spectra when no separation technique is present.
Compound Types, Their Fragment Ions and Possible Origin, Detected from Archaea and Bacteria Strains Analyzed with Pyrolysis-Gas Chromatography-Mass Spectrometry
Classes of compounds that could originate from protein structures include alkylbenzenes, phenols, nitrogen heterocycles, and 2,5-diketopiperazines: The alkylbenzenes are dominated by toluene (m/z 91), ethylbenzene (m/z 91, 106), and styrene (m/z 78, 104). The phenolic compounds are dominated by phenol (m/z 66, 94), methylphenols (m/z 77, 79, 107, 108), and ethyl-phenol (m/z 107, 122). Nitrogen heterocycles include pyrrole (m/z 67), methyl-pyrrole (m/z 80), methyl-pyridine (m/z 66, 93), benzyl nitrile (m/z 90, 117), indole (m/z 90, 117), and methyl-indole (m/z 130, 131). 2,5-diketopiperazines appear as a series with common fragments (m/z 70, 86, 125, 153, 154, 194, 208, 244).
Carbohydrate breakdown products can be separated into small molecules, furans (m/z 53, 69, 81, 95, 96, 110), and larger molecular anhydrosugars (m/z 57, 60, 69, 73, 85, 98, 115, 144). Fragments from lipids include alkanes, which have a well-defined series with increments of 14 u (m/z 57, 71, 85, 99 etc.), fatty acids (m/z 60, 73, 97, 129, 157, 185, 213, 241, 256, 284), and also nitrogen-containing compounds from the reaction of fatty acids with proteins (m/z 57, 59, 72, 97, 110, 124, 138).
The mass spectra for the same Archaea and Bacteria strains shown in Fig. 2 are shown in Fig. 5. This figure has been annotated with linkages connecting the ion series that belong to the same compound class, as detailed in Table 2. Variations are observed between the mass spectra of the different strains, similar to the total ion chromatograms discussed earlier. The ion at m/z 91 can be attributed to the intact toluene fragment/tropylium ion. This is observed as a large peak in all the mass spectra in Fig. 5.

MASPEX simulated mass spectra of Halomonas halodenitrificans, Shewanella frigidimarina, Spirulina, and Metallosphaera hakonensis (from top to bottom). Ions from the same compound family are linked by lines, labeled according to the legend. Color images are available online.
This is as expected, as it produces a large peak in the total ion chromatograms shown in Fig. 2. Distinctive ion series for 2,5-diketopiperazines are observed in the spectra of P. halocryophilus and S. frigidimarina, with m/z 70, 125, and 154 being the most abundant. The ion series (m/z 53, 81, 95, 110) for furan molecules is well defined in the spectra of S. frigidimarina and M. hakonensis. The spectra for S. frigidimarina and Spirulina also show a fatty acid ion series.
For simplicity, only the most abundant ions have been marked on the spectra in Fig. 5. As for the total ion chromatograms, the mass spectra for the other five strains analyzed are shown in Supplementary Fig. S3.
4. Discussion
4.1. Relevance to life detection on icy moons
It was discussed in Section 3 earlier that the total ion currents for different Archaea and Bacteria can vary greatly, and this shows the variation within biological structures that py-GC-MS can detect. However, there are some molecules that are detected in all the strains analyzed, such as toluene, 4-methylphenol (p-cresol), and indole, which are all protein breakdown products. There are also similarities between strains that inhabit the same extreme environments. The halopsychrophiles have very similar total ion currents that are protein rich, with very low abundances of molecules corresponding to carbohydrate and lipid fragments.
The exception to this is S. frigidimarina, which also has a significant number of carbohydrate decomposition peaks. S. frigidimarina is capable of anaerobic growth by fermentation of carbohydrates (Bowman et al., 1997), and it also produces a large amount of exopolysaccharides containing a majority of carbohydrates (Chen et al., 2021). As discussed in Section 2, the strains analyzed in this study that are most likely to inhabit the oceans of Enceladus and Europa are the cold- and salt-adapted strains, H. lacusprofundi, P. halocryophilus, H. halodenitrificans, and S. frigidimarina.
The cyanobacteria analyzed, Spirulina and Chlorella, are rich in proteins and lipids, as well as chlorophyll fragments. However, due to the conditions on the icy moons, it is unlikely that cyanobacteria would be found there. The thermophilic T. islandicus contains protein and carbohydrate peaks, but no lipid fragments are detected. Lastly, the thermophilic Archaea M. hakonensis and P. furiosus give different results with an abundance of carbohydrate-derived peaks and a smaller amount of protein peaks compared with the other strains analyzed. It is possible that thermophiles may be present in hydrothermal vents on the ocean floors of Europa and Enceladus.
Generally, proteins constitute 50–70% of the dry weight of bacteria (Neidhardt et al., 1990; Becker, 2007; Beck et al., 2018), with lipids being minor constituents, which is reflected in the data acquired here.
The results presented earlier show mass spectra and total ion currents with good signal-to-noise ratios. These data were acquired from samples containing approximately 103 cells. Although it was not tested in this study, these results show that the detection limit for bacteria when using py-GC-MS is <103 cells. Should there be life on Enceladus, the amount of microorganisms predicted to be present in hydrothermal vents on the seafloor of Enceladus varies from 105 cells/cm to the optimistic 109 cells/cm3 (Porco et al., 2017; Steel et al., 2017).
Current estimates for cell abundances in the ocean water of Enceladus are 103 cells/cm3 (Cable et al., 2020). Porco et al. (2017) showed that bubble scrubbing could increase the estimated number of bacteria by a factor of 102–103, resulting in a plume density of 107 cells/cm3. In accordance with this estimation, the quantity of cells analyzed in the present study would equate to a volume of 0.1 μL in the plume of Enceladus. Porco et al. (2017) estimated that, with bubble scrubbing, a single Enceladus flyby would collect 102–103 cells from the plume, with numbers increasing for multi-flybys and orbiters. This number of cells is within the detection limit of py-GC-MS, shown here.
There are currently no estimates for the number of bacteria that could possibly be present on Europa, therefore we assume the same estimated values as Enceladus. The detection limit of MASPEX is increased by using a cryotrap, resulting in mixing ratios of 10−8 being detectable. Using the same plume density from the work of Porco et al. (2017), we determined that the concentration of cells that could be present in the potential plume is 0.2 ppmw (presuming an individual cell mass of 2 × 10⁻¹⁴ g). Although this estimate is based on a simplistic calculation, it shows that the estimated cell concentrations on icy moons should be within the limits of detection of MASPEX.
4.2. High mass resolution
All the data presented in this paper have unit mass resolution. However, due to the molecules being separated by GC, it is possible to identify most ions from the fragmentation patterns in the individual mass spectra. However, when the fragments of all the molecules are given in the same spectrum, as will be the case with MASPEX, there will be ambiguities in the identification of some ions that could be attributed to more than one molecular structure. The next-generation mass spectrometer, MASPEX, that will be onboard Europa Clipper, will have high mass resolution capability.
This will help to remove some of the ambiguities encountered with unit mass resolution data, and lead to greater accuracy of the assignments given to the ions detected. Hence, the results from MASPEX will lead to a more robust understanding of whether the ions detected come from a biotic origin, and information about the presence, or absence, of life-forms on Europa.
Specific cases from the results presented here where high mass resolution would be beneficial are given in Table 3, although this is not an exhaustive list. Table 3 lists the unit masses and molecular assignments of some of the ions detected in this study, as well as the monoisotopic masses of these assignments and the mass resolution required to separate ions of the same unit mass. The mass resolutions were calculated by using the 10% valley definition. For the data presented here, there are overlaps in molecular identification in the region up to approximately m/z 110.
Unit Mass Ions with Multiple Molecular Assignments, Detected in This Study, and Their Monoisotopic Masses and the Mass Resolution Required to Separate the Ions
The mass resolution calculated assumes a maximum 3 order magnitude difference in the number of ions for each pair of ions, using a theoretical MASPEX lineshape for ion peaks. The real lineshape will have some tail effects on the high-mass end of the ion peaks, meaning that true separation will be harder to achieve with near-mass ion peaks with a large difference in abundance (peak height), such as 1000 × .
MASPEX = Mass Spectrometer for Planetary Exploration.
High mass resolution will greatly benefit the identification of molecules at higher masses, as the number of different molecular structures for a particular unit mass increases as the mass increases.
The differences between the monoisotopic masses for the molecules listed in Table 3 vary from 0.0126 u, for example, between C6H7 and C5H5N at m/z 79, up to 0.0728 u, between C5H3O2 and C7H11 at m/z 95. The mass resolution needed to distinguish between the ions at the same unit masses listed in Table 3 is given in the table and varies from ∼1500 (m/z 41) to 8200 (m/z 79). The mass resolution obtainable by MASPEX (Brockwell et al., 2016) is up to 25,000; therefore, all the ambiguities in the assignments listed here should be able to be differentiated by MASPEX. Figure 6 provides a demonstration of the high mass resolution capability of the MASPEX instrument, separating three near-mass ions at m/z 78 covering the range of monoisotopic mass differences described earlier.
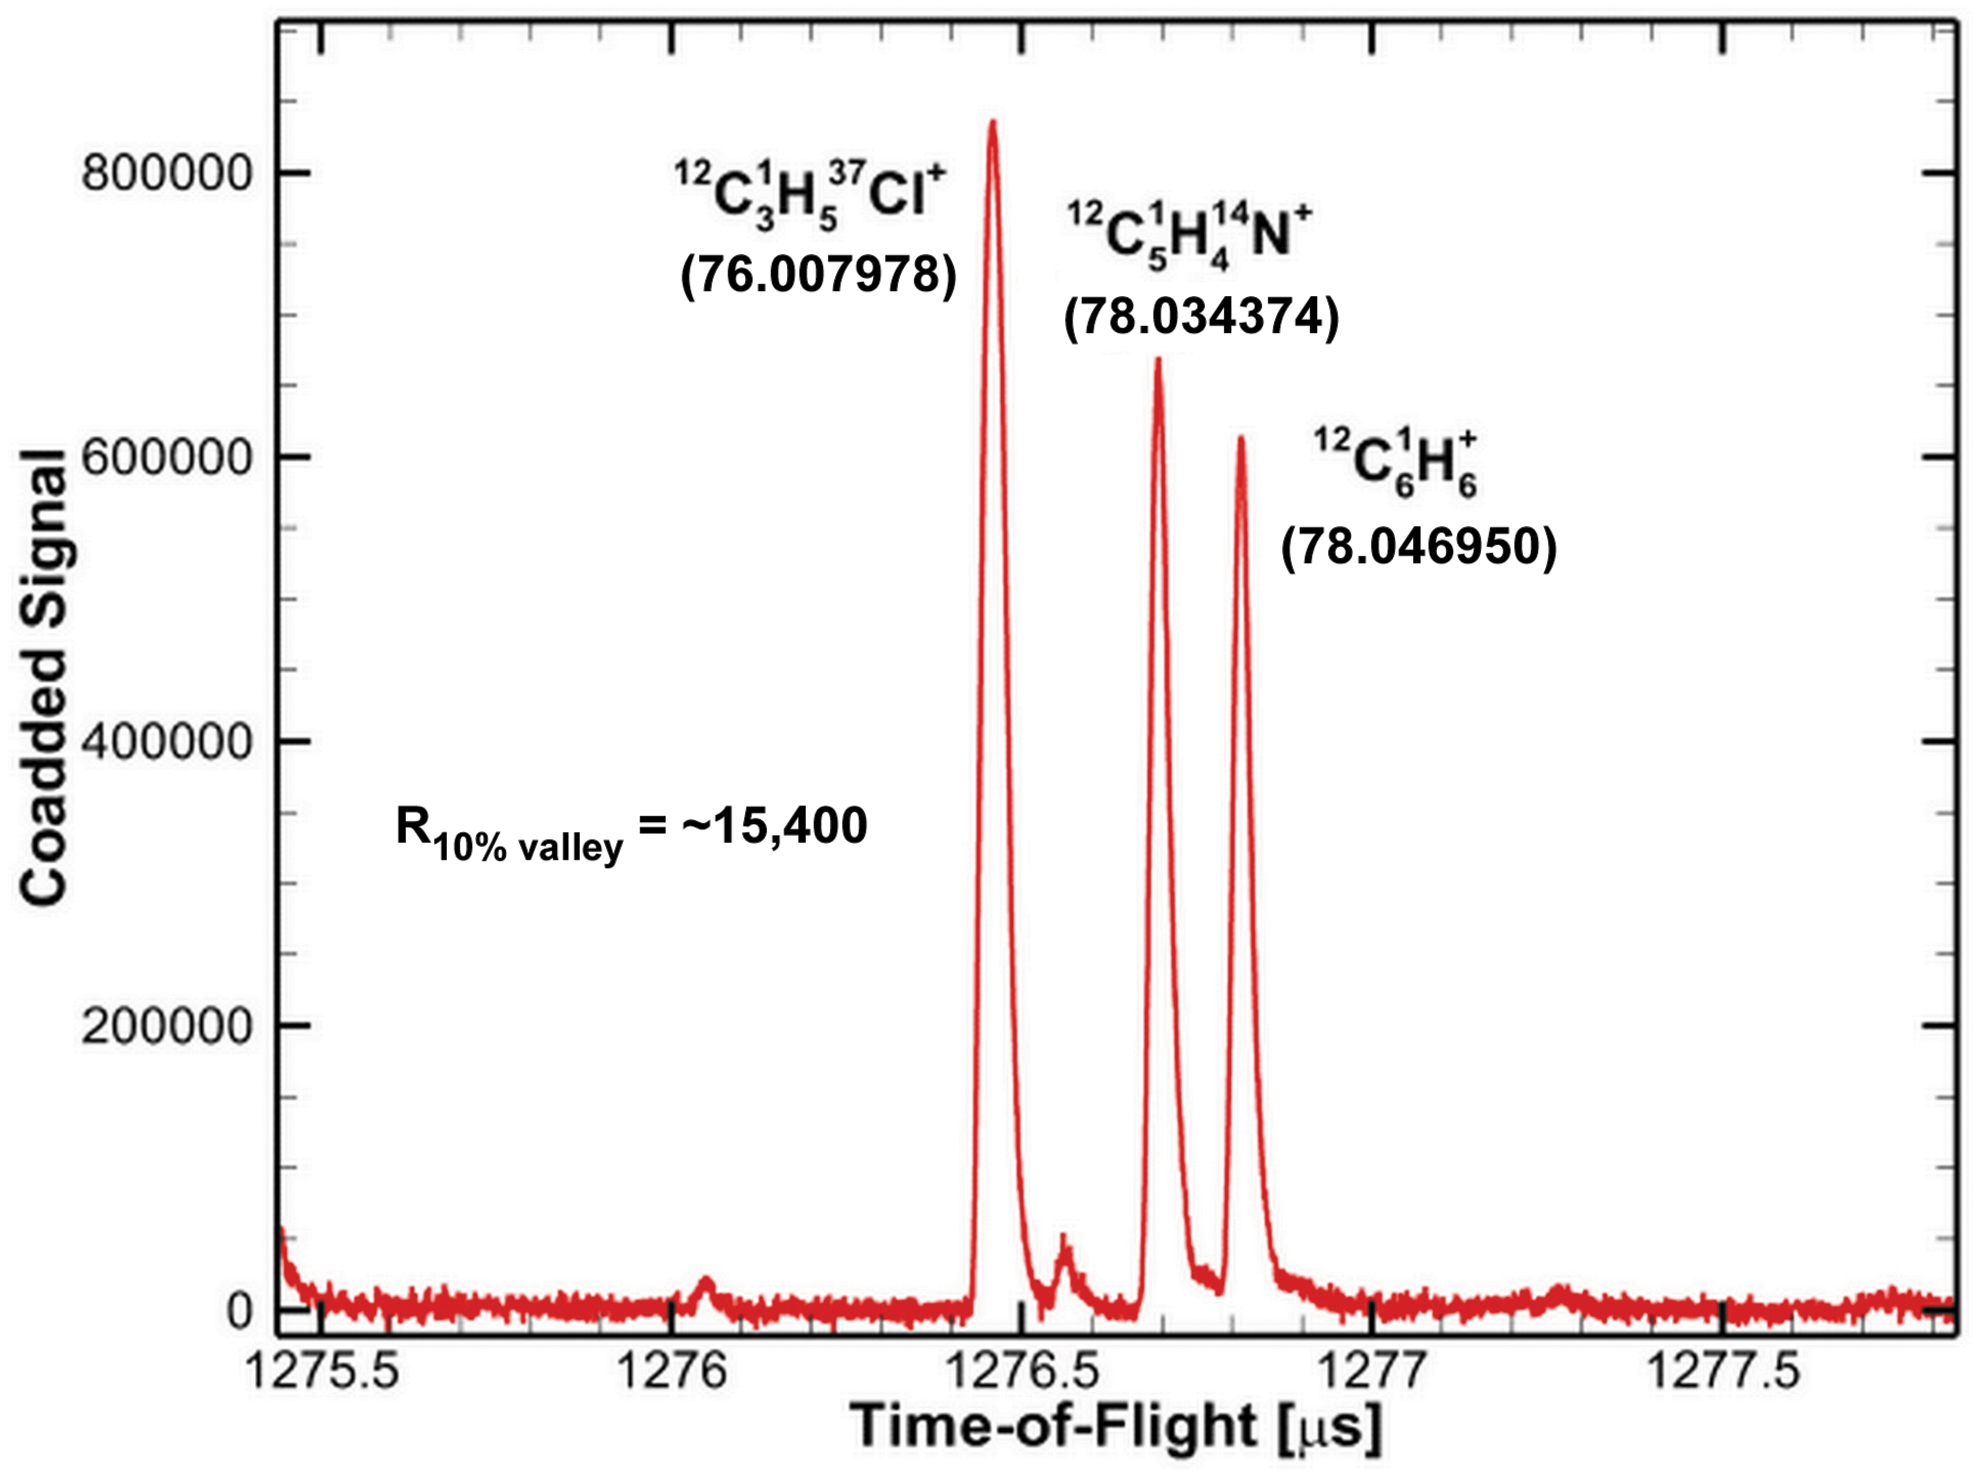
Demonstration of the high mass resolution capability of the MASPEX instrument, here separating three ion peaks at m/z 78. The exact mass of each ion is shown in parentheses below the ion formula. The mass resolution demonstrated here is ∼15,400 using the 10% valley definition. This measurement was collected during lab tests of the MASPEX EM in April 2019. EM, engineering model. Color images are available online.
High mass resolution can also help differentiate between ions of abiotic and biotic origins. Table 4 shows examples of how MASPEX can resolve ambiguities with respect to the potential identification of life-forms through its high mass resolution capability. Prominent fragment ions are listed for different expected or potential sources of gas molecules at m/z 73 and 97, which would cause significant overlap at low mass resolution. Identifying the likely sources of the observed composition will require very careful and thorough analyses.
Examples of How MASPEX Can Resolve Ambiguities with Respect to the Potential Identification of Life-Forms Through Its High Mass Resolution Capability
However, without high mass resolution the task would be much more difficult and potential identification of life-forms would be subject to a great deal of ambiguity. The mass resolution required to separate the examples in Table 4 is ∼11,700 for the masses at m/z 73, and 10,000 for the masses at m/z 97; both of these values are within the limits of the MASPEX instrument.
4.3. Comparison to data from flybys of Enceladus
The Cassini spacecraft carried two mass spectrometers, INMS and the Cosmic Dust Analyzer (CDA). Detailed analysis of mass spectral data acquired by INMS and CDA from flybys through the plumes of Enceladus has been reported in the literature (Postberg et al., 2018a, 2018b). Several interesting organic features of the spectra were discussed by Postberg et al. (2018b). First, the observation of a series of repeating peaks in the CDA data above 80 u were believed to represent an increasing number of unsaturated carbon atoms, and were referred to as high-mass organic cations (HMOCs). The HMOCs could be fragments of organic macromolecular (>200 u) parent molecules.
Below 80 u, another series of peaks were also observed and were assigned to aliphatic saturated fragments and unsaturated aromatic fragments. Mass lines at 77–79 u were observed in both CDA and INMS data and attributed to cationic forms of the benzene ring. However, it was suggested that these did not originate from benzene itself but were fragments of larger molecules with single-ringed structures attached to deprotonated carbon atoms or functional groups without carbon. Importantly, experiments showed that the mass lines at 77–79 u were not derived from polycyclic aromatic hydrocarbons (PAHs).
There are similarities and differences between the data discussed in Postberg et al. (2018b) and in the data in the current study presented here. The high mass repeating series reported by Postberg et al. (2018b) was not observed in our data. However, other features are similar, including the preference for odd numbered organic ions below 45 u, such as 39 (C3H3), 41 (C3H5 or C2H3N), and 43 u (C3H7 or CH3CO), shown in Fig. 4. We also observe the C2, C3, and C4 aliphatic fragment series noted by Postberg et al. (2018b).
Ions are also observed at 77 and 79 u in the data presented here and are fragments of ring structures such as N-heterocycles and phenols. Apart from being attributed to the phenyl ion, 79 u is also the molecular ion of pyridine (C5H5N). High mass resolution could help remove the ambiguity in this assignment, and the accurate mass is listed among those in Table 3.
4.4. Comparison to abiotic materials
The mass spectral fingerprints of Bacteria and Archaea, presented in this study, show many differences to those of abiotic materials, including organic molecules formed in abiotic synthesis, enabling the distinction between biological and non-biological samples. For comparison, mass spectra from the py-GC-MS of three different meteorites (Orgueil, Murchison, and Allende) have been included in Supplementary Fig. S4.
Organic molecules, such as amino acids and carboxylic acids, have been found in abiotic sources such as carbonaceous chondrite meteorites (Huang et al., 2005; Sephton, 2013) and comets (Altwegg et al., 2016). However, these amino acids, formed by Strecker synthesis, differ from biological amino acids in their structural diversity and the presence of racemic mixtures. The abiotic synthesis of amino acids has been demonstrated under simulated computational and experimental conditions (Steel et al., 2017), including those of hydrothermal systems (Ménez et al., 2018). Abiotic peptide synthesis via water–rock interactions has also been investigated under simulated Enceladean conditions (Takahagi et al., 2019).
Likewise, carboxylic acids can be formed abiotically via the Fischer-Tropsch reaction. Carboxylic acids found in abiotic materials also show differences to those from a biological origin. Abiotic carboxylic acids show a decrease in abundance with increasing carbon number as well as equal concentrations of branched and straight chain isomers. Linear monocarboxylic acids up to C10 have been detected in the Tagish Lake meteorite, as well as trace amounts of amino acids (Herd et al., 2011).
In biological materials, the preference is for longer straight chain carboxylic acids, with chain lengths between 14 and 20 carbon atoms, and for chains with an even number of carbon atoms.
Also, C16:0 is the most abundant long chain carboxylic acid in nature (Georgiou and Deamer, 2014). Klenner et al. (2020a, 2020b) showed that the detected mass spectrometric abundances of fatty acids reflect their original concentrations, enabling differentiation between abiotic and biotic compositions. The specific lipid patterns observed in biological sources could be used as biomarkers, especially as they remain stable over long periods of time (Georgiou and Deamer, 2014). Unlike other biomarkers such as amino acids and nucleobases (Truong et al., 2019), hydrocarbon lipid fragments are able to survive over billions of years unless they are subjected to temperature and pressure extremes (Brocks, 1999; Eigenbrode, 2008).
Although biomolecules such as amino acids and long chain carboxylic acids can be created abiotically, there are stark differences in the specific molecules created, such as the chirality and relative concentrations of different types of amino acids. Biological materials are characterized by sets of discrete molecules with specific structures rather than a smooth distribution of molecules dependent on the chemical properties (McKay, 2004; McKay et al., 2008). Klenner et al. (2020a) showed that the relative concentrations of amino acids and fatty acids produced by abiotic or biotic processes can be discriminated from each other by using mass spectrometry.
One of the most abundant compound families detected in carbonaceous chondrites, such as the Murchison meteorite, are thermally stable aromatic and PAHs (Sephton and Botta, 2005). The results of this present work show that toluene and alkylbenzenes are detected from the pyrolysis of Archaea and Bacteria; however, no PAH features are observed. Supplementary Figure S4 shows the mass spectra of meteorites analyzed with py-GC-MS. Peaks assigned to PAHs were detected at m/z 128, 178, and 202; peaks assigned to alkylnapthalenes were detected at m/z 141, 142, 155, and 156. Sulfur (m/z 64) and alkylthiophenes (m/z 84, 97, and 134) were also detected (Sephton et al., 2018).
These peaks are absent in the data from the current study, shown in Fig. 5. Phenol compounds have also been detected in the pyrolysis of meteorites (Remusat et al., 2005), as well as oxygen heterocycles, such as furans (Hayes and Biemann, 1968; Studier et al., 1972; Sephton, 2013).
The results of this study show that the distinctive sets of decomposition products detected from Bacteria and Archaea are a good indicator of biological compounds, with a predominance for protein fragments such as nitrogen heterocycles, and absence of PAHs. These breakdown products can be traced back to specific parent compounds related to their biological origin. The richness and complexity of the spectra presented here show that to be able to detect biological material on an ocean world a pattern of ions should be observed, illustrated in Fig. 7.

Illustrative figure showing how the patterns in the ion series in a complex mass spectrum could be used to detect signs of habitability. The identification of decomposition products, and hence their compound families and possible origin, can help toward determining whether the sample analyzed originates from a biotic or abiotic source.
The detection of a single ion does not give much information on its own; however, when it is detected along with other ions from the same compound family, a reconstruction of the material being analyzed can be attempted. The data shown earlier include breakdown products from proteins, carbohydrates, and lipids, and each strain contains ions from several compound families. Therefore, a combination of mass spectral fingerprints of different organic compound families should be looked for in the data, and the more information we can retrieve from the mass spectra, the more certain we can be of the assignment of biological material.
5. Conclusions
Using py-GC-MS to analyze Archaea and Bacteria, our experiments revealed unique mass spectral fingerprints, dominated by protein pyrolysis products, such as indole, toluene, phenol, and their derivatives. Furans and fatty acids, decomposition products of carbohydrates and lipids, respectively, were also detected. Variations were observed in the pyrolysis fragmentation products detected in the different strains analyzed, with halopsychrophiles showing protein-rich spectra, indicated by the detection of phenols, nitrogen heterocycles, and 2,5-diketopiperazines.
Thermophiles displayed a larger number of carbohydrate fragments, including oxygen heterocycles and anhydrosugars. Chlorophyll fragments were detected from the cyanobacteria strains analyzed, which were also rich in protein and lipid fragments.
When the py-GC-MS data are converted to MASPEX-type signals, the types of organic matter contributing to the spectra are still discernible. Our data reveal how mass spectrometry on Europa Clipper can not only reveal habitable conditions based on the presence of water, salts, and organic matter but may also be able to identify the fragmentation fingerprints characteristic of life. Although only pure bacteria were analyzed in this study, material from the plumes of Europa and Enceladus will likely contain many different types of molecules from abiotic as well as biotic origins, resulting in complex mass spectra.
Organisms may also be trapped in ice grains. The effects observed in this article are relevant to pure organic matter and differences brought about by shielding would be expected if the organic matter is encased in ice (Jaramillo-Botero et al., 2021). The high mass resolution capability of MASPEX will enable the identification of molecules detected from different sources in Europa, such as neutral gas molecules as well as fragments from ice grains and possibly microorganisms, and it will help to remove some of the ambiguities encountered with unit mass resolution data and complex mass spectra, as illustrated in this study.
Footnotes
Acknowledgments
The authors would like to thank the MASPEX team for valuable discussions.
Author Disclosure Statement
No competing financial interests exist.
Funding Information
This work was supported by the Science and Technology Facilities Council (grant No. ST/S000615/1).
Supplementary Material
Supplementary Table S1
Supplementary Figure S1
Supplementary Figure S2
Supplementary Figure S3
Supplementary Figure S4
Abbreviations Used
Associate Editor: Victor Parro
References
Supplementary Material
Please find the following supplemental material available below.
For Open Access articles published under a Creative Commons License, all supplemental material carries the same license as the article it is associated with.
For non-Open Access articles published, all supplemental material carries a non-exclusive license, and permission requests for re-use of supplemental material or any part of supplemental material shall be sent directly to the copyright owner as specified in the copyright notice associated with the article.