
Abstract
Biological regulation of planetary temperature has been explained with the Daisyworld model, in which reflective–cooling white daises balance absorbing–warming black daisies. This article advances the proposition that cooling “daisies” of Daisyworld represent carbon sequestration and consumption by productive soils and ecosystems, such as grasslands expanding into deserts and tropical forests migrating toward the poles. On the other hand, warming “daisies” represent continued CO2 emissions from volcanoes and springs allowed by unproductive frigid and desert ecosystems. Greenhouse spikes of CO2 in deep time from large perturbations, such as flood basalt eruptions and asteroid impacts, did not continue as lethal runaway greenhouses, such as Venus, nor did low CO2 of ice ages decline to a sterile global snowball, such as Mars. These hypotheses are quantified and tested by new global soil maps derived from paleosols of the last extremes of atmospheric CO2: middle Miocene (16 Ma) and last glacial maximum (20 ka), when CO2 levels were 588 ± 72 and 180 ppm, respectively. Observed expansion of productive soils curbed large atmospheric injections of CO2 in deep time and observed expansion of unproductive soils during ice ages of low CO2 was thwarted by continued metamorphic and volcanic degassing. This short-term Soilworld thermostat of biogeographic redistribution of ecosystems supplemented long-term evolution of terrestrial carbon sequestration curbing solar radiation increases over billions of years. Similar agricultural management of ecosystems has potential for short-term carbon sequestration.
1. Introduction
Planetary habitability is a core concern of astrobiology, usually expressed as a Goldilocks zone of warmth and moisture within a solar system (Kasting et al., 1993; Kasting, 2019). Planetary habitability is not only spatial but also temporal because of increased solar radiation due to stellar evolution and volcanic degassing of greenhouse gases over billions of years of life on Earth (Schrag and Hoffman, 2001; Rushby et al., 2018). The observed long-term planetary stability of Earth is thus remarkable (Lovelock and Margulis, 1974) and has been explained by Daisyworld computer models of planetary temperature regulation envisaging a “parable” of cooling white daisies balanced by warming black daisies coping with rising solar luminosity (Watson and Lovelock, 1983; Wood et al.,
This contribution maps the paleogeographic extent of two cooling ecosystems in curbing a middle Miocene (16 Ma) CO2 greenhouse spike: high-biomass tropical forests with deeply weathered soils (Retallack, 2010) and grasslands with organic-rich soils (Retallack, 2013a). A long-standing scientific puzzle has been highly ferruginous (laterites) and aluminous (bauxites) rocks from deeply weathered tropical soils (Oxisols) at high paleolatitudes of 51.4oN in Germany and 43.2oS in Tasmania (Bárdossy and Aleva, 1990; Schwarz, 1997) as recently as middle Miocene, ca. 16 Ma (Fig. 1d). These distinctive ores now form by deep (3–10 m) weathering in Oxisols under intertropical (±23.5o latitude) broadleaf forests and require frost-free, mean annual temperatures of at least 17°C and mean annual precipitation of at least 1100 mm (Retallack, 2010), so they are anomalous at high latitudes.
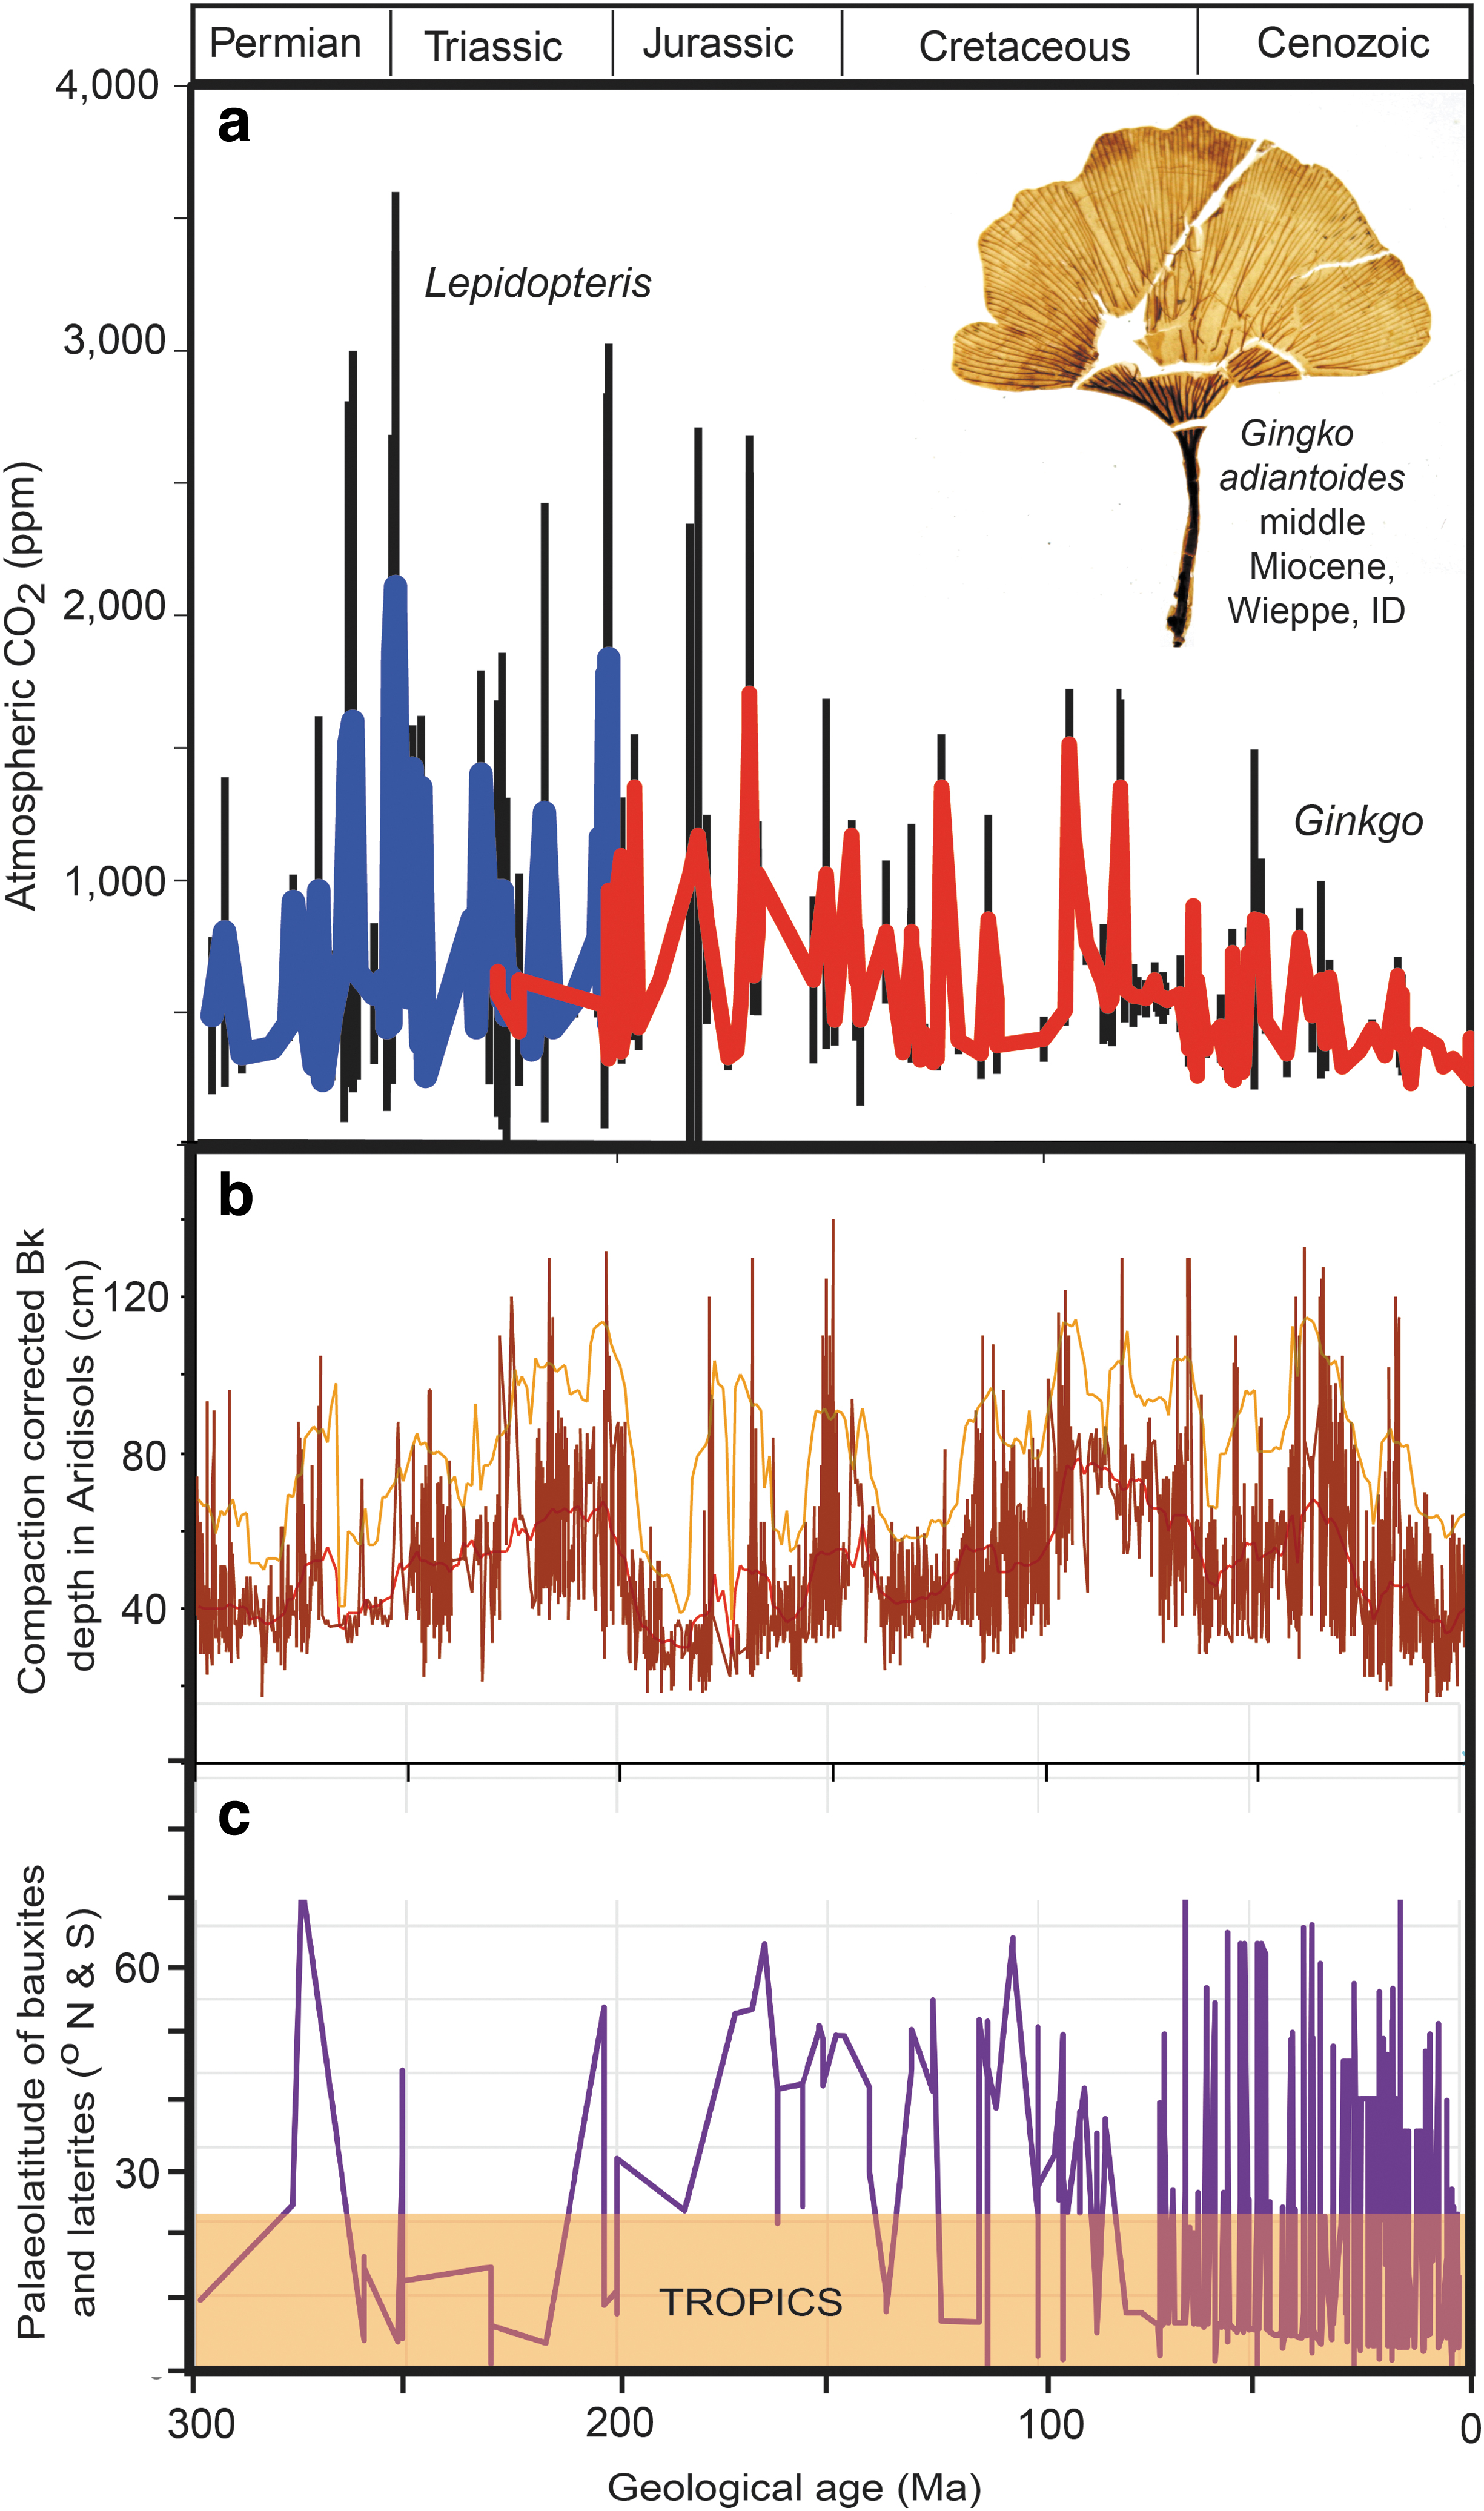
Time series over the past 300 Ma of
A stomatal index paleobarometer analysis of fossil Ginkgo leaves (Retallack and Conde, 2020) yields CO2 of at least 588 ± 72 ppm at 16 Ma (Fig. 1a), and both Bk metrics and chemical composition of paleosols (Fig. 1c) are evidence of more humid climates in continental interiors at 16 Ma (Retallack, 2009a, 2009b). Like other greenhouse spikes (Fig. 1), the middle Miocene spike of CO2 and its Oxisol in western Oregon (Allen, 1948) rose quickly and declined quickly, within a half million years, between two basalt flows dated at 15.78 ± 0.20 and 15.27 ± 0.18 Ma (Barry et al., 2013). The quick rise of CO2 spikes can be attributed to catastrophic atmospheric injections of CO2 from large igneous provinces (Retallack and Jahren, 2008; Saunders, 2016) or bolide impact (O'Keefe and Ahrens, 1989; Schultz and d'Hondt, 1996), but did not continue to a terminal greenhouse such as that of Venus (Kasting, 1988). This study addresses the hypothesis that curbing and rapid decline of greenhouse spikes (Fig. 1) were due to spread of productive ecosystems and their soils. Has the balance of productive soils, such as tropical soils (Oxisols) and grassland soils (Mollisols), versus unproductive soils, such as desert soils (Aridisols) and frigid soils (Gelisols), been a global planetary thermostat in deep time?
Soils are not just sites of chemical weathering but also extensions of ecosystems with their own emergent properties (Mueller et al., 2011; Retallack, 2013a). This insight was the very foundation of soil science by Dokuchaev (1883), who recognized that grassland soils (Chernozems or Mollisols) were not simply geological, as eolian deposits or as chemical weathering products, but were created by grassland ecosystems. Concerning worms and marmots, he wrote “All these animals swarm and burrow in the soil and certainly facilitate its comminution and aeration as well as the penetration of organic substances; their activities are naturally conducive to a more uniform distribution of humus and more intense weathering of bed-rock,” Dokuchaev (1883, p 336). Charles Darwin (1892) also envisaged earthworms as producers of grassland soils. Carbon consumption and storage in Mollisols are biologically mediated, with an emphasis on soil humus over biomass and neutralization of carbonic acid (Retallack, 2013a). Productive ecosystems consume carbon dioxide in all three ways: chemical reduction, soil storage, and silicate weathering, which are distinct for each ecosystem and soil (Table 1). These differences of several orders of magnitude of carbon consumption for different ecosystems refine the idea of global silicate weathering as a carbon sink for planetary temperature regulation by physical weathering (Walker et al., 1981; Schrag and Hoffman, 2001; Berner, 2006) and by biotic evolutionary enhancement of weathering (Schwartzman and Volk, 1989).
Modern Ecosystem Values Used for Estimating Middle Miocene (16 Ma) and Last Glacial (20 ka) Carbon Consumption
A better understanding of different kinds of soils as thermostats for atmospheric CO2 may prove important for mitigating ongoing anthropogenic greenhouse effects (Ciais et al., 2013) because soils not only sequester carbon but also produce food and livelihoods (Savory and Butterfield, 2016). Carbon farming techniques are already building soil carbon and moisture in Mollisols used for grazing (Teague et al., 2011). Management of rain forests through cycles of drought and fire also has significant economic consequences (Gatti et al., 2014).
2. Materials and Methods
New data to address this question come from a new compilation of paleosols of the last glacial maximum (20 ka) and middle Miocene (16 Ma) for comparison with modern soils (here taken as 1980). This compilation of 384 described paleosols of the last glacial maximum age and 376 paleosols of the middle Miocene age (Supplementary Tables S1 and S2) was used to construct soil maps (Fig. 2) of past distribution of four soil orders by Soil Survey Staff (2017): Gelisols (including ice caps, ice wedges, and sand wedges), Aridisols (including sand ergs), Mollisols (including tropical grassland soils), and Oxisols (including laterites and bauxites). The most useful modern map is the FAO digital map (Sanchez et al., 2009), and FAO map units were converted to orders of soil taxonomy in the following groups. Oxisols of soil taxonomy include FAO Ferralsols and Nitosols. Mollisols include not only FAO Chernozems, Phaeozems, and Kastanozems but also Mollic Gleysols, Mollic Planosols, and Mollic Solonchaks. Gelisols include FAO Gelic Gleysols, Gelic Planosols, Gelic Regosols, Gelic Histosols, and Gelic Cambisols, as well as the map category “Glacier.” Aridisols include Xerosols, Yermosols, Solonchaks, and Arenosols. The FAO digital soil map of the world gives the area (in km2) of each map unit (Sanchez et al., 2009), and these were scaled to the areas of polygons on the modern map in the Illustrator computer program (Fig. 2a). The map area (x in cm2) to land area (y in km2·106) correlation of the four soil orders was y = 8.4639x, with R2 of 0.91, s.e ±1.25 km2, and t test probability of 0.009.

Maps of the area of Earth occupied by carbon-greedy soils such as Oxisols and Mollisols versus carbon-lean soils such as Aridisols and Gelisols for
These individual occurrences formed the basis for global maps of Gelisols, Aridisols, Mollisols, and Oxisols (Fig. 2) constructed by using paleotopographic base maps (Scotese, 2014) for comparison with modern soil maps of those soil orders (Sanchez et al., 2009; Natural Resources Conservation Service, 2020). Low-productivity paleosols mapped were Gelisols or frozen soils, here including ice caps (Scotese, 2014), and Aridisols or desert soils, here including sand ergs (Scotese, 2014). Periglacial features such as ice wedges and pedogenic carbonate nodules have been widely recognized in the fossil record (Williams, 1986; Retallack, 2009a, 2009b; Ji et al., 2018). High-productivity paleosols mapped were Oxisols (tropical forest soils, including laterites and bauxites) and Mollisols (grassland soils, here including tropical grassland soils). Laterites and bauxites have been widely mapped (Bárdossy and Aleva, 1990), and although Mollisols have been less widely recognized, they can be inferred from fossil grassland mammals as well as paleosols (Retallack, 2013a).
Other soil orders were not mapped because of insufficient paleosol data. These are maps interpolated from data points (Fig. 2), not models, but they agree broadly with published vegetation models for these time intervals (Ray and Adams, 2001; Beerling et al., 2012).
3. Results
Unusually widespread Oxisols during the middle Miocene epoch are obvious in Australia, Africa, and South America (Fig. 2c), but few Oxisols are known from the last glacial maximum stage (Fig. 2b). Oxisols during the middle Miocene epoch covered 30.6 million km2 compared with 12.7 million km2 now (Sanchez et al., 2009) and 3.6 million km2 during the last glacial maximum (fig. 3a). Oxisols and their ores, laterites and bauxites, are well documented (Retallack, 2010), unlike Mollisols, which are underrepresented in the database (Retallack, 2013a). As estimated here, Mollisols during the middle Miocene epoch covered 19.0 million km2 compared with 9.8 million km2 now (Sanchez et al., 2009) and 6.4 million km2 during the last glacial maximum stage (fig. 3a).
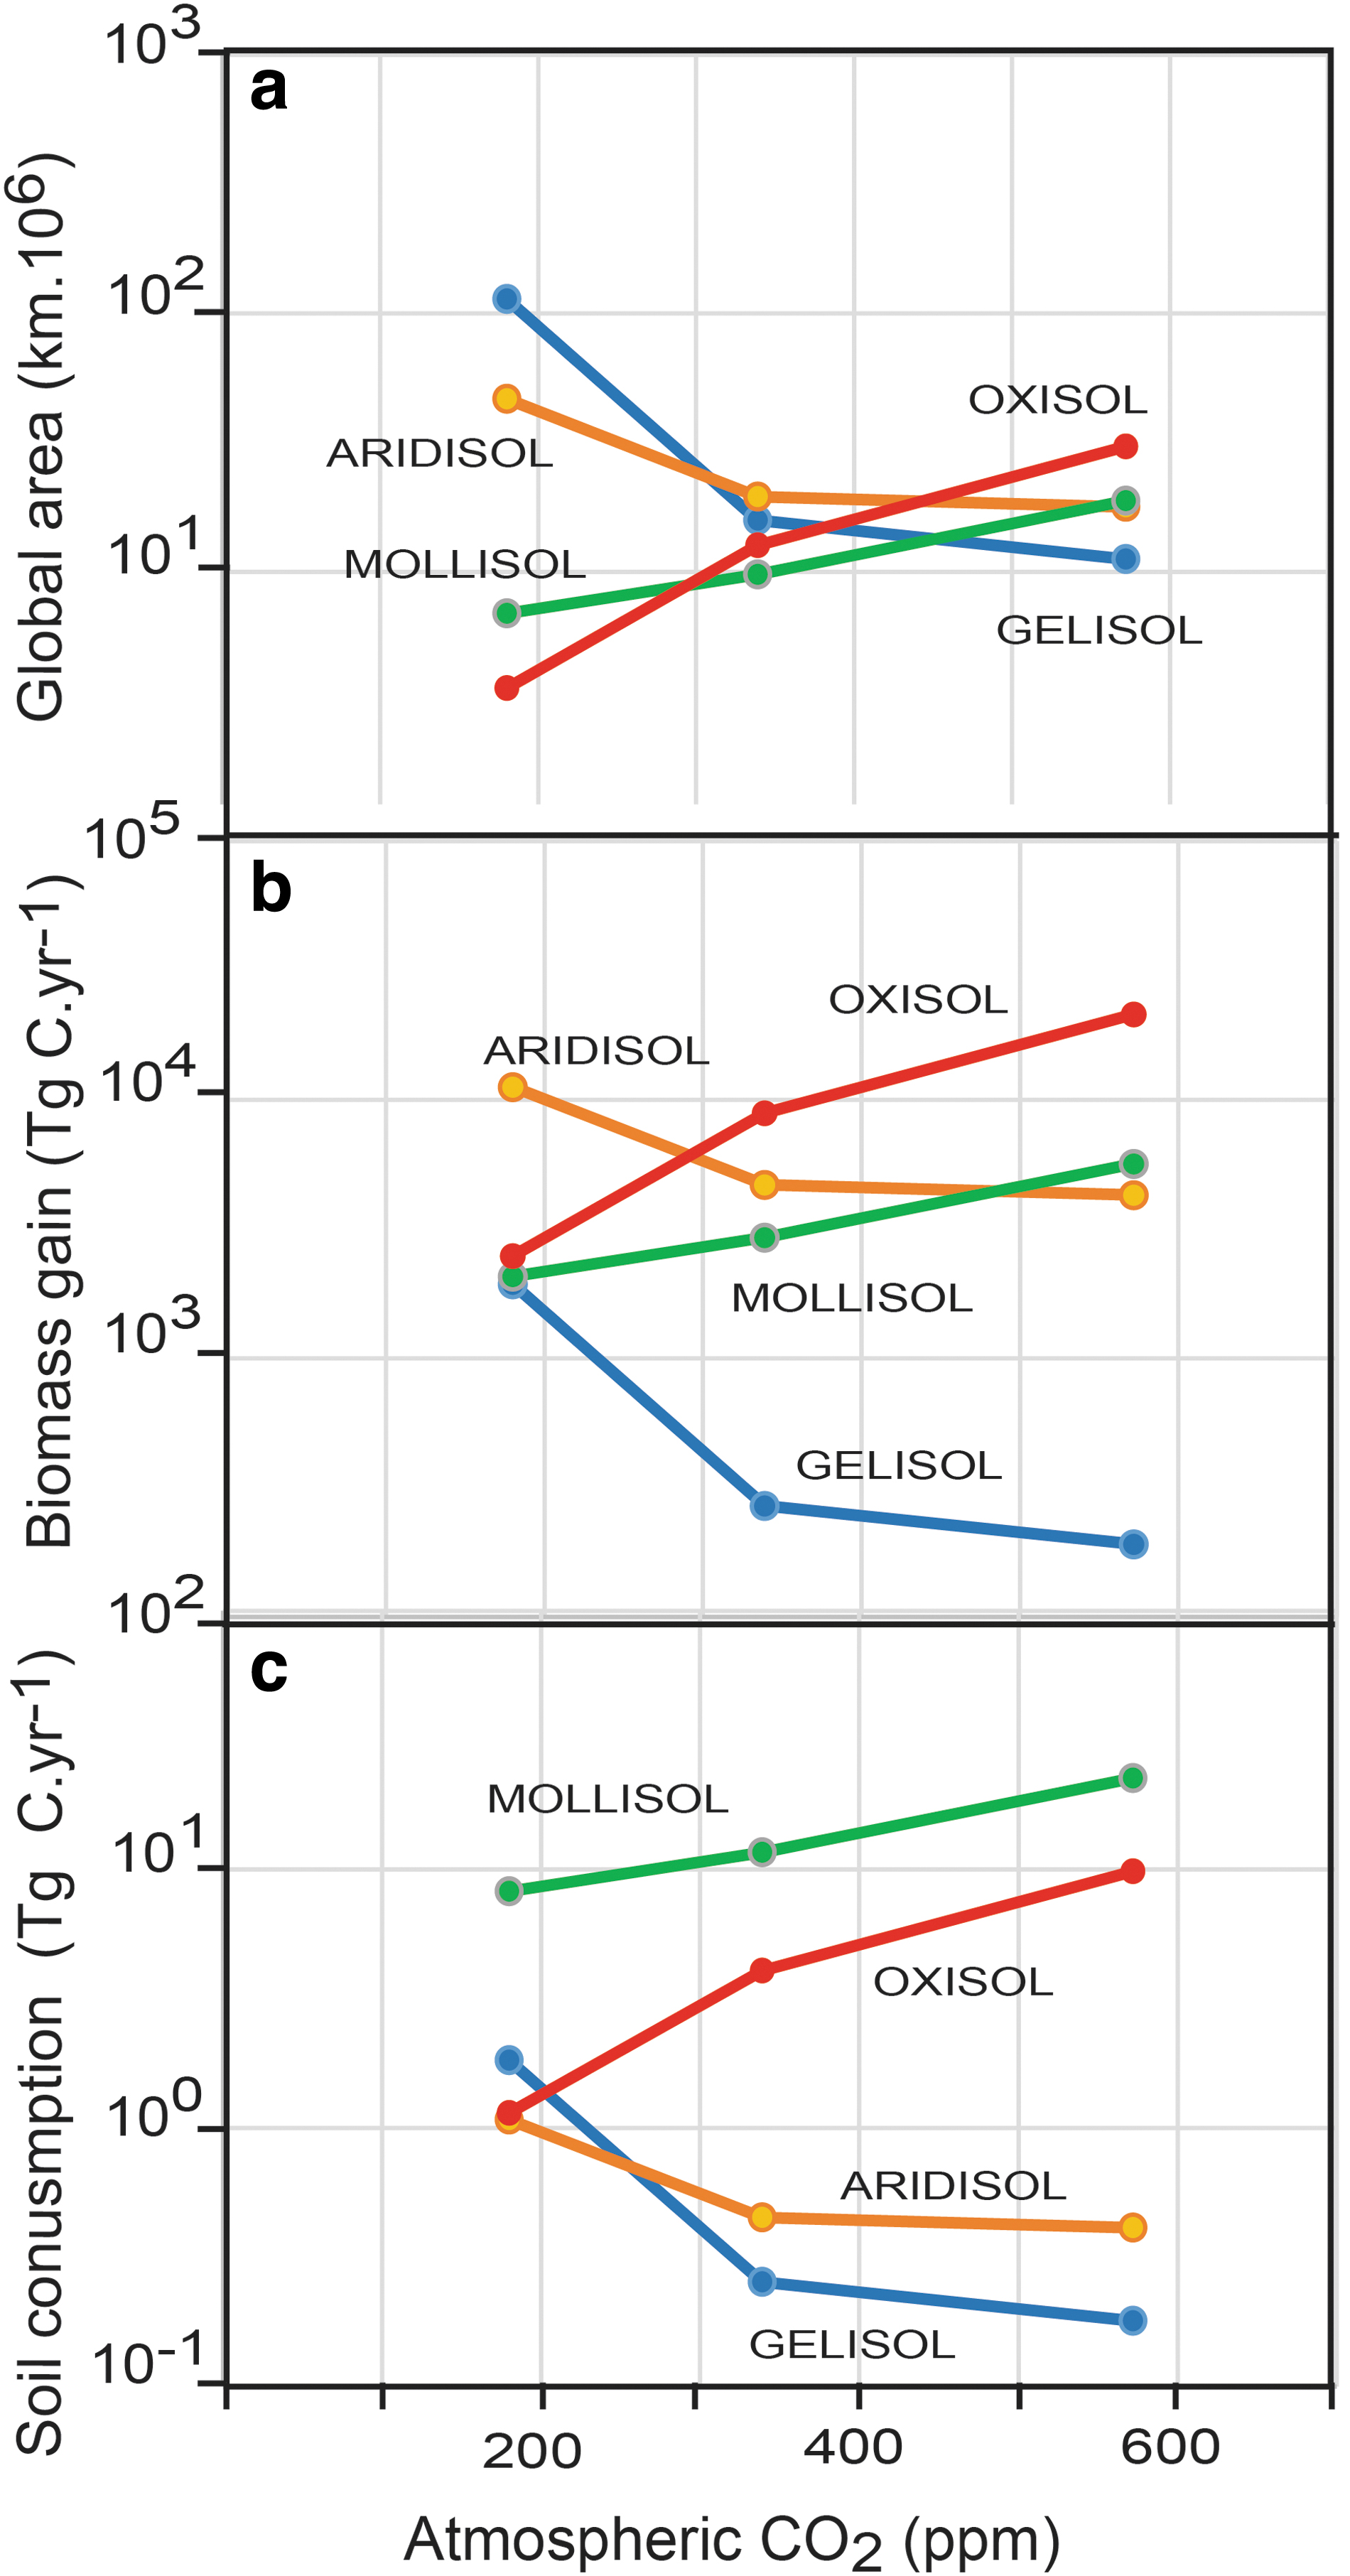
Changing areas (km2·106), biomass gain (Tg C·year−1), and soil consumption (Tg C·year−1) of four soil orders with different levels of atmospheric CO2 (ppm) during the last glacial maximum (ca. 20 ka), late 20th century (1980), and middle Miocene (16 Ma).
In contrast, Aridisols and sandy deserts during the middle Miocene epoch covered only 17.6 million km2 compared with 19.6 million km2 now (Sanchez et al., 2009) and 46.8 million km2 during the last glacial maximum. Gelisols and ice caps during the middle Miocene epoch covered 11.2 million km2 compared with 15.8 million km2 now (Sanchez et al., 2009) and 114.0 million km2 during the last glacial maximum stage, including expanded marine ice shelves (Scotese, 2014).
4. Greenhouse Drawdown
The middle Miocene warm–wet paleoclimate, at a time of 588 ± 72 ppm (Retallack and Conde, 2020) CO2, saw expansion of productive Oxisols and Mollisols, but a retreat of low-productivity Aridisols and Gelisols. Differences in atmospheric CO2 drawdown by these ecosystems and their soils can be calculated from published maximum estimates of biomass (Buringh, 1984), plant productivity (Retallack, 1992), and soil consumption of CO2 (Chadwick et al., 1994; Moquet et al., 2011; Beaulieu et al., 2012) by neutralization of carbonic acid and by chemical reduction to biomass carbon (Table 1). These values and areas of the different soil orders can be used to estimate their maximal drawdown effect on the global carbon cycle (Fig. 3). Carbon consumption levels by Aridisol and Gelisol weathering and biomass at the last glacial maximum are substantial by virtue of their huge areas, but they are much less than for Oxisols and Mollisols during the middle Miocene epoch. Oxisols under rain forests and Mollisols under grasslands increased the middle Miocene biomass to 21,452 and 5669 Tg C·year−1, respectively, compared with the last glacial maximum Oxisol and Mollisol biomass of only 2495 and 2077 Tg C·year−1, respectively. Middle Miocene global soil carbon consumption for Oxisols and Mollisols was 9.8 and 22.4 Tg C·year−1, respectively, compared with last glacial maximum values of 1.1 and 8.2 Tg C·year−1, respectively. Mollisols first appeared at 19 Ma and played a role in global cooling (Retallack, 2013a), but Oxisols and rain forests have been important carbon sinks since the Moscovian (310 Ma) stage of the Carboniferous period (Retallack and Germán-Heins, 1994). Such carbon sinks are capable of eliminating the middle Miocene spike of 588 ppm CO2 according to a model by Kerrick and Caldeira (1999), showing a fall from 600 to 200 ppm CO2 in less than a million years with a weathering sink of only 1 TmolC.year−1, which is 12 Tg C·year−1. A limitation of this carbon sink model by Kerrick and Caldeira (1999) is that it does not consider compensating mechanisms, such as photorespiration, evapotranspiration, and CO2 starvation (Beerling et al., 2012).
This approximation of terrestrial carbon consumption does not take into effect carbon burial in organic matter and as carbonate in the ocean, fueled by increased production of soluble nutrients and bicarbonate on land. Middle to early Miocene oceanic records match terrestrial ones in showing temporal volatility as well as effects of local tectonic activity (Ji et al., 2018). Oceanic carbon sinks are a necessary long-term balance to continuing volcanic and metamorphic degassing of CO2 (Schrag and Hoffman, 2001; Ramos et al., 2020).
5. Icehouse Prevention
At the other extreme of the thermostat are extensive Gelisols and Aridisols during the last glacial maximum stage (Fig. 2). The expansion of Gelisols is impressive, but what stops expansion to avert a terminal snowball? Gelisols and Aridisols are soils of low carbon-sequestering capacity (Table 1) and their increased expanse slowed the rate of global cooling due to diminished soil formation and biomass building. The four orders considered here were still substantial global carbon sinks during the last glacial maximum stage, with the biomass and soils of Aridisols consuming as much as 11,234 Tg C·year−1, Gelisols consuming 1940 Tg C·year−1, Mollisols consuming 2085 Tg C·year−1, and Oxisols consuming 2496 Tg C·year−1. These fluxes were adequate to offset CO2 emissions from metamorphic decarbonation and midocean ridges, currently as much as 662 Mt·year−1 CO2 or 0.00019 Tg C·year−1 (Ramos et al., 2020), to which can be added 0.1 Tg C·year−1 from volcanoes on land and a very substantial 1700 Tg C·year−1 degassing from solutions in oceans and lakes (Ciais et al., 2013). Volcanic, metamorphic, and water body emissions may be the explanation why CO2 has never dipped below 180 ppm and returned to a band between 180 and 400 ppm for most of the past 300 Ma (Fig. 2). However, full glacial sequestration by just four soil orders at modern carbon sequestration capacity (Table 1) is an order of magnitude greater than emissions. Substantial carbon starvation limitations on plant growth are needed to explain the observed global CO2 minimum. Beerling et al. (2012) modeled this effect as a factor-of-four decrease in weathering from 400 to 100 ppm CO2. They attribute this to decreased net primary productivity with less below-ground C allocation, reduced demand for soil cations, reduction in root symbiotic mycorrhizae (arbuscular mycorrhizal fungi) compared with dispersed mycorrhizae (ectomycorrhizal fungi), and conversion of C3 vegetation to less-productive, carbon-conserving C4 grassland and crassulacean acid metabolism desert plants. Plant productivity eventually declines to a point where it is offset by geological emissions and atmospheric CO2 can go no lower (Schrag and Hoffman, 2001).
6. Comparison with Daisyworld
Daisyworld computer models of James Lovelock (Wood et al., 2008) envisaged a global thermostat based on the high albedo and thus cooling effect of white daisies versus low albedo and thus warming effect of black daisies in a world of rising solar luminosity. Nonlinear population growth of the two populations acts to stabilize temperature over a broad range and return temperature to that value after perturbation. Could a similar thermostat be based on the cooling effect of carbon-greedy soil systems such as Oxisols and Mollisols versus the warming effect of volcanic CO2 emissions unabated by carbon-lean soil systems such as Aridisols and Gelisols? The steady degassing of CO2 from continual metamorphic and volcanic activity would thus be analogous to Daisyworld's increased solar luminosity as a long-term warming effect, with occasional perturbation by massive inputs of CO2 from large igneous provinces (Retallack and Jahren, 2008; Saunders, 2016) and bolide impacts (O'Keefe and Ahrens, 1989; Schultz and D'Hondt, 1996). The largest known CO2 greenhouse spikes estimated at 2109 ± 1267 ppm from the stomatal index of fossil leaves (Retallack and Conde, 2020) and at 2518 ± 553 ppm from pedogenic carbonate isotopes (Retallack, 2021) during the Late Permian (252 Ma) eruption of the Siberian traps (Retallack and Jahren, 2008) were sequestered within a million years as deeply weathered paleosols as far south as Australia and Antarctica (Retallack, 2013b). A mid-Cretaceous (100 Ma) CO2 greenhouse spike created Oxisols as far north as Minnesota (Retallack and Dilcher, 2012). The erratic record of atmospheric CO2 levels is far from the fine-tuned thermostatic mechanism emerging from Daisyworld models, in part, because perturbations were large and at long intervals. Nevertheless, Earth has not unraveled into an icehouse such as Mars (Sagan and Mullen, 1972) nor a greenhouse such as Venus (Kasting, 1988), and habitable conditions have prevailed in the long term. This study has examined only the transient middle Miocene CO2 greenhouse spike and its sequestration, but over billions of years of planetary history, evolutionary novelties such as the Pennsylvanian origin of rain forest (Retallack and Germán-Heins, 1994) and Miocene origin of sod grassland (Retallack, 2013a) created notable steps in biotic enhancement of weathering to offset increased insolation (Schwartzman and Volk, 1989).
The Gaia hypothesis continues to be regarded as untestable (Falvey, 2020), but this study offers a clear test of a Gaian planetary thermostat and demonstrates that different proportions of ecosystems with different carbon consumption levels can regulate Earth's atmospheric CO2 greenhouse warming effect. The Daisyworld model of albedo control of planetary temperature is also testable. Albedo of the four ecosystems considered here is 11–13% for tropical rain forests, 14–18% for savanna and grasslands, 23–36% for deserts, and more than 50% for ice and frigid soils with snow cover (Myhre et al., 2005). Loss of planetary heat by reflection from deserts and ice caps is much greater than from rain forests and grasslands. Thus, albedo reinforces cold deserts and ice caps versus warm grasslands and rain forests. This is the opposite of the Daisyworld model: “Black daisies are warmer than white and tend therefore to be favored by cooler mean temperatures, yet an increase in the numbers of black daisies tends to warm the planet,” (Watson and Lovelock, 1983, p 287). Thus, albedo fails the test data presented here (Fig. 2) because rain forests expand with warmth not cold. In addition, unlike balanced Daisyworld mathematical models (Wood et al., 2008), the Soilworld thermostat proposed here gives prompt recovery from severe abiotic perturbations observed in the fossil record (Fig. 1a).
The soil-CO2 thermostat of Soilworld proposed is distinct only in detail and timescale from the widely used silicate mineral weathering sink (Walker et al., 1981; Schrag and Hoffman, 2001; Berner, 2006). It is not just aqueous CO2 as carbonic acid equilibrated with the atmosphere for a particular climate and atmospheric CO2 level that drives soil carbon sinks but also ecosystem-specific soil-CO2 concentrations created largely by soil respiration (Schwartzman and Volk, 1989). Levels of up to 104,000 ppm CO2 (371 times the preindustrial atmosphere of 280 ppm) have been recorded within Oxisols, and up to 12,400 ppm in Mollisols (44 times the preindustrial atmosphere), deep within well-drained soil profiles where rock is weathered (Retallack, 2009b). This high, secondary soil productivity accelerates silicate weathering and fuels high primary productivity for Mollisols and Oxisols (Table 1). Aridisols, in contrast, have only 615–2572 ppm (Montanez, 2013) soil CO2 and Gelisols have 680–5400 ppm above the water table for less than half the year (Lee et al., 2010). Bicarbonate production from chemical weathering and reduced soil carbon from decay of organic matter are both important carbon sinks (Chadwick et al., 1994; Moquet et al., 2011; Beaulieu et al., 2012) and are intrinsic soil–ecosystem features, independent of atmospheric CO2. Available precipitation and warmth have been argued as determinants of rain forests and grasslands (Ray and Adams, 2001; Beerling et al., 2012), but rain forests promote more rain forests downwind by transpiring clean water rained out in large drops (Maslin et al., 2005), and grasslands extend their range through destruction of trees by elephants, spread of fire in grassy tinder, and close grazing and manuring by hypergrazers (Savory and Butterfield, 2016). Coevolution of grasses and grazers created Mollisols, a distinctly different soil than any pre-existing soil (Retallack, 2013a). Grasslands did not adapt to the environment, but changed the environment (Dokuchaev, 1883). A coevolved recycling system of fungi, termites, and plants (Mueller et al., 2011) may explain the luxuriance of rain forests despite infertile clayey soils (Oxisols) leached of mineral nutrients to depths of tens of meters (Retallack, 2010). When mutually interdependent organisms coevolve closely with each other, rather than adapt to the environment, they change the world.
7. Conclusions
Atmospheric CO2 spikes in deep time from catastrophic injections of CO2 from large igneous provinces (Retallack and Jahren, 2008; Saunders, 2016) or impacts (O'Keefe and Ahrens, 1989; Schultz and d'Hondt, 1996) have been drawn down rapidly by poleward migration of carbon-sequestering tropical forests and their soils (Oxisols) and by desertward expansion of grasslands and their soils (Mollisols). At the other extreme of low atmospheric CO2, grasslands and tropical forests retreated with expansion of deserts and their soils (Aridisols) and of ice caps and frozen soils (Gelisols). These soils of limited carbon sequestration capacity could not offset continued volcanic and metamorphic CO2 degassing. Highly varied CO2 records do not reveal long-term global equilibrium (Fig. 1a) computed by Daisyworld models (Wood et al., 2008). Moreover, no large CO2 injection has yet run away to a terminal greenhouse such as Venus (Kasting, 1988), nor has CO2 been drawn down to an icehouse such as Mars (Sagan and Mullen, 1972). The short-term thermostat outlined here employs a familiar model of global carbon sequestration by silicate weathering inferred to offset increased warmth due to stellar evolution over the 4.6 Ga history of our solar system (Walker et al., 1981; Schwartzman and Volk, 1989). Instead of long-term evolution of terrestrial carbon sequestration (Retallack, 2010, 2013a), the model outlined here proposes temperature regulation by biogeographic migration of plants and soils. This view of temperature regulation by migration rather than evolution has implications for modern carbon sequestration in agricultural grasslands (Teague et al., 2011) and managed rain forests (Gatti et al., 2014).
Footnotes
Acknowledgments
Barry Hughes, Greg Bothun, Dan Gavin, and Pat Bartlein offered stimulating discussions. Jonathan Wynn, Joshua Roering, and Edward Davis proffered mathematical advice. Norman Sleep and Chris McKay offered useful and detailed reviews.
Author Disclosure Statement
No competing financial interests exist.
Funding Information
No funding was available.
Supplementary Material
Supplementary Table S1
Supplementary Table S2
References
Supplementary Material
Please find the following supplemental material available below.
For Open Access articles published under a Creative Commons License, all supplemental material carries the same license as the article it is associated with.
For non-Open Access articles published, all supplemental material carries a non-exclusive license, and permission requests for re-use of supplemental material or any part of supplemental material shall be sent directly to the copyright owner as specified in the copyright notice associated with the article.