
Abstract
Anthraquinones are a family of natural products with useful bioactivity and optical properties. An anthraquinone called parietin is produced by extremophiles to protect against solar ultraviolet B radiation, so it is a potential biosignature in astrobiology. Raman spectroscopy, which is now used in space environments, can detect molecules such as parietin based on molecular vibrations. In this study, we show that time-dependent density functional theory (TDDFT) can accurately calculate the Raman spectra of three dihydroxyanthraquinones: parietin, emodin, and chrysophanol. By comparing calculated spectra to measured Raman spectra from purified powders, 10 vibrational modes are identified. The detailed molecular motions of these fused ring vibrations are described, and vibrations modes that are common to all three molecules are highlighted. In addition to powder spectra, Raman measurements from the thallus of Xanthoria parietina, a lichen that produces parietin, are reported, with excellent agreement to both the parietin powder and calculated Raman spectra. These results show that TDDFT calculations could make significant contributions to spectral analysis in the search for biotic organic materials beyond Earth.
1. Introduction
The anthraquinones are a family of molecules made up of anthracene with two ketone groups on the central ring. Hundreds of different anthraquinone species have been identified in plants, fungi, and insects. They have been used for centuries as pigments due to their optical properties and in traditional medicine due to their bioactivity (Malik and Mueller, 2016; Masi and Evidente, 2020; Greco et al., 2021). More recently, they have been pursued as anticancer drugs, photocatalysts, and building blocks in drug design (Fouillaud et al., 2016; Malik and Mueller, 2016; Goga et al., 2018; Cervantes-Gonzalez et al., 2020; Greco et al., 2021). These historic and modern applications have generated interest in detecting anthraquinones by analytical methods, including Raman spectroscopy (Edwards et al., 1991, 1994; Mueller et al., 1999; Fabriciova et al., 2012; Lopez-Tobar et al., 2016; Shahid et al., 2019).
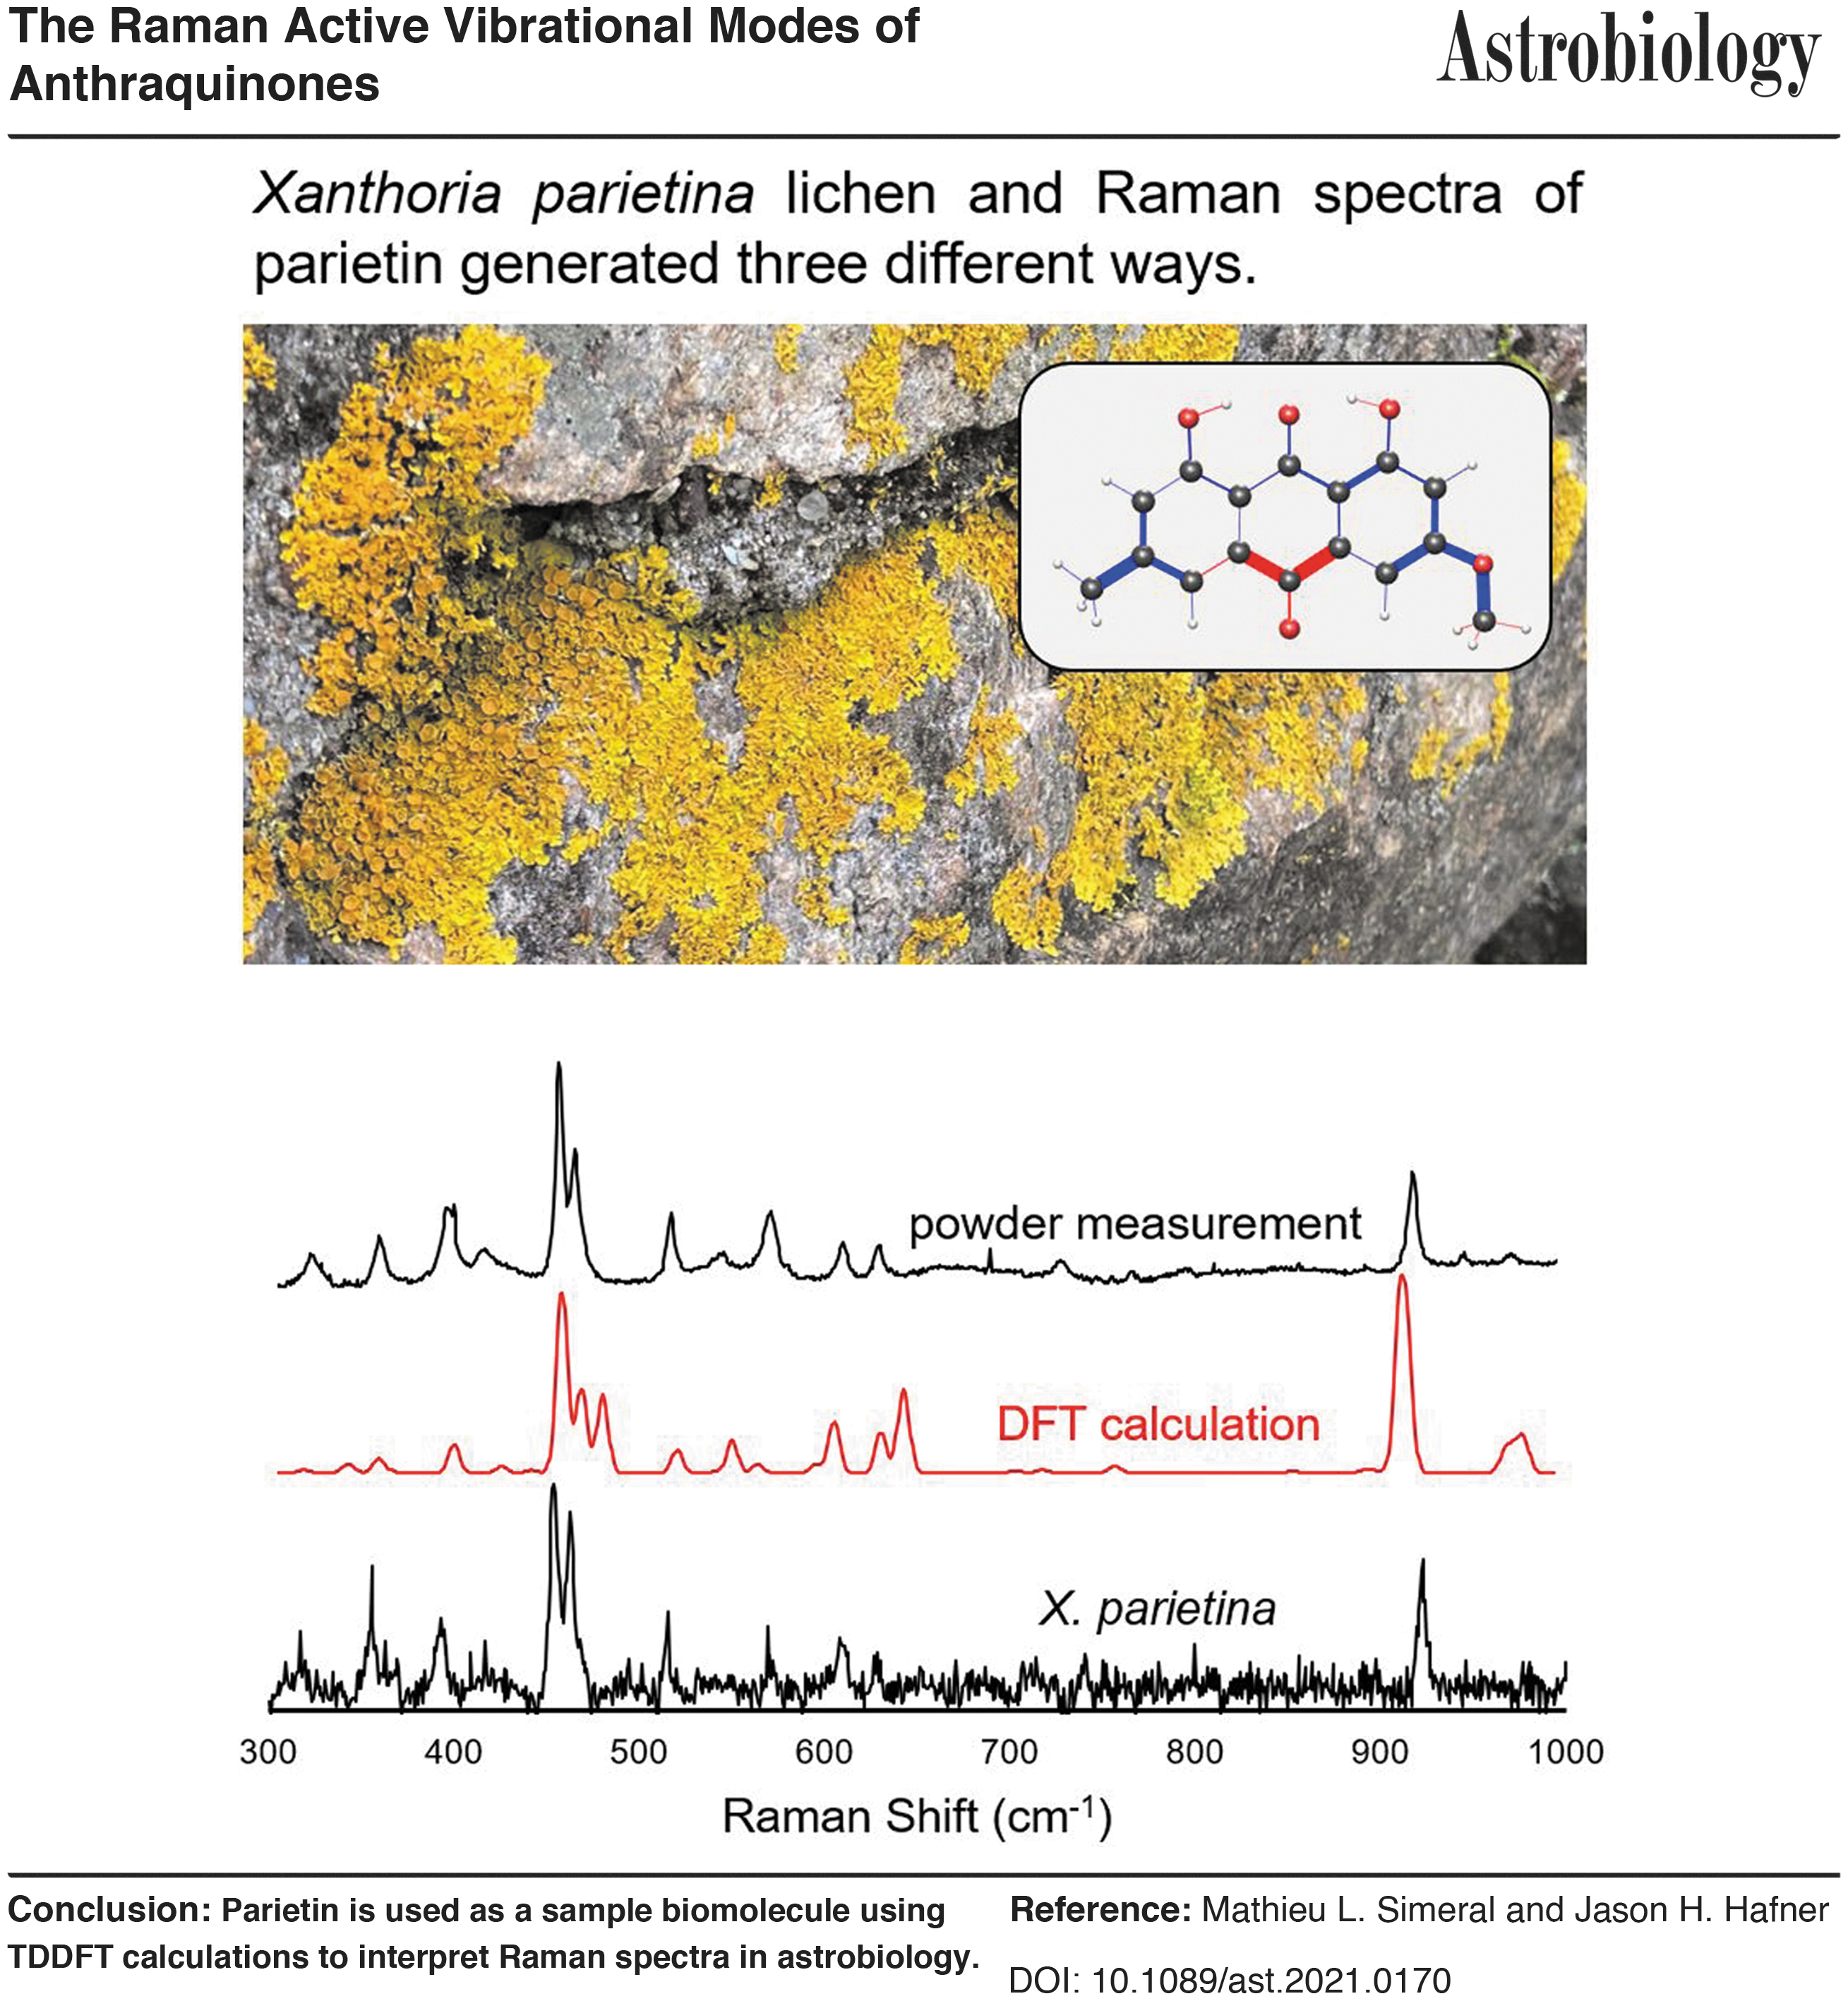
Anthraquinones may also serve as biosignatures in the search for life beyond Earth. The survival strategies and detection of organisms under harsh conditions on Earth are studied as models for astrobiology (Edwards et al., 2003, 2004; Villar et al., 2005; Marshall et al., 2010; Miralles et al., 2015; Hanke et al., 2019; Blacksberg et al., 2020). For example, Antarctic Xanthoria elegans lichens that were exposed to ultraviolet B solar radiation were found to produce higher levels of a dihydroxyanthraquinone called parietin than X. elegans lichens that were protected by optical filters (Edwards et al., 2004). This supports the hypothesis that the lichen uses parietin to shield its sensitive photosynthetic algae from UV radiation. Therefore, the detection of dihydroxyanthraquinones, either on exposed surfaces or decomposed and buried in rock, on Earth or elsewhere, could be a sign of extant or fossilized forms of life.
The detection of specific organic molecules in space environments is challenging. Most experimental measurements to date have come from mass spectrometry, chromatography, and fluorescence analysis, whereas Raman spectroscopy is a new experimental method in this area (Pasteris and Wopenka, 2003; Marshall et al., 2010; Marshall and Marshall, 2014; Abbey et al., 2017). It has several advantages, including the potential for detailed molecular identification based on molecular vibrations, essentially zero sample preparation since it is a light scattering method, high-resolution spatial mapping when combined with optical microscopy, and the ability to analyze both organic and mineral samples. A UV Raman spectrometer is on the Mars 2020 Perseverance rover and one is under development for the upcoming ExoMars mission in 2023 (Rull et al., 2017; Bhartia et al., 2021).
Current and planned Raman instruments undergo years of design and testing to optimize for excitation wavelength, spectrometer geometry, detector properties, and pulsed versus continuous excitation. These choices are made while balancing needs for resolution, sensitivity, background fluorescence, spectral bandwidth, and likely mineral and organic targets. Instrumental capabilities are tested on model mineral and organic materials, some using parietin as an example (Culka et al., 2019; Hanke et al., 2019; Blacksberg et al., 2020). Instruments are also taken into the field for testing at terrestrial analog sites (Edwards et al., 2007; Hutchinson et al., 2014; Rull et al., 2021).
Although Raman spectra contain a great deal of information, spectral interpretation remains a significant challenge. The characteristic frequencies of common functional groups within a molecule are well known and can be used for basic analysis, such as to confirm the presence of organic material (Socrates, 2004; Marshall et al., 2010; Marshall and Marshall, 2014). However, the unique vibration patterns of larger portions of a molecule are more difficult to identify. In this study, we show that Raman spectral calculations using time-dependent density functional theory (TDDFT) yield accurate spectra for three dihydroxyanthraquinones in a low-frequency spectral window. TDDFT reveals the detailed molecular motion of vibrational modes and provides insights into common vibrations among this family of molecules. The many potential benefits of TDDFT calculations of Raman spectra to the detection of organic molecules of interest in astrobiology will be discussed.
2. Materials and Methods
2.1. Materials
1,3,8-trihydroxy-6-methylanthracene-9,10-dione (emodin) powder, ≥90% purity, and 1,8-dihydroxy-3-methoxy-6-methylanthracene-9,10-dione (parietin) powder, ≥90% purity, were purchased through Sigma-Aldrich from PhytoLab, batch numbers 97791031 and 103174295, respectively. 1,8-dihydroxy-3-methylanthracene-9,10-dione (chrysophanol) powder, ≥98% purity, was purchased from Sigma-Aldrich, lot number BCCC4970. Xanthoria parietina lichen samples were collected from a stone wall in Sandwich, MA at 41°45′29.4″N 70°29′52.3″W. They were scraped off but largely intact and stored in a sealed plastic bag until spectra were recorded within 6 weeks.
2.2. Raman spectroscopy
Raman spectra were obtained using a custom Micro-Raman spectrometer. A 785 nm 80 mW stabilized CW diode laser (Ondax RO-785) was used as the excitation source and paired with a volume holographic grating (Ondax VHG) to obtain a monochromatic beam. Power was controlled using a continuously variable neutral density filter (Thorlabs NDL-25C-2). A dichroic mirror (Semrock LPD02-785RU-25 × 36 × 1.1) directed the beam to a near-infrared (IR) corrected 20 × /0.45 NA microscope objective (Olympus LCPLN20XIR), which focused it onto the sample.
Samples were secured to a movable stage allowing them to be brought into focus. Backscattered Raman signal was then collected by the objective, passed back through the dichroic mirror, and filtered again using a block filter (Chroma RET792lp). A second near-IR corrected objective, 5 × /0.1 NA objective (Olympus LMPLN5XI) focused the beam onto the entrance slit of the spectrograph (Princeton Instruments IsoPlane SCT 320). The spectrograph then spatially separated the light of different wavelengths, which was recorded on a thermoelectrically cooled open-electrode CCD camera (Princeton Instruments Pixis 256E) at a resolution of 6 cm−1.
2.3. Powder and lichen spectra
Powder samples were prepared by applying a small quantity of powder to a holder using double-sided carbon tape. Similarly, for the lichen spectrum, a piece of lichen thallus of vibrant orange color (as judged by eye) was attached to the holder using double-sided tape. The holder was then attached to the Micro-Raman setup sample stage and the sample was brought into focus. Laser power was reduced to 5 mW for parietin and emodin, 5–20 mW for the lichen, and 20 mW for chrysophanol to prevent excessive sample degradation due to heating. In each case, four 20-min Raman signal integrations were carried out consecutively with the spectrometer centered at 810, 840, 870, and 900 nm. These four integrations were then stitched together manually to obtain a single continuous spectrum. When necessary, linear background subtraction was performed on the powdered sample spectra.
2.4. Density functional theory calculations
Quantum chemical calculations were carried out with the Amsterdam Density Functional program from Software for Chemistry & Materials (ADF 2019.306, SCM, Theoretical Chemistry, Vrije Universiteit, Amsterdam, The Netherlands,
Sixteen conformers of emodin were obtained with the same conformational variations as well as two possible orientations of the C3 hydroxyl group (hydrogen “pointing” up or down). Only 11 of the parietin conformers were calculated due to computational constraints. They had the same variations as chrysophanol as well as the two possible rotations of the O4-C11 bond, and the two rotations of the C3-O4 bond, with the C11 atom either “pointing” up or down.
All the chrysophanol and emodin conformers, and four of the parietin conformers then had their geometry optimized. The calculation used the following parameters: a Becke–Perdew exchange–correlation potential under the generalized gradient approximation with a third-order dispersion correction and Becke–Johnson damping [GGA/BP86-D3(BJ)], a quad zeta basis set with four polarization functions (QZ4P), no frozen core, no relativistic correction, and good numerical quality (van Lenthe et al., 1993, 1994, 1999; van Lenthe and Baerends, 2003). The normal modes of each conformer were determined using an IR calculation with the same parameters. Finally, a Raman range calculation was done for a specified frequency range for 1.58 eV (785 nm) excitation with a two-point numerical differentiation of the polarizability tensor (Fan and Ziegler, 1992a, 1992b; van Gisbergen et al., 1995, 1996, 1999; Jensen et al., 2007).
2.5. Mode visualization
To visualize and compare molecular vibrational modes with more precision than a written description and more easily presentable than a full animation, we developed a method for highlighting bonds that stretch the most. For a given mode and conformer, the TDDFT normal-mode results were used to calculate a weighting factor for each bond:
r 1 and r 2 correspond to the vector position of the bond's atoms 1 and 2, respectively. a 1 and a 2 are the vector amplitudes of the normal mode vibrations for atoms 1 and 2. The magnitude of the factor is proportional to how much the bond stretches along its length. This metric removes translation of the bond due to the vibration of other parts of the molecule. Comparing the factor's sign between bonds tells us if they are stretching in or out of phase. To show this visually, a MATLAB app was developed to draw the conformer with the bonds’ width proportional to the weighing factor's magnitude and their color (red or blue) dependent on its sign. Note that this visualization method only shows bond stretching vibrations, and the stretching component of some other vibrational motion. For our purpose here of showing fingerprint vibrations of a fused ring structure, that is sufficient. A similar visualization solution that shows different kinds of vibrations was arrived at by Laurin (2013).
3. Results
The structures of the three anthraquinones that are compared in this study are displayed in Fig. 1. They all have hydroxy groups on C1 and C8 and a methyl group on C6. In this study, we compare the Raman bands for different functionalization at C3. Chrysophanol has no functional group, emodin has a hydroxy group, and parietin has a methoxy group.
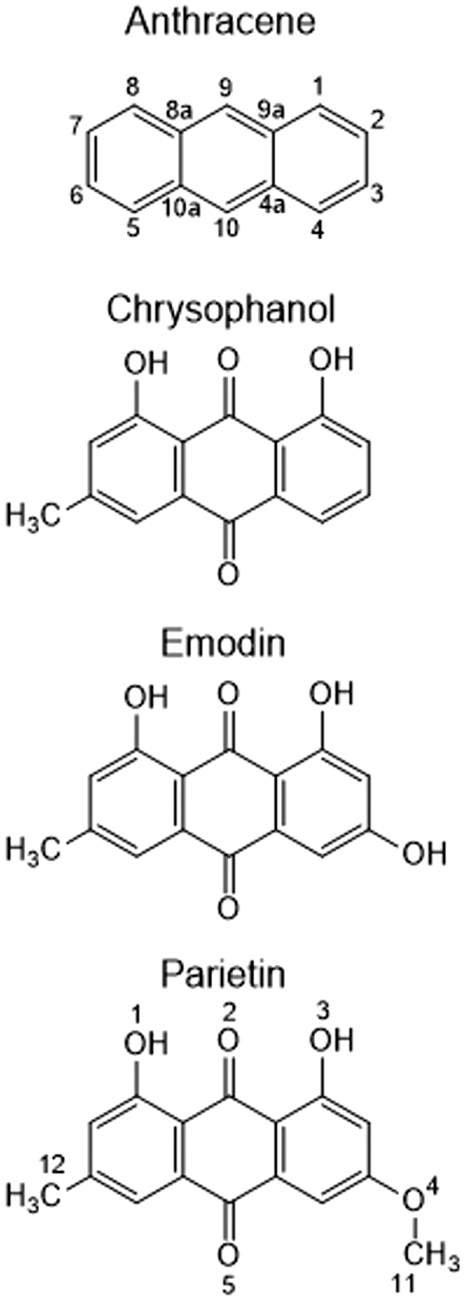
Anthracene and the three dihydroxyanthraquinones studied here. The atom numbers defined for anthracene and parietin are used throughout. Note that defining the chrysophanol methyl group at C6 (rather than C3) is technically incorrect but serves our comparison of the three molecules.
The experimental Raman spectra of three dihydroxyanthraquinone powders are compared with their calculated TDDFT spectra in two spectral windows. The lower frequency window between 300 and 1000 cm−1 contains mostly fingerprint vibrations of the fused ring systems. The higher frequency window from 1000 to 1800 cm−1 has more vibrations of common functional groups. The accuracy of the TDDFT calculations is quite different between the two windows so the results will be discussed separately.
According to DFT structural optimization of these molecules, many stable conformers can be created by rotating the hydroxy, methyl, and methoxy groups. Even these minor conformational changes will impact the calculated Raman spectrum (Oakes et al., 2002; Simeral et al., 2021). For each molecule, multiple conformers were optimized, normal mode analysis was performed, and the Raman calculations were carried out by TDDFT. The average Raman spectrum was calculated using a Boltzmann weighting factor based on the total bonding energies from the DFT calculation. Owing to the energy differences among the conformers, only those with C1 and C8 hydroxy groups pointing toward the quinone O2 atom make a significant contribution. This is consistent with crystal structures of these dihydroxyanthraquinones in which these hydroxy groups form strong hydrogen bonds to the quinone oxygens (Hopf et al., 2012; Deng et al., 2018).
3.1. Low frequencies: 300–1000 cm−1
There is good general agreement between the experimental and calculated spectra for all three molecules in the low-frequency window. Rather than generating an exhaustive table of best-fit matches between the observed and calculated modes, we will focus on modes that are (1) a close match in terms of position and height, (2) strong enough to be possibly detectable in natural samples, and/or (3) common to all three molecules and, therefore, a possible marker for dihydroxyanthraquinones. Ten such modes were identified in total. They are labeled in Figs. 2 –4 and discussed as follows.

The Raman spectrum of chrysophanol in the low-frequency window.
The Raman spectrum of emodin in the low-frequency window.
The Raman spectrum of parietin in the low-frequency window.
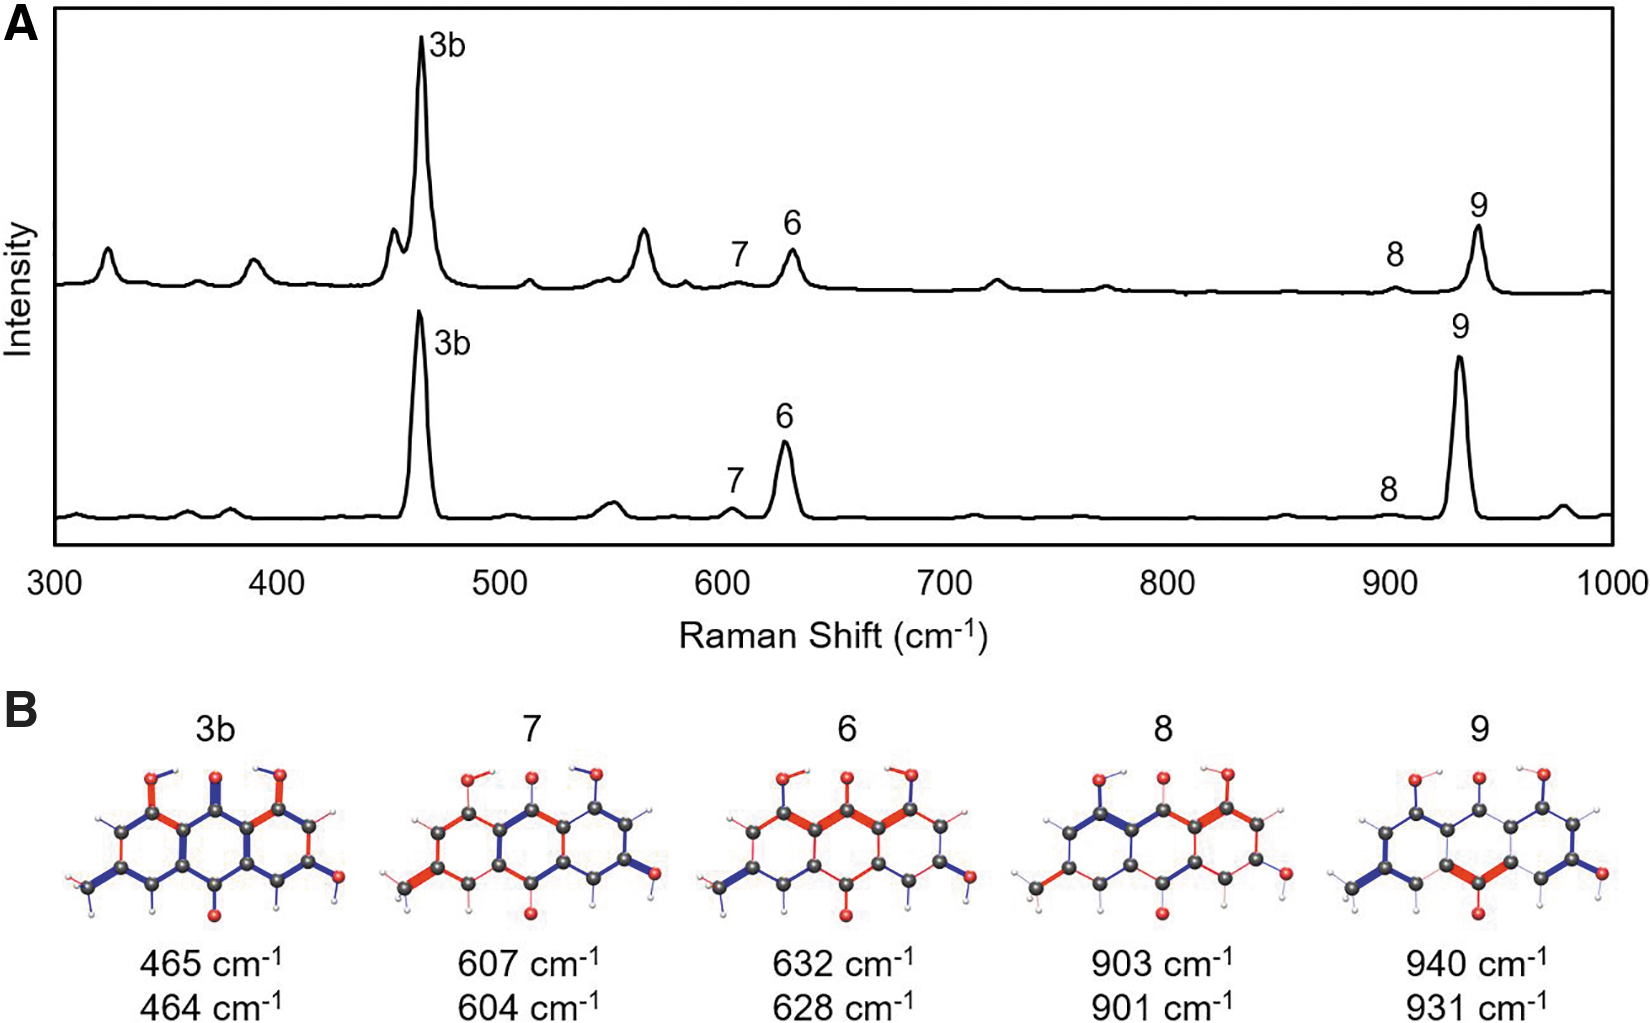
Chryosphanol is the simplest of the dihydroxyanthraquinones studied here, with a methyl group at C6 and no functional group at C3. The structures and Raman spectra of all eight conformers were found and included in the thermal average in Fig. 2A. Five vibrations modes are assigned and given labels consistent with the results for all three molecules: 3b (470 cm−1), 5 (567 cm−1), 6 (600 cm−1), 8 (898 cm−1), and 9 (958 cm−1). Figure 2B displays the bond vibration patterns for each mode, where the thickness of the bond indicates the magnitude of the vibration, and the color indicates the relative phase (expanding or contracting).
Since there is some variation among the conformers, the diagram is shown for the conformer with the largest contribution to the thermally averaged TDDFT spectrum. Although the purpose of the vibration diagrams is to avoid giving descriptive characterizations, we cannot resist doing so. Mode 3b is a stretch of one of the quinone double bonds out of phase with the adjacent hydroxy groups. Mode 5 is a breathing mode of about half of the fused ring C–C bonds. Mode 6 is an in-phase stretch of the C2–C8 chain with an out-of-phase stretch of the C6–C12 methyl group. Mode 8 is an out-of-phase stretch of the two sides of the C2–C7 chain. Finally, mode 9 is a stretch of half of the central ring out of phase with a stretch surrounding nearby C6.
The results for emodin are presented in Fig. 3. With three hydroxy groups and one methyl group that can each take two positions, 16 conformers were generated by DFT. The thermally averaged spectrum is largely determined by the four lowest energy conformers. Five modes are identified: 3b, 7, 6, 8, and 9. Four of them were also seen in chrysophanol and have similar vibrational motion. Mode 7 is new and characterized by an out-of-phase vibration between the C3 and C6 functional groups, as well as some stretches of the fused rings.
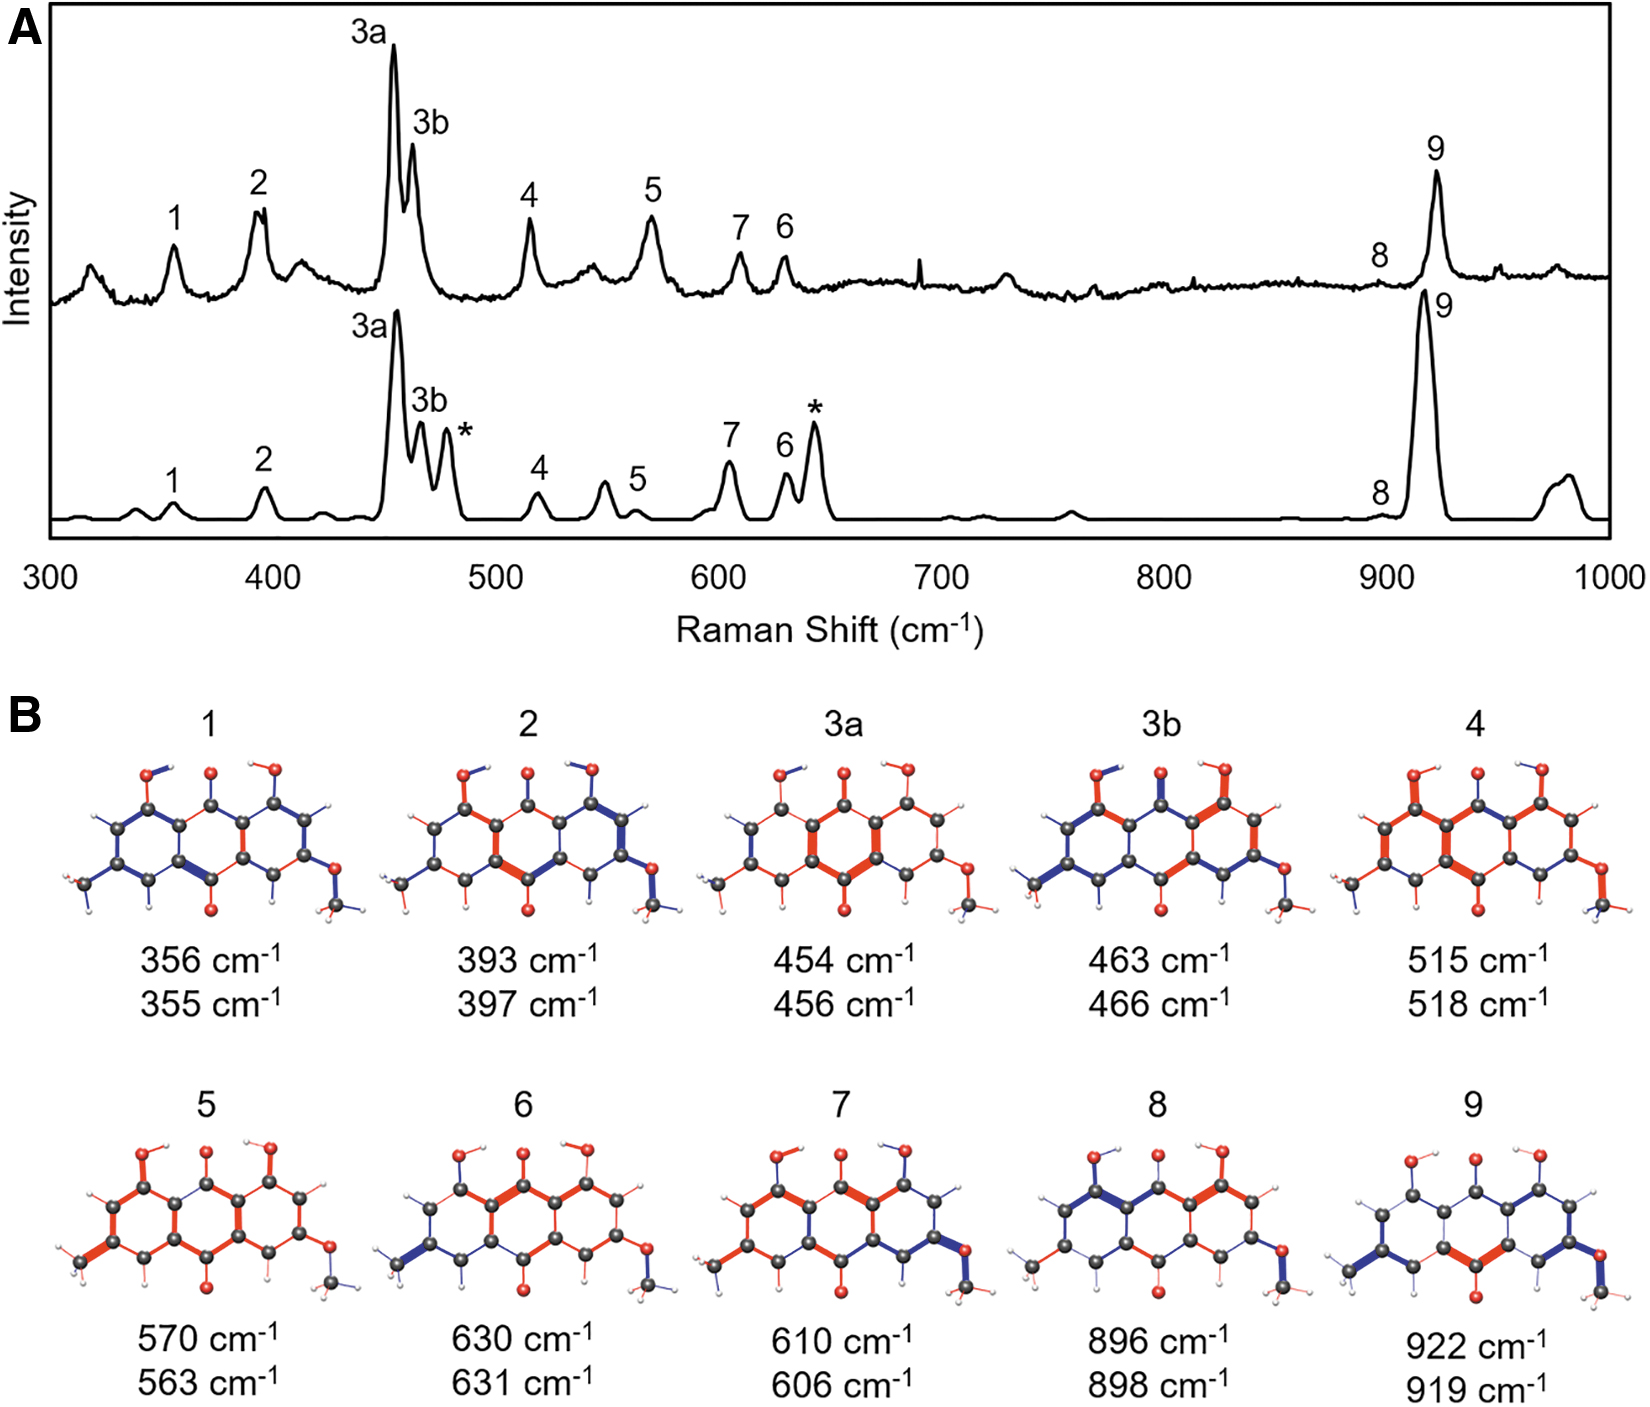
Figure 4 displays the spectra and vibration diagrams for parietin. With a methoxy group at C3, it is a more complex structure and can be seen to support more peaks in the fingerprint region. The number of potential conformers was too large for a full TDDFT analysis, so 11 were simulated, including 4 with the low energy position of the C1 and C8 hydroxy groups described earlier. Six peaks were found with common vibration patterns to chrysophanol and emodin (3b, 5, 6, 7, 8, and 9). In addition, three new low energy modes (1, 2, and 3a) were identified that involve stretches throughout the fused ring structure.
Two strong peaks labeled with asterisks in Fig. 4 are predicted by TDDFT but not observed in the experimental spectrum. The individual spectra of the four lowest energy conformers (not shown) reveal that these peaks are associated with the methoxy positioned “up” with C11 closer to C2 than C4. The spectra with the methoxy group “down” do not have those strong peaks, and are a better match to the powder spectrum. Two reported crystal structures of parietin indicate that the methoxy group is in the “down” position, so the powder spectrum is consistent with crystal structures of parietin, and consistent with TDDFT if the two “up” conformers are ignored.
Of the vibrational modes identified earlier, 3b, 6, 8, and 9 feature common fused ring vibrations in all three molecules and could potentially be used to identify dihydroxyanthraquinones in natural samples. The theoretical and experimental peak intensities of these vibrations are plotted versus C3 functional group mass in Fig. 5. Mode 9 has been previously observed in studies of purified anthraquinones and of pigments in the thallus of certain lichens that include anthraquinone derivatives (Edwards et al., 1994, 2003). The mode has been associated with C–H out of plane bending (Dutta and Hutt, 1987) and as an oxalate ion vibration at the lichen substrate interface (Edwards et al., 1994).
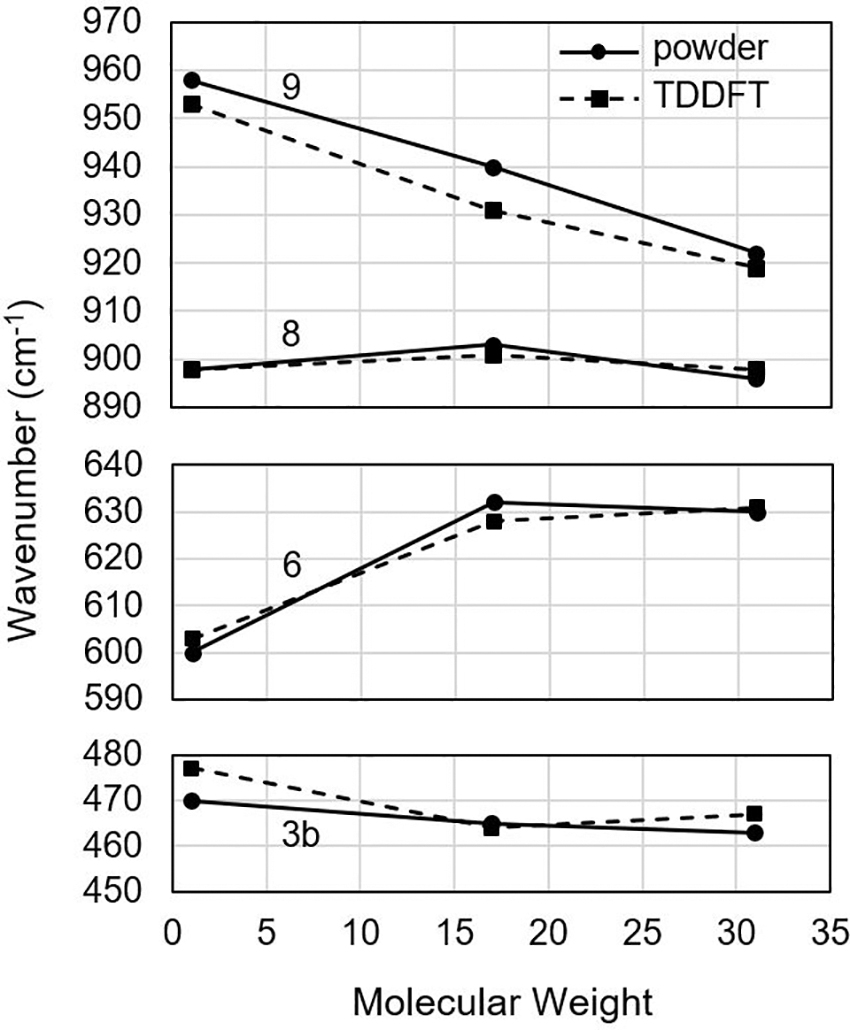
The dependence of the Raman shift of the four common vibrational modes of dihydroxyanthraquinones as a function of the molecular weight of the C3 functional group. TDDFT, time-dependent density functional theory.
A DFT calculation on parietin identified it as ring stretching and in-plane deformation using potential energy surface analysis (Fabriciova et al., 2012). It has also been noted that this peak shifts with different functional groups present at the C3 position, suggesting that it is related to the motion of the fused ring structure. In this study, we identify the vibrational mode that creates this peak and illustrate its vibration pattern (Fig. 4). Figure 5 also confirms that it could serve as a means to identify unknown dihydroxyanthraquinones given the linear shift with C3 functional group molecular weight.
The band made up of modes 3a and 3b is also strong and previously associated with anthraquinones, but in this study we show that the common vibration, mode 3b, is not highly sensitive to the dihydroxyanthraquinone species. Mode 8 is also not sensitive to the molecular weight at C3. Mode 6 changes significantly from chrysophanol to emodin but does not change again moving to parietin. Interestingly, one cannot simply predict which modes will be sensitive to the functional group mass at C3 based on the vibration diagrams in Figs. 2–4. Modes 3b and 8 both have motion in the functional group but do not shift much. This is because the Raman cross-section depends on the change in polarizability with vibrational motion, rather than the motion expressed in the diagrams.
3.2. High frequencies: 800–1800 cm−1
The experimental and calculated Raman spectra of the three anthraquinones in the 1000–1800 cm−1 window are plotted in Figs. 6 –8. The agreement is markedly worse than the low-frequency window. We suspect that this spectral window contains peaks that are more sensitive to hydrogen bonding and the molecular environment. Our criteria for assigning peaks are, therefore, not as stringent, especially regarding spectral position. Still, based on the vibration patterns, some peaks were identified that are common to these anthraquinones.
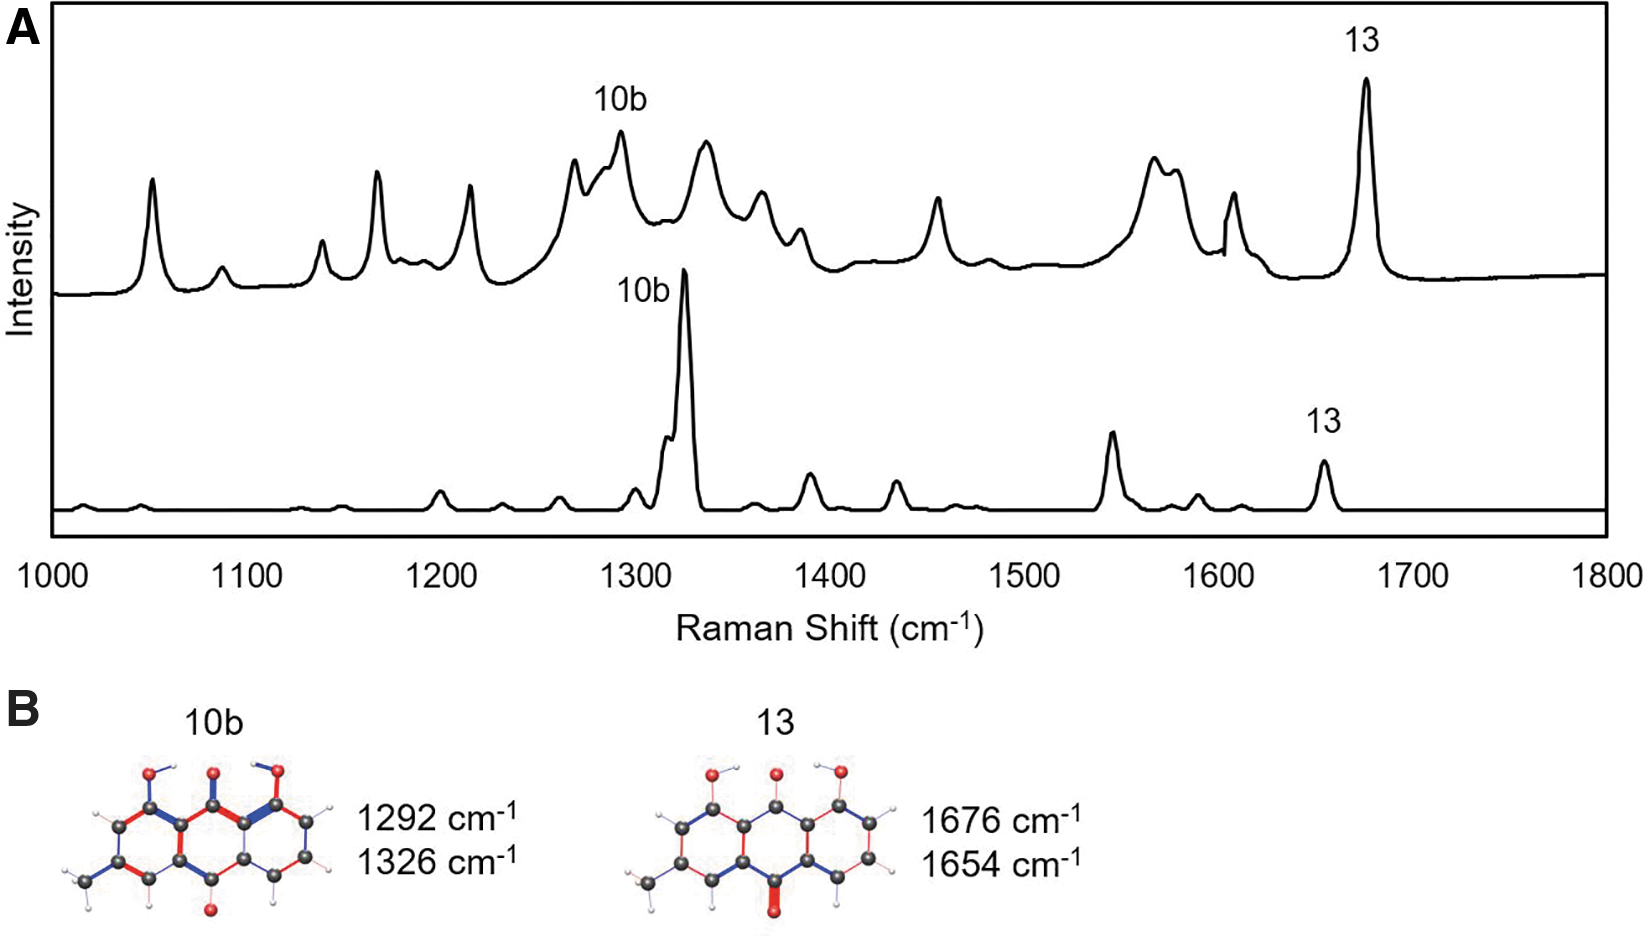
The Raman spectrum of chrysophanol in the high-frequency window.
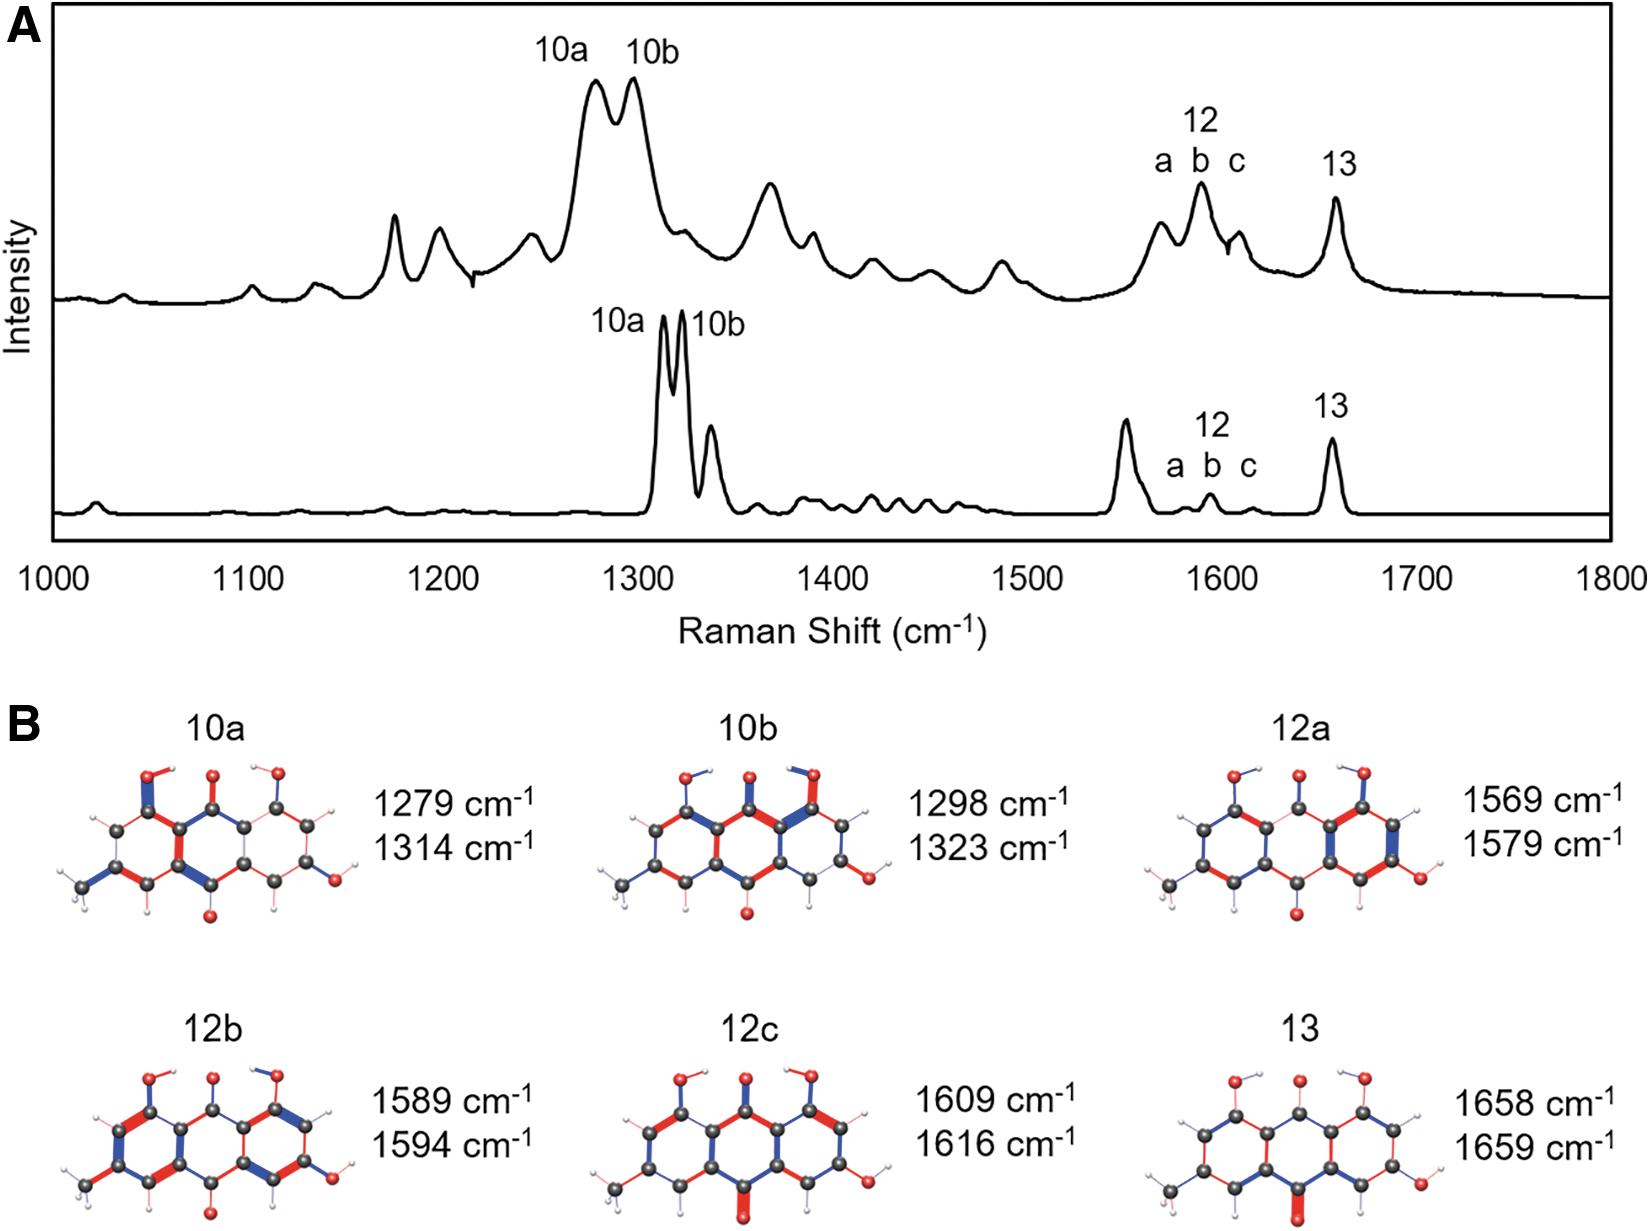
The Raman spectrum of emodin in the high-frequency window.
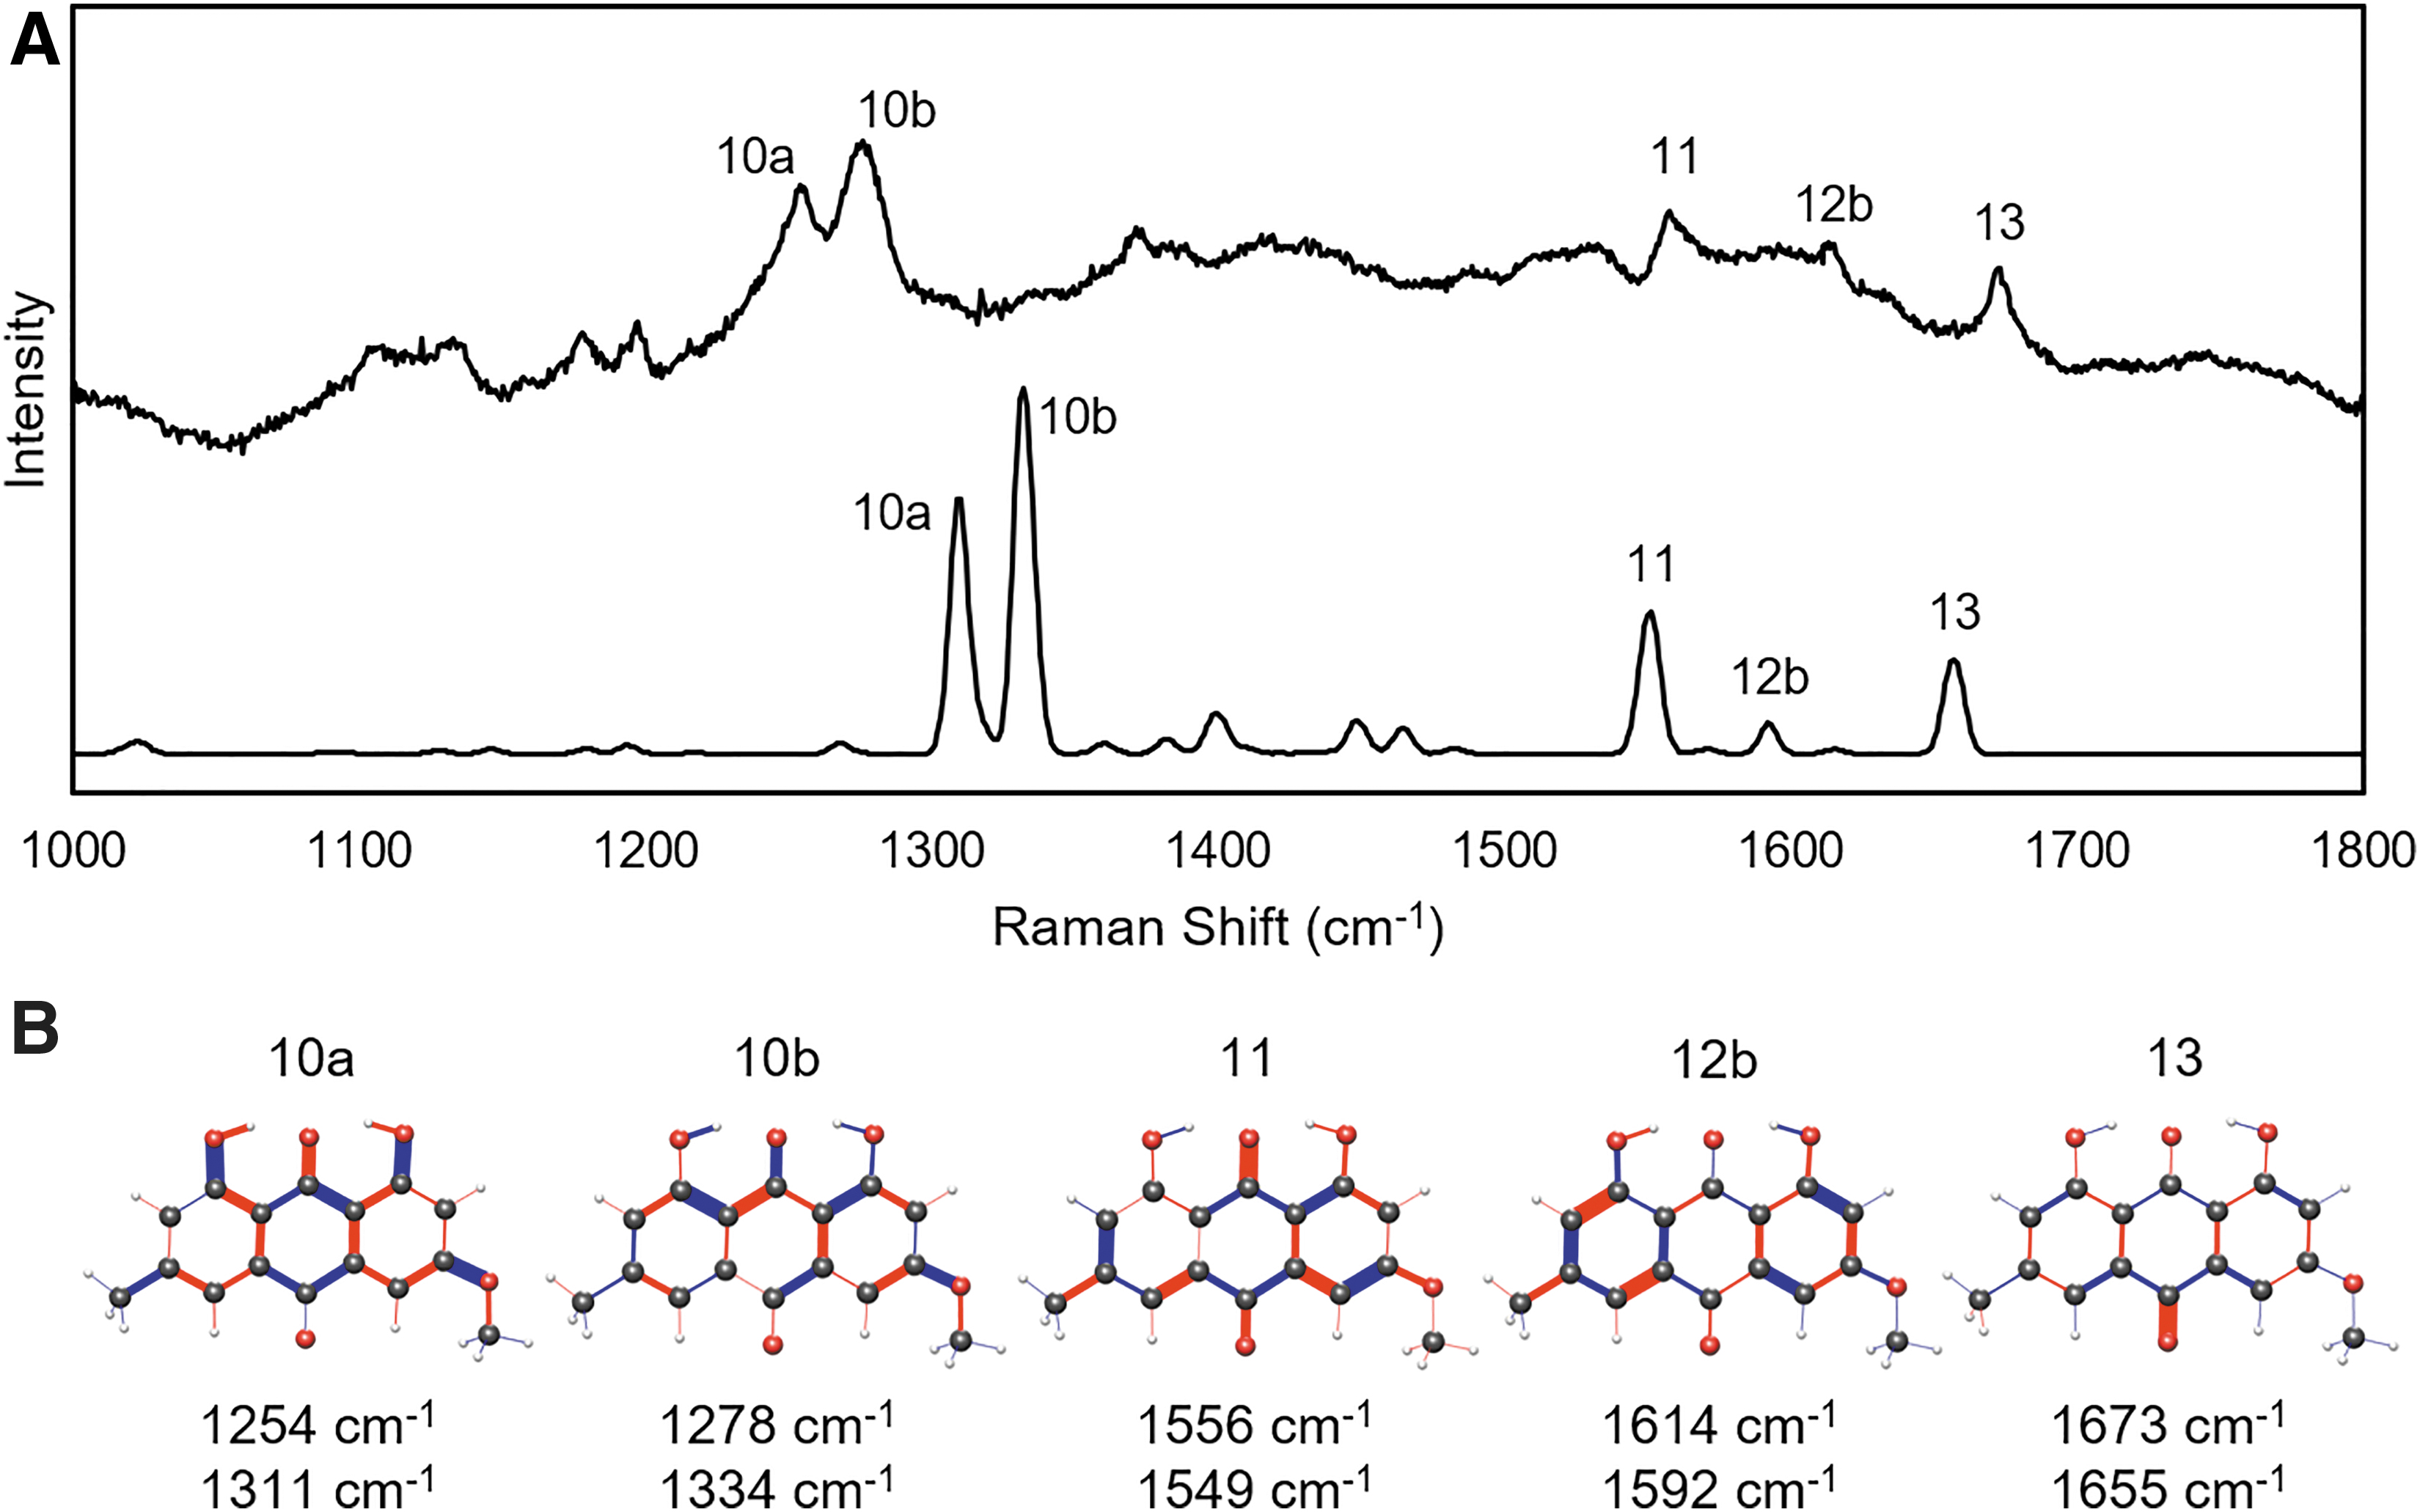
The Raman spectrum of parietin in the high-frequency window.
The double peak features at 1250–1300 cm−1 are up to 60 cm−1 lower than the TDDFT spectra, but their intensity and spacing suggest an accurate identification. Vibration mode 10a is only present in emodin and parietin, and not highly similar between them apart from a strong stretch of the C8 hydroxy oxygen. Mode 10b is more consistent among the three anthraquinones, with stretching of the C9 quinone double bond and out-of-phase stretches along the C1–C8 chain. These modes were previously described as in-plane ring stretches, which is an accurate although general description (Edwards et al., 2003).
Mode 11 is consistently seen in the TDDFT calculations of all three anthraquinones, but only observed experimentally in parietin powder. It features significant stretches of the quinone double bonds as well as ring vibrations. The three modes labeled 12a,b,c are similar and visible in the TDDFT calculations, but only experimentally prominent for emodin. They represent in-plane ring vibrations. Parietin 12b has been previously recognized at a quadrant ring stretch, which is consistent with the TDDFT findings in this study. Finally, mode 13 is the most distinct and consistent among the anthraquinones in this higher frequency spectral window. It almost entirely consists of vibrations of the quinone bond at C10. It has been associated with the anthraquinones in previous studies with an accurate spectral assignment. None of the peaks in the 1000–1800 cm−1 window have a dependence that correlates to the molecular weight of the functional group at C3.
3.3. Natural sample
For a comparison of the calculated spectra to a natural sample, X. parietina was collected from a stone wall and stored under dry conditions. This lichen produces parietin as a secondary metabolite that is thought to provide protection from blue and UV sunlight (Solhaug et al., 2003). Previous studies detected mode 9, 10, and 13, and some have also detected modes 1–5 in Xanthoria lichens (Edwards et al., 2003, 2004; Villar et al., 2005; Hanke et al., 2019). Modes 6 and 7 were visible in some studies but not identified. A Raman spectrum from the X. parietina thallus is shown in Fig. 9.
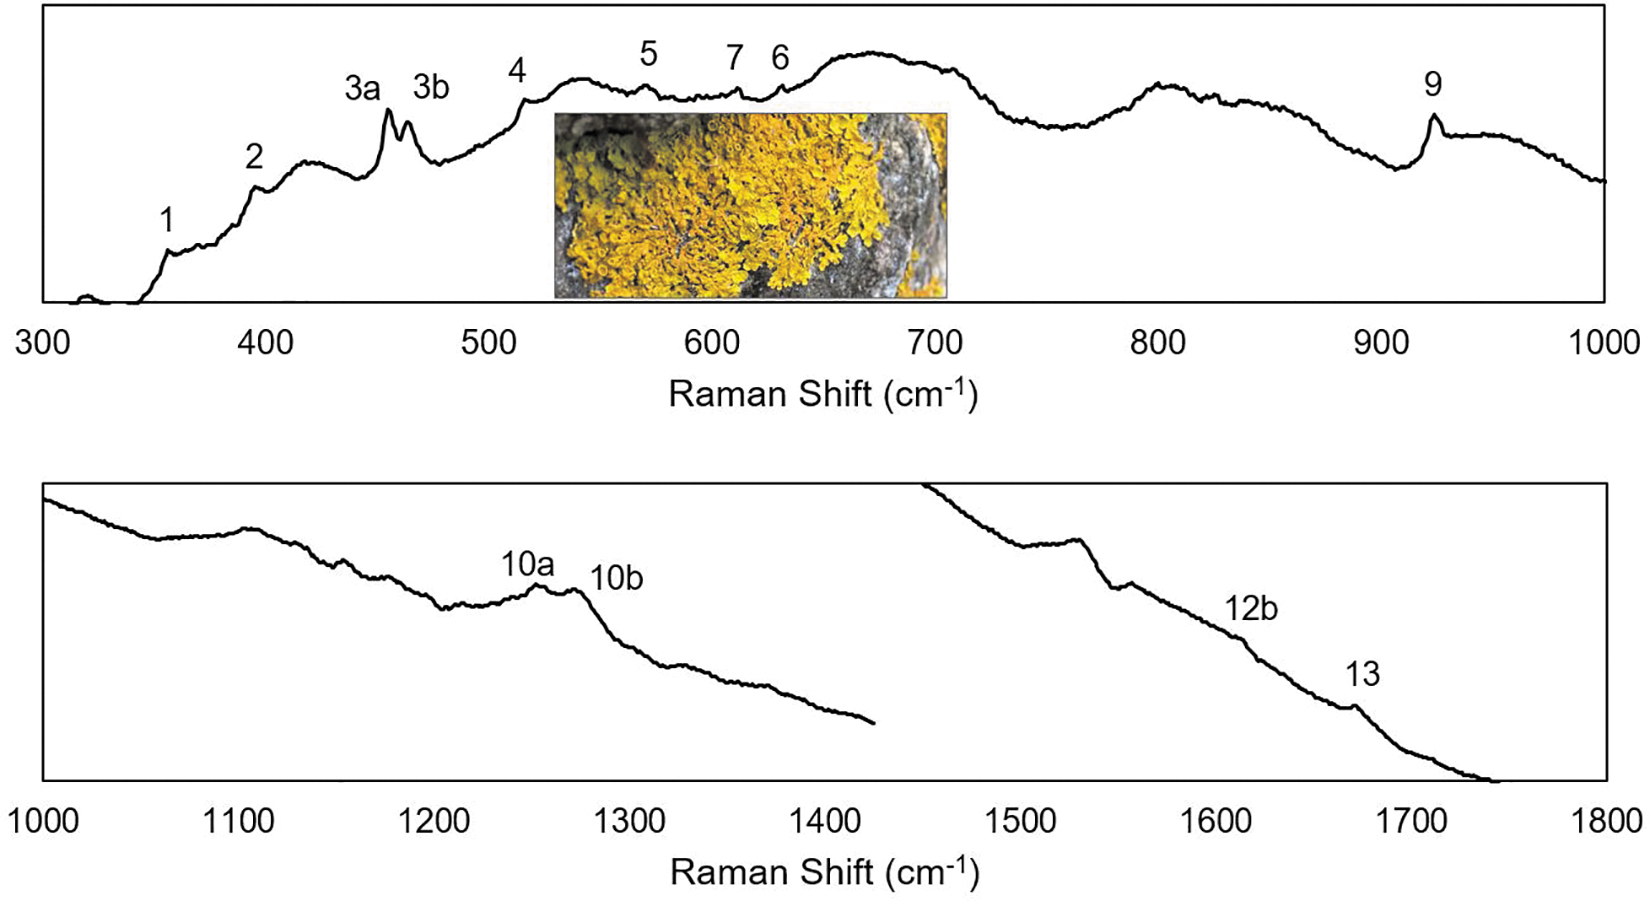
The Raman spectrum of Xanthoria parietina with the parietin modes labeled. The inset is an image of the lichen that produced this spectrum.
Sequential spectra were recorded at the same location with increasing power. There were no spectral variations, which indicate a lack of degradation due to the laser. Modes 1–7, 9, 10ab, 12b, and 13 are clearly detected, as expected due to the high concentration of parietin on the thallus surface. Different locations on the surface and other samples collected from nearby locations yield similar results. The close match between the lichen spectrum and Figs. 4 and 8 indicate a high concentration of parietin with the C3 methoxy group positioned in a similar manner to the powder sample, which is consistent with the crystalline nature of parietin on the thallus (Goga et al., 2018).
4. Discussion
These results on the Raman active vibrational modes of a family of dihydroxyanthraquinones suggest the utility of TDDFT calculations for interpreting Raman spectra in astrobiology. First, the calculations reveal the actual molecular motions that make up each peak. In this study, we see that fused ring vibrations yield several strong peaks at frequencies below the common functional group vibrations, which is a possible advantage of this structural motif as a specific Raman biosignature. Second, common vibrations among the dihydroxyanthraquinones were identified. Patterns of common vibration modes could be used to detect a class of molecules even if the exact structure is not known. For example, the calculations confirmed that the position of mode 9 could be used to infer the molecular weight of the functional groups on the dihydroxyanthraquinone structure.
Third, and perhaps most significant, TDDFT calculations can be performed on hypothetical molecules of astrobiological interest. Most of the Raman modes discussed in this report were already known to exist because the three dihydroxyanthraquinones studied are available as purified powders. However, decomposition products of biomolecules that may serve as evidence of past life are usually not available in purified form for Raman characterization (Marshall et al., 2010; Goga et al., 2018). However, the Raman spectra of molecular structures predicted to remain after the thermal degradation of organic matter could be calculated by TDDFT.
In reality, the instruments on Perseverance and other rovers are not likely to encounter high-density, uniform organic matter as found on X. parietina in Fig. 9. In addition to thermal degradation, the organic matter would likely be embedded in a mineral substrate, which also contributes to Raman spectra (Culka et al., 2019). However, TDDFT calculations have been used to calculate properties and spectra of mineral structures with embedded organics, such as metal-organic frameworks (Hadjiivanov et al., 2021). Similar calculations could be useful on composite mineral-organic structures of astrobiological interest. TDDFT calculations could describe the chemical bonds as well as the effect on the spectral position and intensities of Raman peaks. Such calculations could help guide instrument design as well as spectral interpretation.
The experiments and calculations reported in this study are all for near-IR (785 nm) excitation, which reduces fluorescence background. However, for planetary missions, visible and UV excitation have been chosen for the increased scattering signals, increased detector sensitivity, and potential for resonance Raman enhancement (Rull et al., 2017; Razzell Hollis et al., 2020; Bhartia et al., 2021). The TDDFT calculations described in this study can be carried out at these excitation frequencies. Resonance Raman enhancements can also be included by calculating the excitation spectrum of a molecule, and then the electronic polarizability both on and off resonance with an estimated excited state lifetime (Jensen and Schatz, 2006). Given these capabilities, TDDFT calculated spectra should be able to contribute to instrument design and spectral analysis of both mission data and analog sites on Earth.
Footnotes
Author Disclosure Statement
No competing financial interests exist.
Funding Information
The authors gratefully acknowledge funding from the National Science Foundation, award number 1709084.
Abbreviation Used
Associate Editor: Michael C. Storrie-Lombardi