
Abstract
The Mars Multispectral Imager for Subsurface Studies (Ma_MISS) instrument is a miniaturized visible and near-infrared spectrometer that is integrated into the drilling system of the ESA Rosalind Franklin rover, which is devoted to subsurface exploration on Mars. Ma_MISS will acquire spectral data on the Martian subsurface from excavated borehole walls. The spectral data collected by Ma_MISS on unexposed rocks will be crucial for determination of the composition of subsurface rocks and optical and physical properties of materials (i.e., grain size). Ma_MISS will further contribute to a reconstruction of the stratigraphic column and acquire data on subsurface geological processes. Ma_MISS data may also inform with regard to the presence of potential biomarkers in the subsurface, given the presence of organic matter that may affect some spectral parameters. In this framework, we performed a wide range of measurements using the laboratory model of the Ma_MISS to investigate mineral/organic mixtures in different proportions. We prepared mixtures by combining kaolinite and nontronite with glycine, asphaltite, polyoxymethylene, and benzoic acid. These organic compounds show different spectral characteristics in the visible and near-infrared; therefore their presence can be detected by the Ma_MISS instrument. Our results indicate that the Ma_MISS instrument can detect organic material down to abundances of around 1 wt %. In particular, the data collected on low-concentration mixtures show that, by analyzing sediments with a grain size smaller than the Ma_MISS spatial resolution, the instrument can still discern those points where organic matter is present from points with exclusive mineral composition. The results also show that a collection of multiple contiguous measurements on a hypothetical borehole wall could help indicate the presence of organic matter in clay-rich soils if present.
Introduction
The search for life on Mars has driven intensive studies of the planet, including the investigation of possible organic molecules on recent Mars exploration missions. The Rosalind Franklin rover mission (formerly known as ExoMars, Vago et al., 2017) will target an ancient location (Oxia Planum) with strong potential for past habitability, where preservation of physical and chemical biosignatures and abiotic/prebiotic organics may have occurred. The Rosalind Franklin mission will deliver a lander that is focused on atmospheric and geophysical investigations and a rover with instruments devoted to the search for signs of extinct life. The innovative element characterizing the Rosalind Franklin rover is its drill, which is capable of collecting samples from outcrops and depths down to 2 m. The drill also includes a miniaturized spectrometer—Mars Multispectral Imager for Subsurface Studies (Ma_MISS)—that will collect data on subsurface mineralogy. This subsurface analysis capability will provide the best opportunity to access chemical biosignatures given that they are preserved within the harshest of surface environments. Continued exposure of the Martian surface to cosmic rays and solar energetic particles over geologic exposure times has damaged possible biomarkers in the uppermost surface layers; thus it is necessary to analyze the subsurface below the radiation-bathed zone. Obtaining and analyzing samples from subsurface layers is, therefore, a primary goal of the Rosalind Franklin rover mission, which has an analytical laboratory focused on the search for organics and biosignatures. However, collected samples will be crushed and pulverized for such analysis, and their stratigraphic context and pristine texture will be compromised. For this reason, it is important to characterize the signatures of organics that occur with other minerals present in the subsurface along with the stratigraphy and composition of the Oxia Planum subsurface. Ma_MISS is the only instrument on board the rover that can acquire this critical information.
Recent robotic exploration of Martian sedimentary rocks and laboratory analyses of Martian meteorites have both reported indigenous organic components. NASA's Mars Science Laboratory, Curiosity, discovered different organic materials from ∼3.5 Ga mudstones in Gale crater (Eigenbrode et al., 2018). The Curiosity results suggest that organics from different sources are widely distributed within Martian rock, and the detection of organic matter at the Martian surface, where ionizing and oxidizing conditions are extreme, suggests better-preserved organic records may be present at depth (Eigenbrode et al., 2018).
The landing site of the Rosalind Franklin rover mission, Oxia Planum, has been selected due to its high potential for preserving organic material and an abundance of phyllosilicates. Biosignature preservation is expected within mineral matrices that are likely to have shielded them over time from the harsh surface conditions on Mars. Clay minerals are particularly interesting in this regard because they are known to effectively contribute to the preservation of organic compounds over geological time scales. Specific clays are more efficient in hosting and preserving organic materials than others. On Earth, smectites (expandable clays) are the major reservoirs of carbon in subaqueous marine sediments, and their capacity to preserve organic molecules under simulated Martian environmental conditions has been demonstrated (Poch et al., 2014; dos Santos et al., 2016; Fornaro et al., 2018).
Oxia, which is situated at the Martian dichotomy boundary, is part of a wide basin characterized by the extensive presence of Noachian Fe/Mg-rich phyllosilicates (Quantin-Nataf et al., 2021). The presence of phyllosilicates has been inferred by using mainly data from the Compact Reconnaissance Imaging Spectrometer for Mars (CRISM and OMEGA, Murchie et al., 2007; Mustard et al., 2008 Carter et al., 2013), while the geology and morphology of the site has been studied primarily with the High-Resolution Imaging Science Experiment (HiRISE, McEwen et al., 2007) and the Colour and Stereo Surface Imaging System (CaSSIS, Thomas et al., 2017) on board ESA's Trace Gas Orbiter.
The data sets obtained have facilitated the characterization of the morphological and spectral variability of Oxia Planum's surface (Mandon et al., 2021; Brossier et al., 2022). The main feature of the Oxia Planum site is the existence of an extensive layered and fractured unit, which has been identified as rich in clay that is potentially of sedimentary origin (Carter et al., 2016; Quantin-Nataf et al., 2021). The region is characterized by the presence of an ancient delta, belonging to the fluvial system of Coogoon Valles. The delta lies on top of the clay-bearing unit in the eastern part of the landing area (Fig. 1; Molina et al., 2017; Quantin-Nataf et al., 2021).

The geographic context of Oxia Planum and the Rosalind Franklin landing site. MRO/CTX grayscale mosaic shows the morphologic context and TGO/CaSSIS the compositional diversity within the landing ellipse (see Fawdon et al., 2021).
Moreover, there is a dark-resistant unit, which caps the clay-bearing unit at various locations in the landing area. Observations suggest that this dark unit was likely formed by lava flows, but an alternative explanation is late fluvial processes (Quantin-Nataf et al., 2021). In addition, an extensive mantling deposit covers the clay-bearing unit and the deltaic deposits (Quantin-Nataf et al., 2021).
CRISM data of the clay-bearing unit of the Oxia Planum area exhibit absorptions at 1.41 μm (attributed to O-H), 1.92 μm (attributed to H2O bond), 2.30 μm, and 2.40 μm (weak band) (Carter et al., 2016). These last two features have been attributed to the presence of Fe-OH and Mg-OH bonds. The overall shape and position of the bands can be consistent with the clays bearing Fe/Mg (Carter et al., 2016). Vermiculite and Fe-bearing saponite seem to be the best matches with the spectra (Carter et al., 2016) even if there are differences with Earth samples. More recent and detailed analyses of the CRISM data indicate that the clay-rich outcrops in the mission landing site area are likely either Fe-bearing saponites (e.g., griffithite) or vermiculite (Brossier et al., 2022), given the position of the band minima at 1.4, 2.3, and 2.4 μm. In addition, the search for carbonate when using different spectral parameters suggests the presence of a small amount of carbonates that likely coexists with the clay outcrops (Brossier et al., 2022).
Some of the spectra of the clay-bearing unit show a large and broad absorption between 1 and 1.8 μm, in addition to the narrow absorptions at 1.4, 1.92, and 2.30 μm. This broadband is likely associated with the presence of olivine mixed with clays. The characteristics of this absorption suggest that the band is due to either fayalite or large grains of forsterite (Mandon et al., 2021). In some specific places, beneath the deltaic deposits, extremely weak signatures of phyllosilicate are associated with the olivine band.
Some minerals, like hydrated silica and Al-rich phyllosilicates, may be present to a lesser extent in the eastern sector of the site (Carter et al., 2016), where Hesperian alluvial and deltaic sediments overlap the Fe/Mg-rich phyllosilicates. However, no Al-rich clays have been detected in the CRISM cubes over Oxia Planum (Mandon et al., 2021; Brossier et al., 2022), although an absorption near 2.2 μm has been sporadically reported on the southeast ridge outside of Oxia Planum (Carter et al., 2016; Riu et al., 2022). Al-clays are found within Oxia's catchment area (16.7°N, 337°E), suggesting the presence of diverse clay mineralogies (Turner et al., 2021; Brossier et al., 2022). These Al-rich clays lie on top of large exposures of Fe/Mg-rich clays with features typical of nontronites. Thus, we can expect that small amounts of different clays, identified within the catchment area, are also present at the Oxia landing site.
The mineralogical analysis of Oxia suggests the presence of a standing body of water over the entire landing site area, just after the formation of the clay-rich unit. Two main scenarios for the emplacement mechanism of the clay-bearing unit parent deposit have been proposed (Carter et al., 2016; Quantin-Nataf et al., 2021): (1) subaqueous with sediments deposited in a lacustrine or marine environment); (2) subaerial/surficial with deposits of volcanic (lava), airborne volcaniclastics, impactoclastic, or other aeolian deposits. In this last case, groundwater alteration or pedogenesis is the most likely scenario for the formation of the Fe/Mg-rich clay minerals observed in the site (Carter et al., 2016).
The mineralogy of the area, coupled with other morphological aspects, suggests that Oxia Planum was affected by long-duration aqueous surficial activity.
In this framework, we prepared 24 different mixtures between clays and organics using kaolinite and nontronite as proxies of the two clay compositions identified at Oxia Planum (e.g., Fe/Mg and Al-clays; Carter et al., 2016; Mandon et al., 2021; Riu et al., 2022). These clays were intimately mixed with four organic compounds that were principally selected for their spectral features when measured in the visible and near-infrared (VIS-NIR) range. We performed several spectroscopic measurements on these mixtures to characterize the scientific performance of the Ma_MISS instrument and its organics detection capabilities.
Specifically, we were interested in testing whether and how Ma_MISS can detect spectral organic signatures when mixed with phyllosilicates, the latter being the dominant phase at Oxia Planum. For this purpose, we measured these mixtures with variable abundances of the organic components and analyzed the data using the Origin Pro software. Since this work aimed at evaluating the detection limit of the Ma_MISS instrument, a set of mixtures was made with low organic content mixtures (i.e., 1 wt %). This required analyzing continuum-removed spectra to better appreciate how the presence of low content of organics can affect the spectra of the clays in the VIS-NIR range.
Measurements setup and data treatment
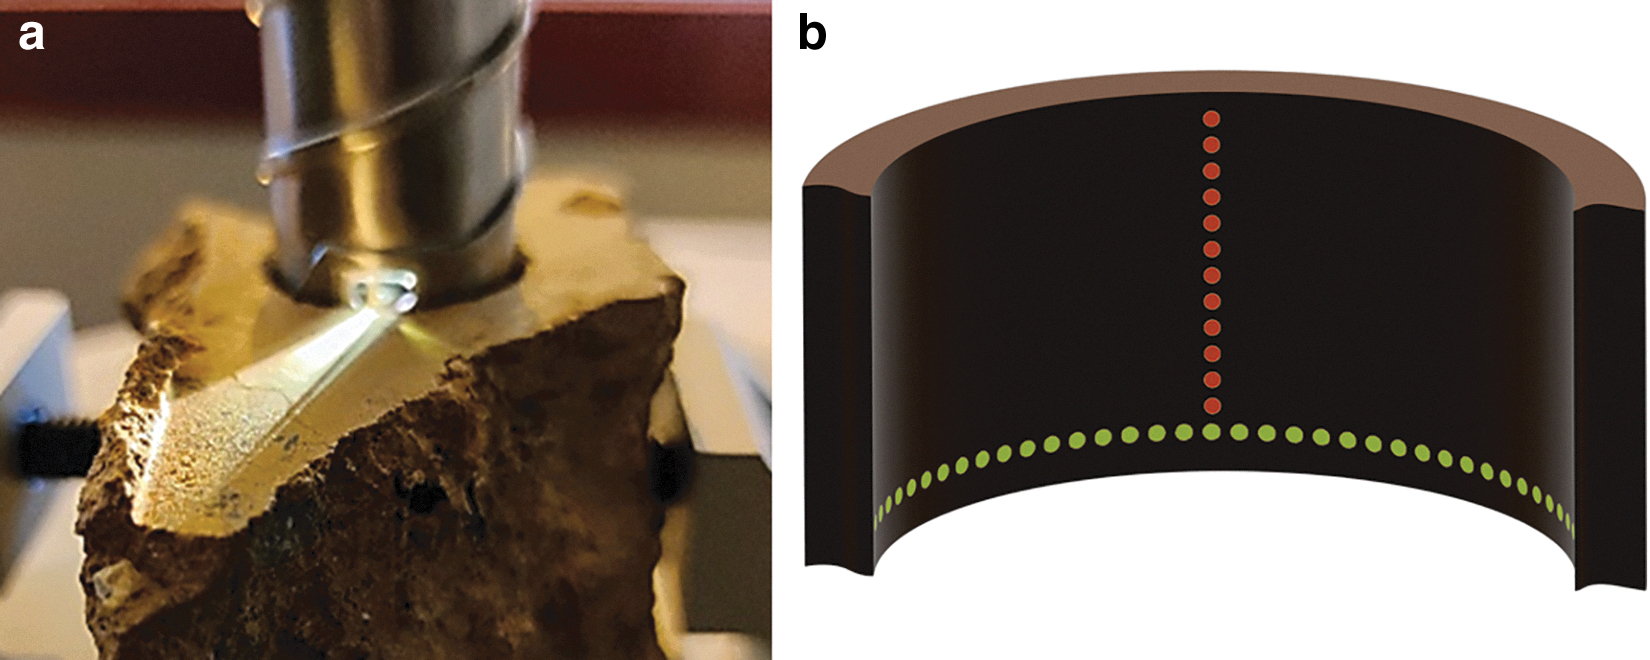
Ma_MISS is the VIS-NIR miniaturized spectrometer hosted in the drill system (Fig. 2a) of the Rosalind Franklin rover that will characterize the mineralogy and stratigraphy of the excavated borehole wall at different depths (<2 m). The technical characteristics and the operating principles of the instrument were described by De Sanctis et al. (2017, 2022). Ma_MISS will accomplish the following main scientific objectives: (1) determine the mineralogy of the subsurface materials; (2) map the distribution of hydrated phases and the subsurface H2O (if present); (3) characterize important optical and physical properties of the materials (e.g., grain size); (4) produce a stratigraphic column that will provide information on the subsurface geology. Ma_MISS will operate periodically during pauses in drilling activity and depending on the adopted scientific strategies. Using the vertical translation or the rotation of the drill shaft, Ma_MISS will perform “column” or “ring” acquisitions that will permit the reconstruction of the hyperspectral image of the drill's borehole (Fig. 2b).
(
The characterization of the scientific performances of the Ma_MISS instrument was made using the laboratory model (breadboard, De Angelis et al., 2014, 2015, 2017) at the Institute for Space Astrophysics and Planetology–INAF. The Ma_MISS breadboard (Fig. 3) includes (1) the 5 W integrated light source (LS) with the illumination fiber bundle; (2) the Optical Head (OH); (3) the Sapphire Window (SW); (4) the output optical fiber. The main difference between the flight model and the laboratory breadboard is that the last one does not include the spaceflight integrated spectrometer and is, therefore, coupled with a laboratory spectrometer ASD FieldSpec 4 (FS). The optical coupling between the Ma_MISS breadboard and the FieldSpec 4 is quite challenging. While the Ma_MISS output is a unique 120 μm diameter fiber, the FieldSpec 4 input fiber bundle contains 57 fibers, subdivided among the VIS, NIR, and SWIR detectors. To acquire a full-range spectrum (0.5–2.3 μm), firstly, we collect three different subrange spectra for each measured spot, and secondly, we reconstruct the full spectrum. This coupling procedure generates noise at the cut-on/cut-off of each detector; for this reason, the spectra that will be shown in this paper exhibit two cuts at 1–1.2 μm and near 1.8 μm. This does not occur with the Ma_MISS flight spectrometer, which collects the full-range spectrum in a single shot (De Sanctis et al., 2022). The laboratory sample is placed on a Sample Holder (SH), which allows a micrometric triaxial movement of the target along with the XYZ directions. The sample movement system synchronized with the spectra acquisition permits the simulation of columnar or ring acquisition that the Ma_MISS instrument will perform on the Martian subsurface. During this measurement campaign, the LabSphere Spectralon 99% reflectance standard was used as a reference target to determine the reflectance spectrum of the samples. All the spectra of the mixtures and the endmembers reported in this paper are the result of the average of 10 single spectra collected during the Ma_MISS scan in 10 different, though contiguous, positions on each sample. The raw data collected with the Ma_MISS breadboard, which uses the Fieldspec 4 as a detector, have a spectral sampling greater than that of the Ma_MISS flight instrument (i.e., 1.500 points between 0.4 and 2.3 μm). To make the laboratory collected data comparable with the data of the Ma_MISS flight, we resampled the data every 5 nm, obtaining 342 points between 0.4 and 2.3 μm. No additional treatments were made to the raw data. For a better evaluation of the spectral modification induced by the presence of organics in low amounts, a continuum-removed analysis was performed. The continuum removal procedure normalizes reflectance spectra to facilitate the evaluation of individual absorption features from a common baseline. We subtracted a baseline from each spectrum. The baseline was drawn using straight-line segments that connect local spectra maxima individually for each spectrum by selecting anchor points in the intervals where no absorption features were observed.
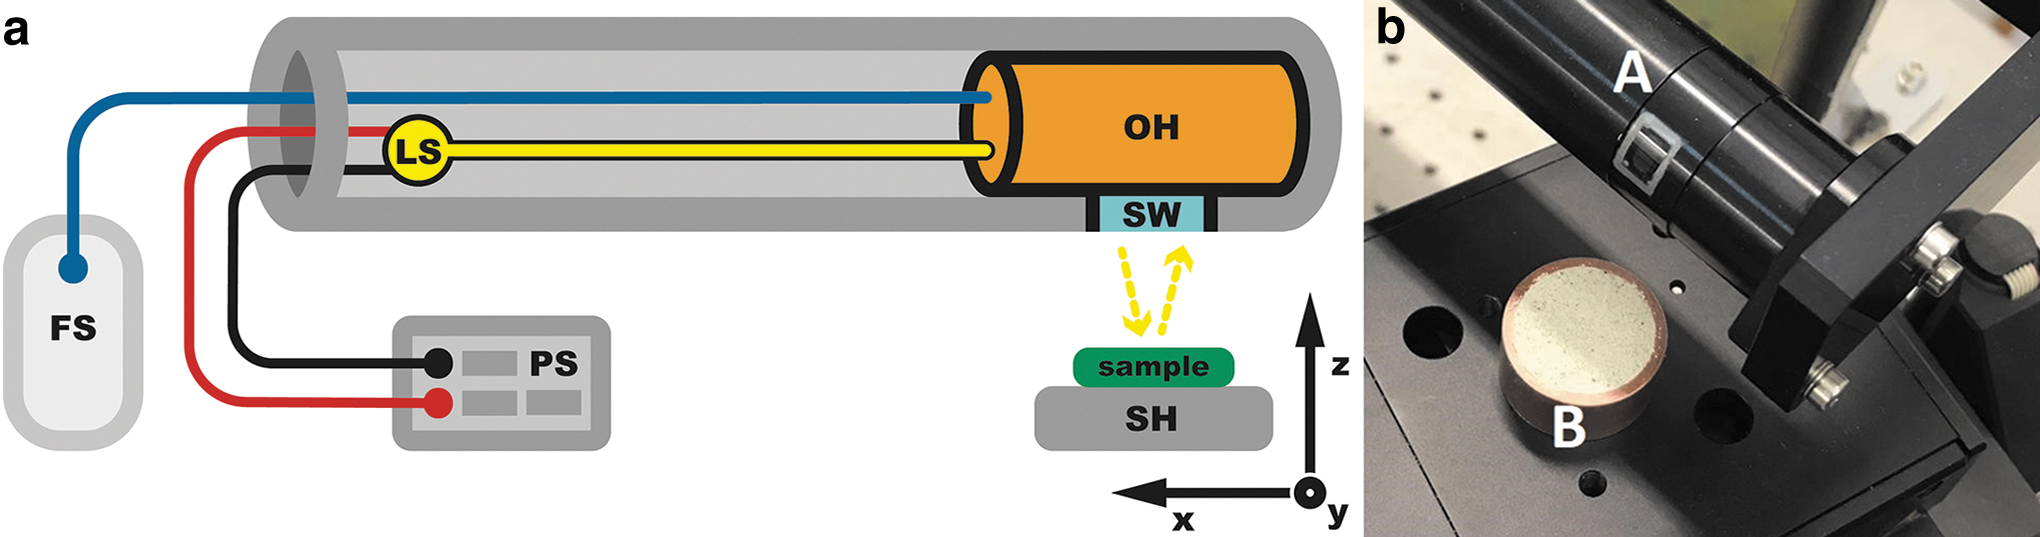
The Ma_MISS breadboard setup. (
Remote sensing measurements performed by OMEGA and CRISM suggest that the surface of Oxia Planum is characterized by the widespread presence of Fe/Mg phyllosilicates (Carter et al., 2016; Quantin-Nataf et al., 2021; Mandon et al., 2021). Al-bearing phyllosilicates, although detected only in the catchment (Brossier et al., 2022) at the remote sensing measurement scale, could be found in the upper layers of Fe/Mg-clays if observed at the scale of Ma_MISS. Hence, we selected a naturally occurring nontronite (NaU-1, Keeling, et al., 2000, source Clays Repository of the Clay Minerals Society) and commercially available kaolinite (Sigma-Aldrich) as proxies of Fe/Mg and Al-phyllosilicates, respectively. For this measurement campaign, we prepared numerous samples by mixing the two clay minerals with four different organic compounds (asphaltite, glycine, benzoic acid, and polyoxymethylene).
Asphaltite is a natural mixture of aromatic and aliphatic compounds (Strazzulla and Moroz, 2005), with a high molecular weight and a low degree of oxidation of the carbon atoms, while polyoxymethylene and organic acids are more oxidized. These organic compounds were chosen because they show different spectral features in the measurement range of the Ma_MISS instrument. In particular, except for asphaltite, the other three compounds show absorptions related to CH groups both at wavelengths where there are no absorptions of clays (1.6–1.7 μm) and at wavelengths where the characteristic bands of clays are present (2.2–2.3 μm). This choice was made to study the different effects that organics can introduce in the spectrum of clay minerals, both in the areas of the spectrum where absorptions are already present and where there are none. In contrast, the choice of asphaltite was made to study the effect of a possible featureless organic compound with low reflectance.
In any case, we do not expect to find these specific organics in the Martian subsurface except for the benzoic acid that was found in Mars's Bagnold dunes (Millan et al., 2022) and Cumberland (Freissinet et al., 2015) by Curiosity.
We tested two cases (high organic concentration and low organic concentration) starting from the pure clay endmembers. In the first case, we added separately asphaltite and glycine in weight percentages of 25, 50, and 75 wt %, producing six different samples with high organics concentrations. In the second case, we added separately benzoic acid and polyoxymethylene (POM) in weight percentages of 1%, 5%, and 10%, preparing a set of six samples at a low concentration of organics. The concentrations of organic materials used in the preparation of the mixtures are intently high compared to what we expect in the Martian subsoil to identify the signatures and detection limits. All the components (minerals and organics) of the mixtures were grounded in an agate mortar and sieved obtaining a grain size <60 μm. The mixture was made using the Micro-Balance Sartorius-Practum 124-1S and measured in standard PT conditions using the Ma_MISS breadboard setup collecting reflectance spectra in the range 0.4–2.3 μm.
Results
Analysis of the endmembers
Figure 4a shows the Ma_MISS breadboard spectra of the pure clay endmembers. Kaolinite (black spectrum, Fig. 4a) shows a high reflectance, and the OH stretch overtone absorption at 1.4 μm; in this case, the well-known doublet (Clark et al., 1990) is not recognizable due to the spectral sampling (>20 nm) of the Ma_MISS instrument. A small absorption band occurs near 1.9 μm due to the presence of water in the sample. The kaolinite spectrum is characterized by the presence of the Al-OH bend plus OH stretch combinations at 2.1–2.2 μm. In this case, the presence of the two minima of this band diagnostic for this aluminum phyllosilicate is appreciable in the collected spectrum.
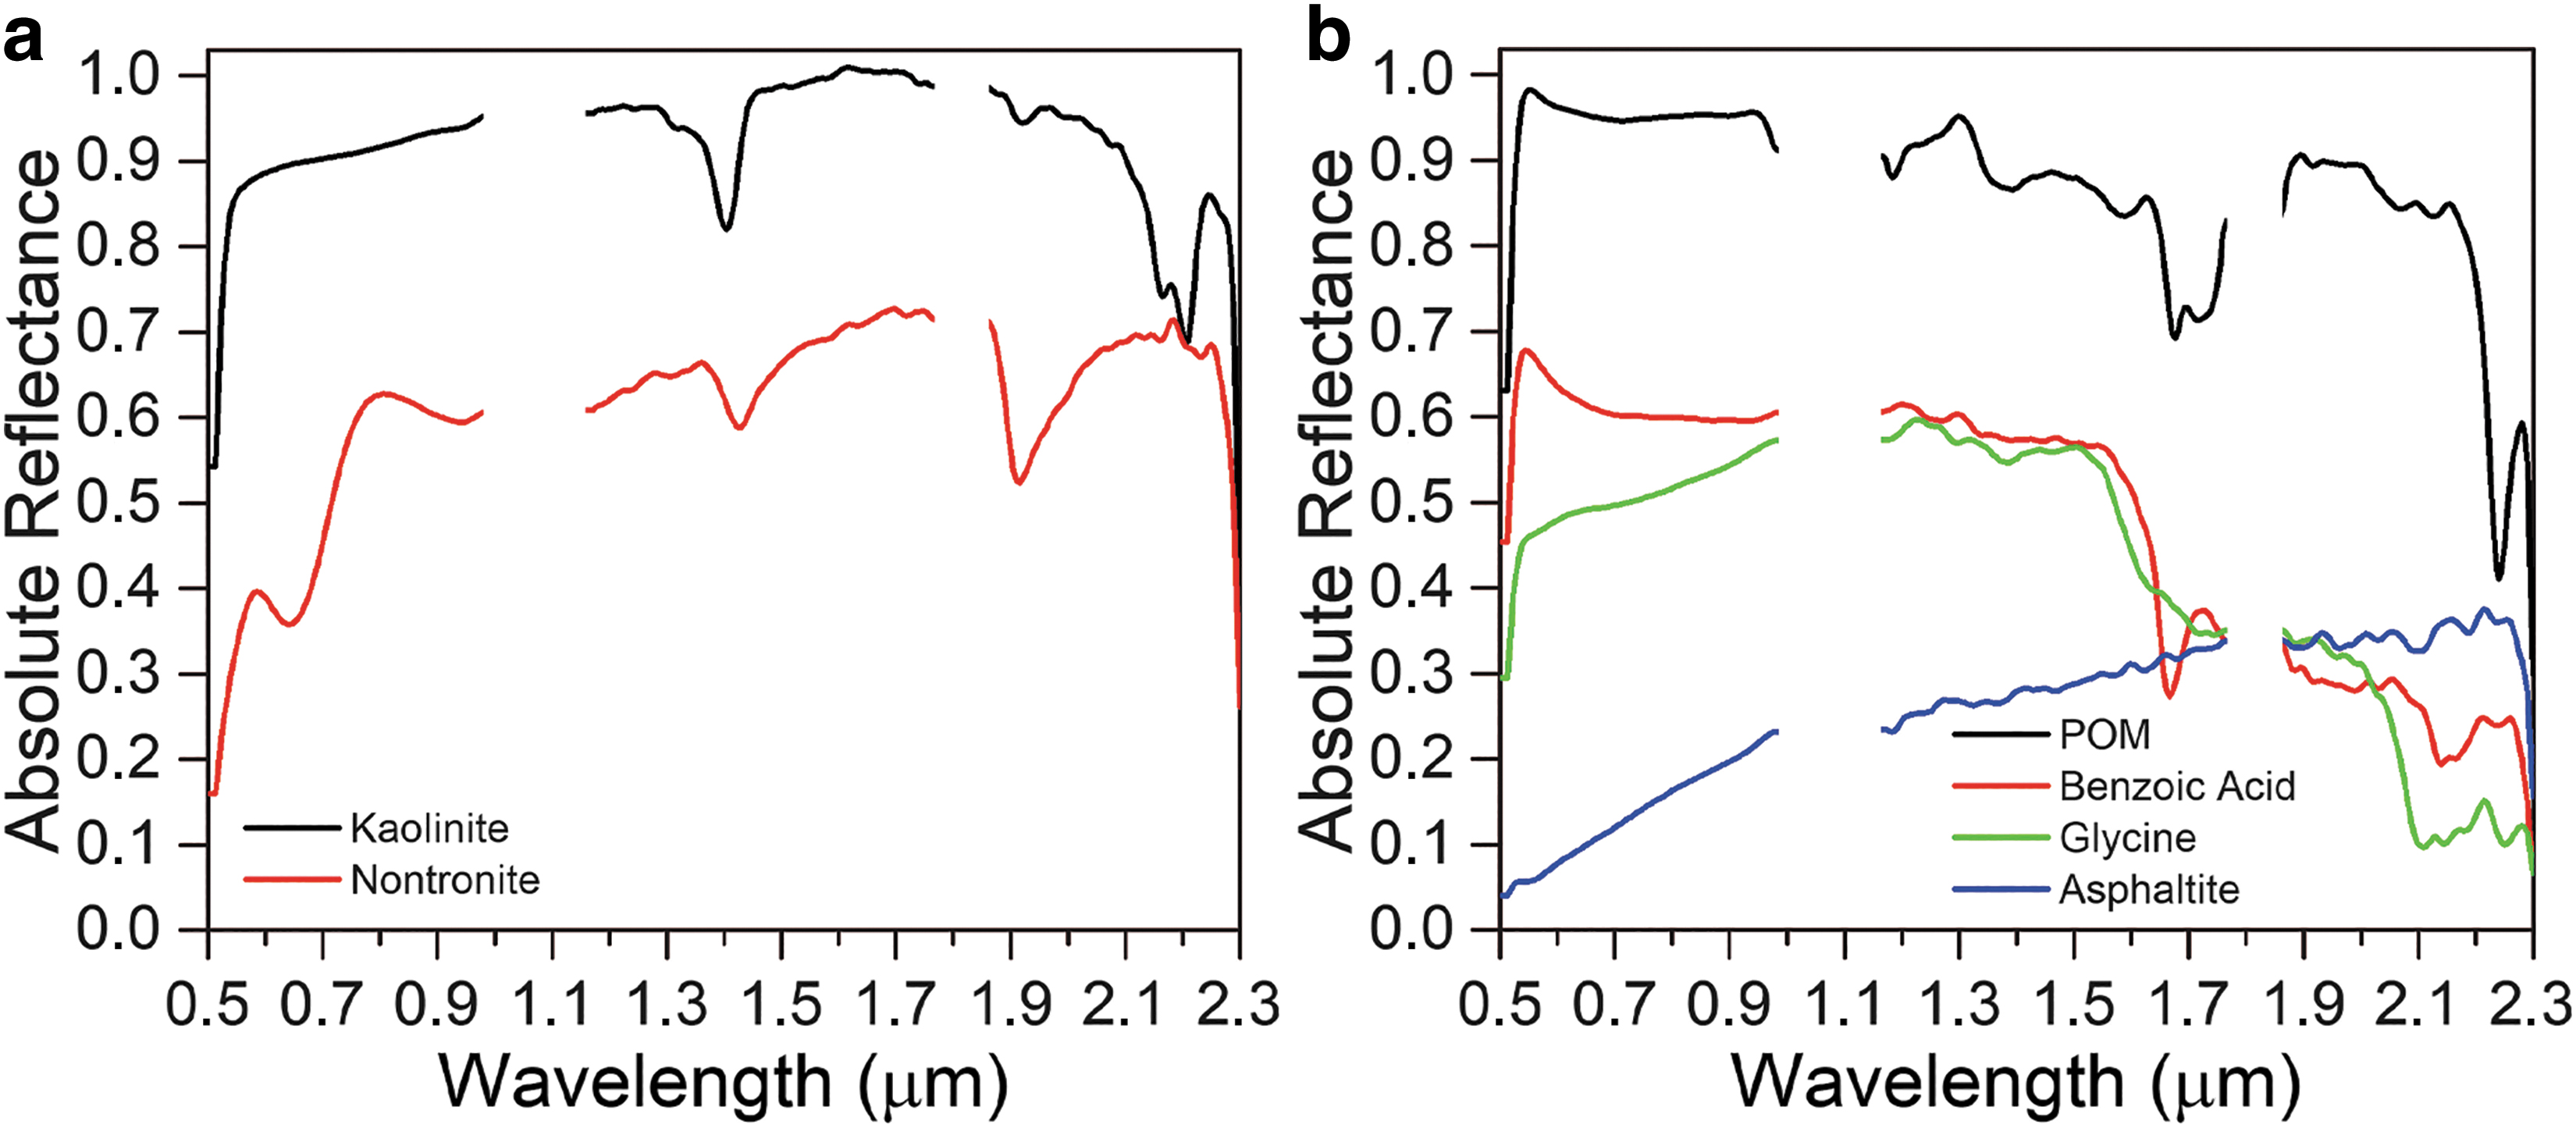
Ma_MISS breadboard measurements of the endmembers used to produce the mixtures: (
The spectrum of nontronite (red in Fig. 4a) shows a strong absorption near 0.65 μm and a shallower band at 0.9 μm characteristic of the Fe electronic transition in this smectite. Nontronite spectra exhibit an OH stretching overtone at 1.43 μm and an asymmetric H2O combination band centered at 1.91 μm and a Fe-OH combination band near 2.3 μm. This smectite also shows an absorption near 2.23 μm due to the presence of aluminum in its octahedral sites.
The used powdered organic compounds are glycine, benzoic acid, and POM, which were bought at Sigma-Aldrich. The asphaltite sample is a natural rock that comes from Seefeld, Austria. Figure 4b shows the spectra of the organic compounds used in the mixtures. The spectrum of asphaltite (blue in Fig. 4b) is almost featureless and shows a strong red slope between 0.5 and 1 μm as well as between 1 and 2.3 μm, but the IR slope is less steep. This compound is the darkest of those used in this experiment as evidenced by the low reflectance level in the visible part of the spectrum. The spectra of glycine (green in Fig. 4b) show a moderate red slope between 0.5 and 1 μm. This compound shows an absorption that starts near 1.6 μm for the first overtone of the CH group and becomes deeper between 2.1 and 2.3 μm where the CH-CH and CH-OH combination along with O-H, N-H, (N-H+C-H) combinations determine a deeper absorption feature (Workman, 1996). The spectral shape of benzoic acid is quite like that of glycine even if the former shows a narrower absorption band at 1.66 μm due to the CH first overtone. Also, the benzoic acid spectra show a broad absorption band between 1.7 and 2.2 μm due to the contribution of the CH-CH, CH-OH, and O-H combinations bands. The spectra of the POM (black in Fig. 4b) show the highest reflectance level across the spectra. This organic compound shows a band with two minima near 1.7 μm and a narrow and deep absorption band at 2.24 μm due to the combinations and overtones of the CH2/CH3 stretching bands.
The data collected on the mixtures between kaolinite and glycine are reported in Fig. 5a. Starting from the spectra of pure kaolinite (black spectrum, Fig. 4a) and increasing the content of glycine by steps of 25 wt % (from top to bottom in Fig. 4a), the band at 1.4 μm, associated with the presence of the OH bond in clays, decreases. At the same time, the band near 2.2 μm linked to the Al-OH bond in kaolinite becomes wider and much stronger due to the superimposition of the wider combination band of the C-H, C-C, C-O, CONH2(H), and RNH2 stretch vibration mode in glycine between 2.1 and 2.25 μm. By increasing the content of glycine, also a wide band near 1.7 μm becomes evident, even when the glycine content is still 25% due to the superimposition of the band of the first overtone of the C-H bond in glycine.

Ma_MISS breadboard measurements of variable proportions of mineral/organic mixtures: (
In the case of the nontronite-glycine mixture (Fig. 5b), the bands at 1.4 and 1.9 μm related to the presence of water in the clay decrease by increasing the glycine content. This also affects the band at 1.9 μm that is almost encompassed in the much larger band of the glycine at 1.6–1.9 μm. The strong glycine band at 2.1–2.25 μm becomes visible even when the glycine content is at the minimum (25 wt %, dark green spectrum in Fig. 5b). On the contrary, the bands linked to the presence of Fe3+ in nontronite near 0.9 μm and, principally, the one at 0.65 μm remain clear even when the glycine content is at 75 wt % (olive green spectrum in Fig. 5b).
The data collected on the mixtures between kaolinite and asphaltite are shown in Fig. 6a. In this case, we are mixing two compounds, one that is very bright and the other that is black and almost featureless, so the reflectance rapidly decreases with each addition of asphaltite to the mixture. However, this is not visible in the plot because the data are shifted to permit a clear band identification. By adding asphaltite to the mixture, the bands at 1.4 and 1.9 μm associated with the presence of the hydration in clays decrease. At the same time, the band linked to the Al-OH bond in kaolinite (2.1–2.2 μm) becomes less deep, and it becomes difficult to identify when the asphaltite content is at 50 wt % (orange spectrum in Fig. 6a). The addition of asphaltite strongly affects the overall slope, especially the visible range (0.5–1 μm) with a strong red slope. Also, in the case of nontronite (Fig. 6b), the bands at 1.4 and 1.9 μm rapidly decrease with the addition of asphaltite. In the visible part of the spectrum, the addition of very dark material to the mixture (asphaltite) causes the decrease of the bands linked to the iron content (at 0.9 and 0.65 μm) unlike what was previously seen in the case of the addition of bright organic compound, like glycine.

Ma_MISS breadboard measurements of variable proportion mineral/organic mixtures: (
In the case of the low-concentration mixtures, we present all the individual spectra acquired on each mixture (10 spectra collected on 10 contiguous points on the sample). The measurements made on the three kaolinite-benzoic acid mixtures at different concentrations are shown in Fig. 7a, 7b, and 7c. The band at 1.66 μm appears to have a variable depth from point to point in all three mixtures at different concentrations. For example, in the case of the mixture of kaolinite 90%–benzoic acid 10% (Fig. 7a), the band at 1.66 μm is shallow in the spectra collected in positions 4 and 6 and deep in positions 5 and 9. The same happens in the kaolinite 95%–benzoic acid 5% mixture (Fig. 7b) where the spectrum collected at position 4 shows a band that is deeper than those present in the spectra collected at positions 6 and 9 where the band at 1.66 μm seems to be absent. Even in the case of the mixture with lower organic content (kaolinite 99%–benzoic acid 1%, Fig. 7c), it can be seen that, from spectrum to spectrum, the band at 1.66 μm changes its depth. It is deeper in spectra 1, 2, 7, and 10 and missing at positions 4, 5, and 9. In this case, from the single spectra collected, it is difficult to appreciate the contribution of benzoic acid based on the 2.14 μm band, which is more appreciable in the average spectrum of the mixture (e.g., Fig. 9a).

Ma_MISS breadboard single-spot measurements of kaolinite (Kln)–benzoic acid (Bza) mixtures: (
The registered variability point to point of the organic bands is likely due to the nonhomogeneous mixture between clays and organics at the Ma_MISS spatial resolution: some areas (measured points) are richer in organics with respect to the others. This effect is also clear for the other mixtures measured and here reported.
All the spectra collected on the mixtures between nontronite and benzoic acid are shown in Fig. 8. In the case of nontronite 90%–benzoic acid 10% (Fig. 8a), the band at 1.66 μm is shallow in spectrum 2 and deep in spectra 3, 6, and 7. Even in the case of the nontronite 95%–benzoic acid 5% mixture (Fig. 8b), some spectra show a clear 1.66 μm absorption band (e.g., positions 1, 6, and 8) and others where the collected spectra seem to be acquired in the organic free portion of the sample (e.g., positions 3 and 9).

Ma_MISS breadboard single-spot measurements of nontronite (Ntn)–benzoic acid (Bza) mixtures: (
In the case of the nontronite 99%–benzoic acid 1% mixture (Fig. 8c), the collected data show a spectral diversity concerning the 1.66 μm band with the spectra of positions 6, 7, and 8 showing actual absorption in contraposition to the spectrum of position 1 showing no absorption at the same wavelength. In the case of the mixture with the nontronite, a direct correlation between the bands at 1.66 and 2.14 μm and the organic content is not shown in the single spot data. This is apparent only from the average data reported in Fig. 9b.
Ma_MISS breadboard measurements of variable proportion mineral/organic mixtures: (
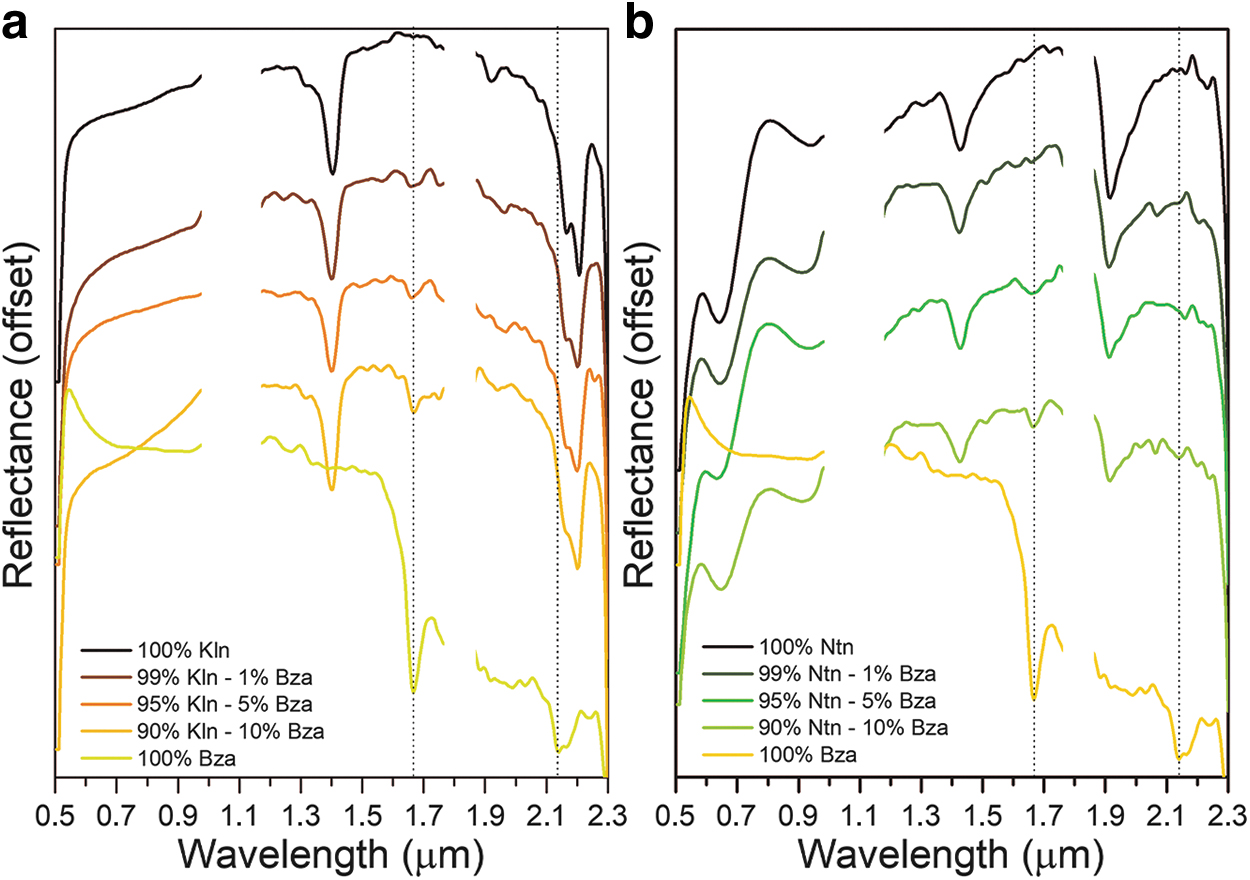
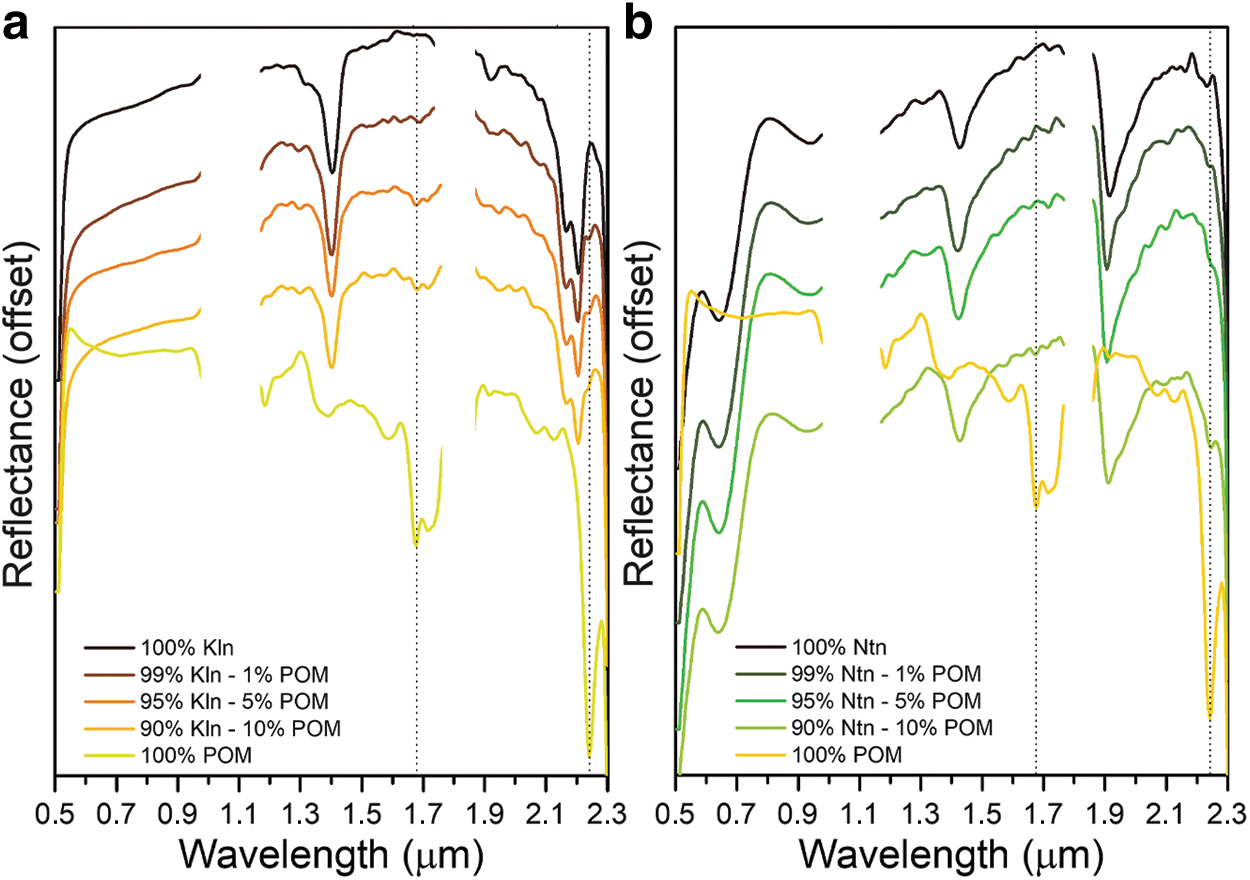
The average data collected on the low organics concentration mixture between kaolinite and benzoic acid are shown in Fig. 9a. Starting from the spectra of pure kaolinite (black spectrum, Fig. 9a) and increasing the content of the organic compound (from top to bottom in Fig. 6a), a band of the first C-H overtone close to 1.65 μm becomes evident already with a minimum quantity of benzoic acid (1 wt %, brown spectrum in Fig. 9a). The effect of adding benzoic acid to kaolinite is also evident with the appearance of a left shoulder on the Al-OH band at 2.1–2.2 μm. On the contrary, the band at 1.4 μm associated with the presence of the O-H bond in kaolinite does not seem to be affected by the addition of these small quantities of benzoic acid (<10 wt %) to the mixture. In the case of the mixtures with nontronite, the effect of adding benzoic acid is quite similar. Also, in this case, the C-H-related band near 1.66 μm is evident in the mixture with 1 wt % of benzoic acid (dark green spectrum in Fig. 9b). By increasing the benzoic acid percentage, the band near 2.1–2.2 μm becomes clear when the organic content is at least 5 wt % in the mixture. Where the concentration of the organic compound is less than 10 wt % all the typical spectral features of the nontronite are maintained (e.g., the Fe3+ related band at 0.9 and 0.65 μm and the hydration bands at 1.4 and 1.9 μm).
Figure 10 shows all the data collected on the individual spots of the three kaolinite-POM mixtures at different concentrations. Unlike what was seen previously in the benzoic acid mixtures, in the case of POM, the 2.24 μm band can also be considered because it is not encompassed in the 2.2 μm band of the Al-OH of the kaolinite.
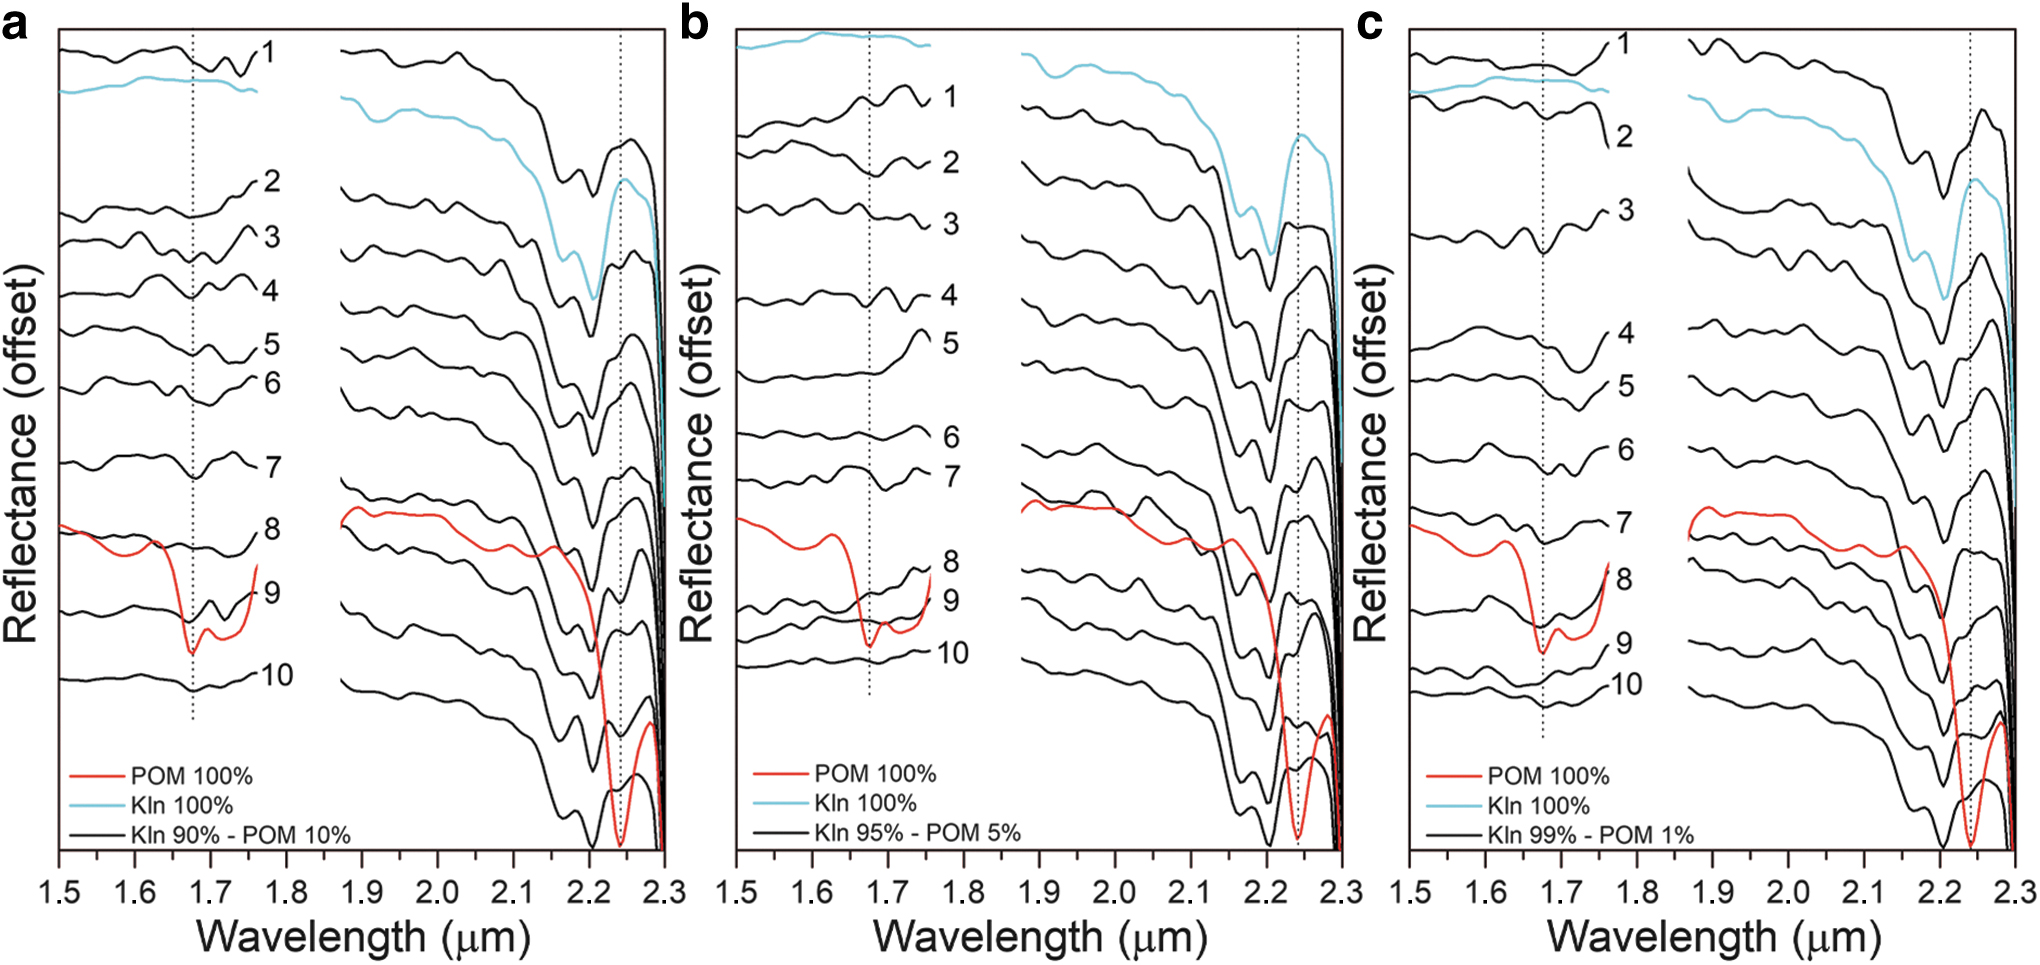
Ma_MISS breadboard single-spot measurements of kaolinite (Kln)–POM mixtures: (
In the case of the kaolinite 90%–POM 10% mixture (Fig. 10a), the spectra collected at positions 4, 7, and 9 appear to have strong absorption at 1.67 μm. However, all spectra collected on this mixture show strong absorption at 2.24 μm. This indicates that, at each surface position of the mixture, the Ma_MISS instrument was able to separate the spectral contribution of POM from that of kaolinite.
In the case of the kaolinite 95%–POM 5% mixture (Fig. 10b), if we refer to the band at 1.67 μm some positions seem to be unaffected by the presence of POM (e.g., positions 5, 9, 10), while the spectra collected in positions 2 and 4 seem to show a clear absorption band. On the contrary, all the spectra of this mixture seem to show weak absorption at 2.24 μm anyway. Even in the case of the mixture with the lower organic content (kaolinite 99%–POM 1%, Fig. 10c), if the band at 1.67 μm is considered it becomes difficult to determine which spectra have the band and which do not, except for the spectrum collected at position 3, which shows a distinguishable absorption band. In any case, all positions excluding position 6 show weak absorptions at 2.24 μm confirming the presence of POM in the mixture.
All the spectra collected on the mixtures between nontronite and POM are shown in Fig. 11. In these three cases, the collected spectra do not show a clear absorption at 1.67 μm. On the contrary, the absorption band at 2.24 μm is detectable in most of the spectra gathered on the three mixtures.
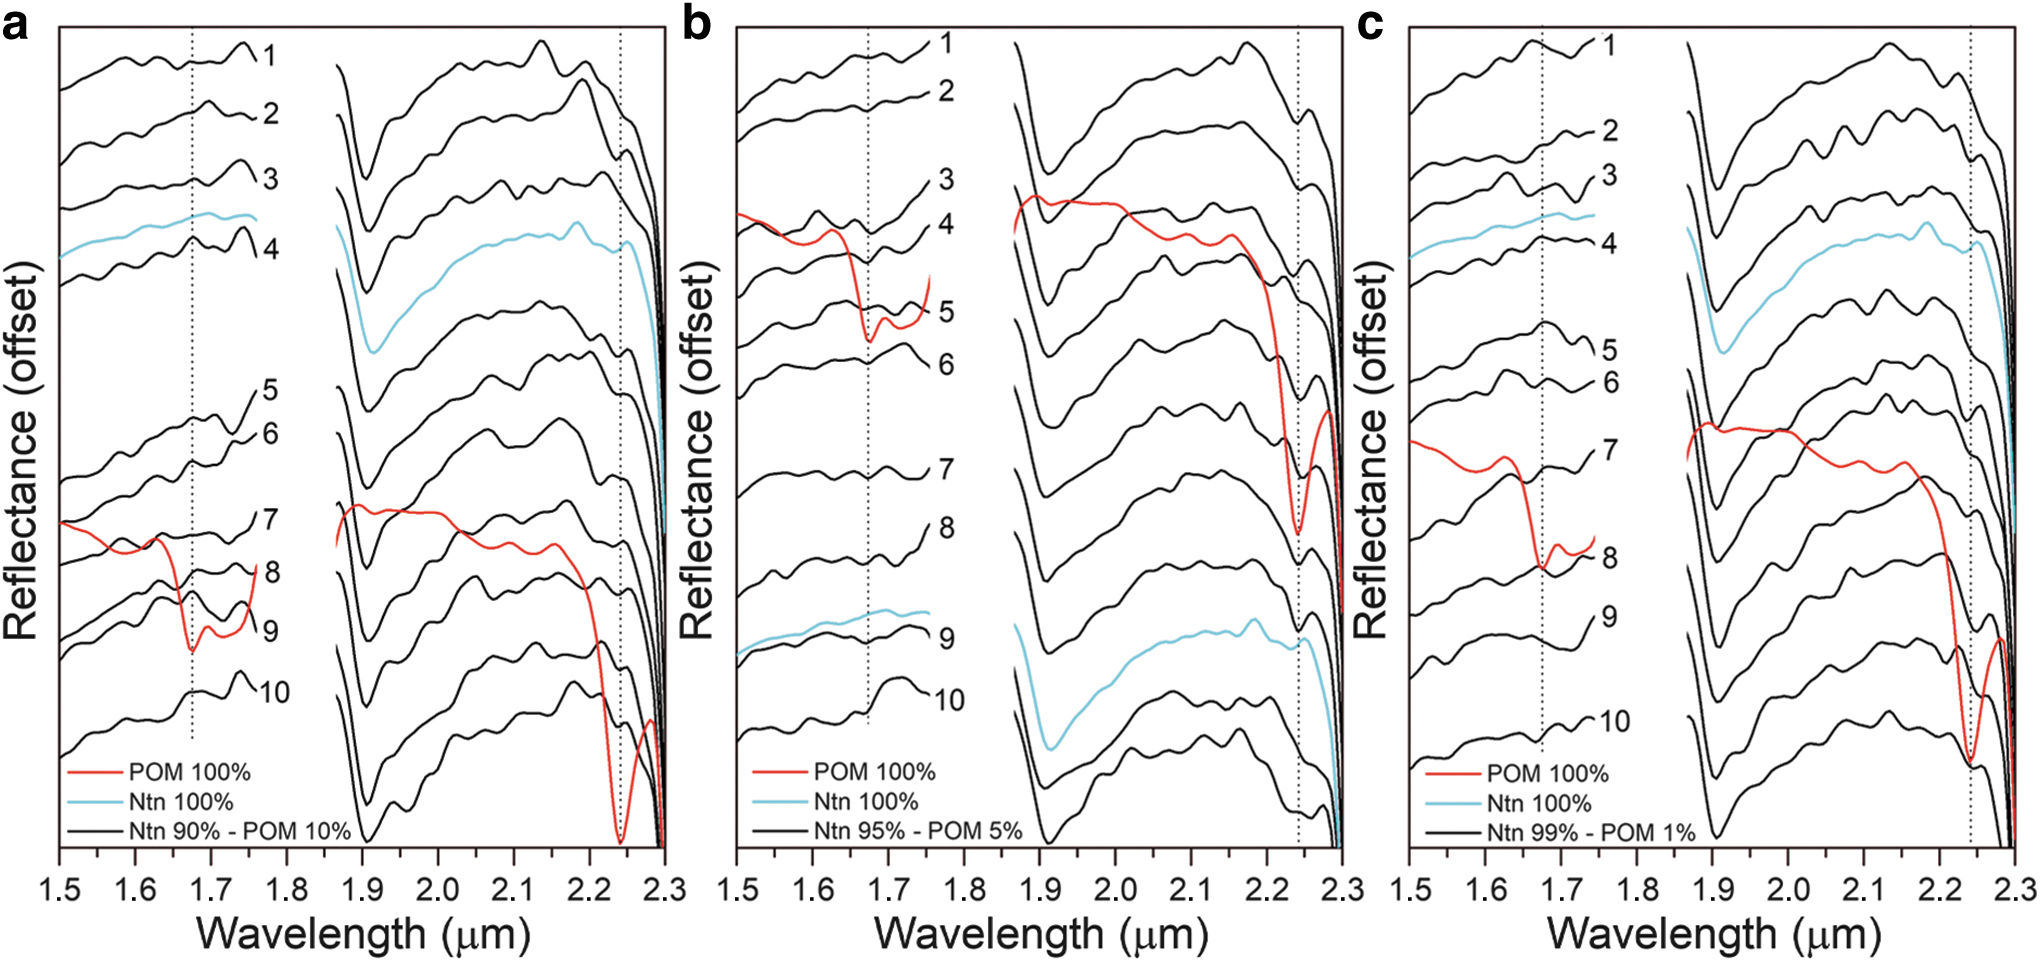
Ma_MISS breadboard single-spot measurements of nontronite (Ntn)–POM mixtures: (
Again, the measurements obtained on the individual spot do not allow for an assessment of the difference in organic content among the three mixtures; this can be appreciated by comparing the average data collected on the mixtures instead (Fig. 12b).
Ma_MISS breadboard measurements of variable proportion mineral/organic mixtures: (
The average data collected on the mixtures between kaolinite and POM or nontronite and POM are shown in Fig. 12. In the first case (kaolinite-POM, Fig. 12a), by increasing the content of POM, a band at 2.24 μm becomes evident already with 1 wt % of POM forming a right shoulder on the Al-OH band at 2.1–2.2 μm of the kaolinite.
Moreover, in this case, the effect of adding a minimal amount of a compound is more easily appreciated thanks to brighter hosting minerals. The effect of the addition of POM is more significant in kaolinite than in nontronite, even near 1.65 μm.
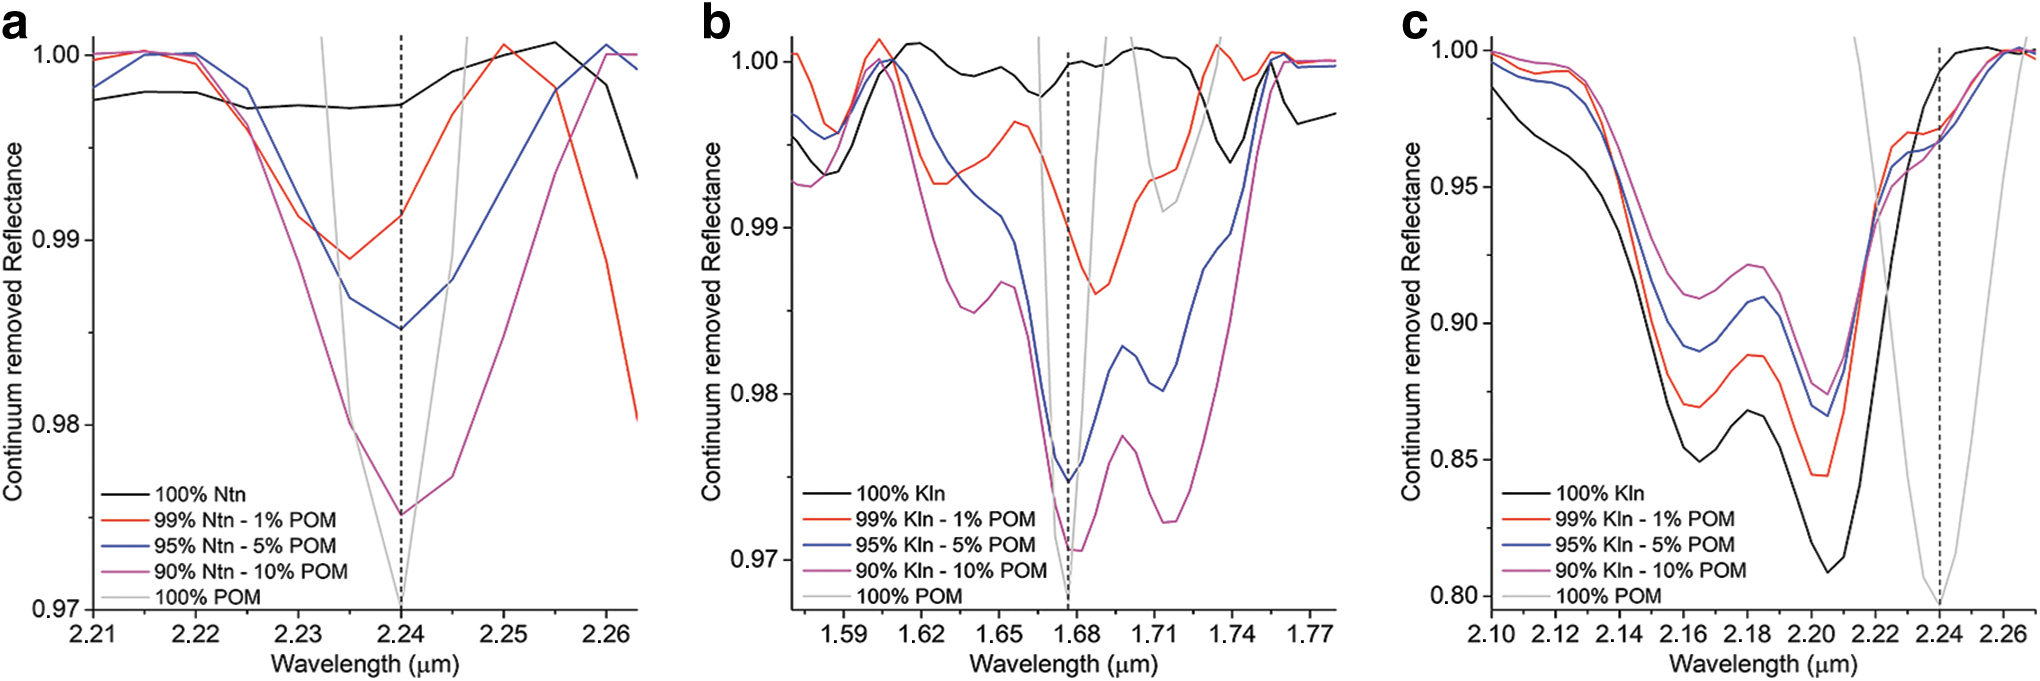
To better understand how low concentrations of organics affect the VIS-NIR spectra of clays measured by Ma_MISS, the following data are presented after the removal of the continuum. We focused on the analysis of the absorption bands of the organics in low-concentration mixtures. The band centers at 1.66 and 2.15 μm have been considered for samples containing benzoic acid and those at 1.67 and 2.24 μm for the mixtures with POM. An additional band occurring in the kaolinite-benzoic acid mixture near 2.14 μm is not considered because this benzoic acid feature is completely encompassed in the deeper 2.2 μm Al-OH band in kaolinite, which is also strongly affected by the water content in the clay minerals. The slight shift in band center position is linked to the laboratory breadboard setup and does not affect the Ma_MISS flight model. The calculated error in the band center position is ±5 nm, which corresponds to one sampling step of the Ma_MISS instrument. Figure 13 shows the continuum-removed spectra of the mixture between the two used clays and benzoic acid. In the case of kaolinite (Fig. 13a), the band near 1.66 μm tends to become deeper by increasing the organic content in the mixtures. This happens even if there is not a good correlation in the case of concentrations of 1% and 5% (red and blue spectra in Fig. 13a) where the band depth is comparable. In the case of the mixture with nontronite, the 1.66 μm band increases its depth by about 1% or 2% by increasing the quantity of the organics by 5% or 10%, respectively (Fig. 13b). In the case of the absorption near 2.15 μm (Fig. 13c), the band becomes deeper by increasing the benzoic acid content, but there is no difference between band depths where organic content is 5% or 10% (blue and magenta spectra in Fig. 13c).
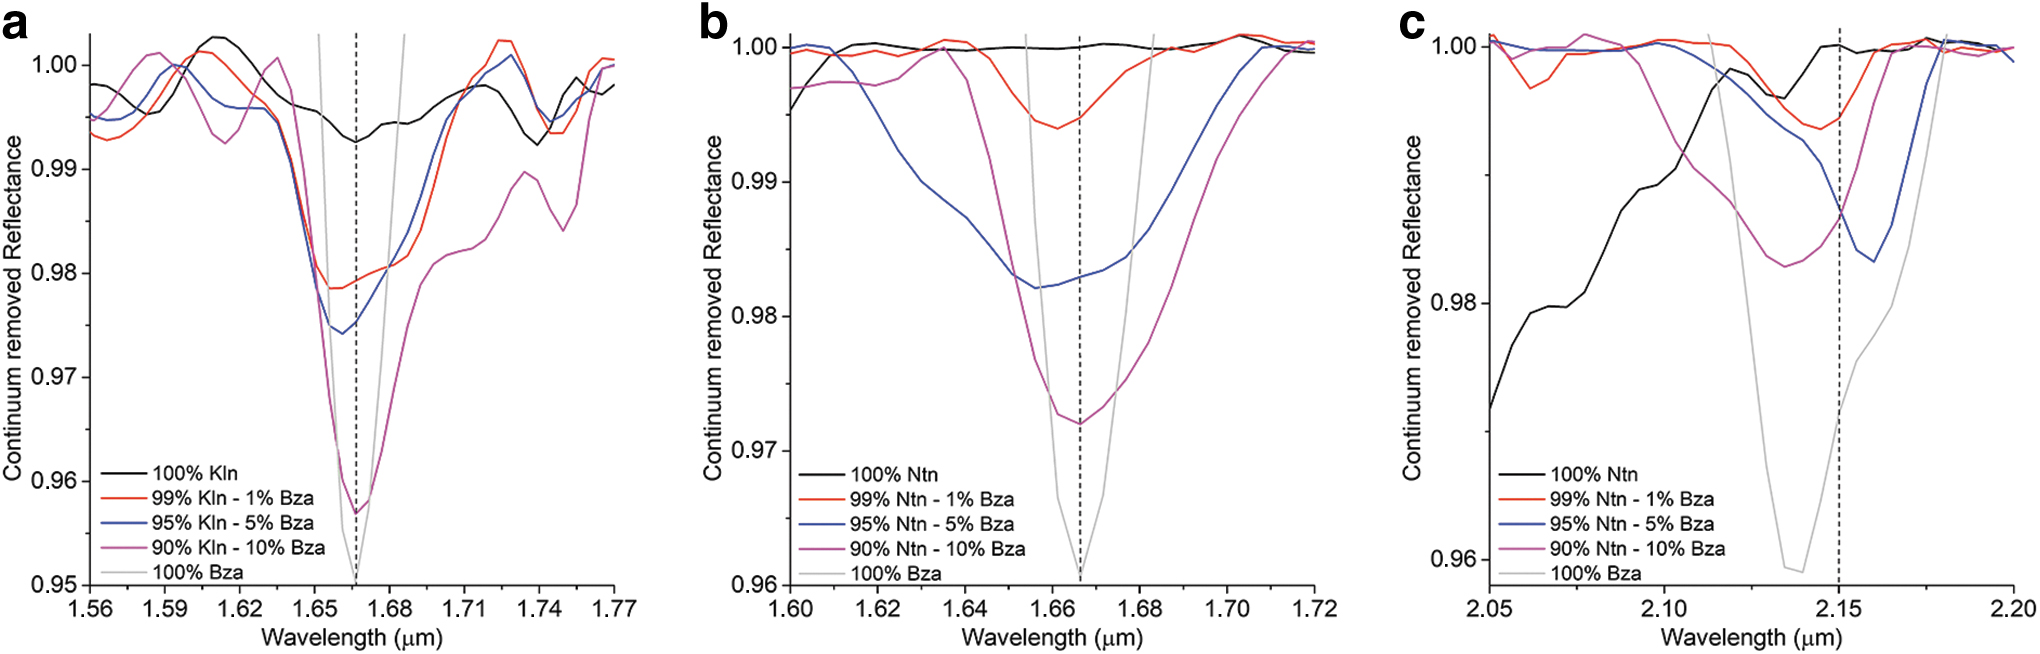
Continuum-removed spectra of the mixtures with benzoic acid: (
The case of the mixtures with POM is reported in Fig. 14. The increase of the POM in the mixture with the nontronite corresponds to the appearance and subsequent deepening of a band at 2.24 μm (Fig. 14a). In the mixtures with kaolinite, an absorption feature with two minima (1.68 and 1.72 μm) becomes evident and increases its depth at the increase of the weight percentage of POM in the mixture (Fig. 14b). In the case of the mixture between kaolinite and POM, the increase of the organic compound affects the right shoulder of the Al-OH band at 2.2 μm of kaolinite at the same time gradually decreasing its depth because of the increase of organic/clay ratio in the mixture (Fig. 14c).
Continuum-removed spectra of the mixtures with POM: (
In this work, we focus on mixtures between clays and organics both because it is proven that clay minerals can aid in the preservation of organics (Farmer and Des Marais, 1999) and because clays dominated the Oxia Planum mineralogy.
On Earth, the relationships between organic content and mineral surface area have been extensively studied and appear to be controlled by biological rather than abiotic processes. Clay mineralogy defines cation exchange capacity and mineral surface area, and natural differences occur between different types of clays and their affinities to form organo-mineral complexes. Clay-rich areas are favorable locations for organic compound preservation, and several pathways have been suggested to protect organic molecules through geologic time. Studies conducted on Earth soils have demonstrated that soils with higher clay content generally have higher total organic carbon (Broz, 2020). Clays are found to be extremely important in organics synthesis and preservation. When clays are present, the carbon chains are found to be longer during laboratory prebiotic peptide synthesizer (Paecht-Horowitz, 1974).
Different kinds of clays seem to have different effects on the catalysis of organics with some clays that are more efficient than others: kaolinite is a more efficient catalyst than montmorillonite to produce amino acids from organic-clays mixtures (Degens and Matheja, 1971; Shimoyama, 1981). Furthermore, studies on extraterrestrial materials demonstrate partial segregation of organic matter among specific minerals in heterogeneous meteorites. Moreover, several studies on primitive meteorites demonstrate that hydrated silicates are spatially closely associated with organic compounds with strong variations in organic concentrations over length scales of a few micrometers (Le Guillou and Brearley, 2014). Thus, it is expected to find pure phases at small length scales (Yesiltas et al., 2015). Thus, a survey of very small grains (few microns) should exhibit large deviations in organic abundances from none to heavy concentrations.
To correctly interpret the Ma_MISS data, extensive studies on the spectral characteristics of several rock slabs and mineral mixtures have been done in recent years (De Angelis et al., 2014, 2015) with the Ma_MISS laboratory breadboard. This shows that, when the components of solid rock or mineral powder mixture have dimensions comparable to or larger than the Ma_MISS spatial resolution (120 μm), the instrument can discern the single rock-forming minerals and the individual mixture components in the case of powdered samples. In this work, we tested the capabilities of the Ma_MISS instrument in detecting organic substances using fine-grained mixtures of clays-organics in different concentrations to determine the minimum threshold above which Ma_MISS could provide clues to the presence of organics in the Oxia Planum subsurface.
The data collected on high-concentration mixtures confirmed that the Ma_MISS range can be used in the characterization of organic-rich geological samples even though this range does not contain the fundamental absorptions linked to the carbon bonds. This spectral range was normally used in the determination of soil organic carbon (SOC) during spectroscopy measurement in situ on Earth (Bellon-Maurel and McBratney, 2011). The mixtures with a high concentration of organics used in this work represent the first test of Ma_MISS in the detection of organics. Considering the grain size of the mixtures (i.e., 60 μm) relative to the size of the Ma_MISS spot on the sample (i.e., 120 μm), the strategy of carrying out measurements on areal mixtures with a high concentration of organics was made to test the identification of organic domains within the mineral powder.
The data collected on low-concentration mixtures show that, by analyzing sediment with a grain size smaller than 60 μm (i.e., the maximum size of the mixture components used in this work, comparable to half of the Ma_MISS spatial resolution), the instrument can still discern spots in which there is organic matter from spots with an exclusive clay composition.
The same data show that a single-spot measure does not give certainty of the presence of organics, but a collection of several measures could indicate the presence of organic matter in clay-rich soils. Considering that the concentrations of organic matter used in this experiment are far higher than those expected to be found in the Martian subsurface, a consideration of the type and size of biosignatures that can be found follows.
On Mars, signs of past life may consist of objects, substances, or patterns that are undoubtfully created by life-forms. These can include small-scale structures and large-scale structures.
Among the small-scale structures, there could be cell molds and cell casts, but it is quite unlikely for single cells to be morphologically preserved in the 4.0 Ga Oxia Planum sediments. On Earth, rare, preserved examples show that, generally, these are individual cells too small to be individually detected by the Ma_MISS instrument (<1 μm; Westall et al., 2021). By increasing the biosignature size, these could be detected in the form of the carbonaceous remnants of cell colonies (several hundreds of microns in size; Westall et al., 2021), microfossils (<1 mm), microbially induced sedimentary structures (Noffke, 2009), and microbialite structures (e.g., stromatolites, Byerly et al., 1986). In these cases, single and noncontiguous acquisitions might prove inefficient in the strategy of detecting biosignatures in the Martian subsurface. On the contrary, high-resolution scans with spatially contiguous acquisitions will enable the chance to reconstruct spectral images of the excavated borehole wall (Ferrari et al., 2022) by providing, in addition to compositional information data, the textural that is in many cases essential in helping in the biosignatures recognition.
The high spatial resolution of the Ma_MISS instrument enables a detailed reconstruction of the mineral distribution in the subsurface. This instrument skill can be effective for detecting biosignatures in the form of chemical variations in the Martian subsurface. Indeed, it has been seen that the variation of the redox state of the mineral species at a very fine scale might be the signature of microbial metabolism in ancient environments (Lepot, 2020).
In any case, the submillimeter mineralogical information alone, which Ma_MISS will be able to provide, could still be extremely helpful in the detection of biosignatures. For example, the detection of iron-bearing minerals (e.g., pyrite, siderite) could represent favorable subsurface conditions for microbial colonization because of the high amount of energy released during redox reactions (Casar et al., 2020). Or, in other cases, the detection of clay minerals could be significant because these mineral phases have a propensity for organic matter accumulation and preservation of potential biosignatures (Bishop et al., 2013; Vago et al., 2017). However, to get the most accurate textural information about the Oxia Planum subsurface, Ma_MISS should acquire measurement points that are as contiguous as possible both along the circumference (i.e., ring images) and along with the vertical (i.e., column images) of the walls of the excavated hole.
Conclusion
Laboratory investigations have been performed using the Ma_MISS breadboard model (coupled with the ASD FieldSpec 4) on mineral/organic mixtures in different proportions. Spectroscopic measurements collected on these mineral/organic mixtures are useful to characterize Ma_MISS instrument sensitivity in detecting organic molecules intimately mixed with minerals that could be present in sedimentary sequences or hydrothermal products in the Martian subsurface, which is one of the main scientific objectives of the Rosalind Franklin rover mission. The obtained results show that the Ma_MISS instrument can give hints of the presence of organics in the Martian subsoil, as well as characterize the mineralogy of the drilling site. Moreover, the selected minerals and organic compounds allow us to test the instrument with both dark (e.g., nontronite) and bright (e.g., kaolinite) samples. The obtained results show that there are several spectral signature characteristics of the organics that are maintained when mixed with clays in different proportions. It is obvious that the larger the proportion of the organic material in the mixture the deeper and more easily recognizable the organic absorptions. Nevertheless, there are combinations of clays with organics in small percentages (<10%) that result in spectra where organic signatures are still discernible. The spectra obtained during these tests will allow us to enlarge the instrument spectral database, which will be useful for the interpretation of the scientific data.
Footnotes
Acknowledgments
The authors gratefully acknowledge the constructive comments and suggestions made by W. Goetz and the anonymous reviewer. We thank the European Space Agency (ESA) for the ExoMars Project, ROSCOSMOS and Thales Alenia Space for rover development, and the Italian Space Agency (ASI) for funding and fully supporting the Ma_MISS experiment (grant ASI-INAF n. 2017-48-H.0).
Portions of this paper were previously submitted as a poster presentation at the Europlant Science Congress (Virtual Meeting), held September 21–October 9, 2020.
Author Disclosure Statement
The authors declare no conflicts of interest.
Associate Editor: Victor Parro