
Abstract
Accurate interpretation of the martian sedimentary rock record—and by extension that planet's paleoenvironmental history and potential habitability—relies heavily on rover-based acquisition of textural and compositional data and researchers to properly interpret those data. However, the degree to which this type of remotely sensed information can be unambiguously resolved and accurately linked to geological processes in ancient sedimentary systems warrants further study. In this study, we characterize Mars-relevant siliciclastic–evaporite samples by traditional laboratory-based geological methods (thin section petrography, X-ray diffraction [XRD], backscattered electron imaging, microprobe chemical analyses) and remote sensing methods relevant to martian rover payloads (visible-near-mid infrared reflectance spectroscopy, X-ray fluorescence mapping, XRD). We assess each method's ability to resolve primary and secondary sedimentologic features necessary for the accurate interpretation of paleoenvironmental processes. While the most dominant textures and associated compositions (i.e., bedded gypsum evaporite) of the sample suite are readily identified by a combination of remote sensing techniques, equally important, although more subtle, components (i.e., interbedded windblown silt, meniscus cements) are not resolved unambiguously in bulk samples. However, rover-based techniques capable of coordinating spatially resolved compositional measurements with textural imaging reveal important features not readily detected using traditional assessments (i.e., subtle clay–organic associations, microscale diagenetic nodules). Our findings demonstrate the improved generational capacity of rovers to explore ancient sedimentary environments on Mars while also highlighting the complexities in extracting comprehensive paleoenvironmental information when limited to currently available rover-based techniques. Complete and accurate interpretation of ancient martian sedimentary environments, and by extension the habitability of those environments, likely requires sample return or in situ human exploration.
Plain Language Summary
Key Points
Mars-relevant samples are characterized using both traditional laboratory and microscale rover-based remote sensing techniques to assess each method's ability to recognize features necessary for accurate paleoenvironmental process interpretation.
While some key paleoenvironmental processes can reasonably be inferred via remote sensing methods, others cannot be resolved unambiguously.
Perseverance Rover's Planetary Instrument for X-Ray Lithochemistry instrument reveals diagenetic features that would otherwise remain unseen by traditional thin section petrography.
Introduction
Advancements in orbiter and rover remote sensing technology over the past several decades have revealed that the martian surface is host to a diverse range of sedimentary processes and sedimentary rock types (Malin and Edgett, 2000; Grotzinger and Milliken, 2012; Edgett and Sarkar, 2021). The textural and mineralogical characteristics of all sedimentary rocks are by nature intimately tied to the environmental conditions under which they are formed and subsequently altered. Sedimentary strata thus have the potential to preserve—although partially and discontinuously—the climatic evolution and habitability of a planet's surface through time. This framework has guided many scientific efforts to better understand the spatial distribution, depositional history, and biosignature preservation potential of sedimentary rocks exposed on Mars (Grotzinger, 2009).
Even on Earth, however, deciphering the ancient environments and mechanisms that shaped a particular sedimentary rock or formation is not always straightforward. Disentangling primary deposition, diagenetic, and surficial weathering processes in a stratigraphic record often requires detailed field and laboratory investigations to determine the relative timing, textural attributes, and compositional associations for each respective process. Furthermore, each process that affects a sedimentary rock has an inherent ability either to preserve or to destroy biosignatures. In many cases, incontrovertible evidence of past life—such as molecular biomarkers—is entirely oxidized or overprinted by later diagenetic mineral precipitation (Summons et al., 2011).
Rover missions have revealed that the stratigraphic record of Mars is comparably complex and rife with contributions from a diverse range of primary depositional and secondary diagenetic processes (Grotzinger et al., 2005, 2014, 2015; McLennan et al., 2005; Sun et al., 2019; Fraeman et al., 2020). Determining the relative timing and compositional associations of textural attributes (e.g., grains, cements, concretions, veins) in a given sedimentary rock on Mars is largely limited by the spatial resolution and operational capabilities of rover instrumentation (McLennan et al., 2005; Treiman et al., 2016).
An improved understanding of our ability to accurately interpret data of ancient sedimentary strata on Mars can be attained by assessing the degree to which various rover-based methods can accurately detect features that are diagnostic of process in analogous ancient terrestrial strata. A natural starting point is to focus on examples from the terrestrial sedimentary record whose geological histories have been previously well characterized and that contain minerals relevant to Mars.
In this context, we present here a case study of siliciclastic–evaporite samples from the well-understood and extensively characterized Permian Seven Rivers Formation in New Mexico as a textural and mineralogical analog for sulfate-rich and clay-bearing strata on Mars. We compare geological observations and interpretations made from traditional or more commonly used laboratory-based geological methods with remote sensing methods relevant to Mars rover payloads. Methods include thin section petrography, powder X-ray diffraction (XRD), visible-near-mid infrared point reflectance spectroscopy, Fourier-transform infrared reflectance (FTIR) microscopy, backscattered electron (BSE) microscopy, electron probe microanalysis, and X-ray fluorescence mapping.
The latter uses a laboratory breadboard version of NASA's Mars Perseverance Rover Planetary Instrument for X-Ray Lithochemistry (PIXL) instrument. Our assessment emphasizes the ability of each method to resolve features diagnostic of geological processes, including: (1) primary and secondary depositional textures; (2) spatial patterning in mineralogy and chemistry; (3) preserved biosignatures; and (4) the inferred relationship between these characteristics for “bulk” measurements and spatially resolved measurements. The objective of this case study was to evaluate the degree to which the depositional and diagenetic history of a given sedimentary rock can be properly interpreted using remote sensing analytical techniques relevant to rover-based exploration of Mars.
Background
Terrestrial field site
The Guadalupe Mountains of West Texas and New Mexico contain arguably the single most well-exposed and well-characterized ancient carbonate platform reef system in the world (Fig. 1A) (Kerans and Tinker, 1999; Saller et al., 1999; Kerans and Kempter, 2002; Kerans et al., 2017). For a more detailed evaluation of the regional evolution and depositional history of the Guadalupe Mountains, we refer readers to the work of Kerans et al. (2017) and references therein. These Permian-aged outcrops preserve a variety of rock types that include: shelf, slope, reef margin, and basinal carbonates; shallow shelf and basinal fluvial- and eolian-sourced sandstones; basinal mudstones; and shallow and deepwater evaporites. The Capitan reef facies grew in a relatively narrow steep-sloped margin along the edges of a deep basin, which is particularly apparent when juxtaposed against the flat expansive Seven Rivers Formation evaporites deposited on the adjacent shelf interior (Fig. 1B).
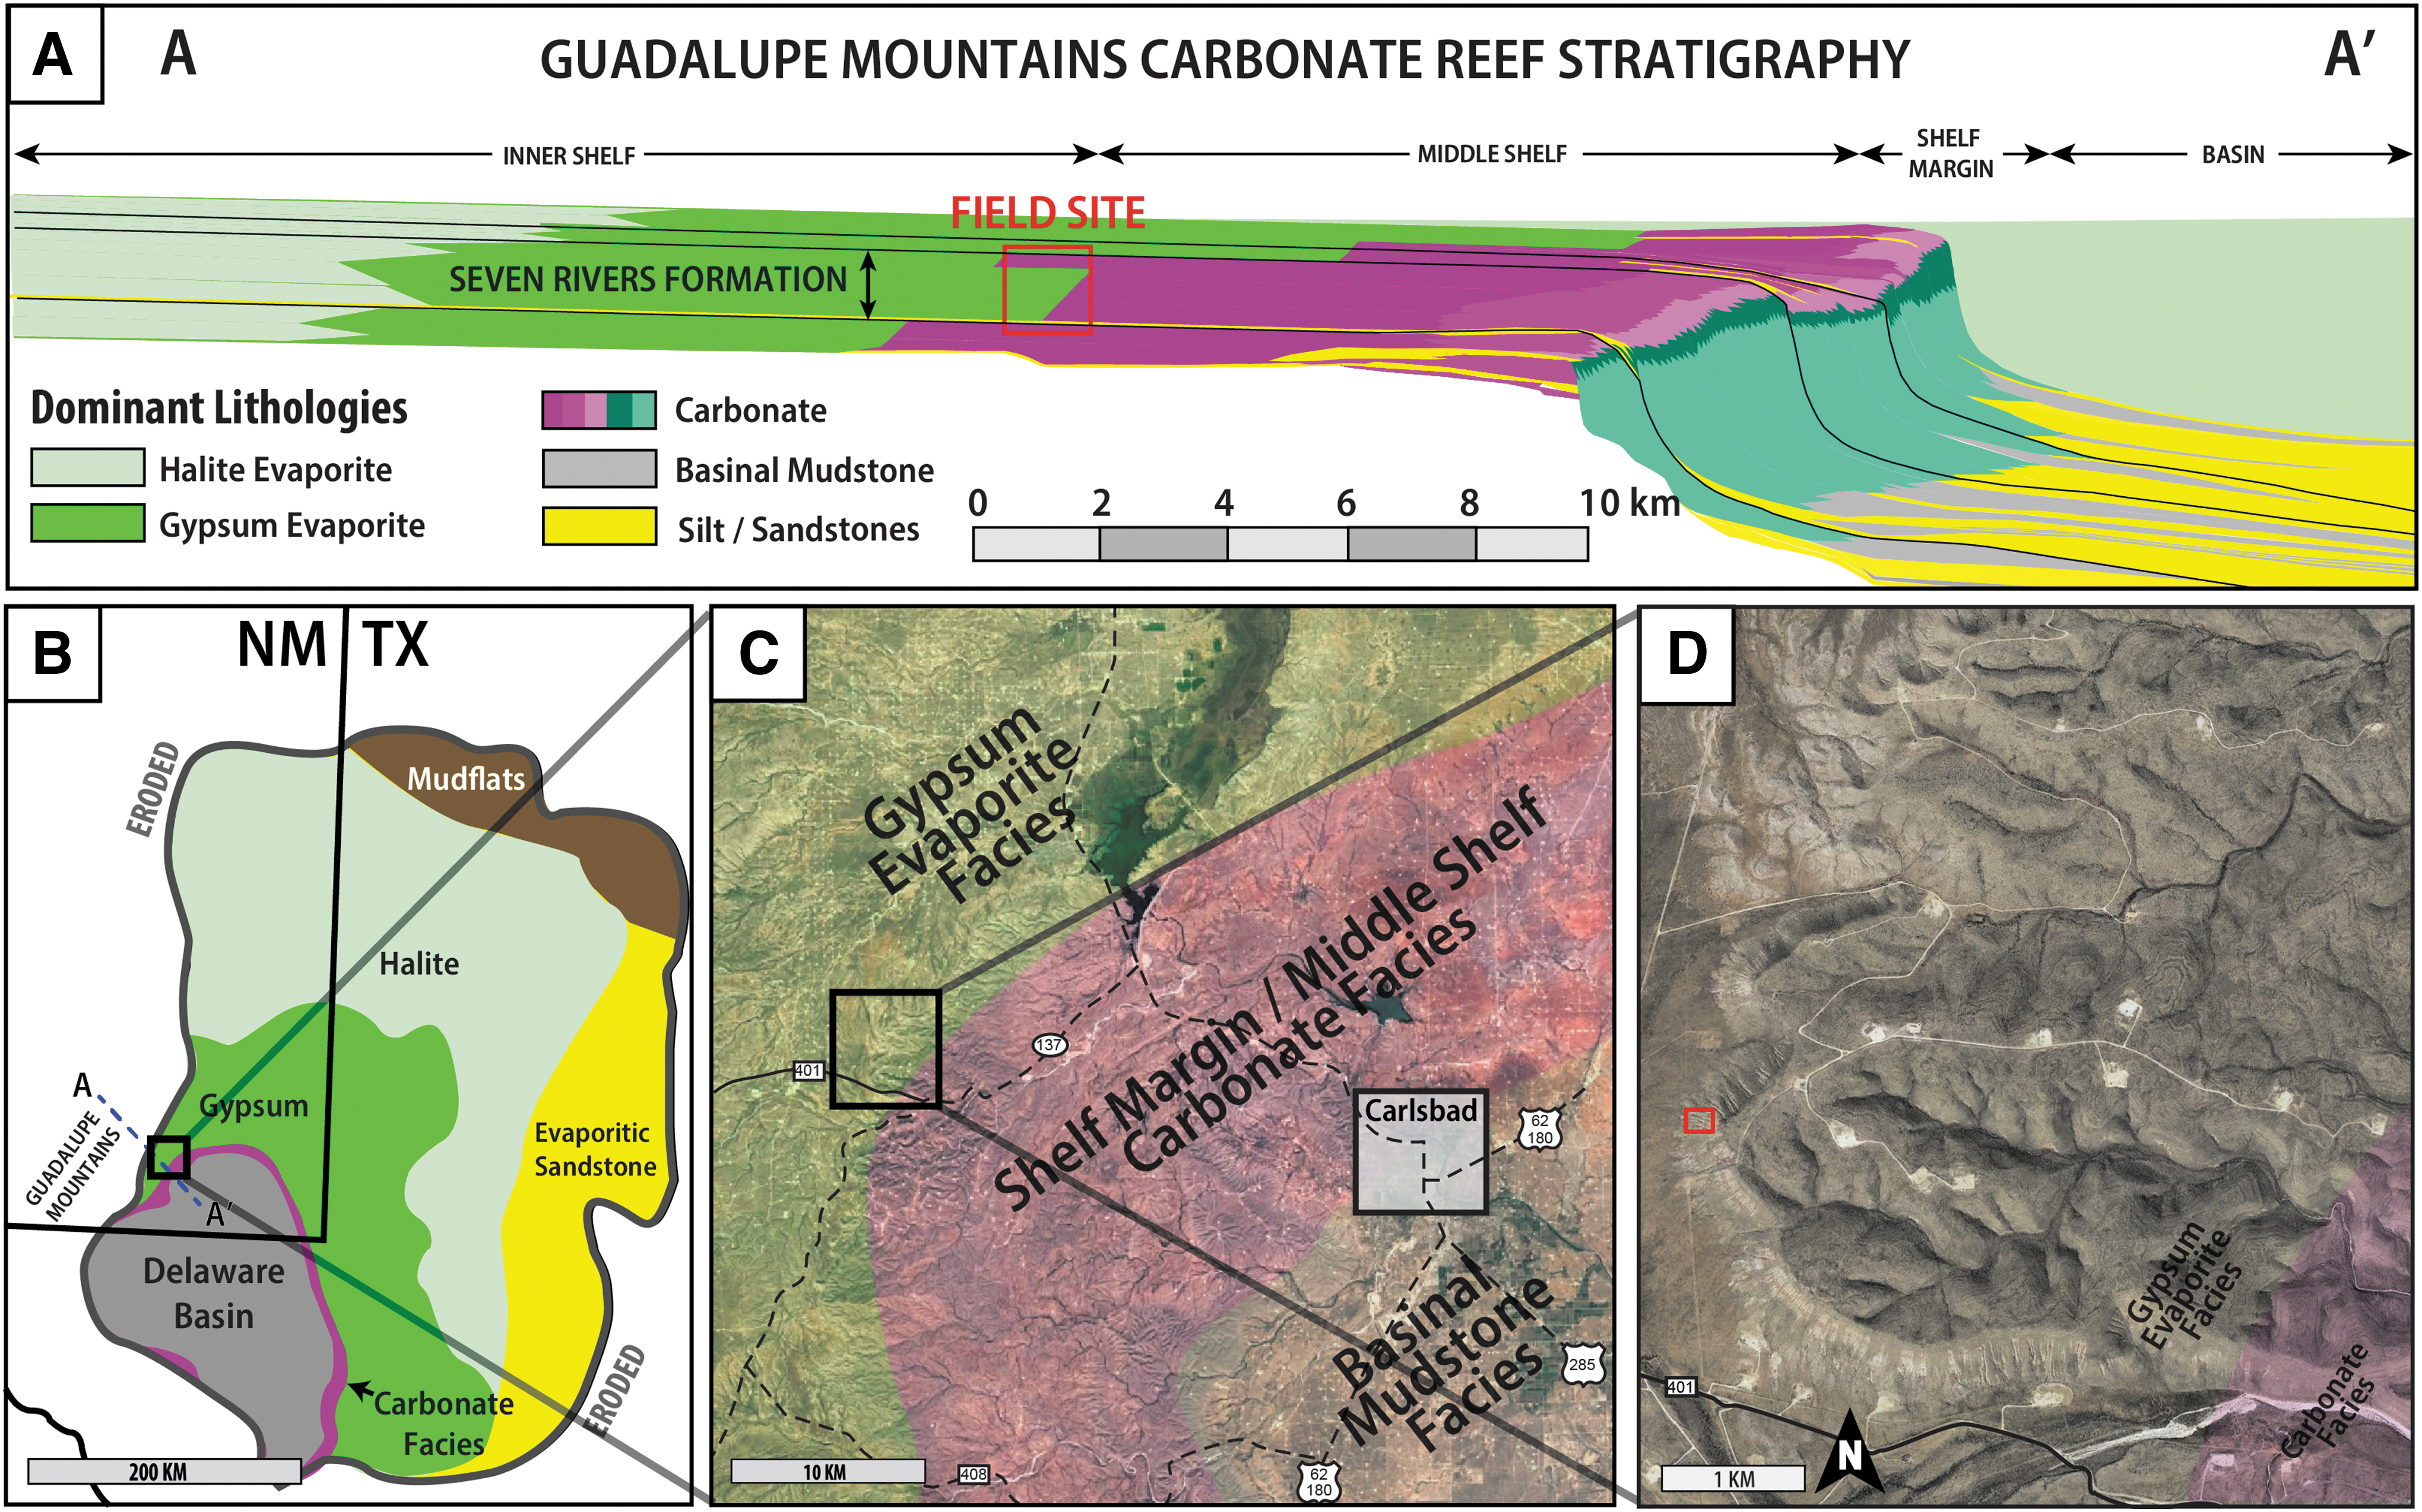
The shallow restricted marine backreef facies of the Seven Rivers Formation are well exposed in the Rocky Arroyo field site near Carlsbad, New Mexico (Fig. 1C, D). Sarg (1981) and Brown and Loucks (2016) provided detailed characterizations of the outcrops at Rocky Arroyo. These sulfate-rich strata were deposited subaqueously in a shallow shelf basin (i.e., a salina) under a density-stratified water column (Sarg, 1981; Brown and Loucks, 2016). The Seven Rivers Formation lies conformably above the Shattuck Sandstone of the Wordian-aged Queen Formation and is subdivided into upper and lower members at the Wordian-Capitinian boundary (265.8 Ma; Fig. 2A) (Garber et al., 1989).
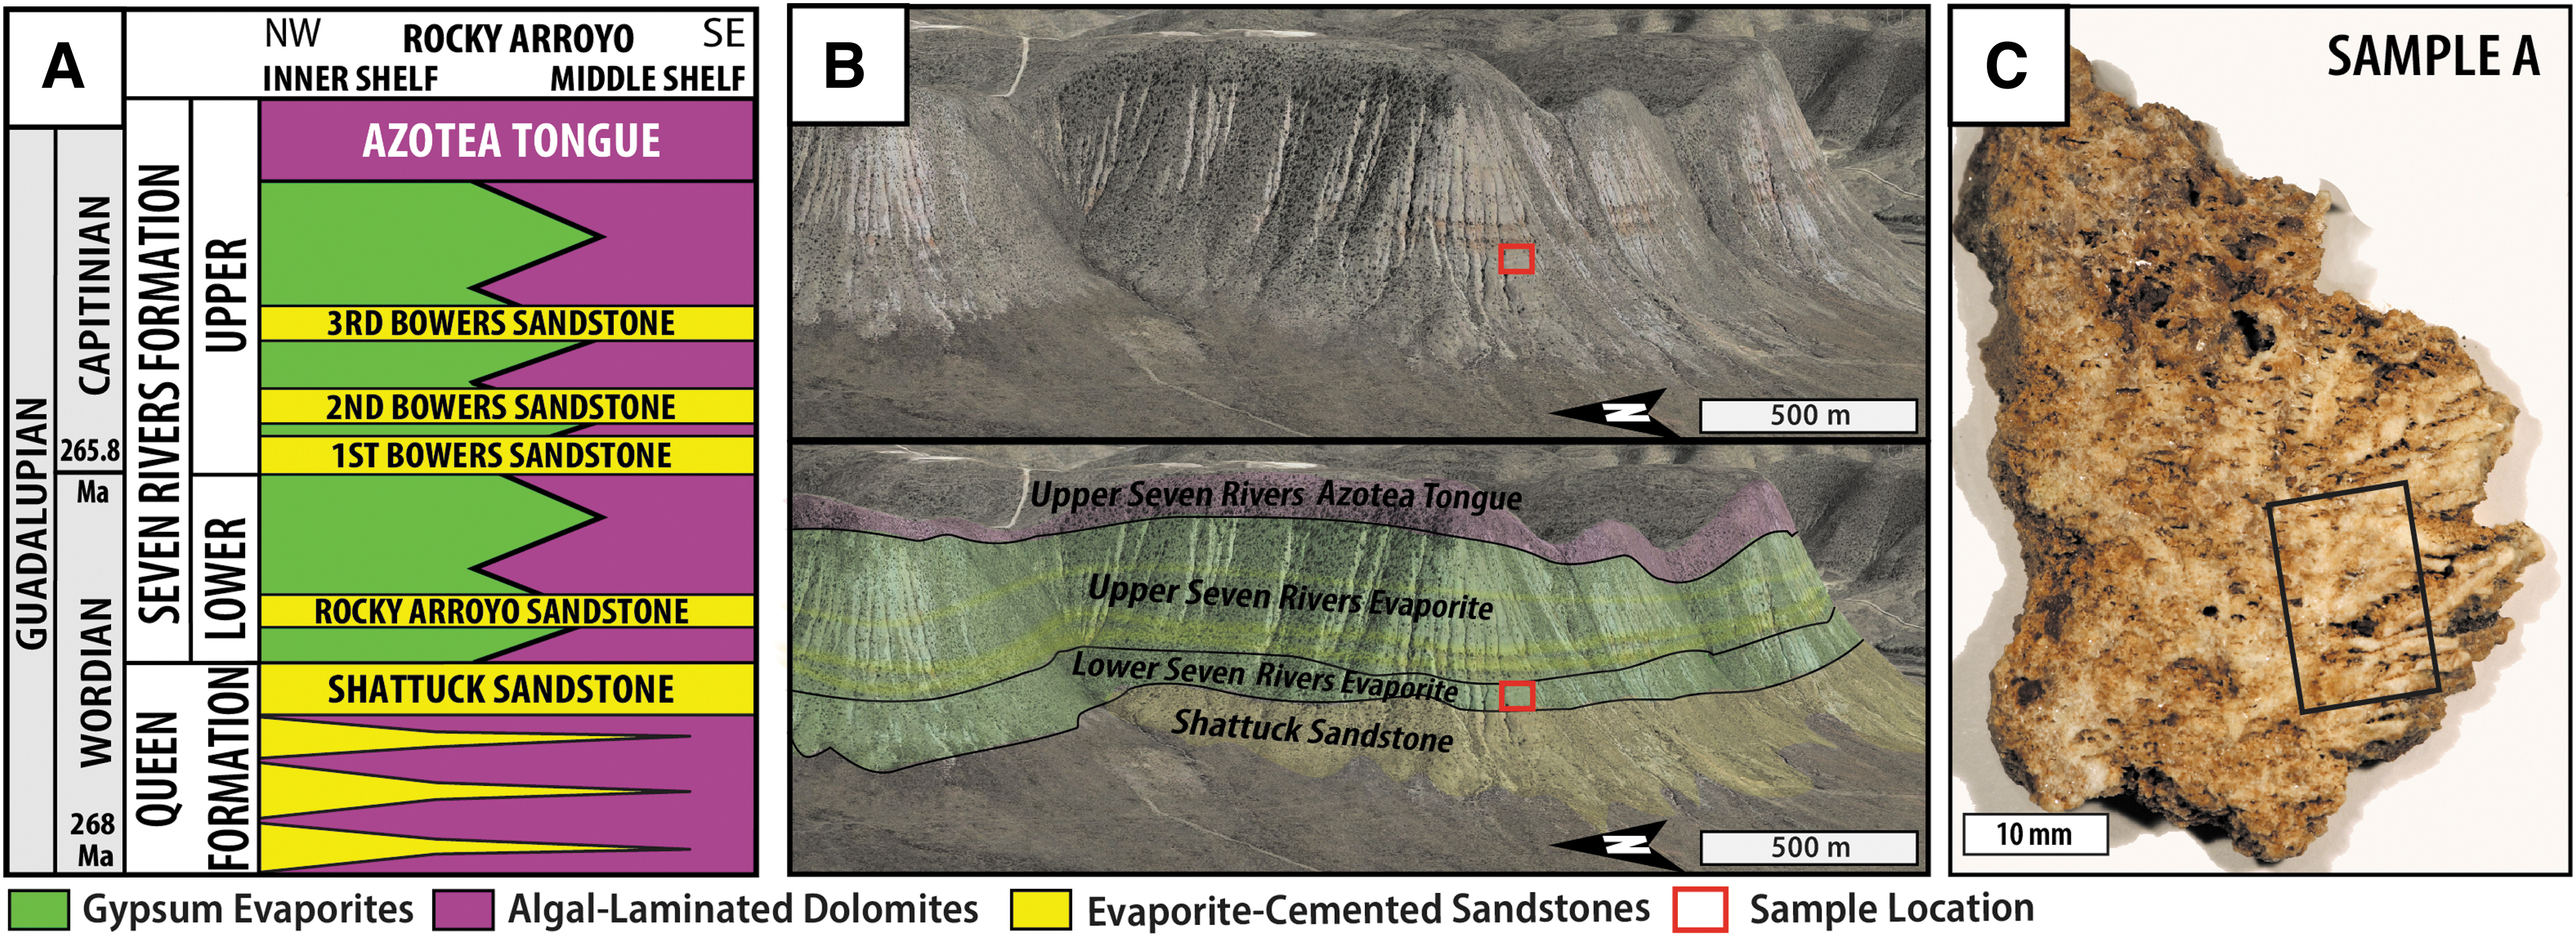
Nearer to the shelf margin, the Seven Rivers Formation is almost entirely dolomitized carbonate; across the inner shelf, the Seven Rivers Formation is almost entirely gypsum evaporite (Fig. 1A, B). In the Rocky Arroyo area, this formation is dominated by evaporite, but the abrupt lateral transition between these two facies types is exposed in the eastern portion of the field site (Figs. 1D and 2A). Samples selected for this study were obtained from the gypsum evaporite facies of the Lower Seven Rivers Formation (Figs. 1D and 2B).
In the Rocky Arroyo area, the Seven Rivers Formation is ∼120 m thick. The overlying Yates Formation has been eroded and is not present across the field site. The dolomitic Azotea Tongue of the upper member of the Seven Rivers Formation forms an erosion-resistant cap to most of the softer gypsum-rich Rocky Arroyo exposures (Fig. 2B). Interbedded within the Seven Rivers Formation are several meters thick, regionally extensive sheet sands. These sheet sands are characterized by eolian deflation and subaerial exposure surfaces (Brown and Loucks, 2016) and were likely delivered to the inner shelf by eolian and fluvial processes during intermittent periods of low sea level. In many cases, they have been reworked subaqueously and cemented by gypsum evaporite (Sarg, 1981; Brown and Loucks, 2016).
Likely influenced by the prominence of a global sulfur cycle, sulfate minerals are an undeniably significant and widespread constituent of martian surface mineralogy (Gendrin et al., 2005; King and McLennan, 2010). Orbiter-based sulfate detections broadly coincide with Hesperian-aged terranes (∼3.6 to ∼3.0 Ga) (Bibring et al., 2006; Carr and Head, 2010). However, data collected by the Curiosity rover suggest that some sulfates may have precipitated as late as ∼2.1 Ga (Martin et al., 2017). Both orbiter and rover data suggest that martian sulfates are at least in part sedimentary in origin and complexly stratified with a variety of other minerals, including phyllosilicates, iron oxides, and salts (Malin and Edgett, 2000; Gendrin et al., 2005; Milliken et al., 2010; Grotzinger and Milliken, 2012; Vaniman et al., 2018; Rampe et al., 2020; Sheppard et al., 2020).
Various in situ detections made by rovers suggest that processes of sulfate formation on Mars are complex and variable even at local scales. Most sulfate detections made by the Curiosity rover thus far occur as a result of sampling diagenetic Ca-sulfate veins and nodules (Stack et al., 2014; Rampe et al., 2017). However, localized evidence for primary evaporites was suggested by Rapin et al. (2019), and Curiosity has yet to explore the traverse areas most enriched in sulfate as seen in orbital data. In contrast, the Opportunity rover discovered abundant evidence for reworked primary evaporites (including Mg-sulfates, jarosite, Ca-sulfates, chlorides, Fe-sulfates, Na-sulfates) at Meridiani Planum with evidence for a wide range of diagenetic processes including multiple episodes of cementation, recrystallization, and moldic porosity development (McLennan et al., 2005).
The bedded sequences of primary evaporites at the Rocky Arroyo field site are thus in part relevant to local ancient sulfate-bearing environments encountered by rovers on Mars. These ancient evaporitic environments are also intriguing from an astrobiological perspective because their formation implies the existence of past surface water or near-surface groundwater. In addition to sulfate minerals, the Rocky Arroyo outcrops contain an abundance of other Mars-relevant minerals including phyllosilicates, iron oxides, and salts (as shown in this study).
Rocky Arroyo strata are also characterized by the primary depositional interbedding of eolian-sourced silt/sand and precipitated evaporite minerals (Brown and Loucks, 2016; this study), processes that have also been inferred for Mars (Grotzinger et al., 2005). Furthermore, post-depositional diagenetic recrystallization, fractures, veins, and nodules are common occurrences in both Rocky Arroyo evaporites and sulfate-bearing strata on Mars (McLennan et al., 2005; Stack et al., 2014; Sun et al., 2019). Given the mineralogical, depositional, and textural relevance of Rocky Arroyo outcrop exposures to Mars, the subtle biosignatures preserved within these ancient sediments may also be relevant to how they might occur on that planet should they be encountered along a rover traverse.
Methods
Sample preparation and optical petrography
Evaporite samples (Fig. 2C) were obtained from the Seven Rivers Formation at the field location (Fig. 2B). For selected analyses, samples were dry sawn to create a flat sample surface. For all powdered analyses, samples were ground using a mortar and pestle and hand sieved to a particle size of <45 μm. For evaporite samples containing an appreciable interbedded silt component, the silt was physically separated from the evaporitic matrix using tweezers, powdered, and analyzed in addition to the bulk rock powder. Thin sections of selected samples were created by Burnham Petrographics. All samples were impregnated with blue dyed Petropoxy 154 before thin section preparation. Petrographic observations were made from thin sections and photographed using an Olympus BX51 polarizing microscope with an Olympus DP72 high-resolution camera. Sedimentary textural attributes were identified petrographically with reference to the works of Ulmer-Scholle et al. (2014), Maiklem et al. (1969), and Sarg (1981).
Mineral phase characterization via powder XRD
Powder XRD measurements were collected on all samples using a benchtop Bruker D2 Phaser with a Cu-Kα X-ray source. Complete diffraction patterns were acquired by measuring diffracted X-ray intensity from 5° to 90° 2θ in step increments of ∼0.02° with a dwell time of 5 s per step. A 1 mm antiscatter shield was used for all measurements. Mineralogical phases were qualitatively identified by using Bruker Eva software with reference to diffraction patterns published in the American Mineralogist Crystal Structure Database (AMCSD) and in the database curated by the International Centre for Diffraction Data.
Material identification via reflectance spectroscopy
Reflectance spectra were acquired for all powdered samples under ambient conditions. An Analytical Spectral Devices (ASD) FieldSpec3 spectroradiometer was used to collect reflectance spectra in the visible-near infrared (VNIR) wavelength region (0.35–2.5 μm) relative to a white Spectralon™ reflectance standard (spot size of ∼2–5 mm). A Thermo Nexus 870 FTIR spectrometer was used to collect reflectance spectra in the near-mid infrared (NIR-MIR) wavelength region (1.5–25 μm) relative to a diffuse gold standard (spot size of ∼1–2 mm). ASD and FTIR reflectance measurements were spliced to provide a continuous reflectance spectrum for each sample. For selected samples, FTIR microscope measurements were made using a Bruker LUMOS instrument to collect reflectance spectra on flat whole-rock sample surfaces and powdered samples in the NIR-MIR region (1.5–16 μm) relative to a diffuse gold standard (spot size of ∼50–150 μm).
Primary absorption features in spectra of the samples were identified and characterized in the 0.35–4.0 μm wavelength region by comparing with spectra of reference materials (Fig. 3A, C). Pertinent mineralogical and spectral characteristics for each reference material are summarized in Supplementary Appendix C. A convex hull operation was used to define and remove a linear spectral continuum over each diagnostic absorption feature of interest in both sample spectra (Fig. 3B) and reference material spectra (Fig. 3D) according to the methods of Clark and Roush (1984) (see Supplementary Appendix Table SA1 for continuum removal endpoints and Supplementary Appendix Table SA2 for diagnostic band centers and band depths for each reference spectrum).
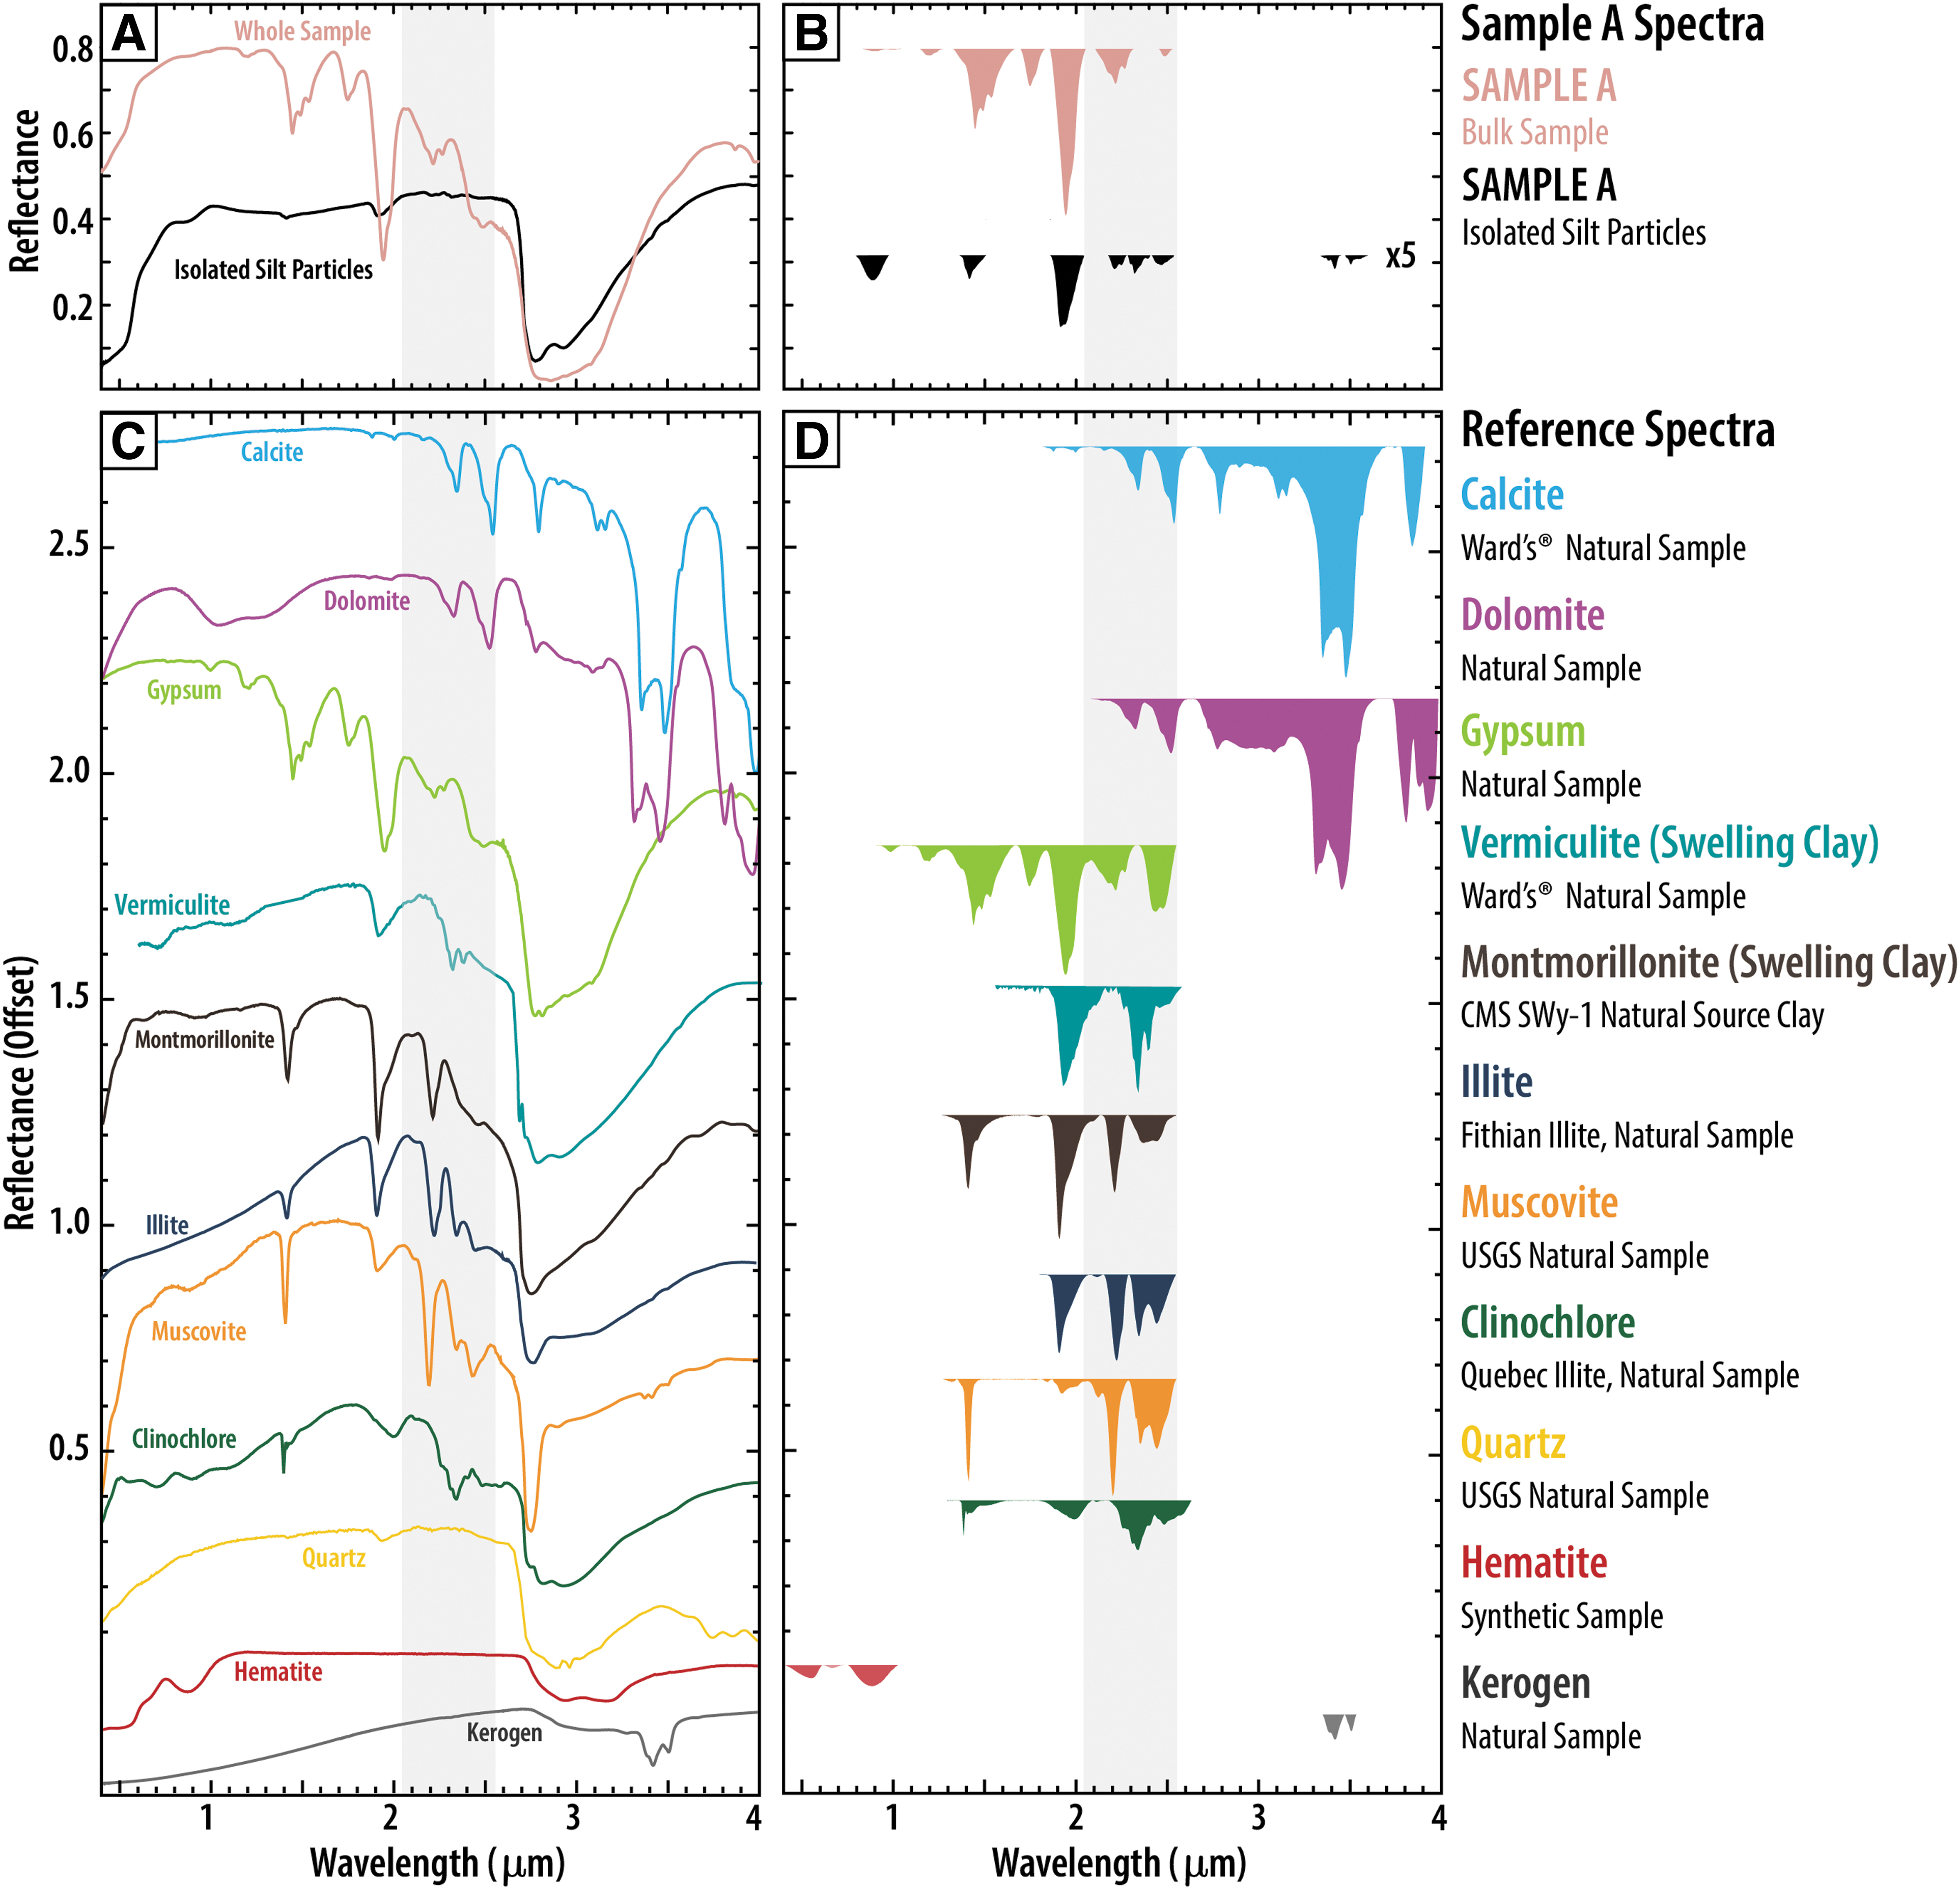
Reflectance spectra of samples and pertinent reference materials. Gray shading on all plots highlights the 2.05 to 2.55 μm absorption region that is modeled in Fig. 6.
To qualitatively assess the relative spectral contributions of each reference material (minerals and kerogen) to spectra of the bulk rock and the isolated silt particles, a non-negative least squares minimization fitting routine (lsqnonneg in MATLAB) was employed across the 2.05–2.55 μm wavelength region on continuum-removed spectra.
The Cameca SX100 electron microprobe at Brown University was used to confirm textural, chemical, and mineralogical spatial relationships qualitatively at the microscale. The microprobe is equipped with an energy-dispersive spectrometer (EDS), which was used to capture X-ray spectra at various point locations referenced to BSE images of carbon-coated thin sections of samples. Likely mineral presence was qualitatively confirmed by comparing characteristic element peaks in EDS spectra of samples to reference patterns published by Severin (2004) and Reed (2005).
Elemental characterization via PIXL mapping
Mounted to Perseverance Rover's robotic arm, the PIXL is a micro X-ray fluorescence mapping tool that utilizes induced fluorescence from a 0.12 mm-diameter focused X-ray beam and a pair of X-ray detectors to produce spatially customizable elemental point, line, and map measurements (Allwood et al., 2020). Elemental map measurements for this study were collected on selected flat (dry sawn) sample surfaces using a breadboard version of Perseverance Rover's PIXL (Allwood et al., 2020; Liu et al., 2022) instrument located at Stony Brook University. This breadboard instrument has several notable differences from the Perseverance Rover mission instrument, which are detailed in Supplementary Appendix B.
Elemental abundance maps with a grid step size of 150 μm for Si, Ti, Al, Cr, Fe, Mn, Mg, Ca, Na, K, S, Cl, P, and Sr were produced by processing X-ray spectra using PIQUANT (Supplementary Appendix Fig. SA2) (Allwood et al., 2020). Because rock samples contain crystalline mineral phases, XRD scattering often produces diffraction peaks in PIXL X-ray spectra (Liu et al., 2022). As diffraction peak positions vary between detectors, their presence can be identified by comparing left and right detector spectra for given measurement. Diffraction peak intensities were also quantified where applicable.
Results and Interpretations
Traditional geological characterization of samples
All samples obtained from the gypsum evaporite facies of the Lower Seven Rivers Formation (Figs. 1 and 2) are petrographically and mineralogically dominated by gypsum evaporite. Although several samples were analyzed for this study, the results presented here are focused on a single representative sample (sample A) that contains the most textural and mineralogical diversity. For further sample results, we refer the reader to Supplementary Appendix A. Sample A retains primary bedding characteristics (Fig. 4) and is best described as a friable and silt-bearing laminated gypsum evaporite. Petrographic observation of this sample (Fig. 4) reveals fine-grained, light-toned, wavy-discontinuous laminations of gypsum interbedded with secondary amounts of wavy-discontinuous dark-red silt laminations (∼80 and 20 volume percent by visual inspection, respectively).
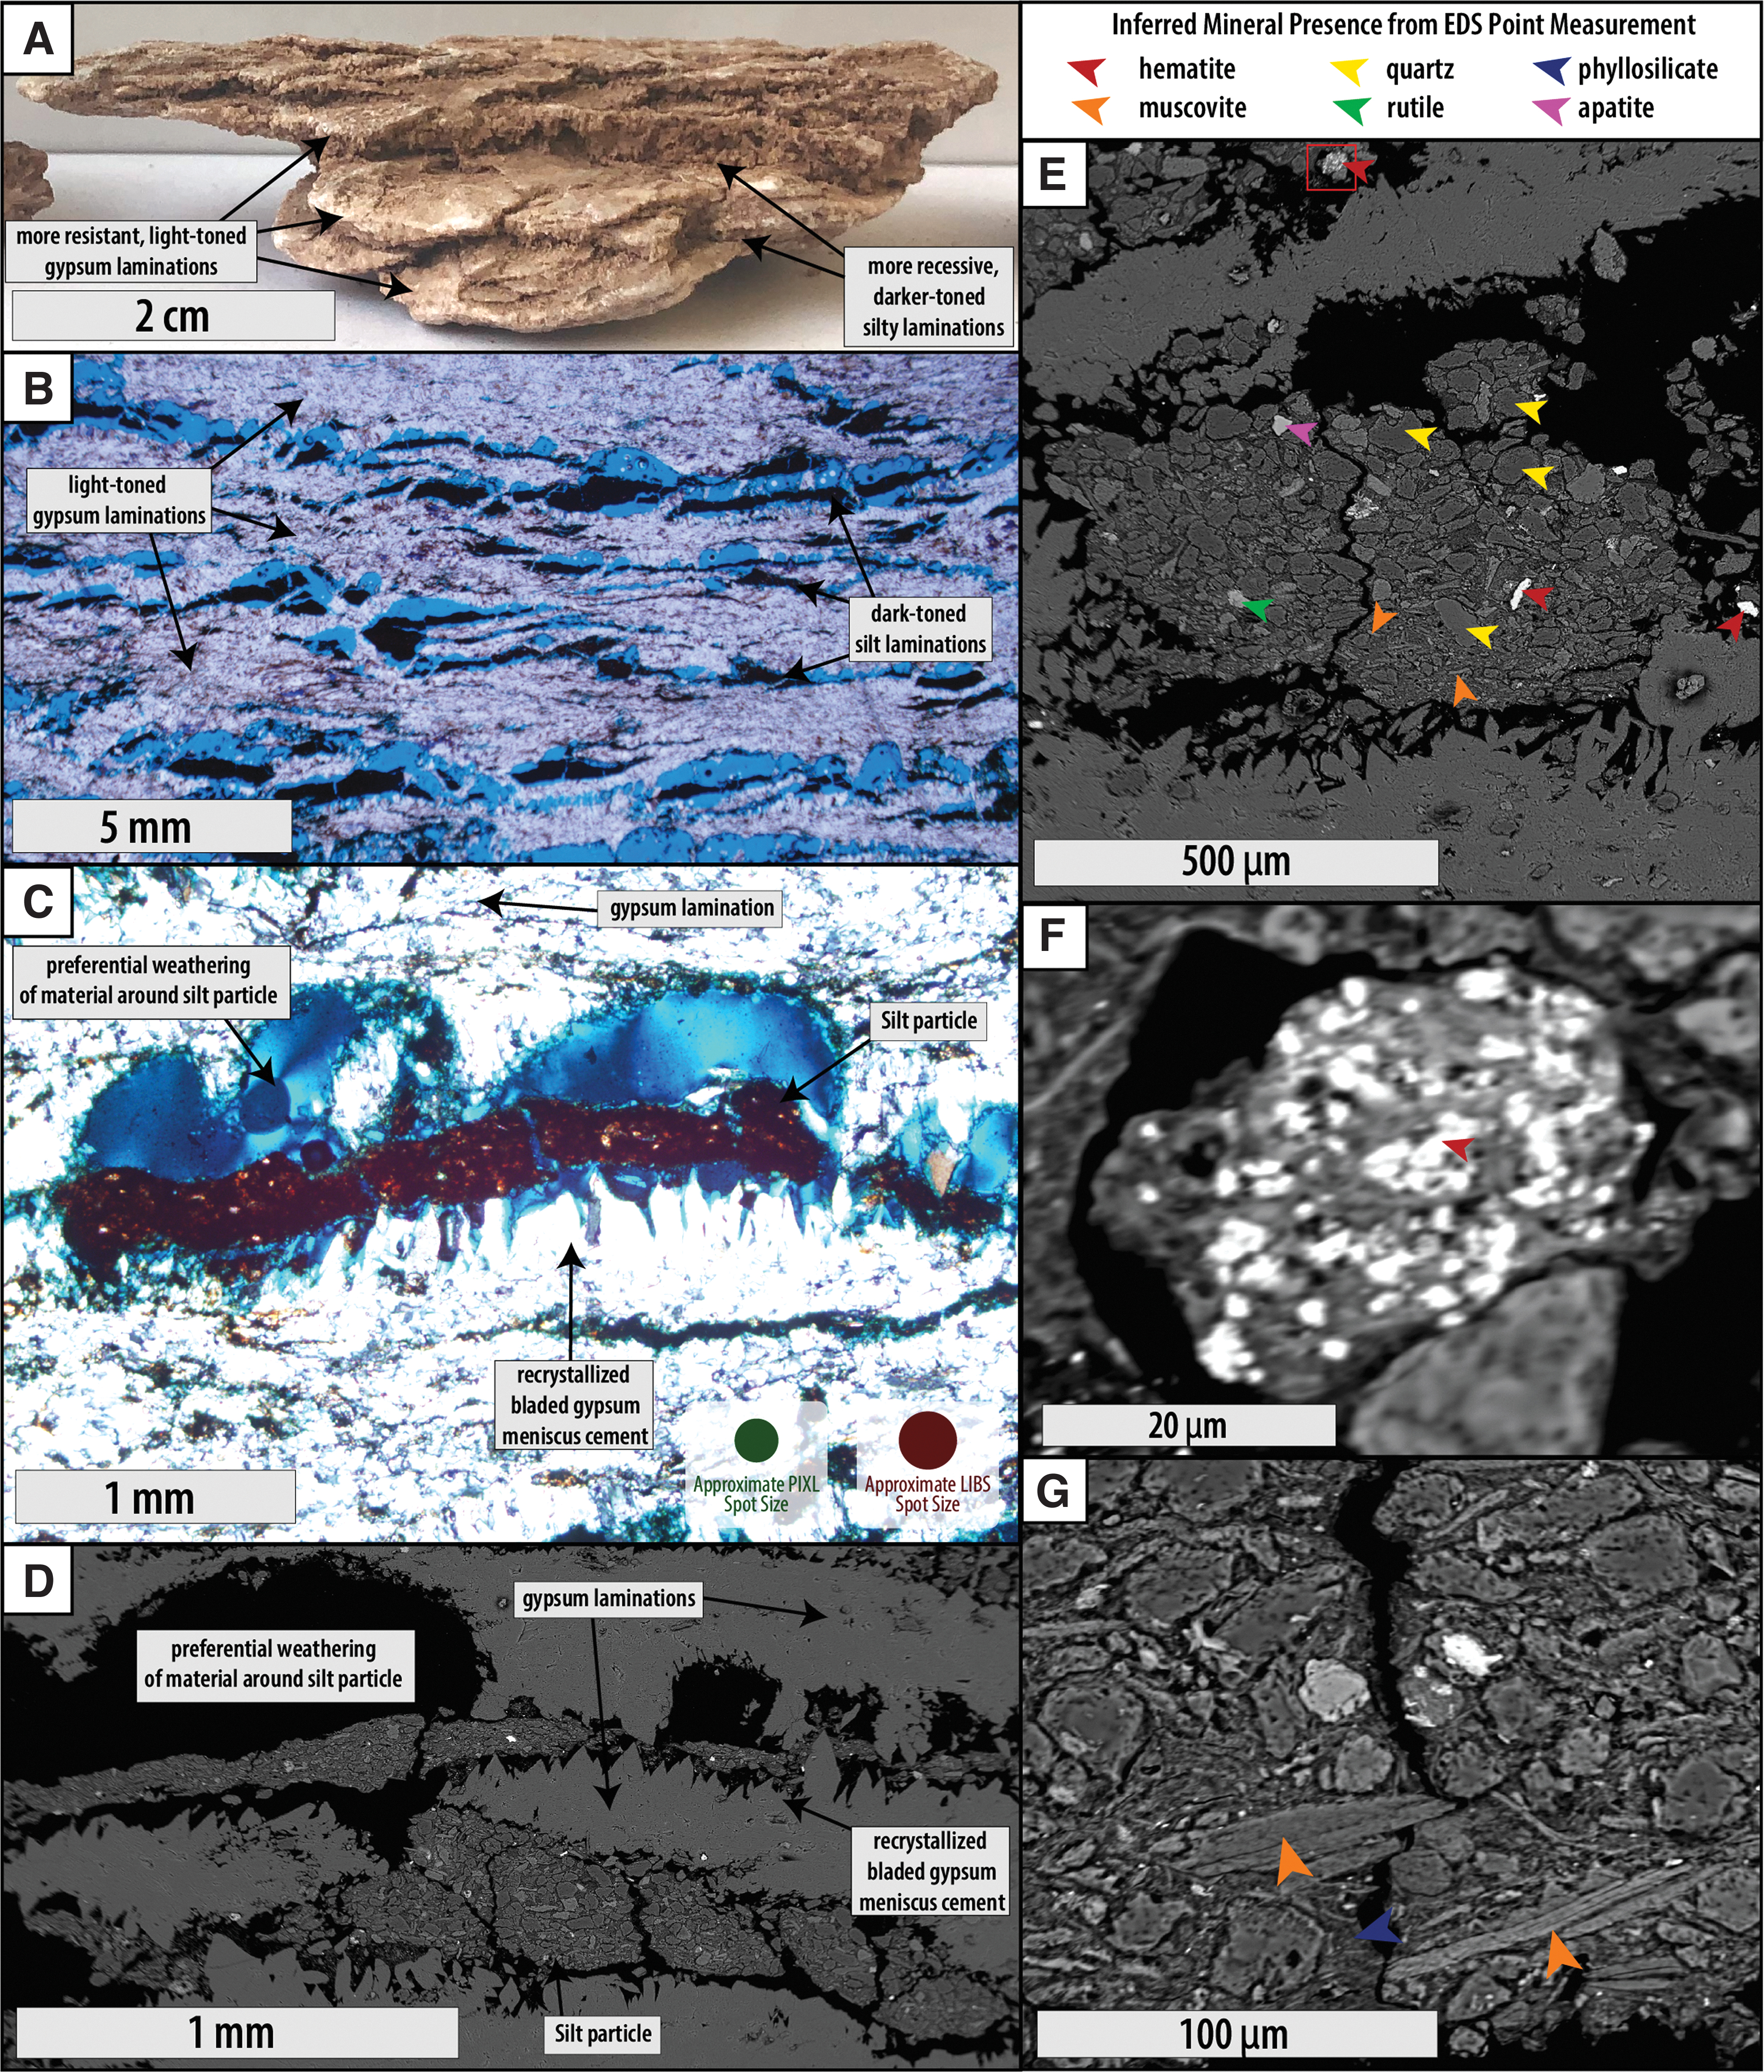
Primary gypsum laminations lack any indication of bottom-nucleated growth textures, despite their common occurrence at a centimeter scale in the field area (Sarg, 1981; Brown and Loucks, 2016). Instead, microcrystalline felted textures within the wavy-discontinuous laminations (Fig. 4) indicate the potential subaqueous reworking of gypsum shortly after precipitation, possibly due to some degree of bottom-water energy in a relatively shallow water salina. Individual gypsum crystals are typically low birefringence and very fine such that individual grain boundaries are unresolvable in thin section. BSE images of this sample indicate an individual gypsum crystal size of ∼20–40 μm where resolvable (Fig. 4D, E).
From hand sample photographs (Fig. 4A), it is difficult to distinguish silt laminations as distinctly bedded components of sample A, let alone correctly constrain their transport mechanism (e.g., fluvial, eolian). Thin section images highlight the silt as a texturally disparate constituent (Fig. 4B, C) with aggregate particle sizes commonly <1 mm in diameter. BSE images reveal grain fabrics within individual silt particles to be randomly oriented and poorly sorted, observations that are diagnostically characteristic of aerosol dust deposition in both modern and ancient loess deposits (Derbyshire et al., 1988; Wilkins et al., 2018).
Within aggregate particles, the dominant grain type is very fine (<100 μm) angular to subangular quartz (Fig. 4E, G). These observations, coupled with the occurrence of the eolian sheet sand interbedding above and below this unit across the field site (an interpretation made by previous workers) (Brown and Loucks, 2016), are the primary criteria for which these silt particles are interpreted to be sourced from eolian and/or loess processes. It is possible that they were deposited via suspension settling in the evaporative salina and reworked subaqueously to form discontinuous laminations.
Regional literature indicates that the Rocky Arroyo outcrops were likely buried to at least 1000 feet before their subsequent uplift and surface exposure (Brown and Loucks, 2016), and sample observations indicate that post-depositional diagenetic alteration likely took place during this period. Diagenetic recrystallization of gypsum commonly obscures bedding planes (e.g., compare left and right side of sample A in Fig. 2C), replacing primary laminations with a randomly oriented patchy-textured gypsum that is often more porous than the original laminated rock. Sample A is also affected significantly by late-stage meteoric diagenesis, which likely contributes to the sample's generally friable and porous nature.
Dissolution of laminated gypsum clearly occurs preferentially around silt particles (Fig. 4C, D). As a result, silt particles often appear to reside in vugular cavities in thin section. Reprecipitated bladed gypsum cements often line the bottom of these cavities (Fig. 4C, D) indicating a late-stage or near-surface precipitation environment. Preferential dissolution of gypsum along silt laminations clearly incites fracturing along silt-rich bedding planes. This fracturing preferentially releases silt particles and likely gives rise to the prominent reddish colored dust, which coats many of the samples and occurs as soil at the field site.
XRD measurements of bulk powders from sample A indicate the dominant (>80 wt %) presence of gypsum with secondary amounts of plagioclase feldspar (Fig. 5A). Albite reference patterns provide a good fit to observed peaks, but definitive feldspar identification would require Rietveld refinement. Bulk powder diffraction patterns also show smaller peaks attributed to silt particle constituents; the presence of quartz, muscovite, and clinochlore is interpreted with some confidence. However, the wide variety of mineral phases present in the silt is only fully realized when silt particles are physically isolated from the gypsum laminations and collected, powdered, and measured (Fig. 5B).
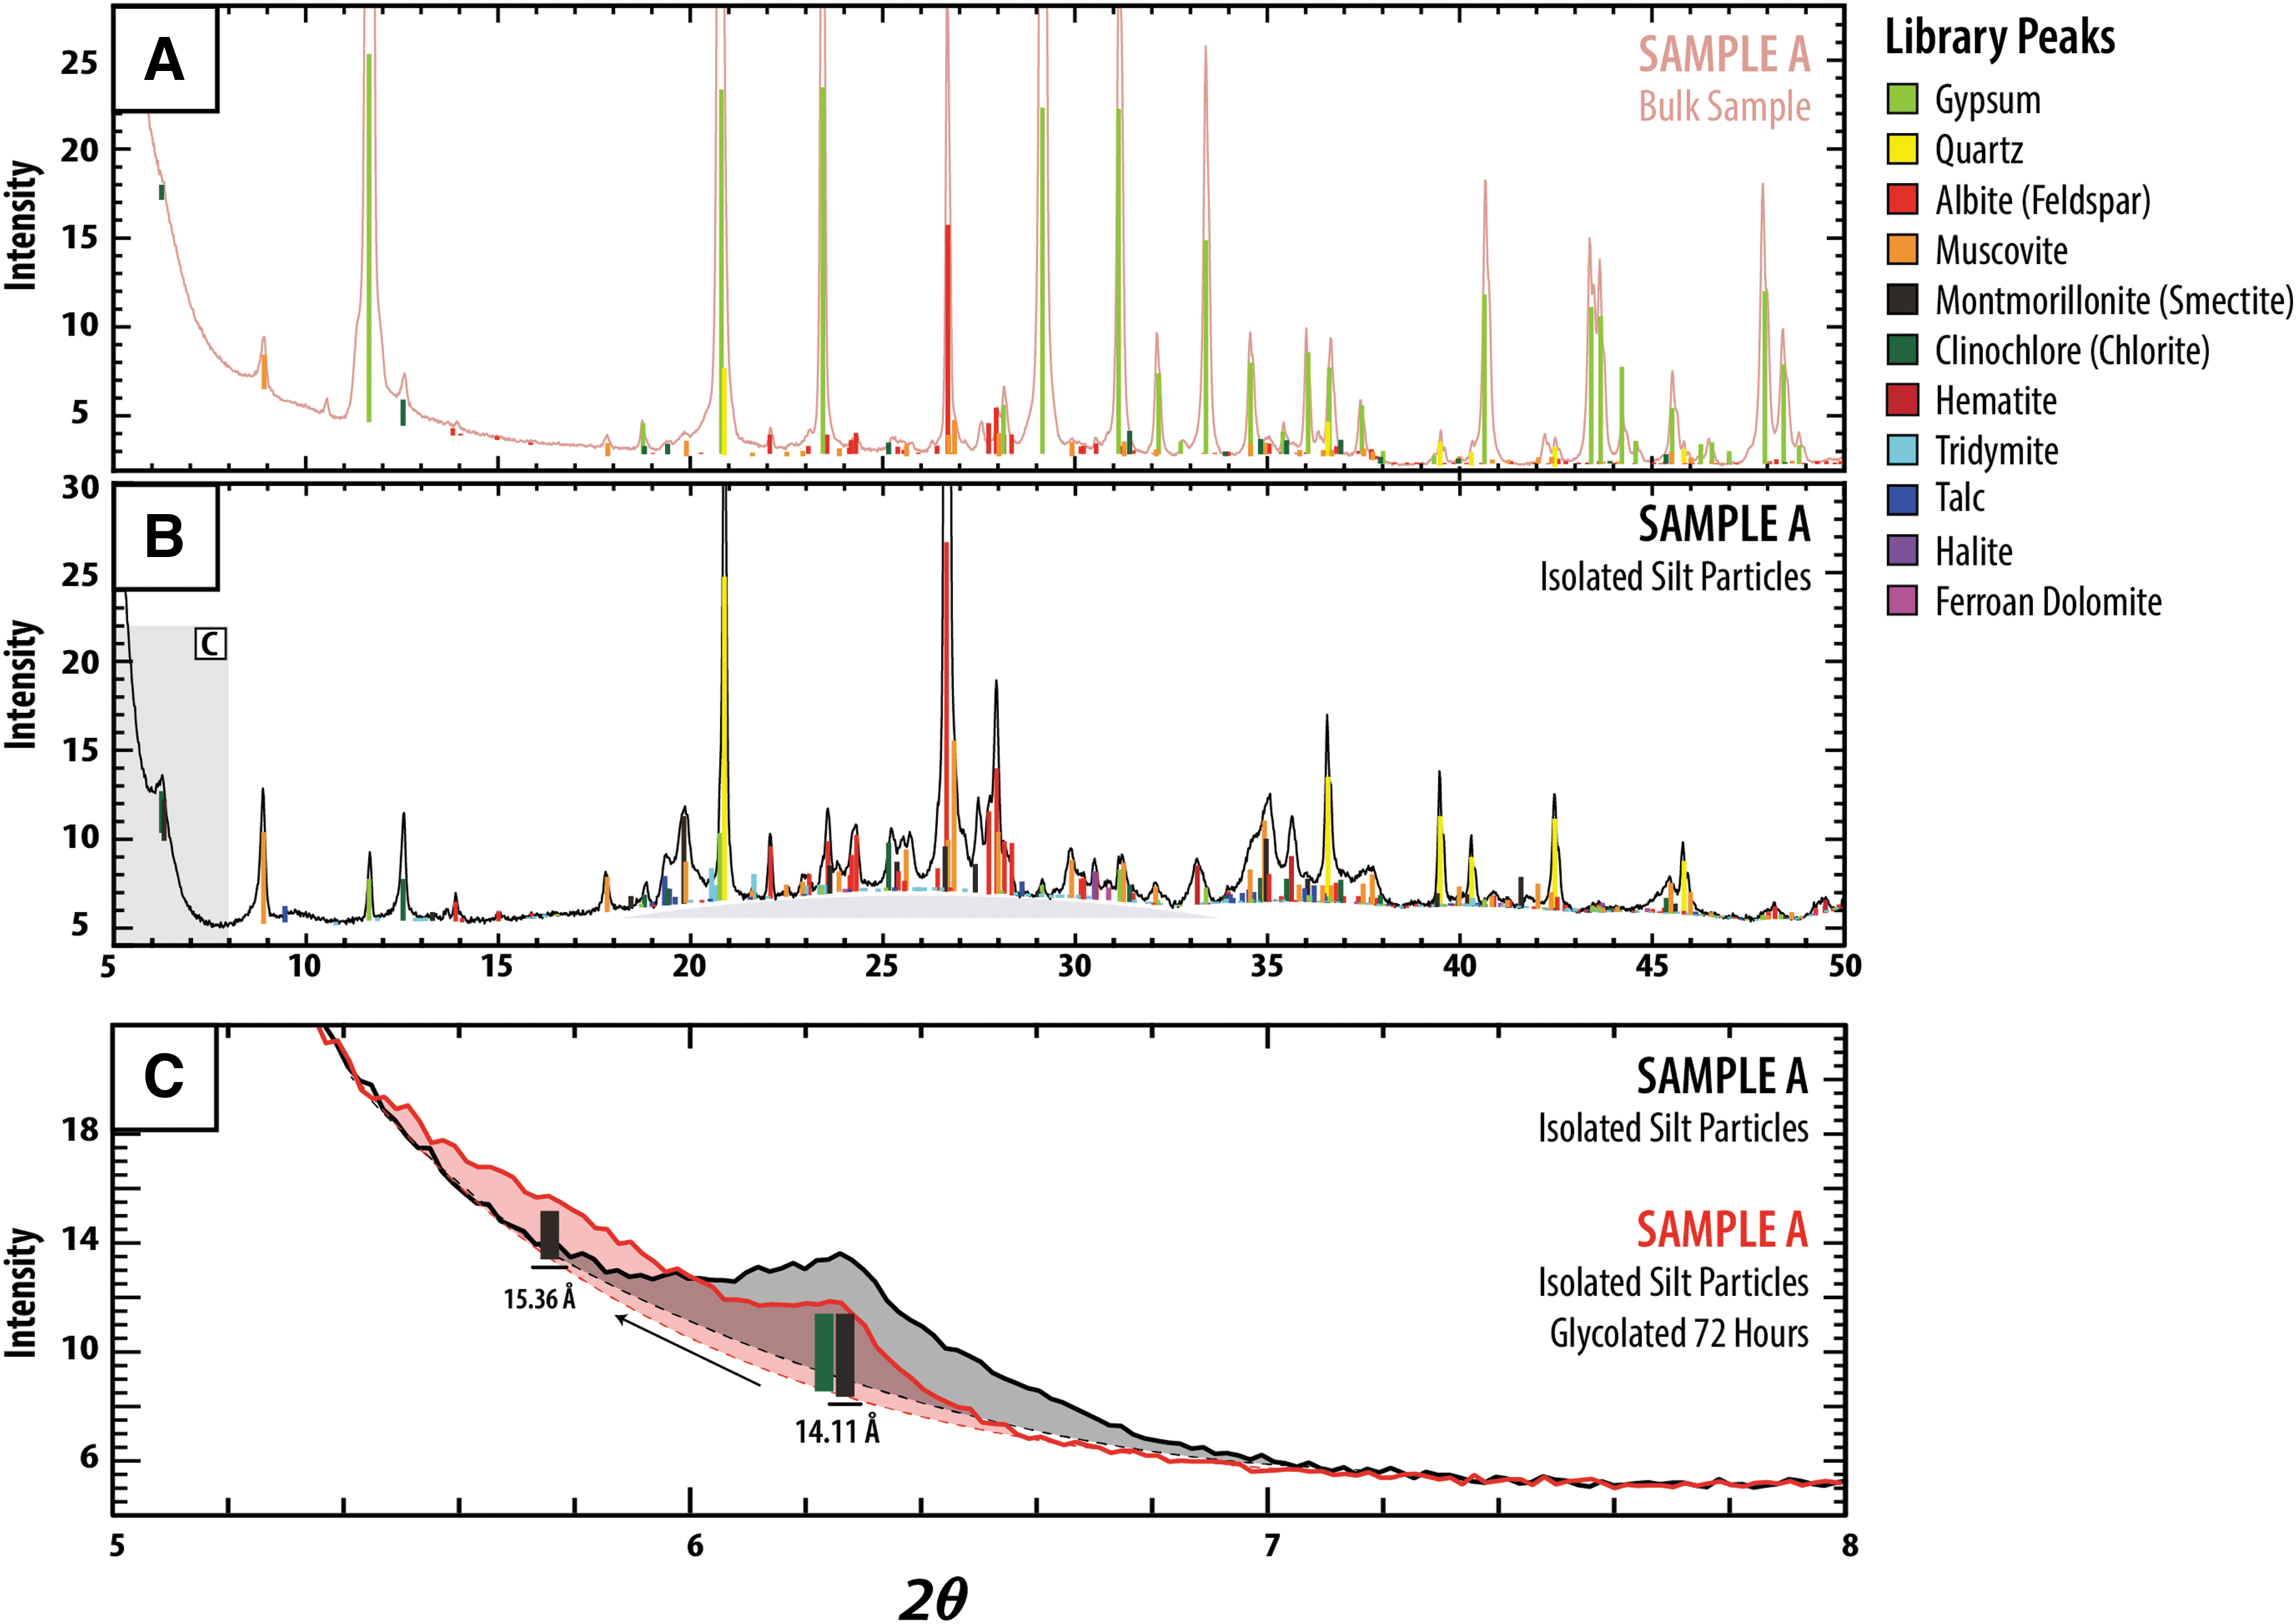
XRD measurements of isolated and powdered silt particles indicate an abundance of quartz, plagioclase feldspar, muscovite, swelling clay, chlorite, and hematite. Possible trace constituents include tridymite, talc, halite, and ferroan dolomite. XRD measurements of powdered silt particles after 72 h of glycolation confirm the presence of a swelling clay mineral by an observed shift in the d(001) peak from 14.11 to 15.36 Å (Fig. 5C). While definitive clay determination requires further clay separation analysis, this peak shift is consistent with a mixed chlorite/smectite or chlorite/vermiculite (Moore and Reynolds, 1989). Silt particle patterns also exhibit a small amorphous hump centered around 16° 2θ (gray shaded polygon underneath pattern in Fig. 5B), which could plausibly relate to the presence of a poorly crystalline swelling clay.
Many of these phases were confirmed qualitatively at the microscale by pattern matching electron microprobe EDS spectra obtained on individual constituents in silt particles to mineral reference spectra from Reed (2005) and Severin (2004) (Fig. 4E). EDS spectra from the very fine (≤100 μm) subangular grains confirm that they are indeed detrital quartz. Similar in grain size and rounding to quartz, occasional very fine (≤100 μm) grains with a composition consistent with feldspar are also observed and interpreted to be of similar detrital origin. Chemical analyses confirm the common presence of very fine (≤50 μm) flakes of muscovite with prominent basal cleavage (Fig. 4E).
Muscovite flakes are randomly oriented and poorly sorted within individual silt particles, indicating that the muscovite identified in powdered silt XRD measurements is likely dominantly detrital in source. Several bright, very fine (10–20 μm) subrounded grains of iron oxides (likely hematite based on XRD measurement mineral identification) are also interpreted to be detrital in origin. Framboidal iron oxide (again, likely hematite) is also observed along the edges of silt particles, which indicates that the hematite present in the silt likely originates from both detrital and authigenic sources (Fig. 4F).
No obvious resolvable grains were detected in BSE images with a chemistry consistent with chlorite or swelling clay despite the identification of their characteristic peaks in XRD patterns. Instead, these phyllosilicates likely reside in the very fine (submicrometer) matrix of silt particles and some may be authigenic in nature. EDS analyses of this matrix indicate enrichment in Si, Al, Mg, Fe, and K in decreasing order of abundance. This elemental chemistry is plausibly consistent with a mixture of both a swelling clay and clinochlore (see Supplementary Appendix Fig. SA1 for both measured and reference EDS spectra). Further work at an scanning electron microscope (SEM) scale would be necessary to definitively confirm the authigenesis of these phyllosilicates in the very fine-grained matrix of the silt particles.
Rare grains of rutile were also identified via pattern matching of microprobe elemental spectra to reference spectra, a phase which was not detected in XRD patterns measured on bulk powders of silt particles. Conversely, several trace phases—talc, halite, and ferroan dolomite—were identified in XRD patterns but were not identified in measurements made on the electron microprobe. Confirming the presence and characterizing the nature of these low abundance trace phases require a more rigorous and time-intensive microprobe assessment than is within the scope of this study.
Similar to bulk powder XRD results, near-infrared reflectance spectra of bulk powders of sample A are dominated by the presence of gypsum. Bulk sample spectra (light pink lines and shading, Figs. 3A, B and 6A, B) exhibit characteristic gypsum triplet sets centered at 1.45, 1.92, and 2.21 μm (Cloutis et al., 2008). Continuum-removed bulk sample absorption features are visually consistent with the continuum-removed features of the gypsum reference spectrum (light green shaded absorptions, Fig. 3D), corroborating the dominant presence of gypsum. A subtle absorption centered at 0.52 μm in the bulk powder spectrum likely occurs due to the presence of hematite, although a corresponding hematite absorption at 0.87 μm is extremely weak.
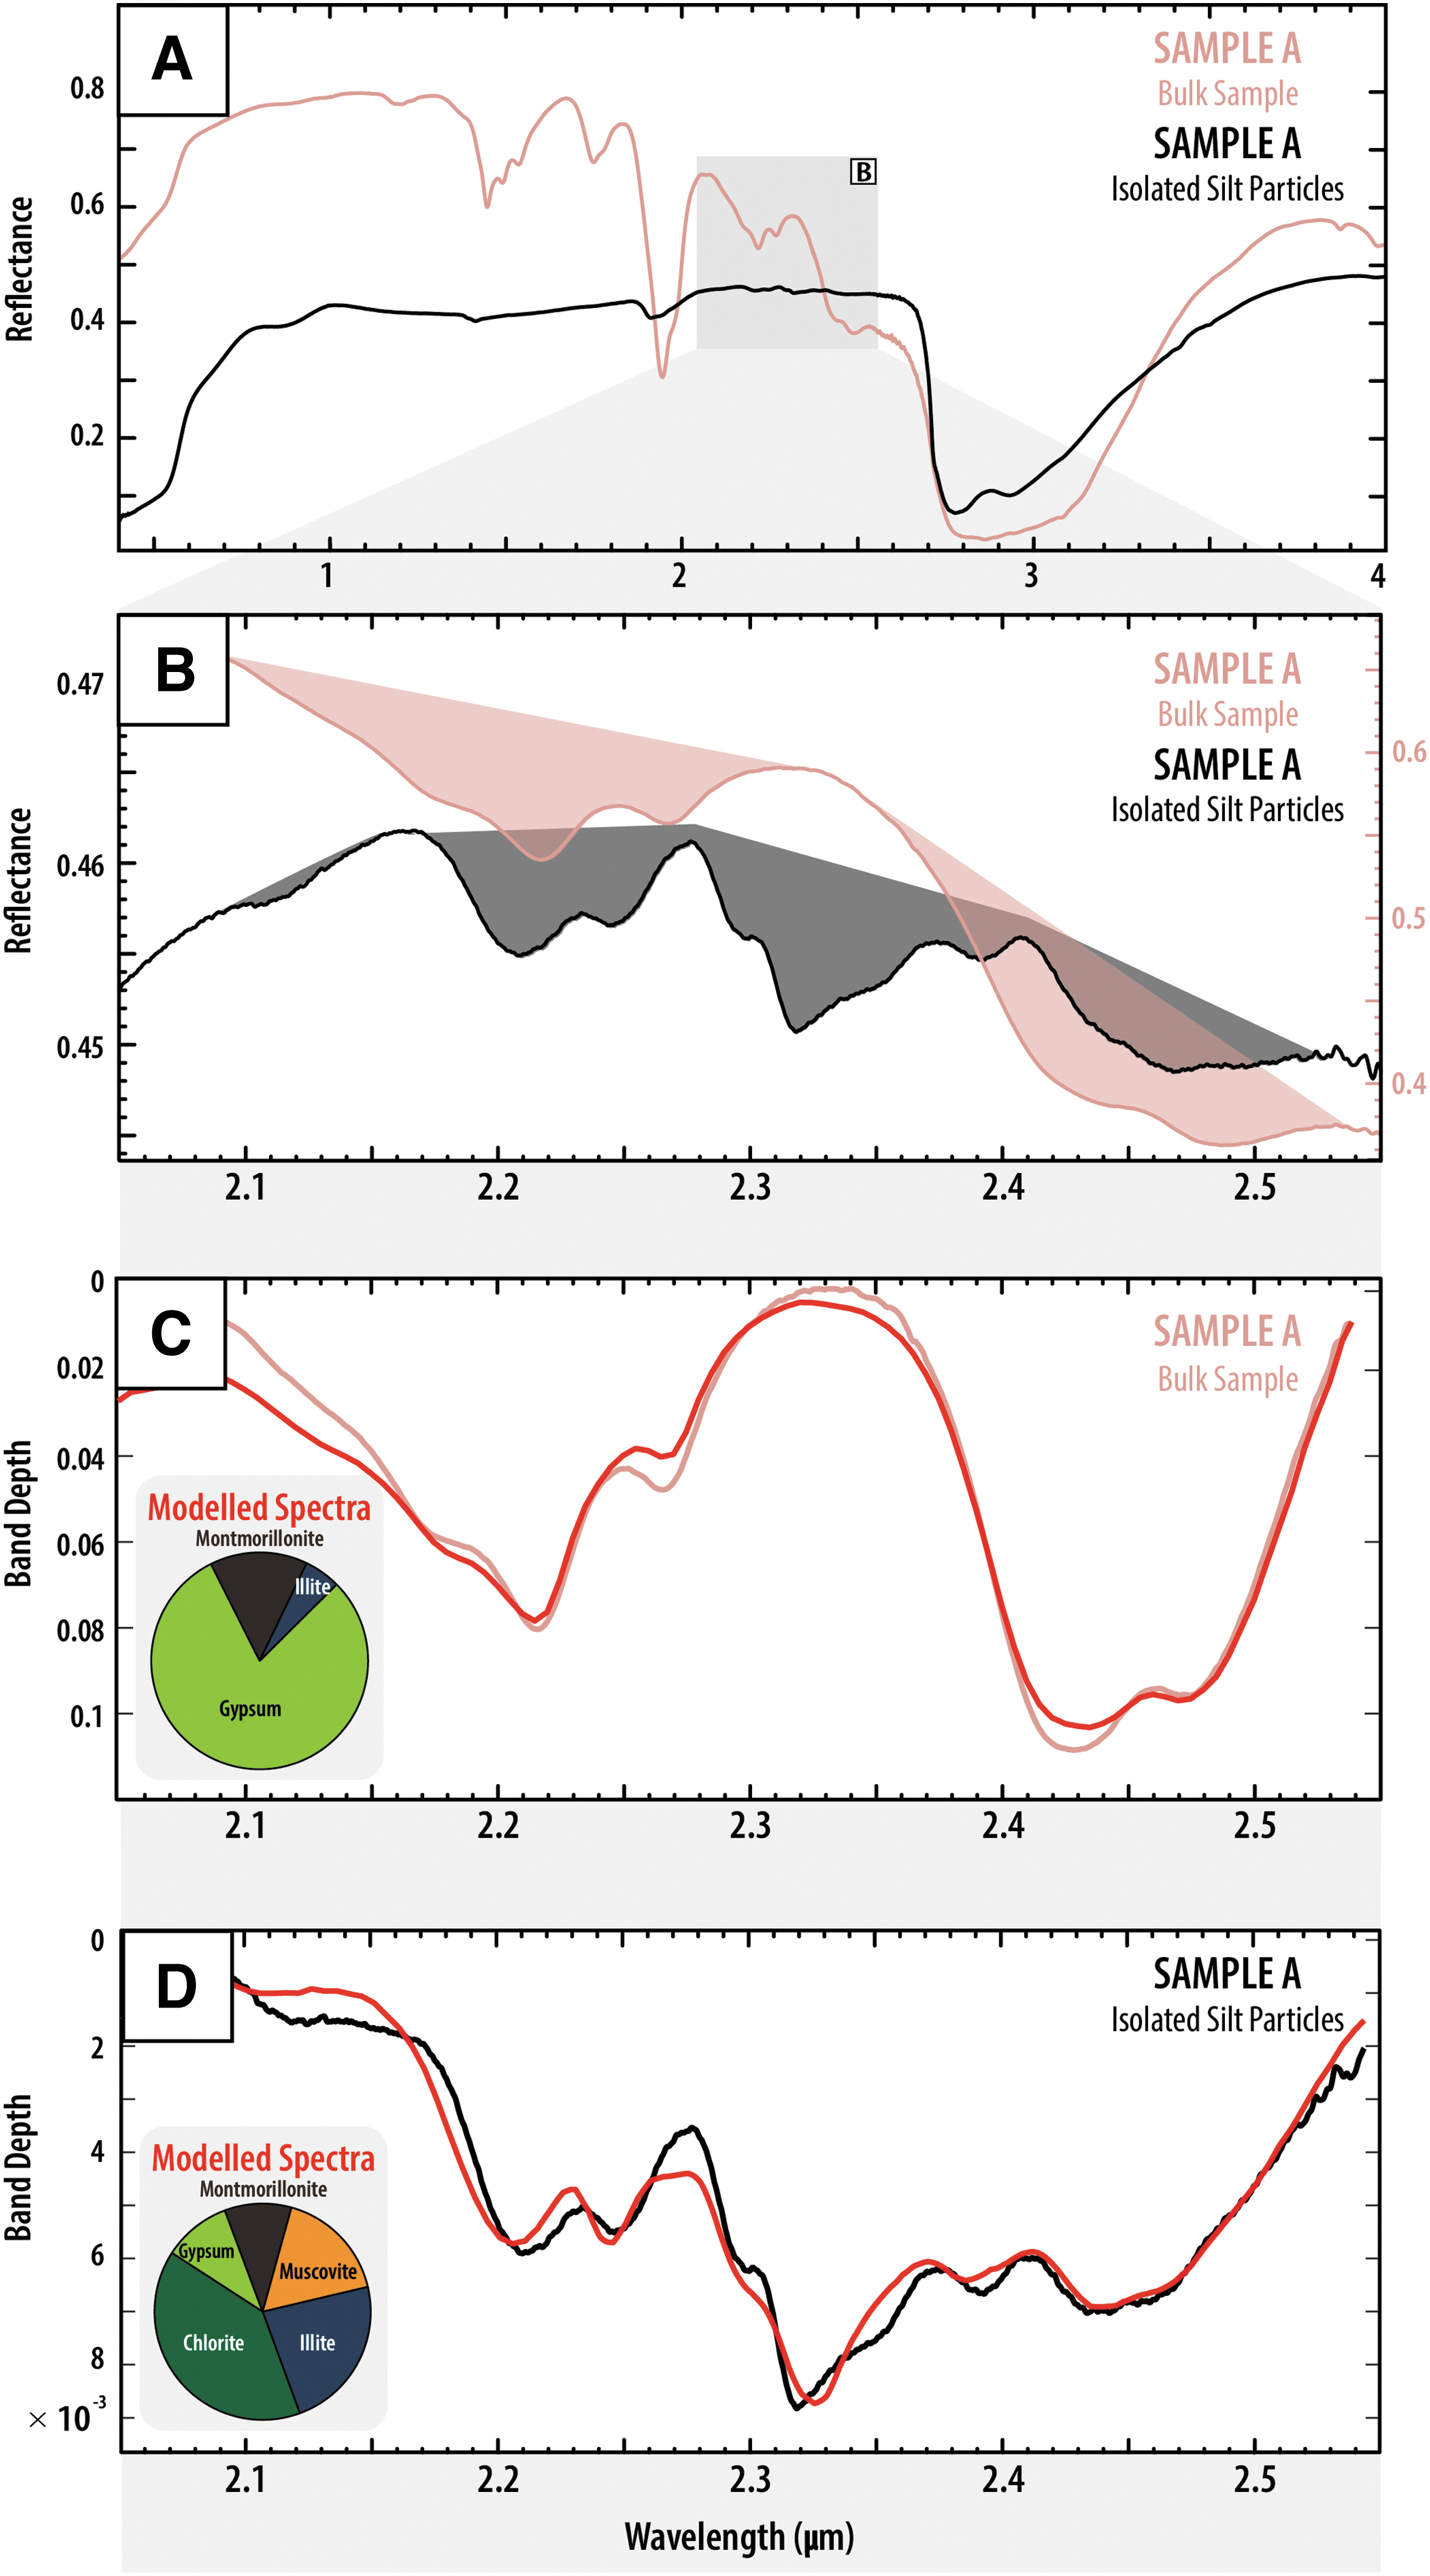
No other materials can be visually identified in bulk powder reflectance measurements from sample A with certainty. Subtle phyllosilicate absorption features cannot be reliably identified by qualitative visual inspection in spectra obtained from bulk sample powders. This is not only due to the minor constituency of the clay-bearing silt in the bulk rock sample but also due to the major constituent being gypsum, whose spectrum has absorption features in the wavelength region that overlaps diagnostic phyllosilicate absorption features (i.e., ∼2–2.5 μm; Fig. 3D).
Spectral contributions from the phyllosilicate- and hematite-bearing silt particles are only clearly apparent in reflectance measurements when the silt particles are physically separated from the light-toned gypsum laminations (black lines and shading, Figs. 3A, B and 6A, B). Diagnostic absorption features for gypsum are seemingly absent in powdered silt measurements (Fig. 3C)—most notably gypsum's prominent triplet centered at 1.45 μm is not present. Instead, spectra of isolated and powdered silt exhibit a complex combination of metal-OH features in the 2.05–2.55 μm wavelength region due to the presence of a variety of phyllosilicate minerals. Subtle absorption centers are observed at 2.12, 2.21, 2.32, 2.39, and 2.46 μm.
Fe oxide absorptions at 0.54, 0.68, and 0.88 μm are more strongly defined in silt spectra and are consistent with the continuum-removed features of the hematite reference spectrum (maroon shaded absorptions, Fig. 3D). Although quartz does not exhibit diagnostic absorption features in the VNIR wavelength region (Fig. 3C), XRD measurements and petrographic observations indicate that it is a primary constituent of silt particles. The presence of quartz appears to affect the broad, overall shape of silt spectra (compare quartz spectra in Fig. 3C with silt spectra in Fig. 3A).
Linear mixing of continuum-removed reference spectra to fit continuum-removed sample spectra in the 2.05–2.55 μm wavelength region (Fig. 6A through D) provides an additional qualitative assessment of each material's contribution to spectra of bulk rock and isolated silt samples. The best fit spectral model for bulk sample A (Fig. 6C) correctly identifies gypsum as the primary constituent in the sample. The best fit model correctly suggests the minor presence of phyllosilicates. However, identification of the specific phyllosilicates in bulk sample spectra may not be reasonable given that phyllosilicate spectral contribution to bulk sample powders is small. Other minor constituents such as feldspar and quartz do not exhibit diagnostic absorption features in the VNIR wavelength region and thus cannot be accurately accounted for in these spectral fits.
Of the minerals unambiguously identified in XRD patterns of isolated silt particles, the best fit spectral model (Fig. 6D) correctly incorporates the three most abundant minerals that are infrared active in the 2.05–2.55 μm wavelength region: chlorite, muscovite, and gypsum. Although not unambiguously identified in XRD patterns, model results also prefer the incorporation of montmorillonite over vermiculite. This result suggests that the d(001) peak observed in XRD patterns may reflect the presence of a mixed chlorite/smectite rather than a mixed chlorite/vermiculite.
Both bulk and silt spectral models incorporate contributions from illite despite the lack of evidence for the presence of this phase in XRD patterns. Its inclusion is likely due to the nonuniqueness of montmorillonite, illite, and muscovite metal-OH absorption features due to crystal structure similarities. Finally, spectral modeling does not provide an accurate assessment of the full mineral assemblage, as the additional primary constituents feldspar and quartz cannot be accounted for due to the absence of diagnostic absorption features in the VNIR wavelength region.
Reflectance measurements from powdered silt particles exhibit absorptions centered at 3.41 and 3.50 μm, indicating the minor presence of aliphatic organics. These absorptions are uniquely present in isolated silt particle spectral measurements and absent in gypsum-dominated bulk rock spectral measurements (Fig. 3A, B), suggesting silt–organic associations instead of evaporite–organic associations for this sample suite. Reflectance spectra of the silt particles acquired with the FTIR microscope provide additional information on the nature of the aliphatic organic material present in these particles, as indicated by absorptions centered at 3.41 and 3.50 μm (Fig. 7).
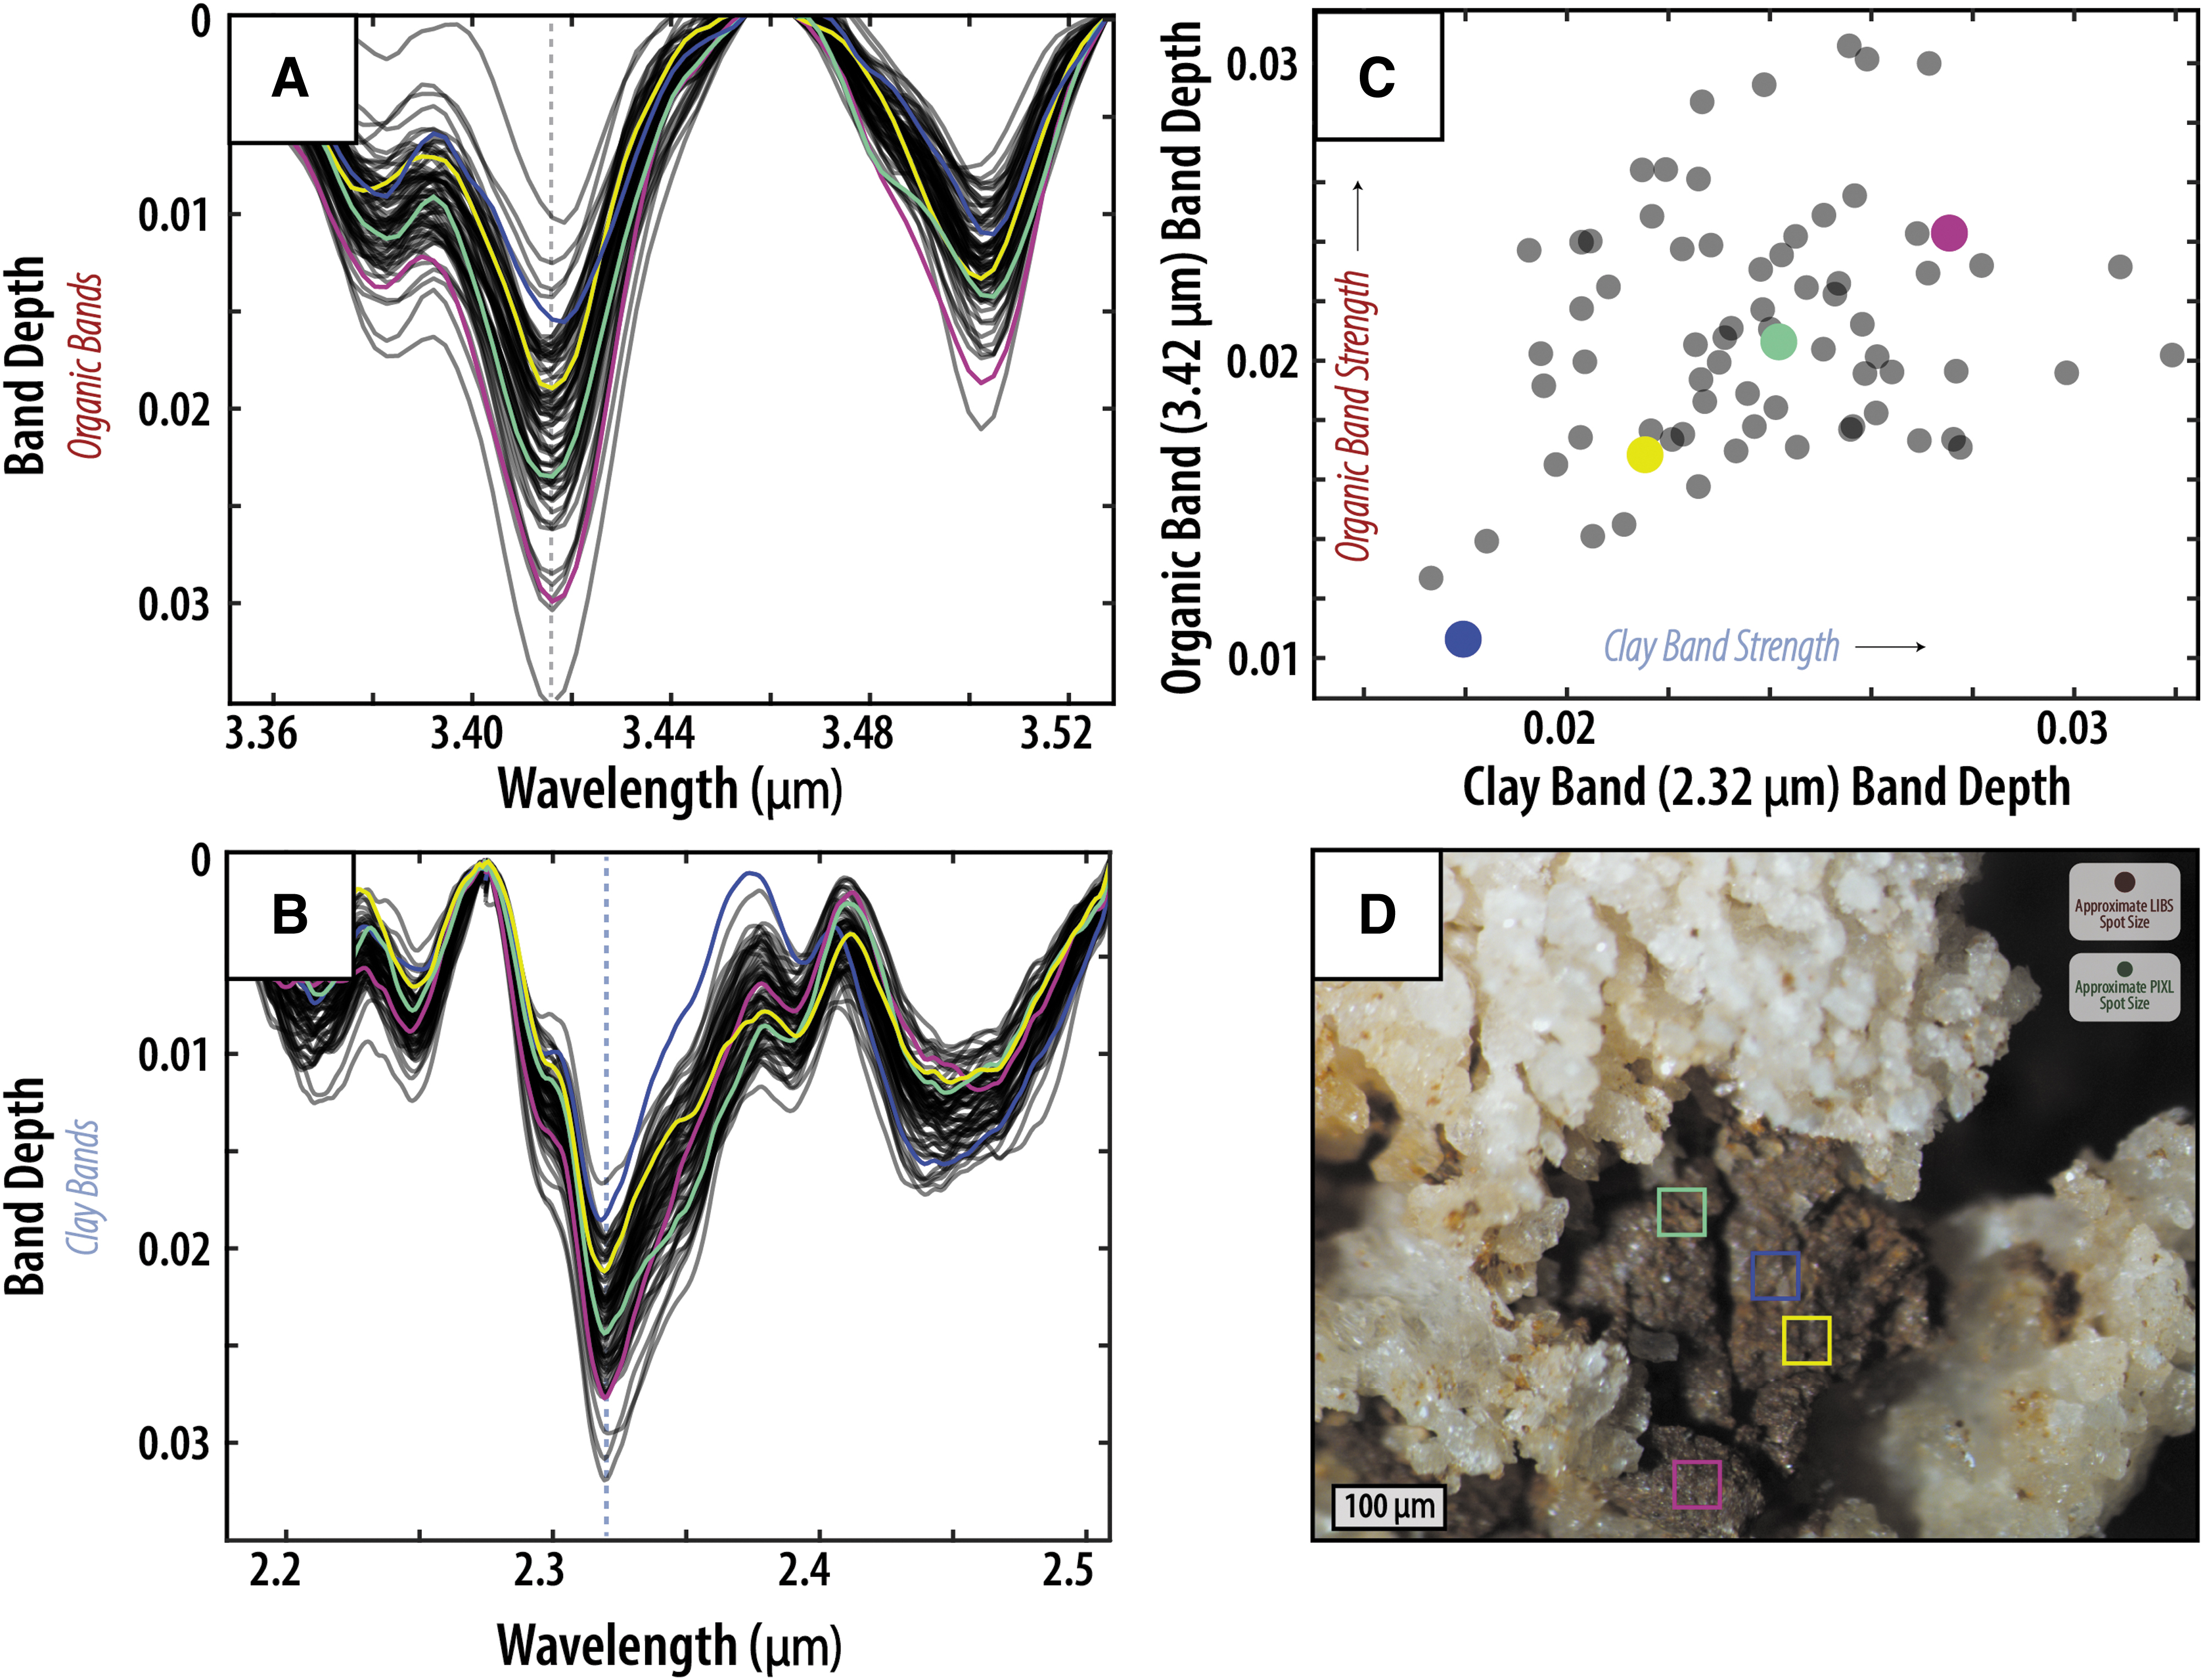
Spectral measurements obtained on isolated silt particles in dry sawn surface of sample A using an FTIR microscope.
Reflectance spectra from 72 total measurements across individual silt particles in sample A all exhibit absorptions due to organic molecules (Fig. 7A) and phyllosilicates (Fig. 7B). Cross plots of maximum band depth calculations for the 3.41 μm C-H vibrational feature (dashed line in Fig. 7A) and the 2.32 μm phyllosilicate metal-OH vibrational feature (dashed line in Fig. 7B) exhibit a weak positive correlation (Fig. 7C). This covariation of organic and phyllosilicate absorption band strength indicates that the organic material likely resides within—and in fact its preservation may be aided by—the clay mineral fraction of the silt particles. Similar to previous microscope FTIR results of Proterozoic shales from the MacArthur basin presented by Kaplan and Milliken (2018), these results highlight the utility of acquiring NIR-MIR reflectance spectra at small spatial scales to elucidate the relationship between organic and inorganic components of ancient sedimentary rocks.
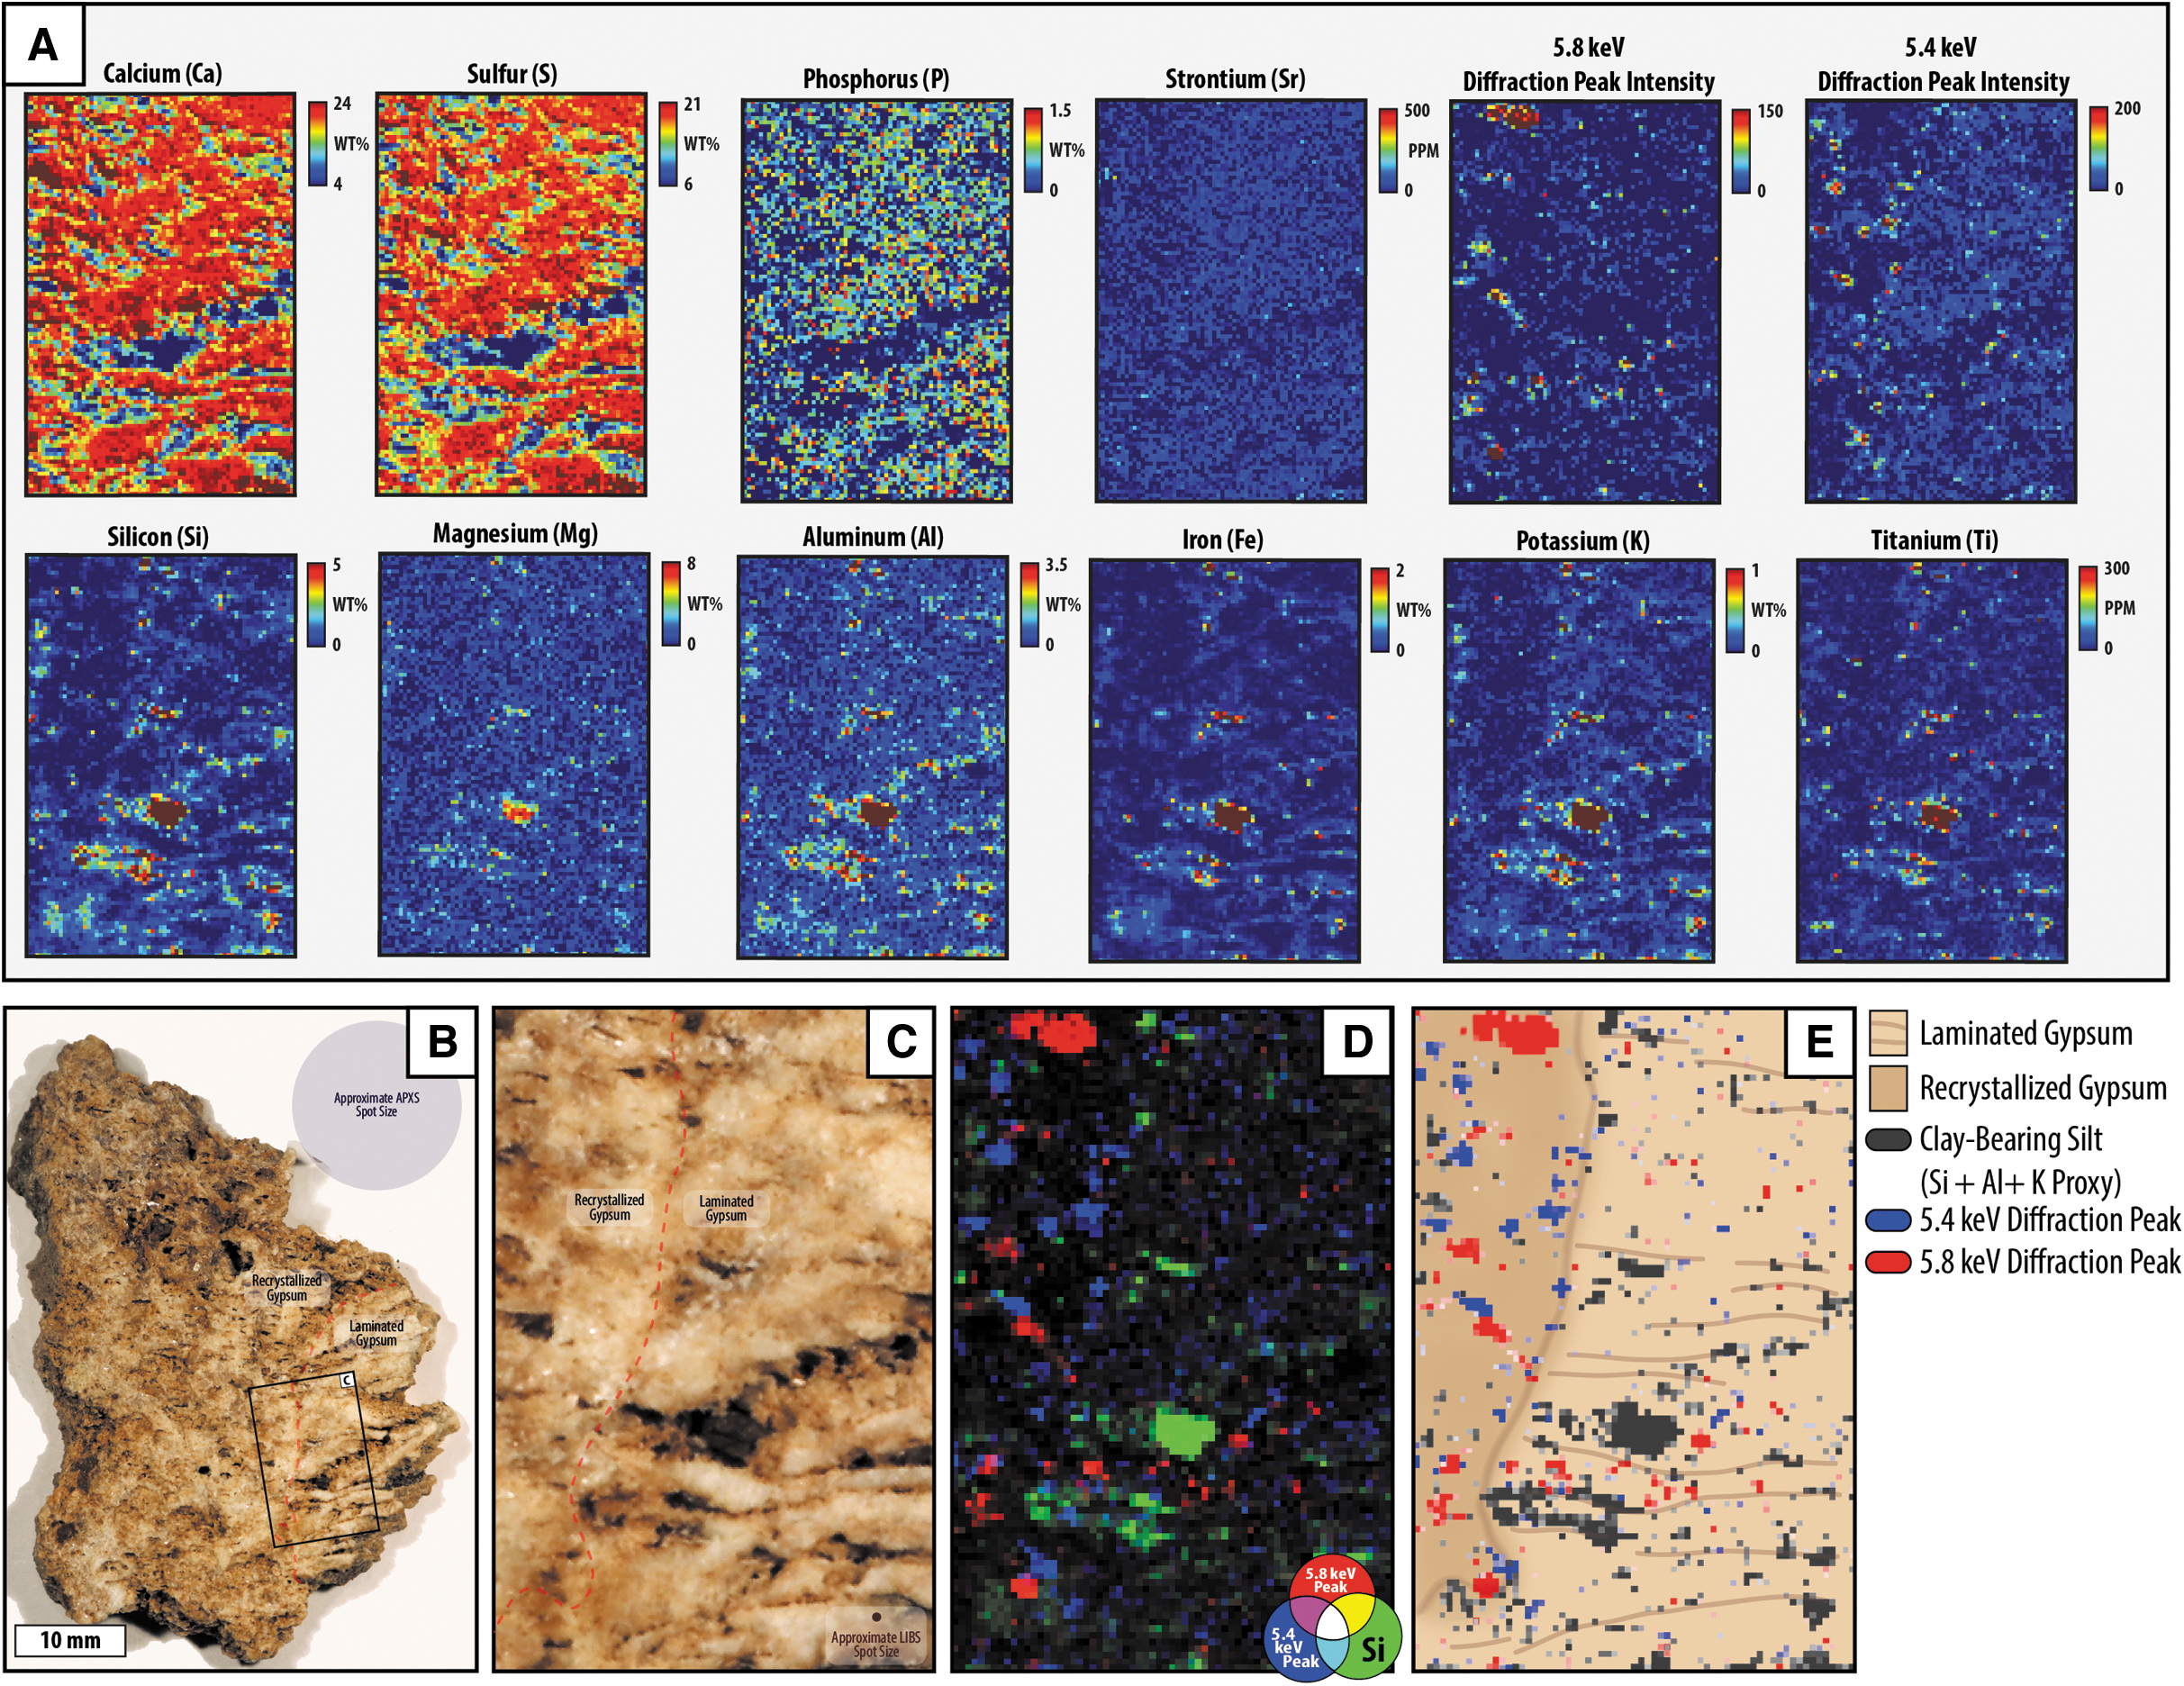
Although subtle in bulk powder XRD and reflectance data, silt is readily identified by elemental PIXL mapping across the surface of the intact rock sample (Fig. 8). Light-toned primary gypsum laminations clearly correlate with distinctly higher concentrations of Ca and S. Increases in these elements can be used to confidently infer the presence of a Ca-sulfate mineral (and when coupled with the reflectance spectra and/or XRD data, it can be further identified as gypsum). Dark-toned primary silt laminations clearly correlate with distinctly higher concentrations of Si, Al, Fe, K, Mg, and Ti. Silt with aggregated particle sizes of 300 μm (approximately two measurement points in a PIXL image) or larger can be visually detected in the PIXL images and confidently associated with increases in these elements.
Due to the nonuniqueness of element-to-mineral stoichiometric conversions, identification of quartz, clay, and iron oxide minerals from PIXLs elemental data alone is difficult but could be inferred ambiguously. The unambiguous identification of specific phyllosilicates (e.g., the discrimination of montmorillonite, illite, and chlorite) within the silt component is not possible due to nonunique variations in clay cation chemistry.
Despite these limitations, the PIXL mapping captures microscale chemical changes across diagenetic boundaries that are otherwise imperceptible by traditional powdered XRD and reflectance spectroscopy techniques. In sample A, for example, gypsum-recrystallized portions (left side of sample, Fig. 8B; upper left corner of PIXL scan, Fig. 8C) contain significantly less silt, where silt presence is inferred by co-increases in Si, Ti, Al, Fe, K, and Mg and by visual inspection. Silt laminations truncated by recrystallization display equally abrupt decreases in these elements across this diagenetic boundary. Furthermore, individual analysis of paired detector spectra for a given point measurement across the image of sample A also reveals spatially organized presence of two diffraction peaks, at 5.4 and 5.8 keV, respectively (Fig. 8A, D and Supplementary Appendix Fig. SA2C, D).
Mapped diffraction intensity for both peaks forms coherent irregular rounded to spherical shapes that occur exclusively within areas of Ca and S enrichment. Individual coherent areas of diffraction correspond to no obvious changes in color or texture in hand sample photographs, but they are distinct in the visibly recrystallized portions of sample A (i.e., left side of sample, Fig. 8B). Each individual coherent area of diffraction exhibits diffraction at one energy peak or the other, but not both. The nodular regions showing a diffraction peak at 5.8 keV tend to be slightly larger in size (∼1–2 mm in diameter) than the nodules that display 5.4 keV diffraction peaks (<1 mm in diameter). These observations likely reflect the presence of diagenetically recrystallized gypsum nodules in sample A composed of two distinct assemblages of larger crystals, each with a distinct diffraction peak (5.4 and 5.8 keV, respectively). Each respective nodule population is uniform in orientation relative to the PIXL instrument, but distinct in orientation relative to the other nodule population.
Deciphering key geological processes and conditions
The observations of sample A can reasonably be explained by four high-level ancient/paleoenvironmental processes and conditions, all of which are relevant to processes and conditions hypothesized to occur on ancient Mars: (1) primary evaporation of saline surface water; (2) intermittent delivery of primary loess/silt to this body of water via wind transport; (3) biosignature preservation enhancement via clay mineral presence; and (4) multiple generations of post-depositional fluid flow and water–rock interaction during burial and uplift. A systematic summary of the observations that support each of these paleoenvironmental/process interpretations are presented in Fig. 9. For each inferred process, we summarize below the efficacy of employed methods to resolve key supporting observations and discuss resulting implications for correctly identifying each geological process exclusively via rover-based methods.
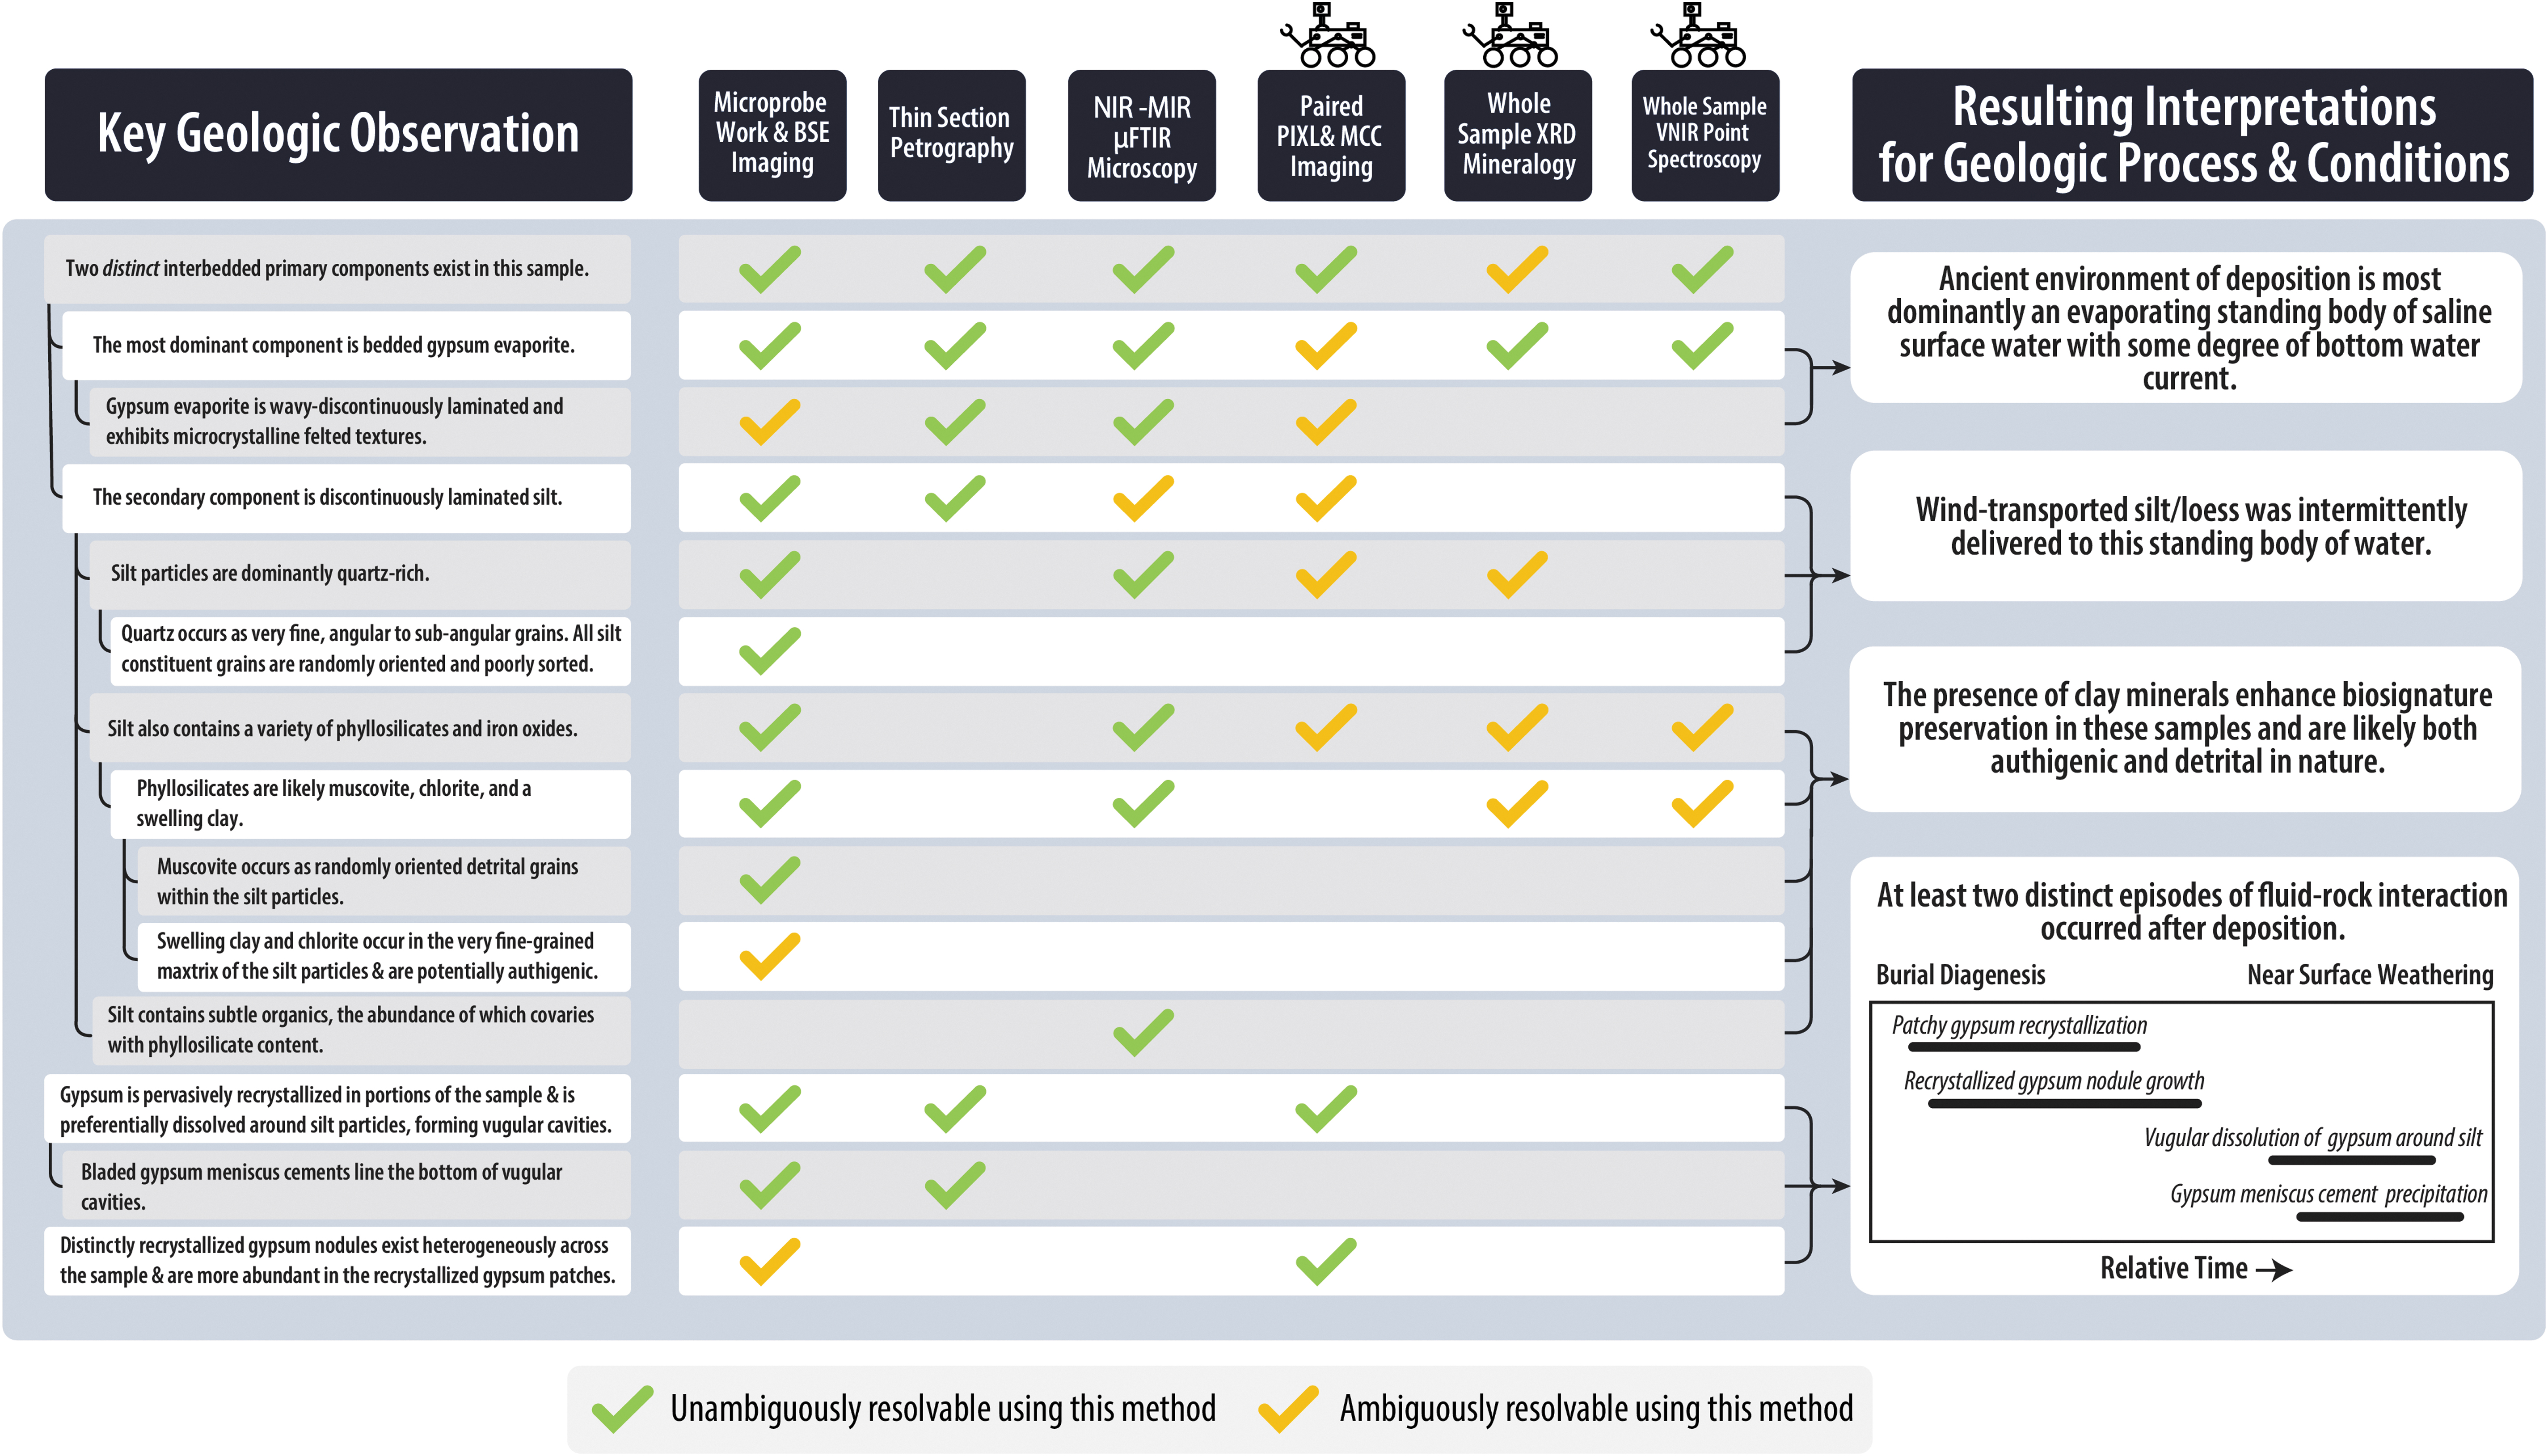
Summary of important geological observations and resulting geological process interpretations made for sample A. Left-most column summarizes the systematic observations made in this study. Connection lines indicate where some observations are nested. Middle column summarizes our evaluation of each employed method's ability to resolve each geological observation of interest. Rover icons indicate methods currently or previously employed on Mars rovers. Right-most column summarizes the four overarching geological process interpretations for sample A, with connecting lines indicating which geological observations from the left and middle columns were most diagnostic for each process.
The primary evaporation of saline surface water can be inferred most definitively by observed laminations composed primarily of gypsum evaporite minerals. Although every method of investigation, including all remote rover-based methods, can make this observation unambiguously, lamination textures are most definitively observed via thin section petrography and gypsum is diagnostically observed via XRD analyses. Thin section petrography is uniquely useful, however, for unambiguously identifying that the laminations are wavy-discontinuous and lack bottom-nucleated growth textures, indicating reworking of the precipitated gypsum by bottom-water currents.
Interbedding of windblown silt as a subtle additional primary depositional process
The intermittent delivery and subsequent deposition of a mineralogically complex and wind-transported silt/loess is ultimately most efficiently realized through combined (1) microprobe observations of randomly oriented and poorly sorted very fine grains within discontinuously laminated silt particles and (2) XRD analyses of quartz, clay, and iron oxide minerals in silt particles that have been mechanically/physically isolated from the bulk rock. These preparations/observations cannot be made by current rover-based remote instrumentation. However, silt composition could plausibly be constrained via careful coordination of co-located PIXL chemical maps with NIR-MIR μFTIR spectral maps.
Although μFTIR is not employed on rovers currently operating on Mars, the microimaging visible-infrared spectrometer MicrOmega was selected as part of the payload for ESA's ExoMars Rosalind Franklin Rover (Bibring et al., 2017). In agreement with the Mars 2020 Perseverance Rover Science Definition Team report (Mustard et al., 2013), the findings reported here further demonstrate the necessity of spatially resolved compositional and textural information to unambiguously identify diagnostic geological features in sedimentary rocks.
The eolian/loessoid transport mechanism of the silt is inferred via the presence of very fine, poorly sorted, and randomly oriented grain constituents in the silt that are only observable at the scale of BSE image analyses. Similarly, interrogating the authigenic or detrital nature of each phyllosilicate type, which has important implications for duration and timing of the persistence of water, remains ambiguous via microprobe data and ultimately requires further SEM study for a complete textural assessment. These findings highlight the need to return sedimentary samples from Mars for detailed and accurate paleoenvironmental interpretation.
Biosignature preservation potential and clay–organic relationships
NIR-MIR spectroscopic methods prove useful as the only method employed in this study capable of identifying subtle organic molecular biosignatures that likely reside within the clay fraction of silt particles. However, clay–organic relationships cannot be determined from reflectance spectra of the bulk sample. Making this interpretation requires physically separating the silt particles from the gypsum or, even more robust, the use of spatially resolved FTIR microscopy on an intact sample. This again highlights the utility of spatially resolved compositional and textural information to unambiguously identify diagnostic geological features in sedimentary rocks.
Although not tested explicitly in this study, it is anticipated that spatially resolved Raman measurements such as those acquired by the Scanning Habitable Environments with Raman and Luminescence for Organics and Chemicals (SHERLOC) instrument on the Perseverance Rover (Bhartia et al., 2021) would also reveal the presence of organics and their association with silt laminations in the samples studied here. However, the degree to which rover-based Raman data optimized for organic detection can be used to accurately identify different clay minerals is not yet clear.
Post-depositional diagenesis and later episodes of fluid flow
Evidence for post-depositional fluid-flow and related diagenetic alteration processes is inferred to have occurred as at least two separate events evidenced by four observations (summarized in the paragenetic sequence of Fig. 9). An earlier fluid flow event, likely during early burial diagenesis as is common in evaporite successions (Warren, 2016), first occurred to produce (1) the pervasive recrystallization of primary gypsum laminations that is most efficiently identified via optical microscopy and (2) the co-occurrence of subtle microscale nodules, identifiable by distinct diffraction peak intensities, within these recrystallized sample areas that are only identified by PIXL elemental mapping.
A later fluid flow event, likely in an unsaturated, near-surface weathering environment, then occurred to produce (1) vugular dissolution cavities around almost every silt particle that is best observed in thin section but can also be ambiguously resolved via PIXL imaging and (2) bladed gypsum meniscus cements lining the bottom of these vugular cavities that are prominent features in thin section and BSE images but which are entirely unresolved by all rover-based methods investigated in this study.
Implications for the rover exploration of Mars
Ultimately, the accurate interpretation of geological processes and their diagnostic microscale geological features from the martian sedimentary rock record rely not only on a single instrument but also on integrated rover payloads tailored for interrogating sedimentary rocks. As such, it is prudent to evaluate the extent to which past (Spirit and Opportunity) and present (Curiosity and Perseverance) Mars rover instrument payloads could reasonably constrain the microscale geological processes recorded by the rocks evaluated in this case study.
Historically, it has been difficult to unambiguously link compositional variations with small-scale textural attributes in sedimentary rocks observed by rovers on Mars (McLennan et al., 2005). Both Spirit and Opportunity, with identical instrument payloads, were capable of measuring bulk chemistry and detecting major mineral assemblages. Compositional constraints were determined by using a combination of Alpha Particle X-Ray Spectrometer (APXS) bulk elemental measurements, Mössbauer spectrometer detections of iron-bearing phases, and infrared thermal infrared emission spectrometer (mini-TES) measurements. For sample A, the collective use of Spirit/Opportunity's Rock Abrasion Tool (RAT) and the Microscopic Imager to capture high-resolution photographs of a fresh sample surface would likely reveal the textural interbedding of light- and dark-toned primary laminations, although likely not to the degree achieved by photographs of the dry-sawn surfaces presented in this study.
APXS bulk chemical measurements would overwhelmingly reflect the composition of the dominant light-toned gypsum laminations via elevated levels of Ca and S. It would be difficult to conclude definitively that the minor Si, Mg, Al, Fe, K, and Ti contributions to bulk chemical measurements are exclusively associated with the minor dark-toned laminations, let alone identify these laminations as windblown and organic-bearing silt with a complex phyllosilicate-rich mineralogy. Finally, the distinct chemistry of the subtle microscale nodules and cements identified in sample A would remain unresolved by these rover payloads. We conclude that, of the four major process interpretations identified above and summarized in Fig. 9, Spirit and Opportunity payloads would only be capable of observations that lead to the recognition of evaporative surface water processes in sample A. The other processes would be highly speculative at best with the available data.
In Gale Crater, the integration of data from Curiosity's APXS, Chemistry and Camera Laser-Induced Breakdown Spectroscopy (ChemCam LIBS), the Sample Analysis at Mars (SAM) and Chemistry and Mineralogy (CheMin) X-ray diffraction instruments have significantly improved our ability to evaluate subtle variations in the chemistry and mineralogy of rocks on Mars (Bristow et al., 2015). Nevertheless, definitively associating compositional variations obtained via these methods with textural lithologic information obtained from Mars Hand Lens Imager (MAHLI) and ChemCam Remote Micro-Imager (RMI) images remains a significant and ongoing challenge, particularly for understanding the distribution and specific chemistry of X-ray amorphous components that may act as cements (Siebach et al., 2017; Sun et al., 2019; Fraeman et al., 2020; Smith et al., 2021).
It is reasonable to assume that the textural interbedding of both light- and dark-toned primary laminations in sample A would be discernable in both MAHLI and RMI images, although the preferential weathering of the dark-toned silt—and the absence of a RAT to expose unweathered surfaces—could partially or fully obscure these already subtle laminations. MAHLI/RMI images of the interior walls of drill holes may be able to reveal the laminations in sample A.
Bedded gypsum evaporite could be unambiguously and confidently identified as the primary constituent in this sample. However, unambiguously extricating the subtle silt compositions from the overwhelmingly dominant gypsum evaporite compositions in bulk mineralogical measurements made by CheMin and bulk chemical measurements made by Curiosity's APXS instrument remain challenging. Partial mineralogy of the silt could be recognized in XRD measurements made on bulk powder drill hole samples, recognizing the most dominant constituents (quartz, feldspar, muscovite, and clinochlore), although it would be difficult to associate them exclusively and unambiguously with the dark-toned silt laminations without mechanical separation of each constituent.
Although challenging, it may also be possible to successfully target silt components with an LIBS point measurement and determine the silt's chemical profile. However, conclusively associating silt enrichment in Si, Mg, Al, Fe, K, and Ti in LIBS data with the presence of minerals identified in bulk sample CheMin measurements would remain speculative. Additional ambiguity is also introduced when correlating mineralogical abundances from CheMIN, derived from drillhole powders collected at depths of 3–5 cm, with elemental abundances derived from LIBS and APXS measurements obtained on the rock surfaces.
Characterizing the clay minerals as authigenic or detrital would also remain speculative without knowledge of the textural attributes of the clays and their relation to other phases in the samples. The SAM instrument suite would be able to identify the organic compounds present in sample A, and a reasonable interpretation would be that they are associated with clay minerals, but this association would not be definitive. Finally, although often large enough to be imaged by the possible ∼20 μm pixel scale of MAHLI, the nodules in sample A are often remarkably similar in color and texture to the surrounding bedrock and therefore could remain unresolved in images collected by the Curiosity Rover.
Encouragingly, the Perseverance Rover can integrate chemistry and inferred mineralogy with microscale texture to an unprecedented level for rocks in Jezero Crater. Perseverance can produce chemical and spectroscopic maps via the PIXL and SHERLOC instruments in coordination with the more rapid standoff point measurements made by SuperCam, which combines the LIBS capabilities of the Curiosity's ChemCam instrument with stand-off Raman spectroscopy, Time-Resolved Fluorescence spectroscopy, and VNIR spectroscopy.
As demonstrated in this study, PIXL maps confidently reveal two compositionally distinct interbedded components in sample A and the primary component can be clearly identified as calcium sulfate. Without diagnostic XRD mineral identification, the dominant presence of gypsum as the form of the calcium sulfate could likely be inferred from hydrogen peaks in SuperCam LIBS data and via coordinated Raman measurements made by SuperCam and SHERLOC. Unraveling the complex mineralogical profile of the silt would be difficult in the absence of XRD because element-to-mineral stoichiometry is likely to be nonunique, particularly with the significance presence of clay minerals.
Another complicating factor is that all rocks measured by CheMin in Gale crater exhibit a significant portion of X-ray amorphous material (Smith et al., 2021), and it is plausible that similar amorphous phases may be common in sedimentary rocks in Jezero crater. Without XRD measurements to confirm, it is likely that ambiguity will persist in determining whether cements, clasts, particles, and so on, that show enrichments in elements such as Si, Mg, Fe, Al, and Ca are true clay minerals or amorphous/poorly ordered phases. As such, the identification of specific clay minerals in the silt particles and their association with organics may remain ambiguous.
Our results also suggest that SuperCam bulk VNIR reflectance measurements of materials such as sample A may exhibit only subtle spectral evidence of clay minerals when present in low abundances, particularly when other NIR-active minerals such as gypsum are present in high abundances. Raman and infrared spectroscopy are highly complementary, and although the characterization of clay minerals via Raman is often complicated by fluorescence, it is possible that SuperCam Raman measurements that happen to coincide with silt-rich portions of the sample could also reveal the presence of clay minerals.
Additionally, the Perseverance Rover payload would be unable to recognize the randomly oriented and poorly sorted nature of the grains within the silt that are diagnostic of wind transport. Finally, while more delicate diagenetic textures such as meniscus cements would likely remain imperceptible by the Perseverance Rover payload, a key finding of this study is that PIXL is uniquely able to reveal otherwise imperceptible diagenetic nodules and correctly associate them with pervasive patchy gypsum recrystallization textures.
Conclusions
When sufficiently resolved to allow for accurate interpretation, sedimentary rock records can preserve information about the climatic evolution and habitability of a planet's surface through time. While certainly among the greatest technological achievements of planetary exploration, the exploration of Mars via rovers is not without limitations in terms of deciphering ancient geological processes. Almost two decades of rover exploration across sedimentary strata on Mars have undoubtedly increased our understanding of that planet's sedimentary rock record and the paleoenvironmental histories contained therein. This study provides a detailed analysis of the microscale observations that are required to accurately interpret important geological process in Mars-relevant siliciclastic-evaporite samples, and by extension the ancient environmental conditions in which they were formed.
We demonstrate that, while some geological processes could be reasonably hypothesized from currently employed rover-based methods, many of the microscale geological observations necessary for unequivocal determination of other paleoenvironmental processes cannot be resolved unambiguously in the samples via current remote instrumentation. However, in many cases, the detection of a diagnostic feature is not limited by the fundamental physics of a particular technique, but rather by the spatial resolution of an instrument and a rover's ability to enable accurate petrography through remotely coordinated microscale measurements of composition and texture.
Recognition of diagnostic microscale geological features is enhanced by the ability of remote instruments to spatially resolve compositional information—both elemental and mineralogical—in coordination with high-resolution textural imaging. In the future, our understanding of martian surface evolution will greatly benefit from continued advancements in the ability of rovers to combine spatially resolved compositional measurements with high-resolution imaging of intact microscale sedimentary textures that are diagnostic of ancient depositional and diagenetic conditions.
Open Research
All data used in this work are available within the appendix files.
Footnotes
Authors' Contributions
M.J.M.: Conceptualization, data curation, formal analysis, funding acquisition, investigation, methodology, project administration, software, validation, visualization, roles/writing—original draft, writing—review and editing. R.E.M.: Conceptualization, data curation, formal analysis, funding acquisition, investigation, methodology, project administration, resources, software, supervision, validation, visualization, writing—review and editing. J.E.H.: Data curation, formal analysis, methodology, software, supervision, validation, writing—review and editing. K.M.R.: Data curation, formal analysis, investigation, methodology, project administration, software, supervision, validation, visualization, writing—review and editing.
Author Disclosure Statement
No competing financial interests exist.
Funding Information
This work was supported by the Future Investigators in NASA Earth and Space Science and Technology (FINESST) program (Grant No. 80NSSC20K1375).
Supplementary Material
Supplementary Appendix A
Supplementary Appendix B
Supplementary Appendix C
Supplementary Appendix Figure SA1
Supplementary Appendix Figure SA2
Supplementary Appendix Table SA1
Supplementary Appendix Table SA2
Associate Editor: Jack Mustard