
Abstract
Background:
Loneliness is a significant yet under-investigated health risk for Autistic individuals. It is important that loneliness measures are valid for use among both Autistic and non-autistic adults. This study aimed to (1) adapt the UCLA Loneliness Scale for Autistic adults, (2) provide evidence based on test content for the adapted scale, (3) provide psychometric evidence using an international sample, (4) investigate differential item functioning (DIF) between Autistic and non-autistic adults, and (5) assess convergent and discriminant evidence with other loneliness and well-being variables.
Methods:
To build evidence for test content, we thoroughly examined the UCLA Loneliness Scale items in partnership with Autistic individuals. As the scale was already designed for non-autistic people, we made adaptations to ensure there was evidence for use with Autistic people. This process included cognitive interviews (n = 10) and expert reviews (n = 13). Following the adaptation phase, we gathered data (N = 628) to demonstrate a degree of psychometric evidence using item response theory to assess psychometric properties, including autistic-based DIF. We used latent variable modeling to assess convergent and discriminant evidence.
Results:
The UCLA Loneliness Scale—Modified (UCLA-m) resulted from the adaptation phase and was used to survey 628 adults. We found UCLA-m has sufficient evidence for being essentially unidimensional, with total scores demonstrating preliminary evidence of high reliability, internal validity, and convergent evidence. Autistic adults in our study reported higher levels of loneliness, social anxiety, and depression compared with non-autistic adults.
Conclusion:
The evidence from this study serves as a precursor for studying loneliness in Autistic adults and provides evidence about the validity of a measurement tool that will enable further research into better supporting Autistic adults who are experiencing loneliness. Additionally, many of the adaptations made during this process will increase the overall accessibility of the UCLA-m for all individuals, not just Autistic adults.
Community Brief
Why is this an important issue?
Loneliness can have serious health consequences, such as depression, obesity, and heart disease. Studies show that Autistic individuals often feel lonelier than those who are not Autistic. To address this, we needed a better tool to help health professionals and researchers assess loneliness in Autistic adults. Currently, loneliness questionnaires are not adapted to Autistic people, so the main focus of the study was to make sure the scale could be used with either someone who was Autistic or someone who was non-autistic.
What was the purpose of this study?
This study aimed to adapt a widely used loneliness questionnaire, originally designed for the general population, to be more suitable for Autistic adults in addition to non-autistic adults. This was done by talking with Autistic people, their families, and researchers to ensure the tool was user-friendly and relevant.
What did the researchers do?
To make the questionnaire more autism friendly, we engaged directly with Autistic people to gather their insights on loneliness and how it should be described. This feedback led to the modification of the UCLA Loneliness Scale—Modified (UCLA-m). The language was simplified and made more relatable to Autistic experiences. A total of 23 contributors, including Autistic individuals, researchers, and family members, provided input on these adaptations. Then, we tried the new scale with 628 people including 416 Autistic people and 212 non-autistic people.
What were the results of the study?
We learned that Autistic people in our study reported higher levels of loneliness than people who were not Autistic. We learned that the UCLA-m is a reliable and valid method for measuring loneliness in Autistic adults. Reliable means that the survey gives consistent scores every time it is used. A valid tool measures what it is supposed to measure. This means that the UCLA-m can be confidently used by both Autistic and non-autistic individuals.
What do these findings add to what was already known?
The findings align with previous research indicating that Autistic people often experience more loneliness, which is linked to anxiety and depression. The major contribution of this study is the creation of the UCLA-m, which was developed with direct input from the Autistic community. This tool allows for a better understanding of loneliness in Autistic adults and can help guide efforts to reduce loneliness in both Autistic and non-autistic people. Importantly, the adaptations made the survey more accessible for everyone, not just Autistic individuals.
What are the potential weaknesses in the study?
While the study included a diverse group of participants from various countries and age-groups, the sample was not fully representative. A significant portion of participants were women (69.6%) with high levels of education, and only a small number (1.6%) reported having an intellectual disability. Thus, the findings may not fully represent the experiences of all Autistic individuals.
How will these findings help autistic adults now or in the future?
This study is significant because it provides a validated tool to better understand and measure loneliness in Autistic adults, a group often experiencing high levels of loneliness. The UCLA-m can be used by communities and researchers to explore ways to reduce loneliness, ultimately improving the well-being of Autistic individuals.
Introduction
Loneliness has surged to the forefront of global health concerns, recognized as an epidemic with profound health and economic implications. 1 According to a longitudinal survey conducted between 2014 and 2018 in Australia, 34% of adults have reported experiencing either episodic (over transient periods) or chronic (over a period of time) loneliness, highlighting the pervasive nature of this issue. 2 Certain population groups may be even more likely to experience loneliness. For instance, emerging evidence has indicated that Autistic individuals encounter heightened and more frequent experiences of loneliness compared with their non-autistic counterparts.3–6 Many Autistic people desire social connection but can experience challenges in relationships, 7 contributing to increased loneliness and social isolation.3,6,8–10 This increased risk is concerning as loneliness is linked to significant mental health concerns and poor well-being. 8 , 9 For Autistic adults, research has shown that higher levels of self-reported loneliness are related to elevated levels of depression, anxiety,6,7,11,12 and suicidal ideation, 13 as well as substance use and a range of physical health conditions14,15 such as obesity, increased incidence of cancer, cardiovascular diseases, 14 , 16 and higher mortality. 11 Finally, loneliness is uniquely associated with social anxiety; in a 2016 longitudinal study, Lim and colleagues 17 found social anxiety to be the only predictor of future loneliness, a finding that may have implications for Autistic people who often experience social anxiety. 18
Although researchers are starting to understand variations in the extent and nature of loneliness experiences among Autistic individuals as a group, there is still much to learn about the disparities within these experiences in Autistic adults. To successfully achieve this goal, reliable and valid data must be intentionally collected from Autistic adults using a range of quantitative and qualitative methodologies (see review 1 ). Unfortunately, the quantitative research on the loneliness experiences of Autistic adults to date has relied on loneliness measures that were developed for the general population and have not yet been validated for use with Autistic adults. 3 This substantially limits this critical line of research and may put into question the findings from studies that previously relied on such tools.19–20 In fact, Grace and colleagues 21 investigated the viewpoints of 203 Autistic individuals from the United Kingdom regarding two commonly used loneliness questionnaires and found that these measures contained difficult item wording (e.g., confusing terms and phrases), and the items did not fully capture the concept of loneliness as experienced by Autistic individuals. 21 This finding is consistent with feedback from Autistic adults in other domains (e.g., quality of life 22 ). It cements the importance of devoting research that focuses on gathering psychometric evidence to use patient-reported outcome measures (PROMs) within critical mental health domains, such as loneliness. Furthermore, advice from Nicolaidis and colleagues 19 suggests that instruments for the general population are regularly “inaccessible to Autistic adults or people with intellectual disability” (p. 67). Across studies, community partners in their study commonly expressed concerns about (1) language complexity and pragmatics, (2) Likert scales, (3) anxiety about providing accurate answers, (4) the potential for varied responses depending on different situations, and (5) the inability to fully capture constructs. 19 Additionally, Jones 20 identified the need to ensure these instruments are not only reliable and valid by psychometric standards but also relevant to Autistic people.
Purpose of the study
The purpose of our study was to create a modified version of the UCLA Loneliness Scale that would be suitable for both Autistic and non-autistic individuals with intentional codesign elements. The overarching aim was to adapt a commonly used PROM (i.e., UCLA Loneliness Scale) for use with Autistic adults (the scale adapted for this study is called the UCLA-modified Loneliness Scale; UCLA-m Loneliness Scale). To do this, we sought to provide evidence of test content for the adapted scale through cognitive interviews and expert review processes and then provide psychometric evidence based on an international sample of Autistic and non-autistic adults. Psychometric evidence for the adapted scale included item response theory (IRT) analyses to examine the internal structure and an investigation of differential item functioning (DIF) between Autistic and non-autistic adults. These IRT analyses fulfill the same purposes as factor structure and measurement invariance testing using confirmatory factor analysis. Finally, we provided correlational evidence (convergent validity) by examining the relationship between loneliness and well-being variables, including social anxiety 17 and depression,7,9,11,23,24 which are posited to be positively correlated, as suggested by evidence from previous research. We also predict scores from the UCLA-m Loneliness Scale will be higher for Autistic people in our study compared with non-autistic people.7,25 Our study, therefore, was guided by two research questions: (1) Do items on the UCLA-m Loneliness Scale reflect a unidimensional structure? and (2) Do items on the UCLA-m Loneliness Scale manifest DIF between Autistic and non-autistic participants? Additionally, we tested the hypothesis that scores on the UCLA-m Loneliness Scale would have a strong positive relationship with scores from a social anxiety scale and a scale measuring depression. We also expected Autistic participants to self-report higher levels of loneliness compared with non-autistic participants.
Methods
Community involvement statement
We intentionally used community engagement throughout the study’s life cycle, as our team was a mixed-neurotype team where Autistic and non-autistic researchers worked together to answer a question of interest that was common to all team members.26–27 The research reflects participatory community engagement at the “engaging” level because our research team initiated the research project and invited the community to work with the team at different stages. 26 The conceptualization for the project came from members of the research team, including a parent of Autistic individuals (V.G.), an autism researcher and sibling of an Autistic young adult (A.M.A.L.), an autism researcher (R.Y.C.), and two Autistic researchers (C.E. and K.G.). M.H.L. served as a content expert for the area of loneliness and also has experience as a therapist working with Autistic individuals. D.M.D. does not bring any direct connection to autism but collaborated with M.D.T. (a parent of an Autistic individual) to serve as the team psychometricians. Throughout the study, the first and second authors worked as an Autistic (C.E.) and non-autistic (A.M.A.L.) pair to break the cycle of scale development through an exclusively neurotypical lens. Community members were included in the cognitive interviewing and expert review phases. Both Autistic researchers and community members influenced the language used in the study’s design, the research questions, all phases of scale adaptation, and the interpretation of the findings.
Procedure
The scale adapted for our study is the UCLA Loneliness Scale Version 3, a 20-item scale designed to measure subjective feelings of loneliness and social isolation (see Table 1). 28 To build evidence for test content, our research team conducted a thorough examination of the items of the UCLA Loneliness Scale Version 3. 28 This process included a cognitive interview and an expert review process where Autistic adults, parents/caregivers of Autistic people, psychometricians, and experts in loneliness contributed to the adaptation. Based on information gathered during this examination, we adapted the items to ensure they were easier to understand and reflect the loneliness construct.
Adapting the UCLA Loneliness Scale Version 3 to the UCLA Loneliness Scale—Modified
Note. The UCLA items with an asterisk are reverse scored; For both the original and the adapted measure, high scores indicate higher levels of self-reported loneliness; In the study, the phrases that are underlined in this table were highlighted in blue in the participants version to indicate a hotlink; Participants responded with a 4-point Likert-type response scale ranging from “never” to “often.”
Following ethics approval with the Griffith University Human Research Ethics Committee (project number 2023/363), we recruited participants for each stage of feedback (see Fig. 1) through social media and mailing lists, autism support networks, and word of mouth. We targeted an international audience to recruit a diverse sample of participants, enhancing our psychometric study’s cultural relevance and generalizability. Interested participants could access information about the study on a website, contact the research team for more information, or use a QR code and link to access the participant information sheet and survey. Participants were eligible for all stages of the project if they (1) spoke English, (2) had a professional diagnosis of Autism or self-identified as Autistic, and (3) were 18 years of age or older. For all surveys in this study, we collected and managed the data using Research Electronic Data Capture (REDCap) hosted at Griffith University. REDCap is a secure, web-based software platform designed to support data capture for research studies, providing (1) an intuitive interface for validated data capture, (2) audit trails for tracking data manipulation and export procedures, (3) automated export procedures for seamless data downloads to common statistical packages, and (4) procedures for data integration and interoperability with external sources.29,30 Participants were given the participant information statement at the beginning of the survey and asked to provide informed consent before proceeding to the survey. Participants who completed the survey were given the option to select one of five international charities to receive a $2 donation (AUD) on behalf of the research participant.
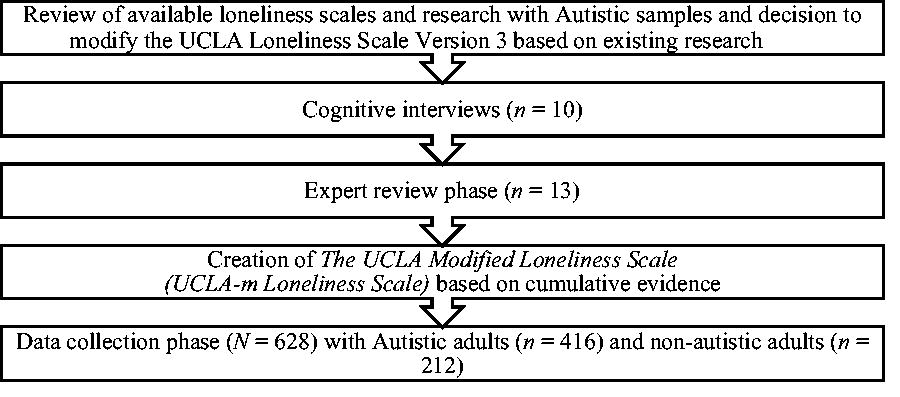
Process for gathering psychometric evidence to adapt a measure of loneliness that is accessible for Autistic adults.
Scale adaptation procedures
Cognitive interviews
Following a detailed review of the findings of Grace and colleagues 21 and critical discussions about the adaptations that may be needed by members of the research team, a stage of cognitive interviewing took place to review the 20-item UCLA Loneliness Scale. Cognitive interviews are a process where the target participants, in this case Autistic adults, participate in “think-aloud” interviews with a researcher to provide insight on their thinking. At the same time, they read and respond to a questionnaire or survey. The interviewer uses a structured protocol (see Supplementary Data) and probes the participant for more information when items or item phrasing are identified as confusing or challenging.31–32 As participants “think aloud,” we noted consistency with responses and problematic wording or phrases of the loneliness items. In addition to item-level feedback, participants were asked to define loneliness broadly and reflect on the scale as a whole, determining if any element of loneliness was left out from their perspective. Each interview was carried out remotely via video conferencing and led by the first author, who possesses expertise in this interviewing method but who does not identify as Autistic. Therefore, the second author, an Autistic researcher, was responsible for note-taking and posed clarifying questions to ensure appropriate interpretation of the responses through an Autistic lens.
In total, 10 Autistic adults from three countries participated in the cognitive interviewing phase, including 6 participants who identified as female and 4 who identified as males. Two participants had an intellectual disability. Initially, we conducted six interviews and analyzed the data, discussing each stage with the larger research team. Then, we conducted four more interviews until no additional modifications were suggested. On the basis of these interviews, of the 20 items, 10 items were recommended for adaptation (UCLA Items 1, 2, 5, 6, 8, 12–16, and 19) and three items were removed (UCLA Items 9, 17, and 20), resulting in a remaining 17-item UCLA-m Loneliness Scale (see Table 1). Despite these revisions to item language, many phrases frequently used in the UCLA items (i.e., “people in your life”) continued to be problematic for cognitive interview participants. Participants noted that providing a single answer for an item containing those phrases was challenging, as it required choosing one answer to reflect diverse relationships such as friends, family, and work colleagues. To help address this problem, we added “hotlinks” (the ability for participants to click on a phrase or word to obtain more information) to frequently used terms to reduce confusion around these phrases. To increase accessibility, the survey also included an audio option, and hotlinks were included as recommended by Nicolaidis and colleagues 19 as a resolution to challenges with language complexity and anxiety associated with how to respond. The participants did not identify any specific need for additional items; instead, they discussed related constructs to loneliness that were important to them, including Autistic burnout, companionship with animals, and camouflaging.
Consultation with experts
Next, 13 participants responded to a REDCap survey hosted at Griffith University and served as expert reviewers for the now 17-item UCLA-m Loneliness Scale. Categories of experts were chosen to identify participants who shared similar demographics as future participants and as individuals who were specialists in the field and included Autistic adults (n = 5), researchers with expertise in loneliness (n = 2), psychometrics (n = 2) or autism (n = 1), and parents/carers of Autistic adults (n = 3). After reading a participant information sheet and completing a consent form, we asked experts to review the items on the scale by rating them using a 4-point Likert-type response format for both (1) clarity and (2) importance to the construct of loneliness. Participants could also provide open-response feedback about the items. After receiving data from all participants, we examined the scores and open-ended responses for both items addressing clarity and importance. Specifically, we flagged items with scores <2 or items that were identified as problematic by 50% or more of the expert reviewers. Items that were flagged were then discussed with the larger research team. Following the interpretation of the feedback from the experts as well as consultation with the larger research team, two items were adapted (UCLA Items 5 and 17), additional hotlinks were added to increase clarity, and a 17-item UCLA-m loneliness scale went on to our data collection phase (see Table 1).
Participants
Participants of our study were 628 adults (65.59% self-identified as female, Mage = 41.23) including 312 (49.68%) adults who self-reported a professional diagnosis of autism, 104 (16.56%) who self-identified as Autistic, and 212 (33.76%) who were not Autistic. All participants were required to be English-speaking. Our sample consisted of participants from 25 countries including Australia (n = 402), Canada (n = 13), Ireland (n = 7), New Zealand (n = 5), United Kingdom (n = 64), and the United States (n = 131; see Table 2 for full demographic information). There were 160 participants with missing data, and the rates of missing data by scale varied from 1.1% to 14.6%.
Participant Demographics
Participants could select more than one cooccurring condition. They could also select “other” and fill in an open response with their specific cooccurring condition(s).
Instruments
UCLA Loneliness Scale— Modified
The UCLA-m was adapted from the UCLA Loneliness Scale Version 3. 28 For this instrument and our modified instrument, participants respond using a 4-point Likert-type response format (never = 0, rarely = 1, sometimes = 2, and always = 3). Negatively oriented items are reverse-coded before summing item scores to create a total scale score. The UCLA Loneliness Scale Version 3 was revised from the UCLA Loneliness Scale 33 and Revised UCLA Loneliness Scale 34 and was chosen because it has been most frequently used with Autistic people. 21 Russell 28 reported high internal consistency for the Revised UCLA Loneliness Scale Version 3 across multiple studies (Cronbach’s α = 0.89–0.94) and reported an acceptable test–retest correlation (r = 0.73). Our sample’s overall coefficient alpha for UCLA-m was 0.94 (Autistic α = 0.89; non-autistic α = 0.89).
Social and Emotional Loneliness Scale for Adults
The Social and Emotional Loneliness Scale for Adults (SELSA-S)35,36 is a 15-item self-report instrument designed to measure loneliness. Participants respond in a 7-point Likert-type format ranging from “strongly disagree” to “strongly agree.” The instrument assesses three factors of loneliness, including social, family, and romantic. A higher total score on the SELSA-S represents higher levels of loneliness. An example item reads, “I feel part of a group of friends” (social subscale). DiTommaso and colleagues 36 reported internal consistency ranging from α = 0.87 to 0.90, evidence for validity based on relationship to a version of the UCLA Loneliness Scale, 34 and evidence for a three-factor solution across items representing the three subscales. The SELSA-S has been used in Autistic samples, 37 although the instrument currently does not have validity evidence for use with Autistic samples. Sample coefficient alpha in the present study was 0.890 for the social factor (α = 0.852 Autistic; α = 0.883 non-autistic), 0.903 for the family factor (α = 0.884 Autistic; α = 0.891 non-autistic), and 0.919 for the romantic factor (α = 0.906 Autistic; α = 0.934 non-autistic).
Social Interaction Anxiety Scale—Straightforward items
The Social Interaction Anxiety Scale – Straightforward (S-SIAS)38–39 describes anxiety-related reactions to a variety of social interaction situations to measure social anxiety. Respondents use a 4-point Likert-type response format that ranges from “not at all” to “extremely.” It has been used with Autistic adults.40–41 An example item reads, “I become tense if I have to talk about myself or my feelings.” The authors reported internal consistency (α > 0.89) for the straightforwardly worded items. 39 Overall sample reliability was 0.951 (Autistic α = 0.916; non-autistic α = 0.953). Importantly, we used the full scale (15 items), but following feedback from several participants who accurately felt the item was not inclusive, we removed Item 14 (“I have difficulty talking to attractive persons of the opposite sex”). This decision is consistent with authors Linder and colleagues 40 who suggest a nonheteronormative phrasing of Item 14 (“I have difficulty talking to attractive persons of the sex/sexes that I am interested in”). At the time of our survey, we used the original item wording but dropped the item postdata collection. We believe strongly that future iterations should always use the nonheteronormative phrasing.
Patient Health Questionnaire
The Patient Health Questionnaire (PHQ-9) 42 was a 9-item norm-referenced instrument used to measure depression symptoms. The PHQ-9 uses a 4-point Likert-type response format ranging from “not at all,” which has a score of “0,” to “nearly every day,” which receives a score of “3.” Items are summed to obtain total scores ranging between 0 and 30. Cut-off scores of 20, 15, 10, and 5 represent severe, moderately severe, moderate, and mild depression, respectively. A score of 10 or above had both a sensitivity and a specificity of 0.88 for major depression. The PHQ-9 has been used extensively with Autistic samples, and evidence for the psychometric properties of the PHQ-9 in Autistic adults has been demonstrated.43–44 Sample reliability was 0.901 (Autistic α = 0.880; non-autistic α = 0.890).
Autistic traits
The Autistic traits (AQ-28) 45 is an abbreviated version of the full 50-item screening questionnaire used to measure Autistic traits. 46 Each item is rated on a 4-point Likert-type scale ranging from definitely agree (score of 1) to definitely disagree (score of 4). After reverse-coding items, item scores are summed with scores ranging from 28 to 112. The cut-off score for autism is 65, according to Hoekstra and colleagues. 45 Sample correlation with the 50-item AQ is very high, with r ranging from 0.93 to 0.95 and comparable estimates of sensitivity (0.97) and specificity (0.82) for autism using an AQ-Short cut-off score of 65. Overall coefficient alpha in our sample was 0.920 (Autistic α = 0.833; non-autistic α = 0.862).
Data analyses
We managed data and analyses primarily in R. Cleaned data and primary analysis scripts are available at (note: This is a blinded link that will be replaced before publication) https://osf.io/edyth/?view_only=6bd3061272254c0b93540c8bbe10e9d0.
Validating Autism identification groups
To provide evidence for self-reported autism identification groups, we used analysis of variance (ANOVA) to compare AQ scores across the three autism diagnosis classification groups: those who reported a professional diagnosis of autism, those who self-identified as Autistic, and those who do not identify as Autistic. If the ANOVA showed an overall statistically significant difference, then we conducted Tukey’s pairwise group comparisons.
IRT analyses
Prior to conducting IRT analyses of UCLA-m data, we assessed the assumption of unidimensionality by computing the eigenvalues of the data’s polychoric correlations matrix. Next, a unidimensional graded response IRT model was fit to the UCLA-m data using the MIRT package for R. 47 The assumption of item fit was tested 48 using S-χ2; statistically significant (p < 0.01) violations of item fit were inspected with empirical fit plots. Additionally, the assumption of local independence was tested using Q3 49 ; item pairs with Q3 > |.20| or more than two standard deviations (SDs) away from the mean Q3 were inspected. 50 Items were removed as appropriate to ensure a well-fitting model.
Given that the original UCLA Loneliness Scale is often modeled using a bifactor model, where positive and negatively oriented items are assigned to respective specific factors, 51 a bifactor model was also considered if the unidimensional model did not exhibit adequate fit. To assess the extent to which data were acceptably unidimensional, explained common variance (ECV) and hierarchical omega (OmegaH) for the general factor were computed to determine whether the interpretation of an overall score was appropriate (ECV > 0.70 and OmegaH > 0.80). 52 As Omega indices are not generally computed from IRT models, a bifactor item factor analysis model was fit using Mplus, 53 and bifactor indices were computed from this model using the Bifactor Indices Calculator package for R. 54
Differential item functioning
We used the LORDIF package 55 for R to evaluate DIF based on autism diagnosis classification within an ordinal logistic regression framework. LORDIF provides p values for uniform DIF, nonuniform DIF, and overall DIF. Due to the large number of statistical tests (three for each item), p values were compared with a conservative 0.01 for statistical significance testing. Also, the unsigned item difference in sample and expected score standardized difference effect sizes for DIF were computed for each item. 56 A multigroup model was fit in which item parameters were held constant across groups except for the items flagged for DIF. Graphs of expected item score versus trait score were inspected to assess the extent of DIF at different levels of loneliness.
Revisiting IRT analyses
If tests of DIF resulted in the removal of additional items, a new IRT model was fit to the data and evaluated. Following the establishment of a final model, item parameters and option response functions were inspected to ensure all items were productive (i.e., good model-data fit and acceptable parameter estimates). The empirical reliability of trait scores 57 was computed, and conditional standard errors of measure were plotted for all complete cases.
Relationship with external variables
Loneliness scores across groups were compared based on the UCLA-m observed total score and scores from the SELSA-S family, romantic, and social domains. Since UCLA-m was designed to assess social components of loneliness, we expect the standardized difference (i.e., Cohen’s d) between Autistic and non-autistic adult groups to be similar for UCLA-m and SELSA-S’s social subdomain. The statistical significance of these differences was tested using t tests. Pearson correlations between scores on measures of loneliness (UCLA-m and SELSA-S) and scores on measures of related constructs including social interaction anxiety (S-SIAS) and depression (PHQ-9) were computed separately within each autism diagnosis group. We expected correlations involving UCLA-m to be similar in magnitude and sign to relationships involving the SELSA-S social subdomain. Within each autism classification group, correlations of UCLA-m with S-SIAS and PHQ-9 were statistically compared with correlations of SELSA-S subdomains with S-SIAS and PHQ-9. Due to the large number (12) of significance tests being performed, the Benjamini–Hochberg procedure was applied to control the false discovery rate.
Missing data
Item-level missing data on the UCLA-m were minimal, with <1% of cases missing for each item. Scale-level missingness for other measures ranged from 8% to 13%. We conducted measurement analyses on the UCLA-m in an IRT framework and therefore utilized full information maximum likelihood handling of missing data, which assumes missing data were missing at random. We performed correlational tests using a pairwise deletion approach to missing data, which assumes missing data were missing completely at random (MCAR). Little’s MCAR test was nonsignificant, p = 0.210, suggesting the MCAR assumption was tenable.
Results
Validating autism identification groups classification
The initial three groups were non-autistic, formally identified (e.g., professional diagnosis) Autistic individuals, and self-identified Autistic. ANOVA indicated a statistically significant overall difference in AQ scores across autism diagnosis groups, F(2, 533) = 266.20, p < 0.001, ηp2 = 0.50. Follow-up tests revealed statistically significant differences between the Autistic (M = 84.9, SD = 10.9) and non-autistic (M = 60.3, SD = 12.0) groups (d = 2.17, p < 0.001) and between the self-identified Autistic (M = 82.2, SD = 11.5) and non-autistic (M = 60.3, SD = 12.0) groups (d = 1.86, p < 0.001) but not between the Autistic and self-identified Autistic groups (d = 0.24, p = 0.13). Due to the minimal difference between the Autistic and self-identified Autistic groups, we performed all further analyses involving the autism classification group by combining those two groups into a single Autistic group. As a sensitivity analysis, all analyses were additionally performed using the original three autism groups. However, the results did not show any substantive difference from those obtained in the two-group analysis.
IRT analyses
The first three eigenvalues of the 17-item UCLA-m data were 10.44, 1.39, and 0.79, suggesting an essentially unidimensional dataset with a possible minor secondary dimension. As such, a unidimensional graded response model was fit to the data. No items were flagged for concerning item fit according to S-χ2. However, 29 item pairs were found to have Q3 > |.20| or Q3 more than two SDs away from mean Q3. Inspection of these item pairs revealed that high Q3 was mostly associated with item pairs of the same orientation (i.e., both positive or both negative). In contrast, low Q3 was always associated with item pairs of mixed orientation. In fact, pairs of positively oriented items had a mean Q3 of 0.09, pairs of negatively oriented items had a mean Q3 of 0.10, and item pairs with mixed orientation had a mean Q3 of −0.15. These findings are consistent with a bifactor structure. Hence, a bifactor-graded response IRT model was fit to the UCLA-m item data.
No items within the bifactor model were flagged for concerning item fit according to S-χ2. However, items UCLA-m3 (How often do you feel like you have nobody you can ask for help when you need it?) and UCLA-m17 (How often are there people you can ask for help when you need it?) exhibited high Q3 = 0.21. Because these items are essentially oppositely oriented versions of each other, we decided they were redundant and removed UCLA-m3 from all further analyses. UCLA-m3 was chosen for removal as it is more complicated in its phrasing than UCLA-m17. Evidence provided during the expert review phase also indicated that this item’s wording was more complex, and the idea of “feeling like you have nobody” could be challenging for some individuals. Following the removal of UCLA-m3, a new bifactor IRT model was fit to the 16-item UCLA-m data.
Like the original bifactor model fit analysis, no items were flagged for concerning item fit according to S-χ2. Likewise, no concerning item pairs were flagged by the Q3 fit statistic. Bifactor indices of ECV = 0.76 and OmegaH = 0.83 suggest the 16-item UCLA-m is sufficiently unidimensional to interpret a total score.
Differential item functioning
Next, we addressed the second research question regarding DIF testing for the Autistic and non-autistic samples. Results of DIF testing can be found in Table 3. Note that DIF was evaluated using a unidimensional model because the bifactor IRT model results indicated that UCLA-m was adequately unidimensional to justify interpreting a total score. Items UCLA-m5, UCLA-m8, UCLA-m10, and UCLA-m16 were flagged for uniform DIF, whereas UCLA-m4 was flagged for nonuniform DIF. Graphs of expected item score versus trait score in each group can be found in Figure 2. The nonoverlapping lines indicate where DIF is observed across groups for certain levels of the trait score (loneliness).
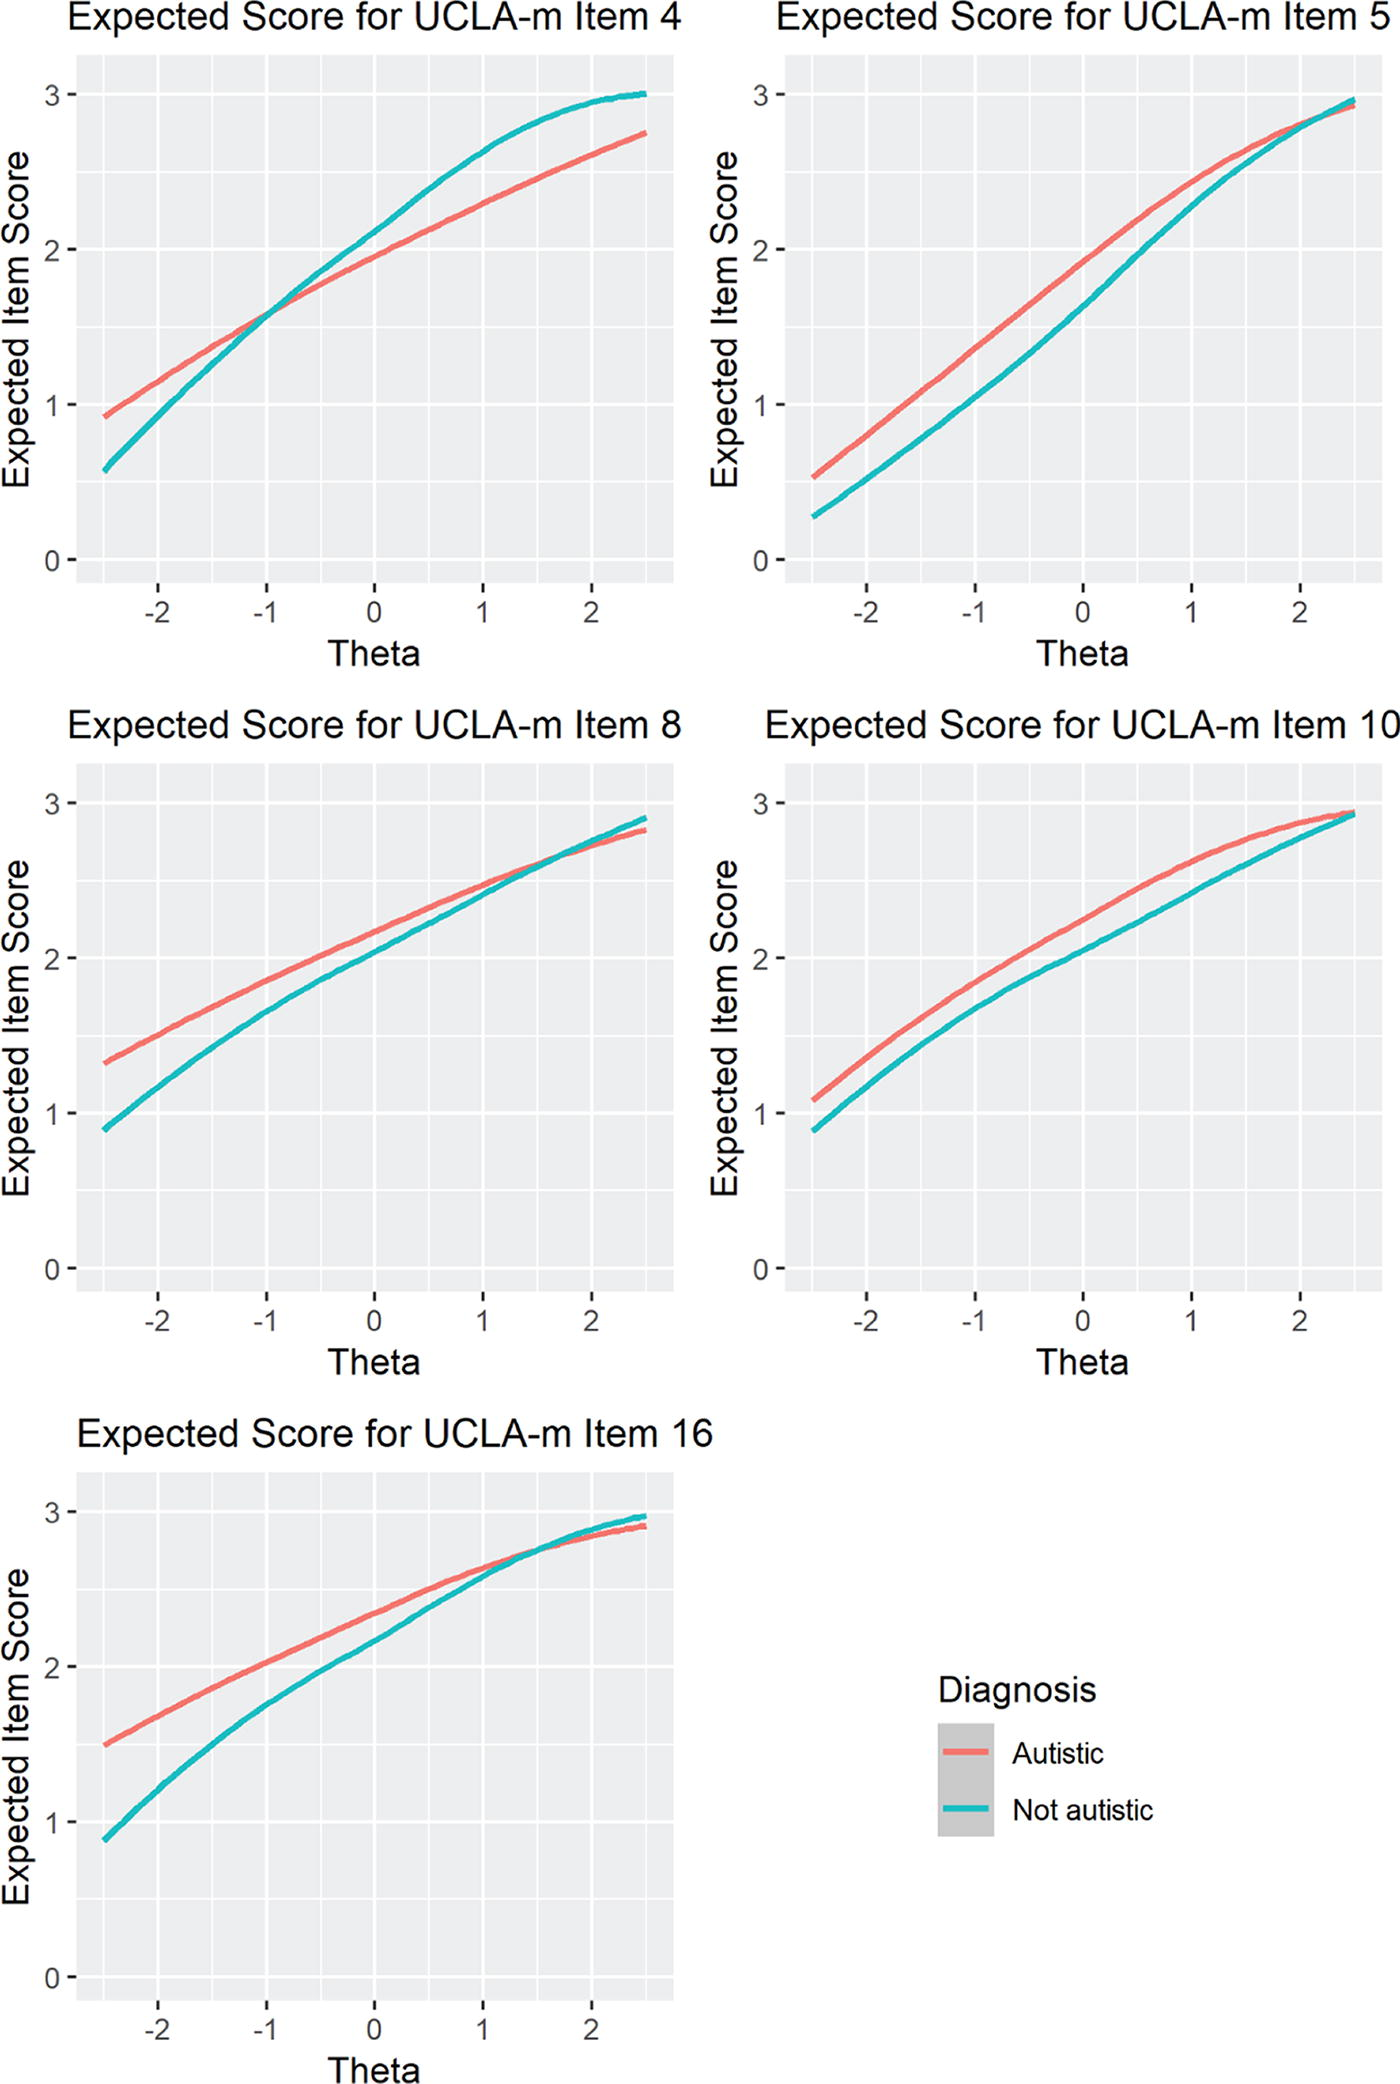
DIF—Expected item score versus trait score in each group. DIF, differential item functioning. Note: The non-overlapping lines indicate where DIF observed across groups for certain levels of the trait score (loneliness).
Differential Item Functioning of UCLA-m Items
Note. p < 0.01; DIF, differential item functioning; ESSD, expected standardized score difference; UIDS, unsigned item difference in sample.
Effect sizes of DIF for UCLA-m4 are small, as expected with nonuniform DIF. Additionally, the impact of DIF on expected item score was very small for levels of loneliness for which both groups have substantial density. Accordingly, UCLA-m4 was retained despite the presence of DIF.
A close inspection of the item wording for items UCLA-m5 and UCLA-m16 both deals with “group of people,” and UCLA-m5 additionally addresses “belonging.” Effect sizes of DIF are moderate for UCLA-m5 and moderate to large for UCLA-m16. We chose to retain UCLA-m5 due to its importance in construct representation (i.e., it is the only item addressing belonging). However, UCLA-m16 was removed from further analyses due to its more substantial DIF and construct overlap with UCLA-m5.
DIF in UCLA-m8 was anticipated due to the documented tendency of Autistic individuals to develop intense, highly specific, and often uncommon interests.58–59 Consequently, Autistic individuals often come to expect that others may not fully share or understand these interests. 57 Accordingly, after controlling for other aspects of loneliness, it makes sense that Autistic people are less likely to feel their interests are not shared by other people. However, this lack of shared interest still contributes to feelings of loneliness, and thus DIF in UCLA-m8 was deemed to be construct relevant and therefore we retained UCLA-m8.
Finally, UCLA-m10 exhibited a small-to-moderate amount of DIF and was retained. The likely reason behind this item exhibiting DIF is its potential double-barreled nature (“feel left out” versus “excluded”). However, cognitive interviews revealed that participants found the additional word “excluded” to help explain what it meant to be “left out.” Moreover, this is the only item focusing on exclusion, a significant concern among Autistic adults according to the interview phases, and feelings of being left out or excluded are key components of loneliness. Therefore, it was retained to ensure comprehensive content coverage.
Revisiting IRT analyses
Following the removal of UCLA-m16, a new bifactor IRT model was fit to the 15-item UCLA-m data. Item parameter estimates from this model can be found in Table 4. No items within this model were flagged for concerning item fit according to S-χ2. Likewise, no concerning item pairs were flagged by Q3 as being concerning for local dependence.
Item Parameter Estimates from Final Bifactor IRT Model of the 15-Item UCLA-m
Note. a, discrimination; b, threshold; IRT, item response theory.
The empirical reliability of the general factor was 0.895 for the entire sample; empirical reliabilities were 0.857 for the autistic subsample and 0.872 for the non-autistic subsample. A graph of standard errors of measure versus trait score can be found in Figure 3. Except for extreme scores, all persons are measured with an effective reliability of at least 0.80. Bifactor indices of ECV = 0.76 and OmegaH = 0.83 suggest UCLA-m is sufficiently unidimensional to interpret a total score.
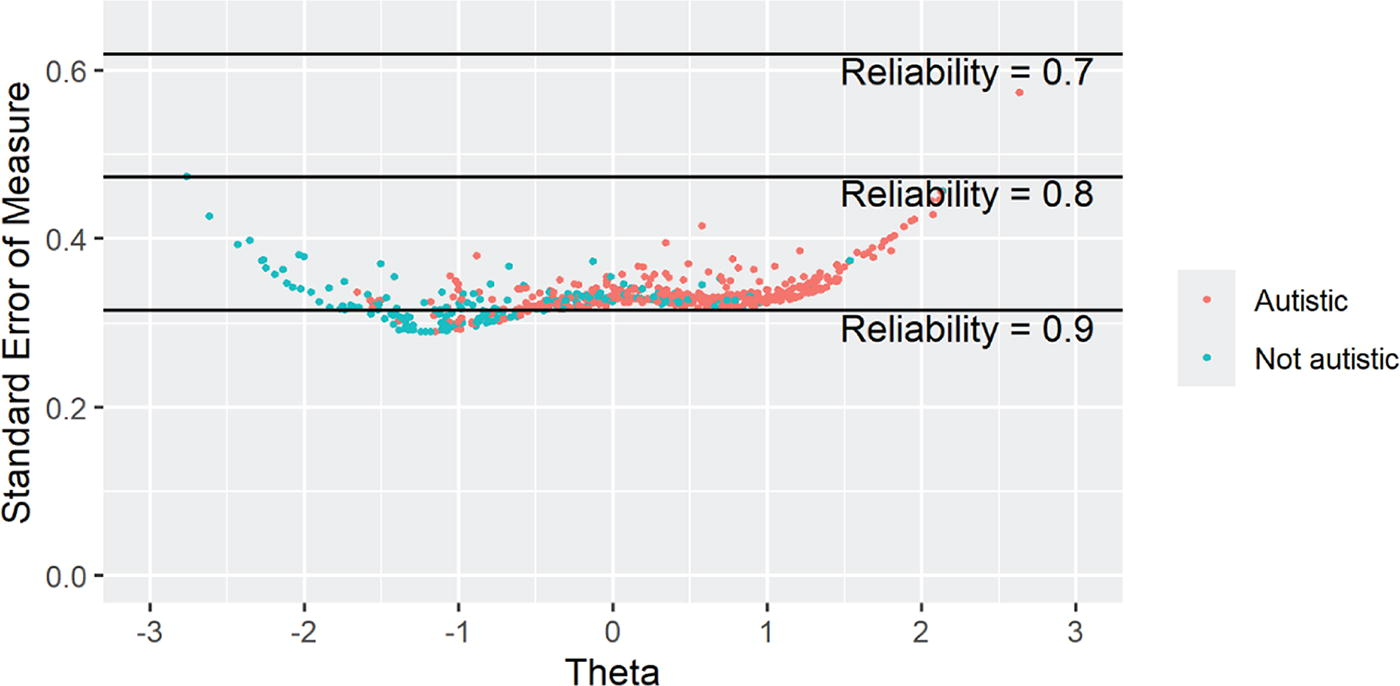
Conditional standard errors of measurement for final 15-item UCLA-m.
Relationship with external variables
Pearson correlations between UCLA-m observed total scores and related variables can be found in Table 5. The osf repository contains an expanded version of Table 5 with confidence intervals for each correlation. Loneliness scores based on UCLA-m were higher for Autistic participants compared with non-autistic participants (d = 1.307, p < 0.001). A statistically significant difference was also found for each SELSA-S subdomain: d = 1.072, p < 0.001 for the social domain, d = 0.525, p < 0.001 for the romantic subdomain, and d = 0.938, p < 0.001 for the family subdomain. Autistic participants also had higher levels of self-reported depression as measured by the PHQ-9 (d = 0.908, p < 0.001) and social interaction anxiety as measured by the S-SIAS (d = 1.476, p < 0.001). Regarding associations with social interaction anxiety as measured by the S-SIAS and depression as measured by the PHQ-9, scores on the UCLA-m were positively correlated with scores on the S-SIAS and scores on the PHQ-9, as hypothesized. Pearson correlations involving UCLA-m were all statistically significantly higher than correlations involving any of the SELSA-S subdomains.
Correlations and Summary Statistics of Measures by Autism Classification
Note. Values in parenthesis on diagonals are Cronbach’s alpha estimates of internal consistency; All correlations are Pearson correlations; PHQ-9, Patient Health Questionnaire; SD, standard deviation; SELSA-S, Social and Emotional Loneliness Scale for Adults; S-SIAS, Social Interaction Anxiety Scale—Straightforward; UCLA-m, UCLA Loneliness Scale—Modified.
Discussion
Our study aimed to modify a widely used instrument for measuring loneliness in the general population so that it could be effectively used with an Autistic sample and a non-autistic sample. Crucially, our study incorporated participatory approaches, acknowledging the importance of involving Autistic individuals in the scale development and modification processes. This involvement ensures that the item wording is relevant and clear for the population of interest. Without community involvement, as was employed in our study, confidence in findings is limited, as existing scales are often developed and normed based on psychometrics derived from non-autistic samples.19–20
To develop and provide initial psychometric evidence for the validity of the UCLA-m, we first modified items based on data from cognitive interviews with Autistic adults and feedback from an expert review process. During this phase, two items were removed, and modifications were made to several of the original UCLA items to ensure clarity and appropriateness for the intended population. Then, psychometric evidence of the items was analyzed using IRT and DIF. During this phase, two items were removed; specifically, we removed items UCLA-m3 and UCLA-m16, which relate to Items 3 and 18 on the original UCLA, respectively. 30 The decision to remove these items was supported by coordinating psychometric analysis with content validity evidence, ensuring that the final instrument had a degree of evidence for reliability and validity for use with both Autistic and non-autistic individuals. Interestingly, no items were added during our process. Participants were asked to identify gaps in the scale during the cognitive interview and expert review phase; however, no consistency and need were reflected in the participants’ responses. Sum scores of the resulting 15-item instrument have initial evidence for construct validity and high reliability. Psychometric evidence should always be considered ongoing; specifically, several items that displayed mildly concerning psychometric properties were retained in our study (i.e., UCLA-m4, UCLA-m5, UCLA-8, and UCLA-m10). These items should be carefully considered in future research involving the UCLA-m. Specifically, UCLA-m4 showed DIF due to nonuniform effects with minimal impact on item scores, UCLA-m5 due to its focus on “belonging” and “group of people,” UCLA-m8 due to Autistic individuals’ unique experiences with shared interests, and UCLA-m10 likely from its double-barreled phrasing addressing “left out” and “excluded.” To correct these concerns, future research should conduct cognitive interviews with Autistic adults to understand the reasons better and ultimately refine item phrasing and comprehension. Doing so could enhance the psychometric properties of these moderately concerning items, thereby improving the overall psychometric strength of the UCLA-m. Furthermore, research should investigate the sources of DIF related to group membership (Autistic vs. non-autistic adults) on the UCLA-m. This could begin by analyzing patterns in the autistic classification DIF-flagged items identified in this study and those observed in other research on loneliness or related measures. Subsequently, confirmatory DIF analyses could be conducted to test these patterns. Such efforts would contribute to identifying additional sources of group DIF associated with autistic classification and inform the development of guidelines and principles for reducing group DIF in loneliness measures or psychological assessments more broadly.
Overall, the IRT results showed excellent fit and measurement precision for the items on the UCLA-m. To provide evidence for convergent validity, we examined a correlational analysis of the relationship between the adapted loneliness scale and scores on related. As expected, results indicated that individuals who reported higher levels of loneliness also reported higher levels of social anxiety and depression. Scores on the UCLA-m had stronger associations with scores on the SELSA-S and the PHQ-9 social anxiety and depression than the SELSA-S, which is another commonly used instrument used to measure self-reported levels of loneliness, providing further evidence for the modified instrument. Also, as expected, the UCLA-m had lower correlations with SELSA-S-family and SELSA-S-romantic than with SELSA-S-social. This could indicate that changes made to the UCLA-m helped to capture the construct of loneliness better.
Additionally, all correlations among scales for the non-autistic group are descriptively higher than correlations for the Autistic group. This raises the question as to whether these mental health adjacent constructs are less strongly connected for Autistic individuals. Another possibility is that lower measurement precision in the Autistic group resulted in attenuated correlations. However, the differences in reliability estimates between the Autistic and non-autistic groups were too small to explain the differences in correlations. Therefore, we suspect that these constructs may be less strongly connected for Autistic than non-autistic people or that other constructs are more strongly related. Another possible explanation is construct representation for Autistic people, or the idea that Autistic people’s experiences of loneliness may not be represented as well by the UCLA-m, when compared with non-autistic people, as suggested by Grace. 21 However, evidence from our processes and consultation with Autistic participants did not reveal the necessity for additional items. Overall, results of the process revealed that based on the degree of evidence accumulated, the instrument can be used to assess self-reported loneliness in both Autistic and non-autistic samples. We recommend that future studies gather additional psychometric evidence with diverse samples and aim to replicate the findings reported herein.
Autistic individuals and loneliness
Consistent with the original UCLA Loneliness Scale, the UCLA-m captures the unidimensional construct of loneliness. The data from our study showed a clear distinction between individuals who are Autistic and those who are non-autistic in their self-reported rates of loneliness. Specifically, Autistic participants reported higher levels of loneliness, social anxiety, and depression. These results are similar to previous findings6,7,24 and continue to provide justification for an urgency into research that addresses loneliness and well-being for Autistic adults.
Practical application
By modifying the UCLA Loneliness Scale to better suit Autistic people, practitioners now have a more accurate and reliable PROM for assessing loneliness in their Autistic clients. This tailored instrument allows for better identification of self-reported loneliness levels, which can inform targeted interventions and support strategies. Additionally, the validation process ensures that the modified scale is both effective and relevant for both Autistic and non-autistic adults, fostering more precise data collection and analysis, including comparative analysis, in future research. Ultimately, this study enhances the ability of allied health workers including health care providers, therapists, and support services to understand and address the unique experiences of loneliness in Autistic individuals, leading to more personalized and effective care.
Other researchers may wish to use a similar process outlined in this article when considering scale modification or development. Each scale used in a study must provide appropriate validity evidence with an Autistic sample, and feedback on wording and content can only strengthen confidence in the results of a study. The key steps of this process include seeking feedback on the test content and clarity of items through interviews, obtaining expert reviews, and combining this qualitative advice with evidence from advanced psychometric analyses. By following a research procedure like the one outlined in this study, measures can become more accessible and relevant for all individuals.
The evidence from this study serves as a precursor for studying loneliness in Autistic adults and provides evidence about the validity of a measurement tool that will support further research into how communities (e.g., support services, parents/caregivers, and therapists) can better support Autistic adults who are at risk of experiencing loneliness. Before this study was conducted, psychometric evidence was only emerging regarding the use of any validated PROM to measure loneliness with Autistic adults. Based on the evidence in this study, the UCLA-m can be used alongside lived experiences 60 to explore important questions within this field that go beyond examining the prevalence of loneliness to exploring ways in which to alleviate it, given the associated health and well-being outcomes. For instance, attention could be devoted to understanding the balance between finding social connection and ensuring restorative alone time. 61 Collaborations between researchers, practitioners, and the Autistic community are needed to develop and implement these opportunities and interventions. Additionally, funding and resources must be allocated to support these initiatives, ensuring they are accessible and effective. By combining rigorous research with immediate, practical applications, we can better address the loneliness experienced by Autistic adults and improve their overall quality of life.
Limitations
As acknowledged in the community participation section, this article included the involvement of Autistic community members. However, the project did not meet the standards for community-controlled research, due to the input and shared power by non-autistic researchers. 62 However, a strength of this research is the shared partnership of non-autistic and Autistic researchers and community members who came together from different cultures and countries to complete this research. For all stages of research, self-report data were used. While PROMs are valuable and critical within the field of loneliness and other well-being constructs, self-report measures come with inherent limitations including the potential for social desirability and recall bias, where participants may not accurately remember past experiences or events, leading to inaccuracies in their responses. Additionally, the participants in our study were female majority (69.6%), and our sample included a higher number of individuals with higher education than in the general population, limiting the generalizability of our findings. Only a small percentage of the full sample reported an intellectual disability (1.6%), and only 3 of the 23 individuals who gave us feedback reported an intellectual disability. This means that the results of our study may not apply to all Autistic people. Finally, we collected an international sample; however, we limited participants to English-speaking Western countries. Therefore, our findings are not generalizable to other non-English-speaking countries where the construct of loneliness may be experienced differently than by people of other countries or by individuals who could not independently access the survey.
Continual evolution of measurement tools
The authors of this research intentionally carried out this project with community involvement from Autistic people to ensure that change in the language, development of new items, and discussions around a separate Autistic construct of loneliness were made with consideration to lived experiences and community perspectives. This is a strength of the study, and the methods used can be replicated for other scale development studies. As recommended by Jones 20 and Nicolaidis and colleagues, 19 tools designed to measure aspects of Autistic lives must be made in collaboration with Autistic people. Scales like the UCLA-Loneliness Instrument were made before coproduction and Autistic voices were valued; therefore, it is time that they are revised.
Many of the adaptations made during this process will increase the overall accessibility of the scale for all individuals, not just Autistic adults. These modifications ensure that the language and structure of the scale are more comprehensible and user-friendly, which is likely to enhance the accuracy and reliability of self-reported data across diverse populations. This broader applicability means that the scale can be a valuable tool in various contexts, contributing to more inclusive research practices and potentially informing the development of interventions aimed at reducing loneliness across different groups. The practice of modifying and updating instruments for diverse samples is critical. Researchers should move beyond the routine use of instruments solely based on existing psychometric evidence and instead ask: Can this scale be improved before using it to measure my construct of interest? If so, will that increase my confidence in the findings? Engaging in this step first, in collaboration with individuals who have lived experiences, will enrich research findings and ensure that outdated scales are not used indiscriminately. This approach promotes the continual evolution of measurement tools to better capture the nuances of diverse populations and enhances the validity and relevance of research outcomes.
Footnotes
Acknowledgments
Our research team would like to thank the input by Autistic researchers and community members who served as expert reviewers or cognitive interview participants. This study was only made possible because of your generous sharing of your lived experiences and constructive feedback on the questionnaire.
Authorship Confirmation Statement
A.M.A.L.: Project administration, conceptualization and design, data collection, interpretation of results, and original writing. C.E.: Conceptualization and design, data collection, interpretation of results, and review and editing. D.M.D.: Methodology, analysis, interpretation of results, and review and editing. R.Y.C.: Conceptualization and design, interpretation of results, and review and editing. K.G.: Conceptualization, content expert, interpretation of results, and review and editing. M.D.T.: Methodology, analysis, interpretation of results, and review and editing. M.H.L.: Content expert, interpretation of results, and review and editing. V.G.: Conceptualization and design, supervision, and review and editing. The article has been submitted solely to Autism in Adulthood.
Author Disclosure Statement
The authors do not have any conflict of interest to disclose.
Funding Information
The research was supported by Autism Spectrum Australia.
References
Supplementary Material
Please find the following supplemental material available below.
For Open Access articles published under a Creative Commons License, all supplemental material carries the same license as the article it is associated with.
For non-Open Access articles published, all supplemental material carries a non-exclusive license, and permission requests for re-use of supplemental material or any part of supplemental material shall be sent directly to the copyright owner as specified in the copyright notice associated with the article.