
Abstract
Background:
Prior studies have shown some evidence for associations between the presence of methane on clinical breath testing and body mass index (BMI) in a California population, but this association has not been replicated in different regions of the country.
Methods:
Data from 470 consecutive glucose breath test studies performed between January 2003 and August 2013 with available patient BMI data were retrospectively reviewed.
Results:
A total of 292 (62%) studies were methane positive. The BMI of methane-positive patients (27.6) was not significantly different from the BMI of methane-negative patients (27.8; p=0.73). There was no significant difference in the prevalence of methane-positive patients based on BMI groupings (p=0.96). There was no significant change in BMI in the year prior to the study date (p=0.61) or the year after the study date (p=.83). Within the methane-positive group, there was a nonsignificant trend toward methane production inversely correlating with BMI (R2=0.012, p=0.06).
Conclusions:
In a largely overweight Midwestern population, the presence of methanogenic bacteria is not associated with a higher BMI. Results regarding the relationship between the presence of methanogenic bacteria and BMI in populations from one geographic region cannot be readily extrapolated to other regions.
Introduction
O
The composition and quality of gut microflora have been shown to be altered in obesity. Levels of beneficial bacteria in the human gut may play a role in changes in metabolism and weight gain. 3 In humans, there are two major methanogenic species, of which Methanobrevibacter smithii is predominant and Methanosphaera stadtmaniae is less so. These methanogenic bacteria produce methane in the gut via the hydrogenation of carbon dioxide. Globally, there is wide variation in the prevalence of methane production among healthy adult populations in different countries, ranging from 34% to 87%.4–6 Methane producers are less common in a hospitalized GI patient population, and even rarer in those with inflammatory bowel disease, which may be due to the alteration of mucosa. 4 Mouse studies have suggested that the addition of M. smithii to the Bacteroides flora in the gut results in an enhanced ability to harvest and store calories, leading to weight gain. 7 Possible mechanisms described include methane gas causing slowed proximal small intestinal transit, as well as increased efficiency of bacterial fermentation.8,9
Recent human cohort studies have also shown some evidence for associations between methane on breath test (a surrogate marker for intestinal M. smithii colonization) and body mass index (BMI) in a California population. 10 However, this has not yet been well corroborated with different patient populations across the country. One prior study even showed an inverse relationship between skinfold (as a surrogate measure for obesity) and breath methane concentration. 11 Interestingly, M. smithii levels have also been found to be significantly higher in anorexic patients, which may be an adaptive attempt to compensate for an inadequate caloric intake. 12 Current studies have also focused on solitary methane values to indicate a positive methane test. As methane levels are variable among individual breath samples, analysis of the area under the methane curve over an entire study may provide a more representative measurement of methanogenic bacteria activity. The objective of this study was to characterize the relationship between the detection of methane on clinical breath testing and BMI in a U.S. Midwestern population.
Materials and Methods
Records of all 535 consecutive glucose breath tests performed in the Division of Gastroenterology and Hepatology at our institution between January 2003 and July 2013 were reviewed. For each patient undergoing breath testing, the following information was abstracted from the electronic medical record: age, gender, and ethnicity. Values for BMI were also obtained from the electronic medical record at the time of the study (studyBMI), 1 year before the study (preBMI), and 1 year after the study (postBMI), when available. Studies without a concomitant BMI recorded were excluded from the study. The study was approved by the Institutional Review Board at the Medical College of Wisconsin.
Glucose breath test
Patients were referred for glucose breath testing for a variety of symptoms, including diarrhea, bloating, abdominal distension, abdominal pain, and/or excess gas. Glucose breath tests were performed with gas chromatography. Patients were given a menu for a diet low in fermentable substrates to follow on the day before the test (Table 1). The patients then ingested 80 g of glucose in 300 mL of water. Breath samples were collected at baseline and then every 15 minutes for 3 hours. Methane, hydrogen, and carbon dioxide levels were measured with the Quintron 12i Microlyzer (Milwaukee, WI). Methane and hydrogen levels are corrected for the amount of carbon dioxide in the breath sample and have an accuracy of ±3 parts per million.
Data analysis
A breath test was considered positive for methane if there were three or more parts per million of methane on any sample. A breath test was considered positive for hydrogen if there were >20 parts per million of hydrogen on any sample within the first 90 minutes. 10 Methane-positive and methane-negative groups were compared in terms of BMI, age, gender, and ethnicity using the t-test or chi-square test where appropriate. One way analysis of variance (ANOVA) was used to compare the BMI of those with negative hydrogen and methane breath testing (H−/M−), negative hydrogen but positive methane breath testing (H−/M+), positive hydrogen but negative methane breath testing (H+/M−), and positive hydrogen and methane breath testing (H+/M+). The difference in proportion of methane-positive patients in different BMI groupings (<20 kg/m2, 20–25 kg/m2, 25–30 kg/m2, 30–35 kg/m2, >35 kg/m2) was analyzed using the chi-square test. Among those with positive methane breath tests, total methane production over the course of the test (area under the curve) was compared with BMI using a linear regression analysis. In the group of patients with preBMI and studyBMI available, the paired t-test was used to assess for a significant overall change in BMI. The paired t-test was also used to assess for significant changes in BMI within the subgroups of methane-negative and methane-positive patients. The same analysis and subgroup analysis was completed for the group of patients with studyBMI and postBMI available.
Results
Of the 535 studies reviewed, 65 studies did not have a concomitant BMI and were excluded, leaving 470 studies available for analysis. Of these, 315 studies had BMI recorded for 1 year prior to the study date, and 375 studies had BMI recorded for 1 year after the study date. A total of 292 studies (62%) were methane positive.
The BMI of methane-positive patients (27.6) was not significantly different from the BMI of methane-negative patients (27.9). No significant differences in age, gender, or ethnicity were found between methane-positive and methane-negative patients (Table 2).
BMI, body mass index.
A comparison of BMI based on hydrogen and methane production did not show any significant differences in BMI (p=0.42; Fig. 1). There was also no significant difference in the percentage of methane-positive patients based on BMI groupings (p=0.96; Fig. 2). Among all patients clinically categorized as obese (BMI>30), those with a positive methane breath test (35.8) did not have a significantly different BMI from those with a negative breath test (36.0; p=0.83). Within the methane-positive group there was a nonsignificant trend toward methane production inversely correlating with BMI (R 2 =0.012, p=0.06; Fig. 3).
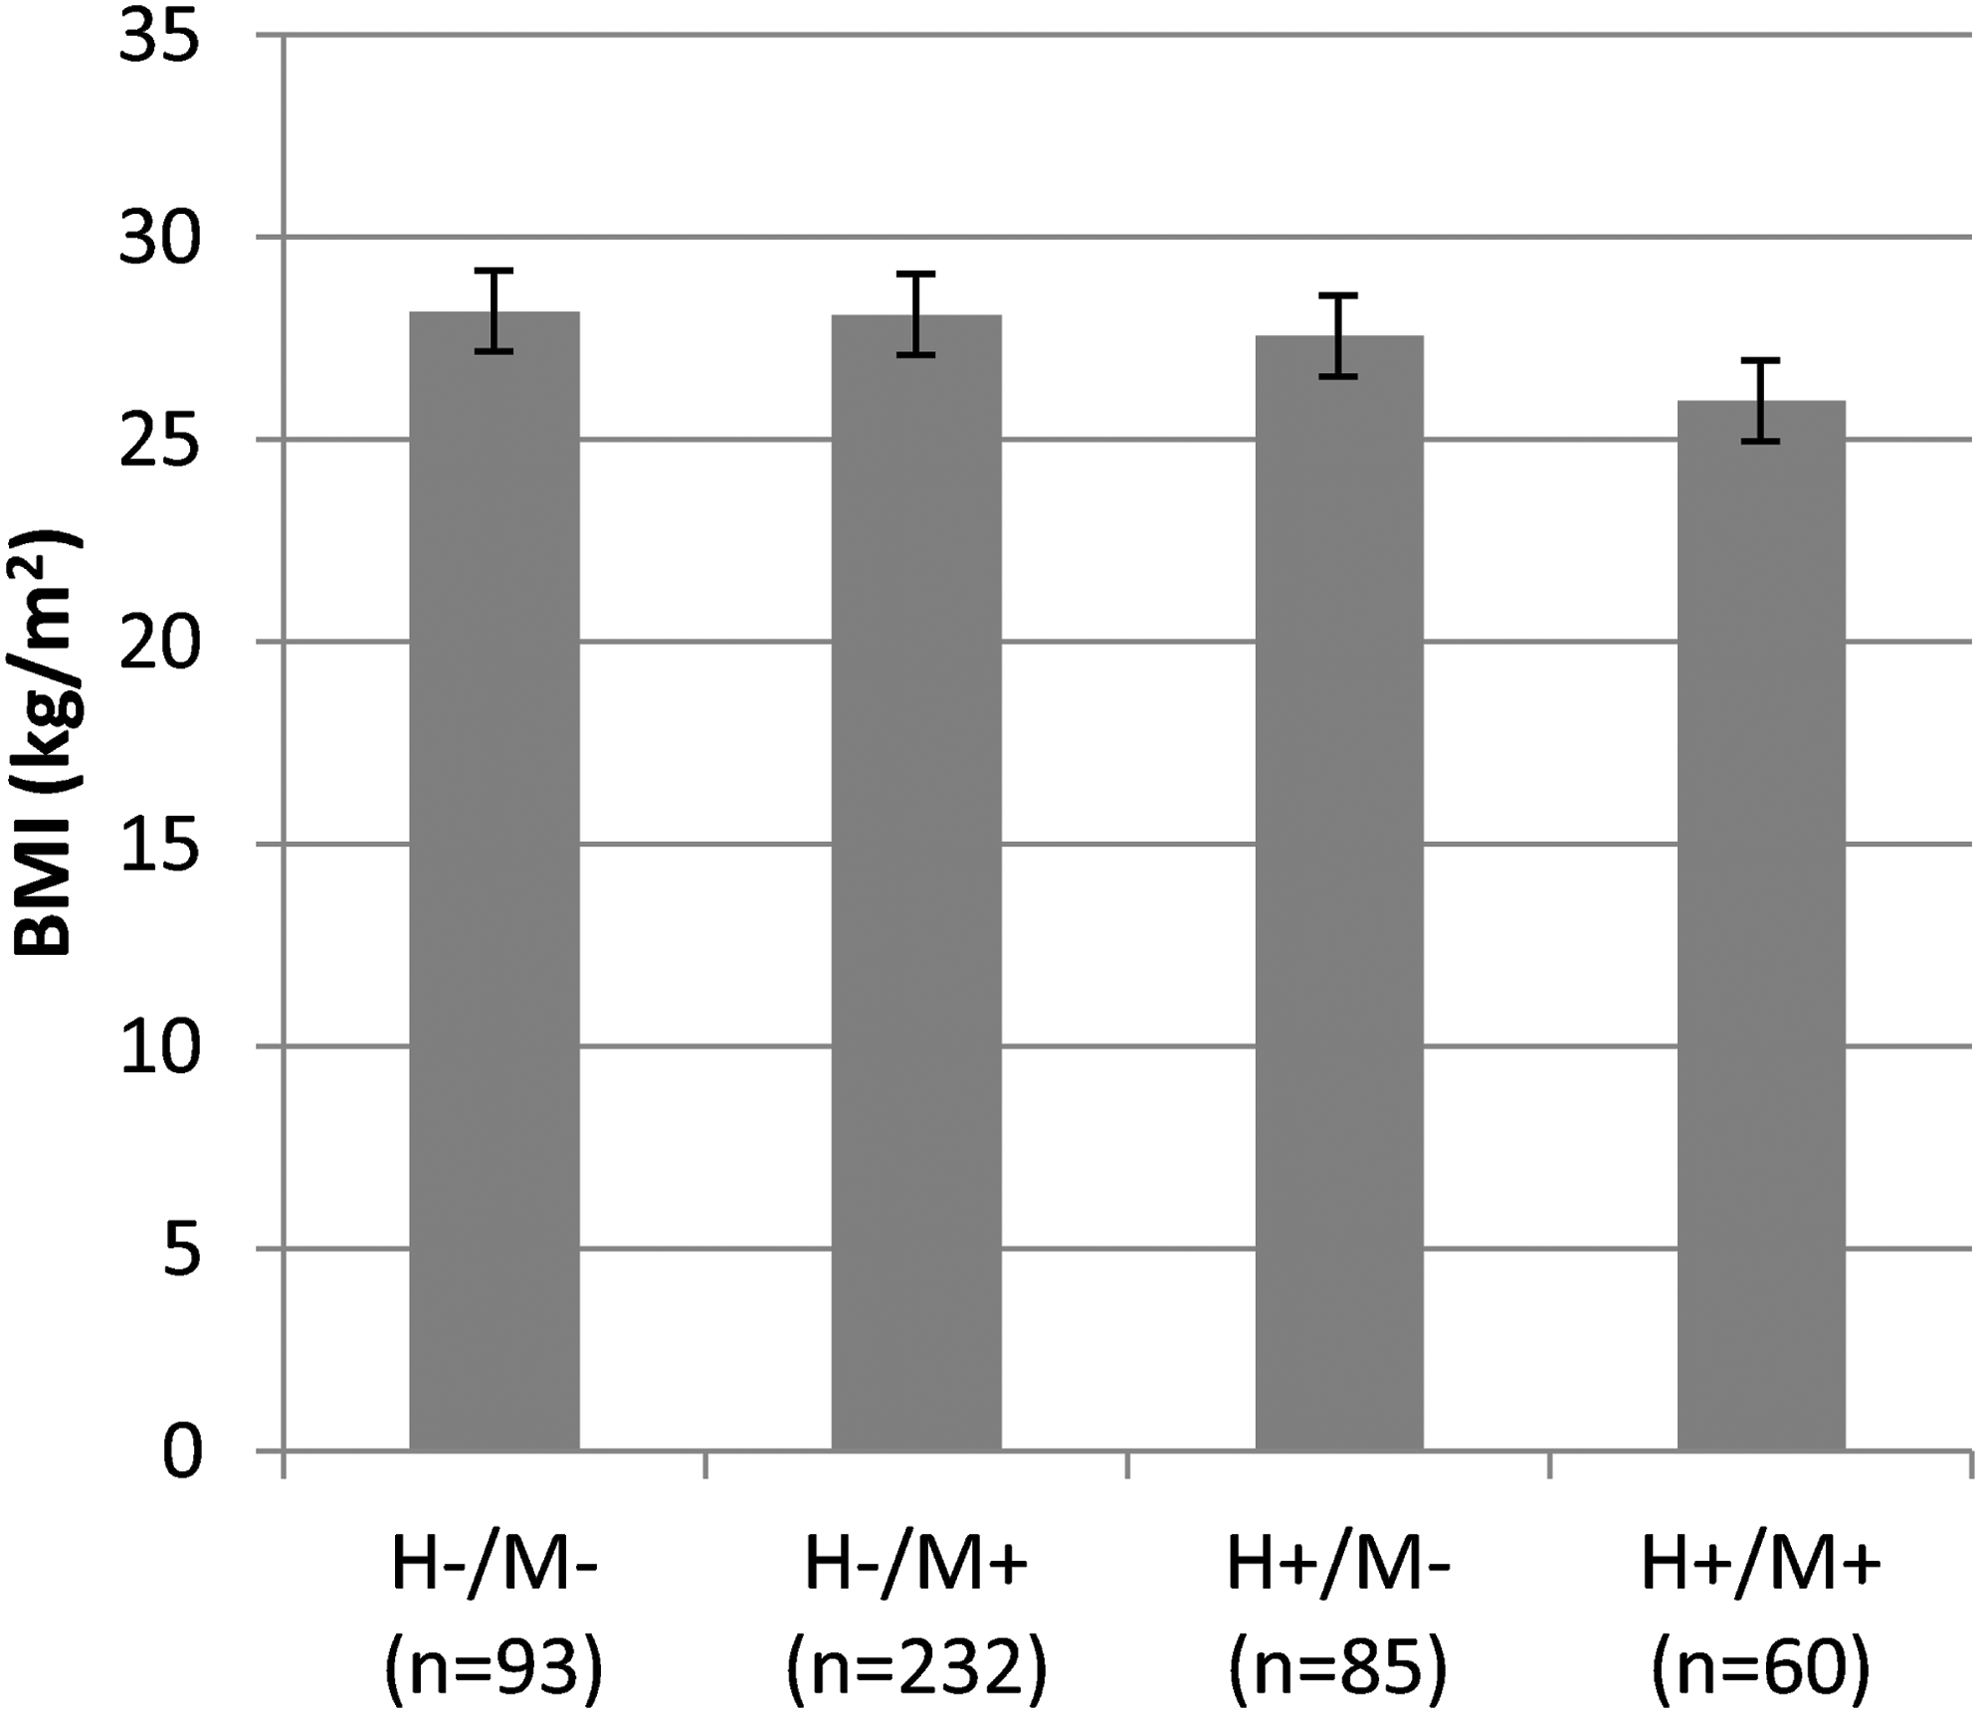
Relationship of body mass index (BMI) to production of methane and/or hydrogen. There was no difference in BMI among the four groups (p=0.42).
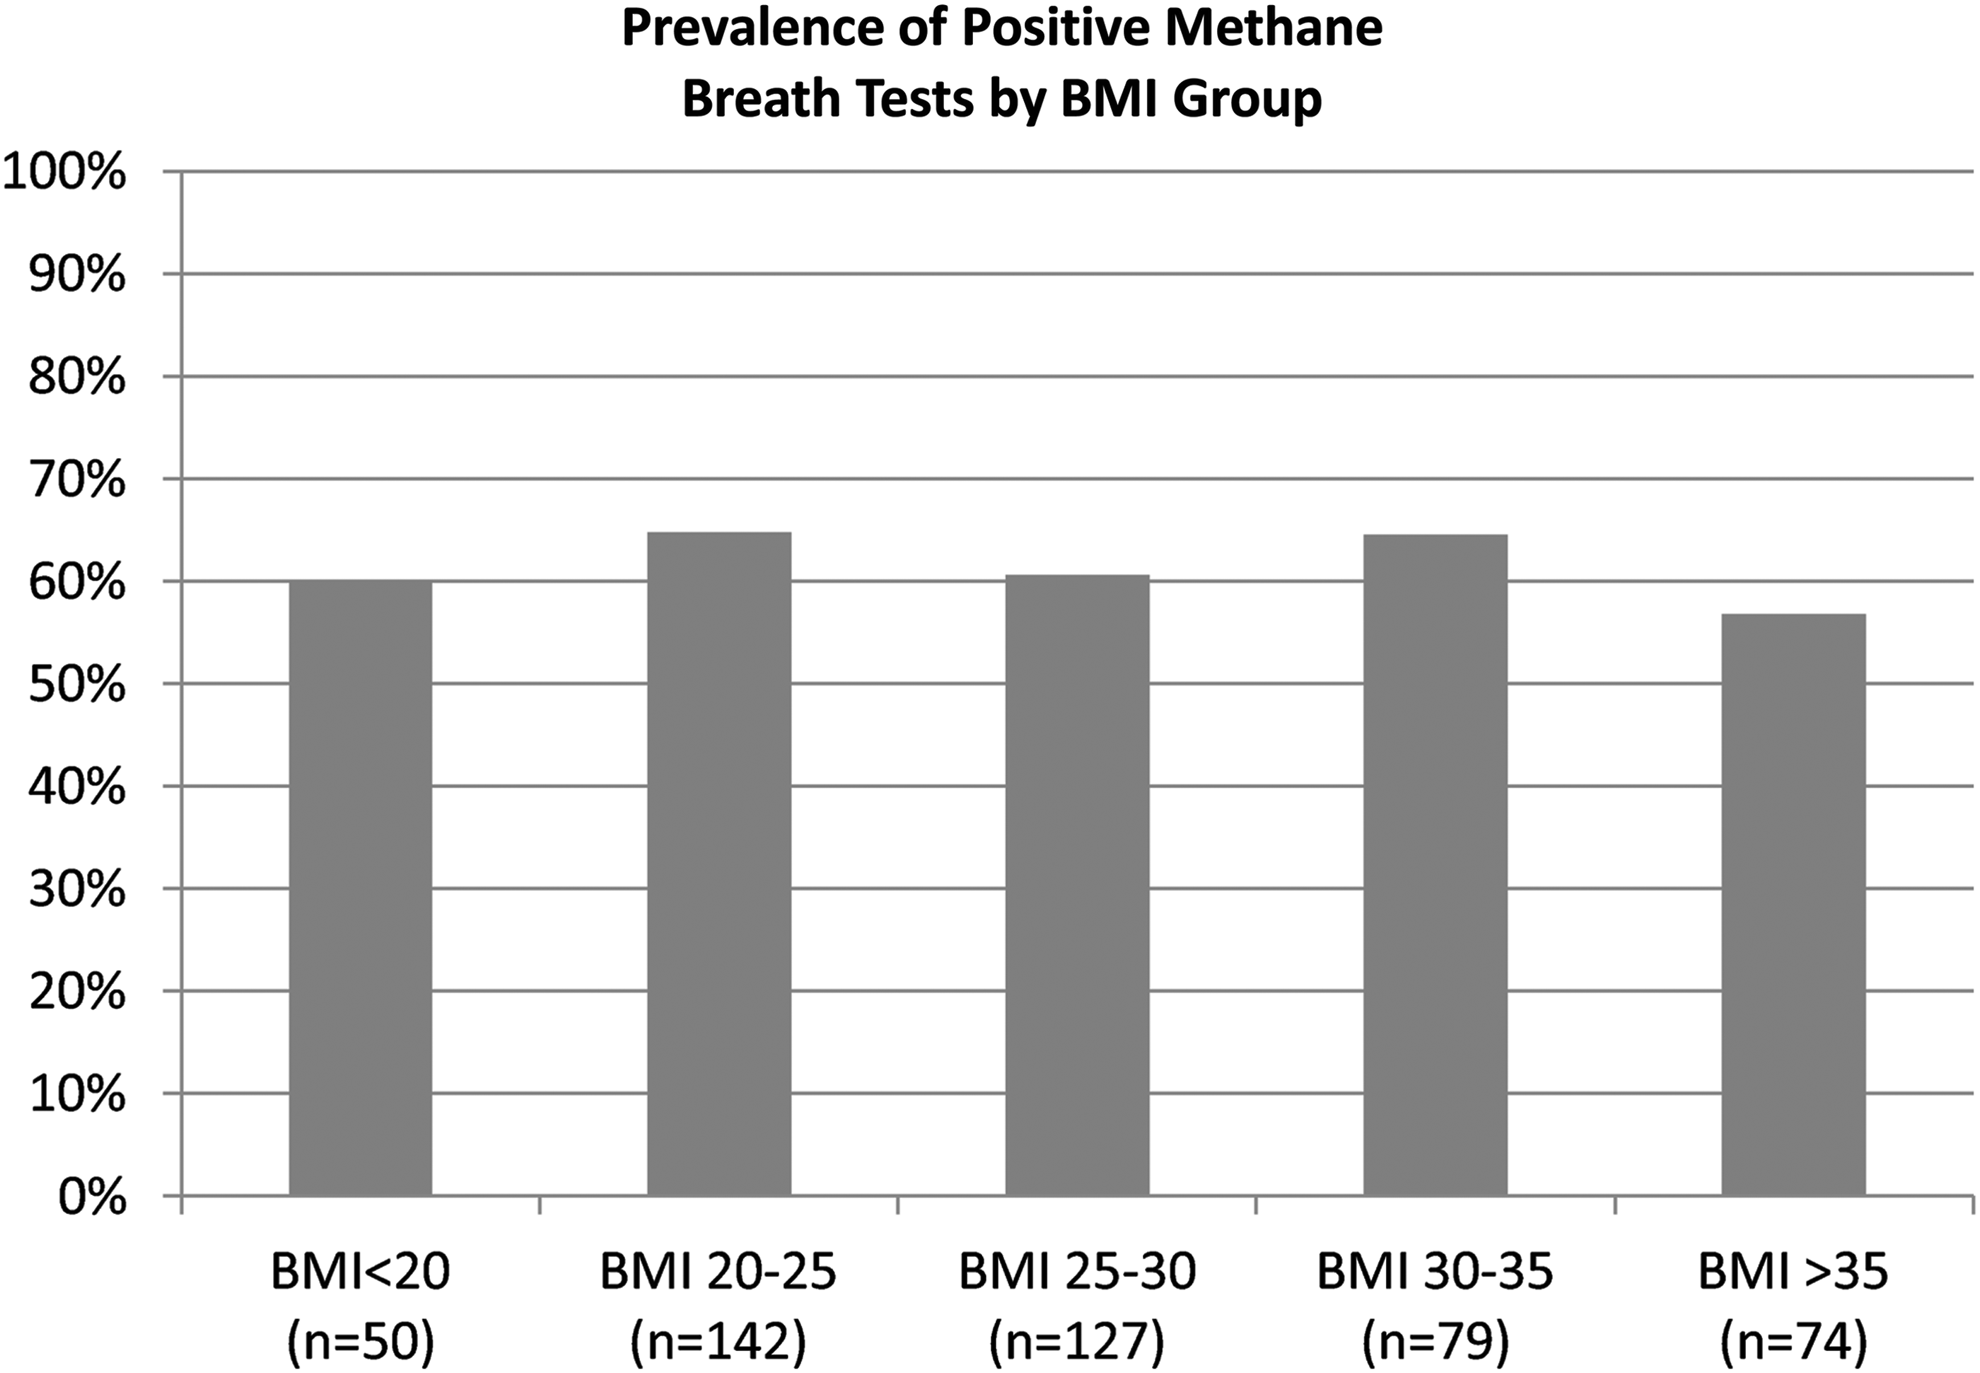
Relationship between the prevalence of methane production and BMI. Subjects were grouped into bins of increasing BMI. There was no relationship between BMI group and prevalence of methane production (p=0.96).

Relationship of total methane production during breath testing to BMI. Data are only for patients producing methane.
There was no significant change in BMI in the year prior to the study date (p=0.61) or the year after the study date (p=0.83). Subgroup analysis of the methane-negative and methane-positive patients did not reveal significant differences in BMI comparing preBMI to studyBMI (p=0.85, p=0.61 respectively) or in comparing studyBMI to postBMI (p=0.83, p=0.92 respectively; Table 3).
preBMI, BMI 1 year before study; studyBMI, BMI at time of study; postBMI, BMI at 1 year after study; M+, methane positive; M−, methane negative.
Discussion
This is the first study to evaluate the relationship between methane production and BMI in a U.S. Midwestern population. We found no correlation between the presence of methanogenic bacteria or the amount of methane production and BMI in this population. In fact, increased prevalence and load of methanogenic bacteria showed a trend toward an inverse association with BMI.
Our results differ from prior studies conducted in other geographic regions, which have proposed an association between increased methane levels and obesity. Mathur et al., when evaluating a California population, showed that patients who tested positive for hydrogen and methane on breath testing had a significantly higher BMI (26.5 kg/m2) compared to patients who tested negative for hydrogen and methane (24.1 kg/m2), positive for hydrogen only (24.2 kg/m2), or positive for methane only (24.0 kg/m2). 10 Similarly, in another small California study of 58 patients who met the clinical definition of obesity (BMI>30), Basseri et al. found a correlation between the presence of methane on breath testing and the degree of obesity. 13 The reason for the disparity in findings between these two California studies and our Midwestern study is uncertain. The patients in our study had a higher BMI (27.7 kg/m2) and prevalence of methanogenic bacteria (62%).
About two-thirds of the patients in our study population were methane producers. We cannot be certain how representative this is of the prevalence of methane production in the general Midwestern population, as patients studied were selected on the basis of having gastrointestinal complaints that prompted breath testing. However, these limitations also pertain to other studies investigating patients undergoing breath testing to evaluate clinical symptoms.
Limitations of this study include the retrospective nature of the study. Although the BMI of our patient population (27.7) is comparable to the mean BMI of the United States (28.7), 2 the study population of individuals who presented for breath testing may differ from the general populace in other ways. We also cannot be sure that the total production of methane in each study is a reliable marker for the concentration of methanogenic bacteria in the colon. Although the age of our population did trend older than other studies, this should have minimal influence, as methane levels tend to plateau with age. 14 An advantage of our study is that it is unlikely to be biased by selection for obesity, as this was not a symptom criterion for having breath testing performed.
Conclusions
In a largely overweight U.S. Midwestern population, the presence of methanogenic bacteria, as determined by breath testing, is not associated with a higher BMI. Results regarding the relationship between the presence of methanogenic bacteria and BMI in populations from one geographic region cannot be readily extrapolated to other regions.
Footnotes
Author Disclosure Statement
No competing financial interests exist.