
Abstract
According to the Centers for Disease Control and Prevention, 68.8% of Americans are overweight, defined as having a body mass index of ≥25. Overweight and obese patients frequently seek advice from healthcare professionals regarding nutrition. This article provides healthcare professionals with a guide to understanding food labels and educates bariatric patients on utilizing food labels effectively. The article addresses the Nutrition Facts label, ingredient list, health claims, nutrient content claims, and proposed changes to the Nutrition Facts panel. The information provided in this article was thoroughly researched using up-to-date resources from the Food and Drug Administration, Dietary Guidelines for Americans, and Centers for Disease Control, and from professional experience.
Introduction
A
Nutrition facts and food information labels appear on most packaged foods and are an easy way for patients to identify healthy foods options. The Nutrition Labeling and Education Act (NLEA) requires nutrition labeling for most foods and that all nutrient content claims and health messages comply with specific requirements. Food labeling includes the Nutrition Facts panel, ingredient list, nutrient content claims, and health claims. 3 This article provides background on food labeling and discusses how best to educate patients to make smart and healthy choices.
Nutrition Facts Panel
According to the NLEA, the Nutrition Facts panel should be easy to find and easy to read. 3 A Nutrition Facts panel is required on most packaged foods, with the exception of foods manufactured by small businesses; foods served in restaurants/delivered to homes ready for immediate consumption; delicatessen-type foods; bakery products and confections that are sold directly to consumers from the location where they are prepared; foods that provide no significant nutrition (e.g., instant coffee, spices); infant formula and foods used for children up to 4 years of age; dietary supplements; medical foods; bulk foods shipped for further processing or packaging before retail sale; fresh produce and seafood; packaged single ingredient fish or game meat, which may be labeled based on a 3 oz. cooked portion; packages labeled “this unit not labeled for retail sale” within a multiunit package (outer package bears all required label statements); self-service bulk foods (nutrition labeling by placard, or on original container displaced clearly in view); and donated food that is given free to the consumed. 3
Components of the Nutrition Facts Panel
Serving size
Serving size is the first item listed on a Nutrition Facts panel and is arguably the most important component in evaluating the food. All nutrition information on the nutrition facts panel is based on this listed serving size. Unfortunately, serving size is often ignored. Consumers may assume the serving size is the size of the entire package or the size they would commonly eat. Instruct patients to observe not only the serving size, but also the information listed below serving size—servings per container. This next item can help consumers more easily estimate the serving size. For example, if the serving size is 1 cup and servings per container is 3, then one third of the package is about 1 cup.
Serving sizes are not created by the manufacturers. Instead, they are based on “Reference Amount Customarily Consumed” or RACCs. RACCs are based on the 1977–1978 and 1987–1988 Nationwide Food Consumption Surveys conducted by the U.S. Department of Agriculture. RACCs are found in Section 101.12(b) of the food labeling regulations. If a RACC does not exist for a specific food, the food manufacturer must generate a RACC using 21 CFR (Code of Federal Regulations) 101.12(c). Manufacturers are required to convert the RACC (weight in grams) to a common household measure, for example cups, tablespoons, or teaspoons. 4 Serving size on the Nutrition Facts panel must list the common household measure followed by the equivalent metric quantity in parentheses, for example ½ cup (112 g). It is important to note that these RACCs are not necessarily recommended serving sizes or comparable to commonly used portion sizes designated by medical associations, such as the diabetes exchange list. RACCs were created to standardize food labeling and are based on surveys from more than 30 years ago. 4
Calories
The next component of the Nutrition Facts panel is calories. Calories shown equal the amount of energy provided from one serving of the food. Americans often consume excess calories while not meeting recommended intakes of other important nutrients. 5 To calculate percent of daily values, the Nutrition Facts label uses an estimated intake of 2,000 calories per day for most Americans. 6 The calorie needs for patients will vary greatly based on personal health goals (weight gain, weight loss, or weight maintenance) and anthropometrics. Registered Dietitian Nutritionists (RDN) can calculate an individual's calorie and nutrition needs or a healthcare provider can use www.myplate.gov to determine caloric requirements.
Nutrients
Nutrients provided in the Nutrition Facts panel can be divided into two subgroups: “nutrients to limit” and “nutrients to get enough of.” 6 Figure 1 can be used to quickly identify “nutrients to limit” and “nutrients to get enough of” on the nutrition facts panel. 6 The Scientific Report of the 2015 Dietary Guidelines Advisory Committee found that many Americans are not meeting recommendations for vitamin A, vitamin D, vitamin E, vitamin C, folate, calcium, magnesium, fiber, and potassium. Sodium and saturated fat were found to be overconsumed by Americans. Intake of sugars and refined grains were also identified as being too high. 5 Therefore, patients should be encouraged to limit intake of total fat, saturated fat, trans fat, sodium, and added sugar. Patients should be encouraged to eat foods containing more micronutrients and fiber. An easy way to educate patients on “nutrients to limit” and “nutrients to get enough of” is by using the percent daily values. The percent daily values can currently be found on the right side of the panel. Percent daily values can be used by consumers to evaluate if they are eating too little or too much of any nutrient. These percentages are based on the daily value recommendations for key nutrients. The daily value recommendations are found on the Nutrition Facts panel as a footnote. Consumers can use this percent daily value to determine if a food is high or low in a specific nutrient. The Food and Drug Administration (FDA) recommends using 5% and 20% as cutoffs to help consumers identify foods low and high in nutrients. Consumers should choose food products with 5% daily value or less of fat, saturated fat, sodium, and cholesterol and low amounts of trans fat and sugar. Currently, trans fat and sugar do not have percent daily values. Consumers should choose products with 20% daily value or more of vitamin A, vitamin D, vitamin E, vitamin C, folate, calcium, magnesium, fiber, and potassium. 5
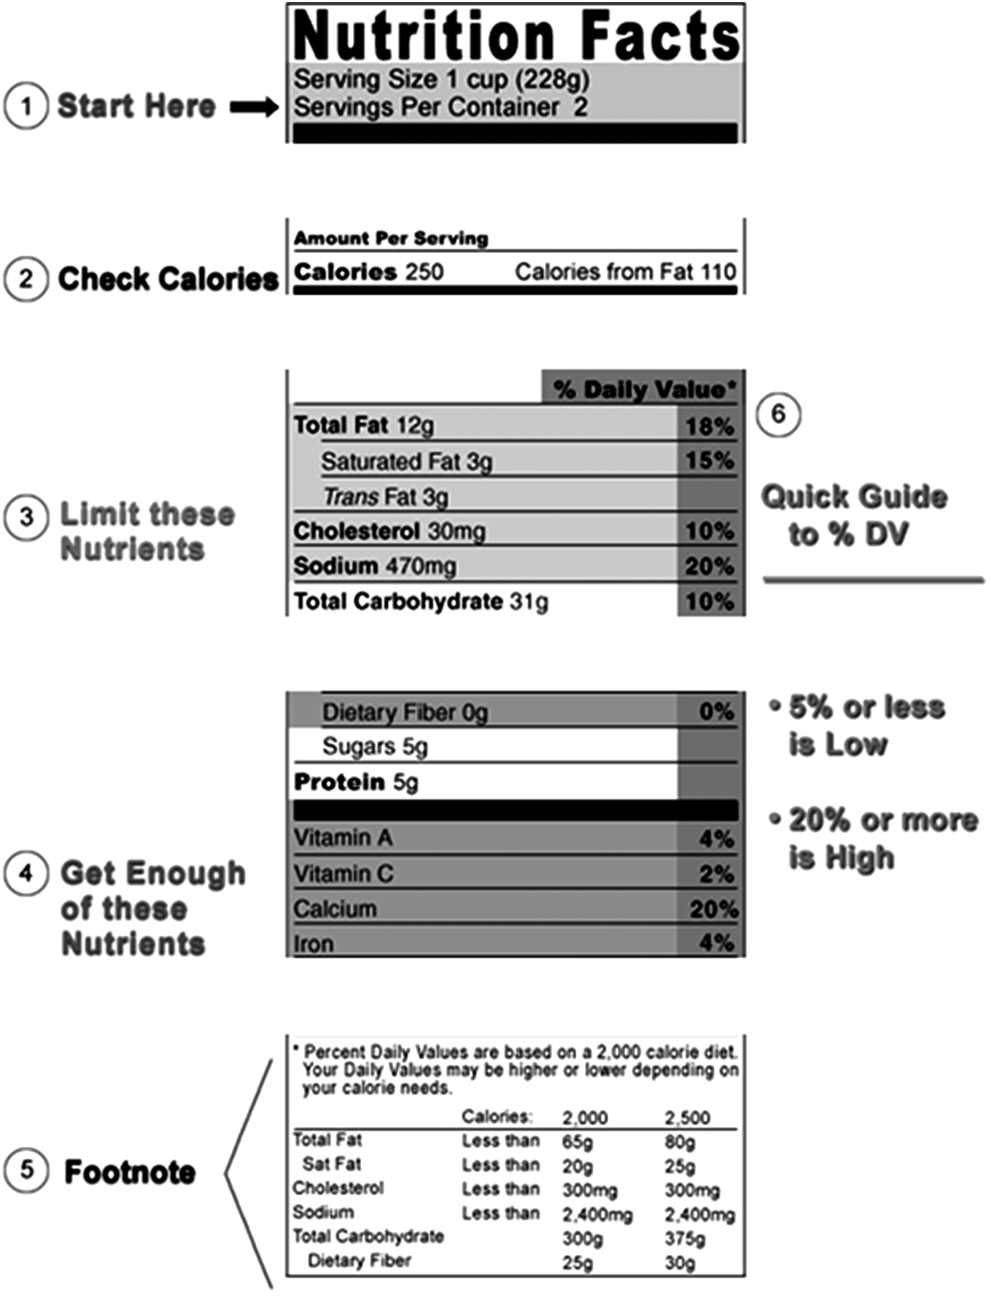
Reading the nutrition facts panel. (Image retrieved from: FDA How to Understand and Use Nutrition Facts Label, 2014). 6
Nutrients to Limit
Total fat
Total fat refers to the grams of fat present in one serving of a food. Total fat can be a combination of unsaturated fatty acids and saturated fatty acids. 3 In the past, total fat recommendations have been emphasized more than discussing specific types of fatty acids. It is more important to counsel patients on the balance between saturated and unsaturated fats, than to counsel decreased fat intake alone. 7 Balancing intake of unsaturated fats to saturated fats is beneficial for overall health and decreased risk of chronic disease. The third report of the National Cholesterol Education Program (NCEP) Expert panel on Detection, Evaluation, and Treatment of High Blood Cholesterol in Adults (ATP III) recommends reducing saturated fat as part of overall therapeutic lifestyle changes for coronary heart disease (CHD) risk reduction. 8 A Mediterranean-style dietary pattern has been associated with decreased risk of CHD. Mediterranean-style dietary pattern includes foods rich in monounsaturated fatty acids, polyunsaturated fatty acids, and fiber. 9 According to the Position of the Academy of Nutrition and Dietetics: Dietary Fatty Acids for Healthy Adults position paper, individuals who have a high blood level of saturated fatty acids are at increased risk of developing heart disease. Patients should be instructed to replace saturated fatty acids in their diets with unsaturated fatty acids. 7 Patients should also be educated to choose food products low in saturated fat, <5% of daily value, and that contain unsaturated fatty acids. Unsaturated fatty acids are found in foods such as canola oil, olive oil, safflower oil, soy bean oil, corn oil, cottonseed oil, nuts, seeds, avocados, and some seafood. Consumers should be educated to limit their intake of trans fat to as little as possible. 10
Sodium
According to the FDA, 77% of Americans' sodium intake is from packaged and restaurant foods. The remaining 23% is from sodium that naturally occurs in foods or is added while cooking or at the table. 11 It is recommended that all Americans consume <2,300 mg/day, but Americans on average consume 3,300 mg of sodium per day.5,11 Individuals who have high blood pressure, diabetes, or chronic kidney disease should reduce sodium intake to 1,500 mg/day. 11 Consumers should be advised to chose foods that are low in sodium or <140 mg/serving or <5% of the daily value. Nutrient claims such as salt/sodium free, very low sodium, or low sodium can also help consumers determine if the sodium level of products are acceptable. 11
Sugar
The Scientific Report of the 2015 Dietary Guidelines Advisory Committee concluded that intake of sugar among Americans is high. The summary indicates that almost all studies reviewed concluded a high intake of sugar sweetened foods and beverages are detrimental to overall health. These conclusions are not the same for sugars naturally found in foods such as vegetables, fruits, whole grains, and low fat dairy. Individuals should strive to consume no more than 10% of total calories from added sugar. 5 For a 2,000 calorie diet, this would be the equivalent of 50 g of sugar per day or 12.5 teaspoons. Currently, food labels do not separate added sugars from naturally occurring sugars in the Nutrition Facts panel. 12 Therefore, individuals should be educated to look for sources of sugar in the ingredients list to determine if sugar is added or naturally occurring. Examples of ingredients that are considered added sugar include sucrose, lactose, fructose, dextrose, glucose, maltose, syrup (corn, high fructose, maple, etc.), raw turbinado sugar, fruit juice concentrate, agave nectar, honey, and molasses. 5
This recommendation is especially important for patients who have undergone bariatric surgery. Added sugars can cause discomfort, diarrhea, stomach cramping, nausea, or vomiting. Limited evidence exists to support how much sugar can trigger dumping syndrome. 13 The Academy of Nutrition and Dietetics' Pocket Guide to Bariatric Surgery recommends choosing foods with no added sugar and a total sugar content of <25 g from natural or added sugars. 14 Common foods that contain added sugar include sugar-sweetened beverages, sodas, sports drinks, juices, desserts, cereals and cereal bars, snack foods, baked goods, canned/frozen fruits, flavored yogurt, and flavored milk. Encourage all patients to choose foods with little added sugar.
Nutrients To Get Enough Of
The Academy of Nutrition and Dietetics recommends that “the public should consume adequate amounts of dietary fiber from a variety of plant foods. Populations that consume more dietary fiber have less chronic disease. In addition, dietary fiber has beneficial effects on risk factors for developing several chronic diseases.” 15 The Evidence Analysis Library (EAL) of the Academy of Nutrition and Dietetics examined the role dietary fiber can play in cardiovascular disease, bowel function, weight control, and diabetes. The EAL concluded that dietary fiber intake of 12–33 g per day can lower blood pressure and improve serum lipid levels. The EAL also concluded that intake of dietary fiber may have some benefit on weight loss and obesity. Increased fiber intake can promote satiety and decrease hunger after a meal. It has been shown that increasing fiber by 14 g per day resulted in a 10% decrease in calorie consumption. In this way, high fiber intake can protect against weight gain. Lastly, the EAL determined people who consumed more than 30 g of fiber per day had lower serum blood glucose levels than people who eat less fiber. It is likely that high fiber diets will include less calorically dense foods and be lower in fat and added sugar. Patients should be encouraged to consume 14 g of fiber per 1,000 calories, or about 20–30 g per day. 15
Nutrition Facts panels are not required to list percent daily values of all micronutrients. Vitamin A, vitamin C, iron, and calcium are the only micronutrients that manufacturers must provide on Nutrition Facts panels. 6 Other micronutrients can be added to the label using the Reference Daily Intakes. Encourage patients to choose foods that are high (20% daily value or higher) in vitamins and minerals. 6 Although fresh produce do not contain a Nutrition Facts panel, fresh fruits and vegetables are one of the best ways for patients to consume more micronutrients. Encouraging patients to choose a wide variety of fruits and vegetables each day will increase intake of micronutrients. Because bariatric surgery patients are at increased risk of developing micronutrient deficiencies, they should be encouraged to choose foods that are nutrient dense, such as fruits, vegetables, or foods with >20% of micronutrients. 13 When patients have questions about specific nutrient contents of foods, the United States Department of Agriculture (USDA) National Nutrient Database for Standard Reference provides macro- and micronutrients information. The database can be accessed from: http://ndb.nal.usda.gov/.
Ingredient Lists
The ingredient list located on nutrition information labels is also an important source of information that many consumers overlook. The ingredient list itemizes each ingredient in descending order by weight (the first ingredient weighs the most and last ingredient weighs the least). Labels are required to list ingredients using their “common” name instead of scientific name; for example, “sugar” should be used instead of “sucrose.” Chemical preservatives must also be listed using their common name and the function of the preservative, for example “Ascorbic acid to promote color retention.” 3 Reading the ingredient list can help consumers identify nutrient dense foods. For example, a consumer may want to purchase a healthy bread. The ingredient list can be used to determine if the bread is made from whole or refined grains. For example, a consumer may read the following ingredients on two different loaves of bread: “whole wheat flour, water, sugar, wheat gluten…” or “unbleached enriched wheat flour, water sugar, yeast….” The consumer can easily determine that the first bread is the better choice because of the type of flour used. It is not the best practice to instruct patients to eliminate foods based on ingredients they do not understand. Many “scientific-sounding” ingredients occur naturally and are added to foods to increase micronutrient content or retain color. Consumers can be encouraged to choose food products with a short, concise ingredient list to promote whole, nutrient rich foods instead of highly processed foods.
Nutrient Content and Health Claims
Nutrient content claims
Nutrient content claims appear on the front of the food packaging and are an easy way for consumers to identify better choices. The terms “free,” “low,” “reduced,” “less,” and “light” are commonly seen on food packages. The FDA sets specific guidelines that must be met for a food manufacturer to include these terms on their food products 3 (see Table 1 for definitions of claims). “Good Source” can be used when a product contains 10–19% of the Recommended Daily Intake (RDI) for a nutrient. “High” can be used when a product contains >20% of the RDI. 3
Health claims
The Nutrition Labeling and Education Act of 1990 defined provisions that direct the FDA to regulate statements made on food labels describing the relationship of foods/food substances to specific disease prevention. Manufacturers can use health claims to educate consumers of the benefits of food/food substances. Health claims are regulated by FDA and must meet specific criteria (see Table 2 for definitions of common health claims). Health claims must be supported with scientific evidence meeting the significant scientific agreement standard section of the Federal Food, Drug, and Cosmetic Act and Code of Federal Regulations. These documents describe the evidence-based review system used by the FDA to evaluate scientific evidence of health claims. 16
Nutrient content and health claims can be utilized by consumers to identify quickly foods that are healthier. However, claims should not be the only factor for consumers to consider when purchasing a food product. Consumers should be encouraged to read the nutrition facts panel and ingredient list to determine if the food choice is healthy.
Future of Food Labeling
This article was written to provide guidance on the current food label. The current label was created 20 years ago. The FDA has been working on updating the label and has proposed changes. These proposed changes will add information on added sugars, update the percent daily values, add potassium and vitamin D as required nutrients, while vitamin A and C will be included voluntarily. The proposed changes will also address serving sizes. Serving sizes will be based on what people actually eat versus what they “should” consume. For example, a 20 oz. beverage will be labeled as one serving versus multiple servings. Dual columns will be used to label items that may be consumed in one or multiple sittings. The proposed updated design will emphasize areas of the label that are currently public health concerns for obesity, diabetes, and cardiovascular disease. Serving size and calories will appear in larger, bolded text. The percent daily value will move from the right to the left side of the label, and a footnote explaining the percent daily value will be updated on the bottom of the label. Added sugars will also be included in the proposed nutrition label. 12 Figure 2 illustrates the current label and proposed changes to the label. 12 These anticipated changes will make it easier for consumers to identify more healthy foods quickly.
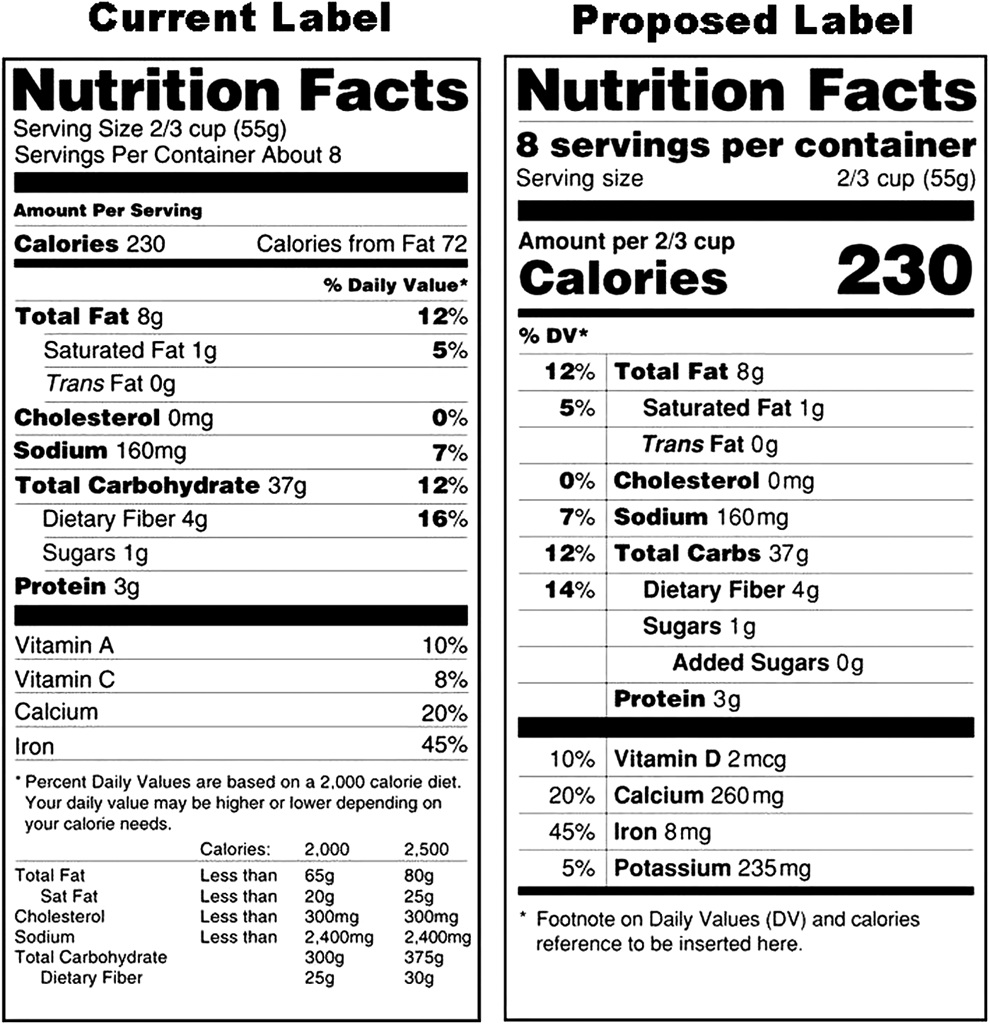
Current versus new proposed nutrition facts labels. (Image retrieved from: FDA Proposed Changes, 2014). 12
Footnotes
Author Disclosure Statement
No competing financial interests exist.