




Abstract
Background:
Feasible and useful methods are needed to screen for taste preferences and dietary behaviors in obesity treatment settings.
Aim:
We examined the reliability and validity of a brief liking survey to assess these behaviors among 138 individuals with morbid obesity considering bariatric surgery.
Methods:
The survey contained foods/beverages, physical/sedentary activities, and pleasant/unpleasant experiences and took <10 min to complete.
Results:
Preferences for foods/beverages that were sweet, salty, bitter, sour, and spicy/strong flavored showed good variability, paralleling that seen in adults without morbid obesity. The most liked were fruits, pleasant activities, high-fat protein foods, and sweets (listed from highest); least liked were unpleasant activities, alcoholic beverages, spicy/strong-flavored foods, and physical activities. Following dietary guidance, food groups were formed into a dietary quality index and, combined with physical/sedentary activities, into a behavior index. Both indices that approached acceptable internal reliability were normally distributed and showed variability between healthy to less healthy behaviors. Exploratory principal component analyses showed that >50% of variability in either index was explained by two factors—less (sweets, fats, salty, television) and more (vegetables, fruits, fiber, physical activities) healthy.
Conclusion:
A simple liking survey appears feasible for obesity treatment settings, providing reliable and valid information about taste/flavor preferences and diet healthfulness.
Introduction
B
It is impractical in clinical settings to directly measure preferences, especially sampled foods versus simple aqueous tastes. Furthermore, traditional measures of assessing usual dietary intake (e.g., food records, frequency questionnaires) are time consuming for patients and clinicians, and biased by potential misreporting. 11 Hence, feasible measurement tools are needed to assess taste preferences and usual dietary intake in clinical settings. Survey reports of food preference have shown to be a good proxy for laboratory measures of preference as well as habitual dietary intake. Survey report of food preference shows good correlation with sampled aqueous solutions for sweet and salty as well as preference for sampled foods.12,13 Ratings of liking and pleasantness of foods have been shown to associate with consumption in a number of studies. 14 Survey-reported food and beverage preferences are a novel method of assessing dietary intake based on the assumption that individuals tend to eat foods they like and refrain from eating those that they do not. From a twin study, survey-reported sweet preference explained significant variance in sweet intake and craving, whereas preference for aqueous sweet solution did not. 12 In laboratory-based investigations for salty 13 and sweet 15 foods as well as vegetables, 16 food preferences measured directly through food sampling and survey show a high degree of correlation. Survey-reported liking has been shown to correlate with reported intake and nutritional biomarkers.17,18,26 In a study investigating the short-term effect of bariatric surgery on taste preference, Roux-en-Y gastric bypass and vertical sleeve gastrectomy patients exhibited similar weight loss at 1–3 months postsurgery, but differed in preference for fat, sugars, and complex carbohydrates. 19
Food preference surveys also can characterize diet quality through generation of a healthfulness index, such as the Healthy Eating Index (HEI). The HEI follows the Dietary Guidelines for Americans 20 and is calculated from consumption of healthy foods such as vegetables, fruits, whole grains, and low-fat dairy, and unhealthy foods such as refined grains, saturated fatty acids, and added sugars. 21 Higher HEI scores correspond to better conformance to the dietary guidance. Indices of healthy diets generated from food preference surveys have demonstrated sufficient reliability, construct validity, and associations with risk factors of cardiovascular disease. 22
The objective of this study was to test the reliability and validity of a liking survey for assessing taste preference as well as dietary quality of patients with morbid obesity, which could provide more translatable tools for intervention in the clinical setting.
Materials and Methods
Recruited was a convenience sample of 138 adults with morbid obesity (113 females), between the ages of 20 and 73 years (mean age = 43.28 ± 22.71 years), who were considering bariatric surgery from a single bariatric surgery program. The mean preoperative body mass index (BMI) was 45.76 ± 7.29 kg/m2 (range 34–69 kg/m2). The study was approved by the IRB.
Liking survey
Participants completed a validated, 100-item liking survey comprised of foods, beverages, physical activities, sedentary activities, pleasant experiences, and unpleasant experiences.18,23 The survey took an average of 5–10 min to complete. They were oriented to the liking scale with examples of activities that are generally considered highly likeable (winning the lottery, succeeding), neutral (doing a routine chore), and highly dislikable (getting a paper cut, running out of money). The bidirectional, horizontal scale ranged from “strongest disliking of any kind” (−100) to neutral (0) and “strongest liking of any kind” (+100) labeled with five faces. 18 Each item had a word label and a picture (Fig. 1).
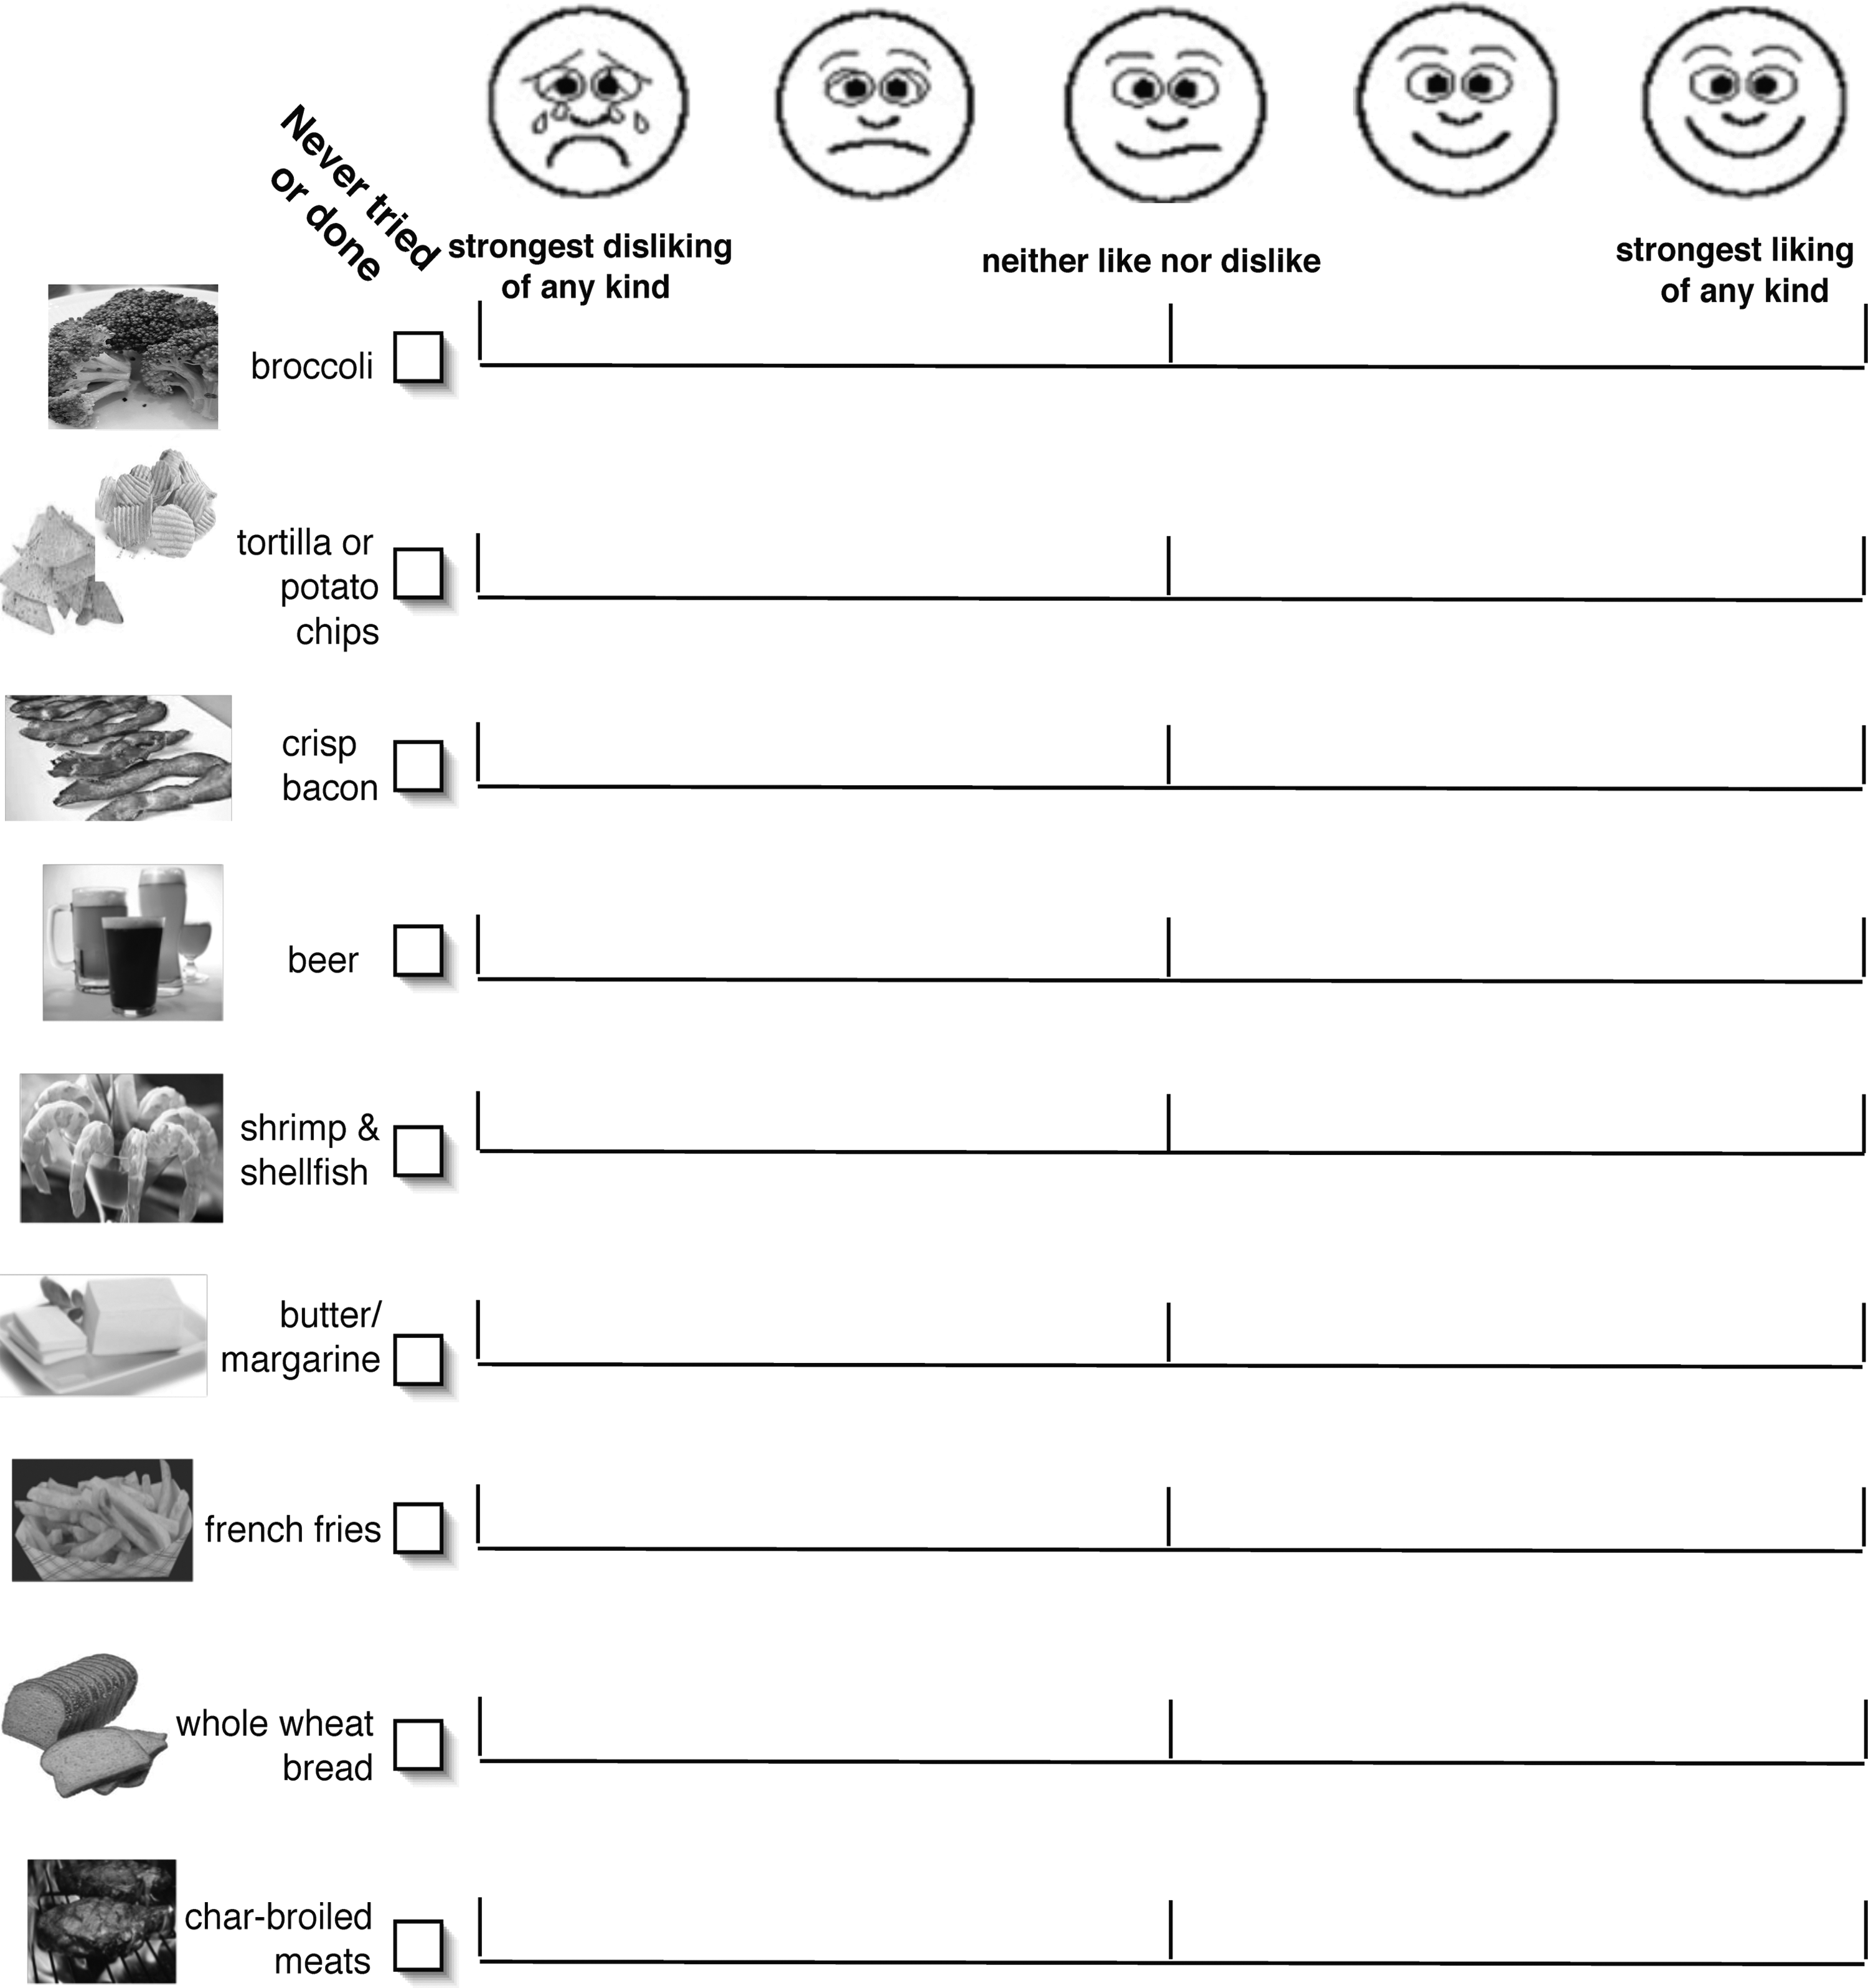
A sample section of the liking survey.
The items were formed into eighteen nutritional, sensory, or activity groups: alcohol, sweet foods, fruits, vegetables, low-fat protein, high-fat protein, sweet drinks, fats, carbohydrates, whole grains, salty, bitter, sour, spicy/flavorful, physical activities, pleasant experiences, and unpleasant experiences. Liking for TV was a separate item.
Dietary quality index and healthy behavior index
Ten of the nutritional groups were considered for the dietary quality index (DQI). The items of the groups were averaged and then weighted based on healthiness following Dietary Guidelines 201520: sweet drinks (−3), sweet foods (−3), fruits (+2), vegetables (+3), refined carbohydrates (−1), fats (−2), low-fat proteins (+3), high-fat proteins (−3), salty foods (−2), and whole grains (+2). The weighted groups were averaged into the DQI. The healthy behavior index (HBI) included all groups in the DQI, with the addition of the physical activity group, which was given a weight of +3. Thus, higher scores on the indices indicated healthier behaviors.
Statistical methods
Data were analyzed by SPSS (version 24, Chicago, IL) with a significance criterion of p ≤ 0.05. Descriptive statistics for the sensory groups, among the bariatric patients, were compared with those from published studies or existing databases from our laboratory among adults without morbid obesity. The groups that participants rated as most preferred were characterized as healthy (vegetable, fiber, low-fat protein), nonfood activities (physical activities, pleasant), fruit, unhealthy (sweets, sweet drinks, alcoholic beverages, salty, high-fat protein, refined carbohydrates), taste/flavorful (sour, bitter, spicy/flavorful), and the single item, television.
Testing of the validity and reliability of the DQI and HBI was adapted from that used to evaluate the HEI 21 and summarized in Table 1. Index scores were compared between males and females, by age, and BMI from self-reported weight and height using descriptive statistics, t tests, and linear regression.
Results
Variability in taste groups and most preferred groups
There was good variability in ratings of liking and disliking across the participants. Figure 3 shows the distribution of mean scores for each group from Table 2 scores partitioned into 25th percentiles and shown from most to least liked. The most liked groups were fruit, pleasant activities, high-fat proteins, and sweet foods (listed from highest); least liked were unpleasant activities, alcoholic beverages, spicy/flavorful foods, and physical activities (listed from over 90% of participants disliking to over 40% disliking).
The taste preference groups, including sour, sweet (foods, drinks), salty, bitter beverages, and spicy/flavorful, showed reasonable to good internal reliability (Table 2) and good variability across the participants (Fig. 2) consistent or greater than the variability seen for sampled foods or survey report in adults without morbid obesity. The variability for sour foods was the highest across the sensory groups (variance = 1707), exceeding that for a sampled concentrated citric acid solution and a sour/astringent berry juice, 24 but equivalent to survey reporting of lemon from an unpublished database of adults from our laboratory. The variances for the sweet, salty, and bitter foods among the present study were equivalent, ranging from 1000 to 1260. These variances were greater than sampled sweet foods (chocolate, cake icing), but equivalent to survey-reported sweet foods, 15 equivalent to bitter beverage, grapefruit juice, or espresso coffee reported by sample or survey, 25 and above the sampled or survey-reported salty foods. 13 The variance for the spicy/flavorful group was equivalent to survey report for a sample of nonobese adults. 24

Percent of patients within a group from Table 1 who reported like (above the white neutral rating) and dislike (below the white neutral rating), partitioned into 25th percentiles, with the darker the shading, the stronger the liking or disliking.
Within a participant, the group(s) (shown in Table 2) that was given the highest preference ratings (i.e., most preferred) also varied across the study sample. Healthy food (vegetables, fiber, low-fat protein groups) was reported to be most preferred by 14% of participants, nonfood (pleasant, physical activity groups) by 11%, fruit by 17%, unhealthy food (sweets, salty, refined carbohydrates, high fat) by 12%, taste/flavorful foods by 14%, and television by 32%. Thus, we cannot conclude that individuals with morbid obesity like food more than nonfoods or television. Adiposity varied by the most preferred group/groups in analysis of covariance, controlling for age and sex effects (F(5,125) = 2.388, p < 0.05). In pairwise comparisons, individuals who reported unhealthy foods as most preferred were significantly heavier (BMI = 50.07 ± 1.83) than individuals reporting most preferred as healthy foods (BMI = 41.35 ± 0.94, p < 0.005), television (BMI = 45.5 ± 1.16, p < 0.05), or nonfood activities (BMI = 44.29 ± 1.45, p < 0.05).
Construct validity of the DQI and HBI
Does the index display sufficient variation in scores among individuals?
The DQI and HBI showed variability across the sample. Both the DQI and HBI had a normal distribution of scores (Fig. 3) as shown by the nonsignificant Kolmogorov–Smirnov statistics of 0.035 (p = 0.20) and 0.038 (p = 0.20), respectively.
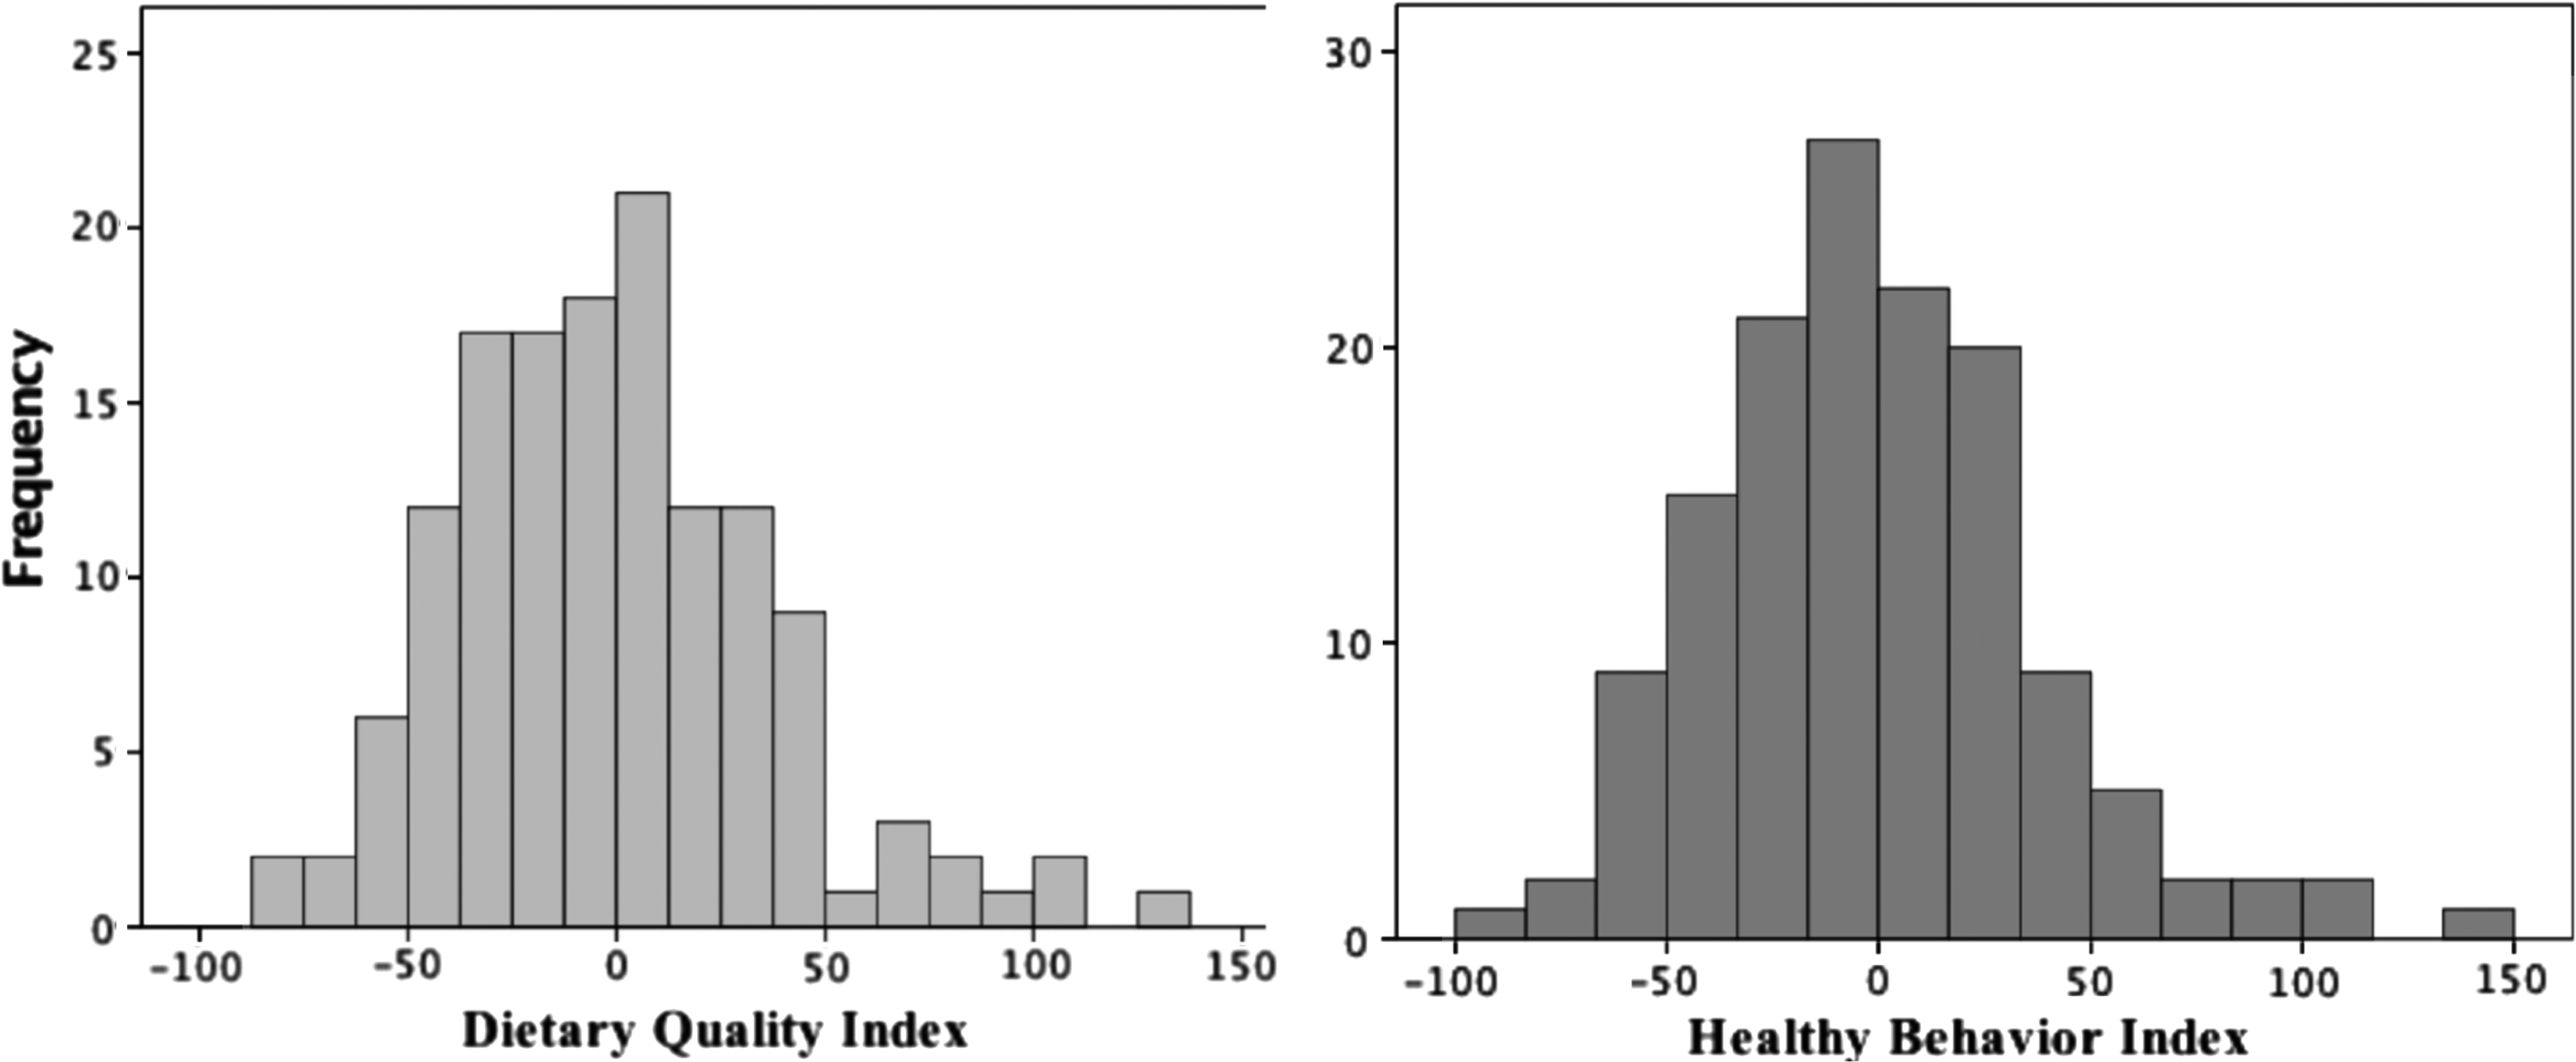
The dietary quality (left) and healthy behavior (right) indices showed significant variation and were normally distributed by the Kolmogorov–Smirnov test (p > 0.05).
Does the index give maximum scores to dietary patterns that follow Dietary Guidelines?
The HBI were consistent with the Dietary Guidelines 2015. For example, the participant with the lowest HBI reported highest preferences for sweets (+75) and fats (+71) yet lowest preferences for vegetables (−81) and physical activity (−50). Conversely, the participant with the highest HBI reported highest preference for fruits (+89), vegetables (+87), and physical activity (+80) yet lowest preference for sweet drinks (−81), refined carbohydrates (−77), high-fat proteins (−74), and salty foods (−72).
What is the underlying structure of the index (i.e., >1 dimension)?
Principal Component Analysis of the DQI and HBI revealed two dimensions that could be labeled into healthy and less healthy and explained approximately 50% of the variability across all groups. Figure 4 (left side) shows the HBI with the first factor, less healthy (high-fat proteins, fats, sweet drinks, sweet foods, salty foods, refined carbohydrates), accounting for 31.5% of the variation. The second factor, healthy (physical activity, vegetables, fruits, low-fat proteins, fiber), accounted for 18.8% of the variation. In comparison, principal component analysis with the HBI, taste, and pleasant/unpleasant experiences uncovered four dimensions (Fig. 4, right side). The first extracted factor could be labeled as unhealthy (23.3% variance) and consisted of simple carbohydrates, sweet foods, fats, high-fat proteins, sweet drinks, and TV. The second extracted factor (16%) consisted of fiber, bitter foods, adventurous foods, sour foods, low-fat proteins, fruit, vegetables, and physical activities. The third factor (8% variance) could be labeled as the social factor, consisting of the alcohol group and pleasant group, which contained social activities (e.g., going to a pub, going to a coffee house). The final extracted factor was the unpleasant factor (7% variance).
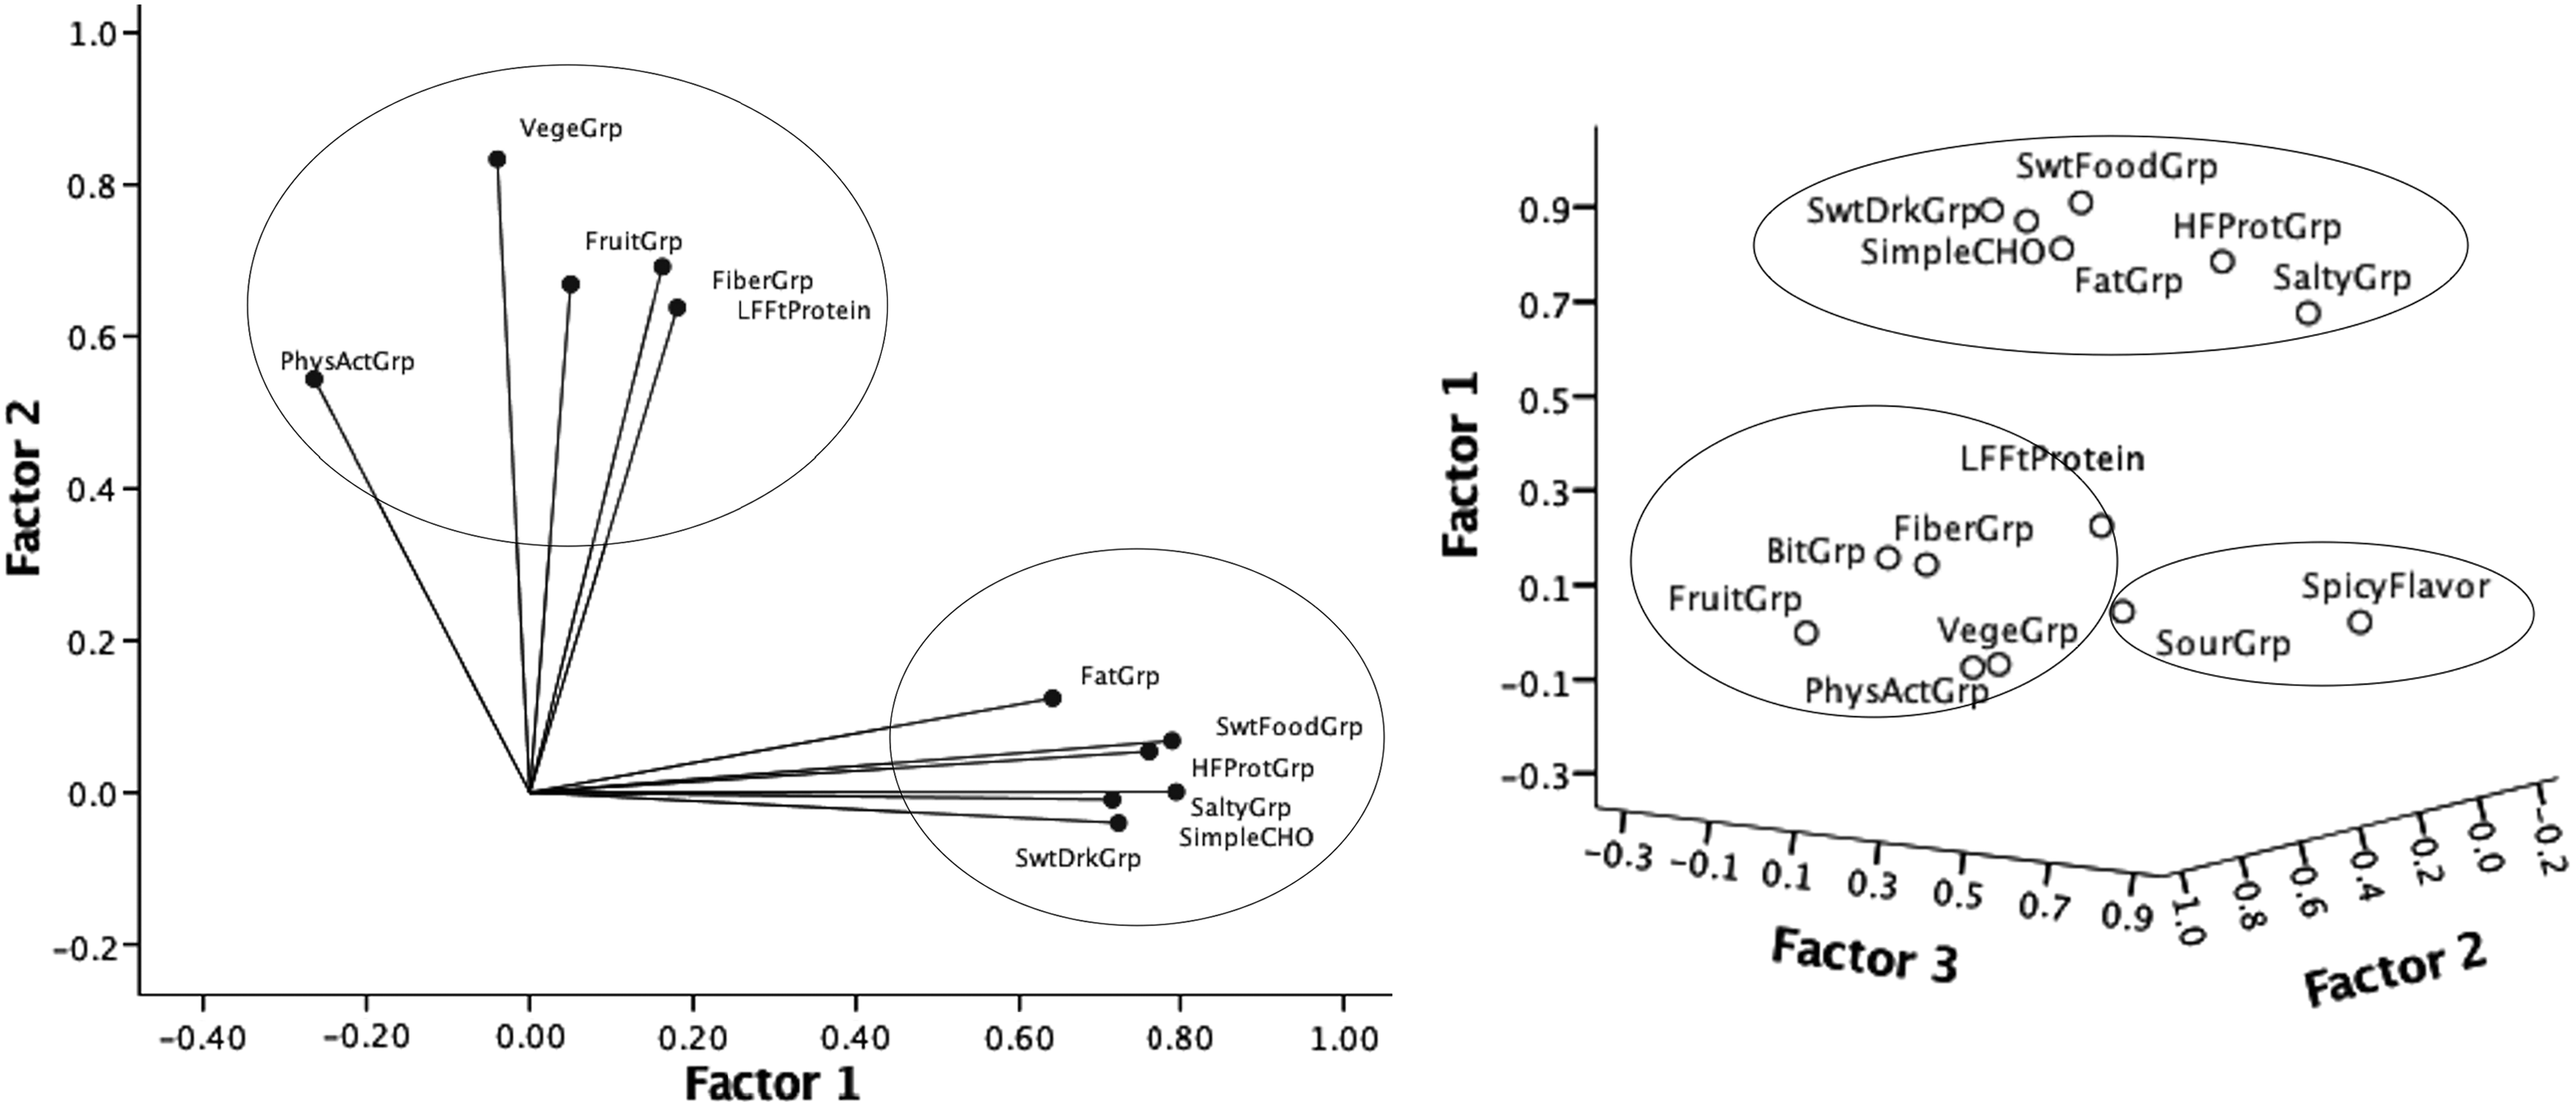
Principal component analysis shows the healthy behavior index has healthier and less healthy dimensions (left) with taste preference groups (right), some overlap (sweet, salty, bitter), and separation (sour, spicy/flavorful).
Does the index distinguish between groups with known differences in diet quality (i.e., concurrent criterion validity)?
Older participants reported healthier DQI and HBI (β’s = 0.21, p < 0.05), yet males and females did not differ significantly in the indices (p's = 0.4–0.5). Differences in DQI and HBI were examined by BMI, controlling for age and gender. Greater adiposity level tended to associate with less healthy indices, particularly in females (β = −0.20, p < 0.05).
Reliability
How internally consistent is the total score?
Cronbach's coefficient alpha provided a measure of internal consistency of the DQI/HBI groups (Table 2). The items within the groups showed reasonable alphas, with the highest correlations among vegetables, sweet foods, physical activities, and refined carbohydrates. The overall index alpha also was reasonable at 0.64 for the DQI and 0.66 for the HBI.
What are the relationships among the index components? Which components have the most influence on the total score?
As per Spearman correlation coefficients, the groups that contributed the most to the DQI and HBI were sweet drinks (−0.62, p < 0.001), high-fat protein (−0.57, p < 0.001), and sweet foods (−0.51, p < 0.001). Salty foods (−0.48, p < 0.001), refined carbohydrates (−0.47, p < 0.001), physical activity (0.43, p < 0.001), and fat (−0.39, p < 0.001) were moderate contributors, and low-fat protein (0.31, p < 0.001), whole grains (0.28, p < 0.01), and fruits (0.27, p < 0.01) contributed least.
Discussion
A feasible and valid assessment tool of taste preferences as well as dietary quality is needed for patients preparing for bariatric surgery. In this study of adults with morbid obesity, we found that a simple survey could collect statistically reliable and variable preferences for taste quality and spicy/flavorful foods and beverages. These findings are consistent with previous studies showing that survey preference can associate well with sampled items.12,13 In addition, the indices of dietary quality and healthy behaviors were valid and reliable according to the criteria evaluating the Healthy Eating Index 2010. 21 The dietary quality and HBIs also showed some criterion validity—healthier indices were seen among older adults and tended to be seen among those with lower BMI. Patients could complete the survey in a short amount of time and researchers or clinicians could process it rapidly and inexpensively into sensory, nutritional, and lifestyle indices, particularly if a web-based survey is used. 18
Our survey included pleasant and unpleasant activities to compare with foods and beverages. Bartoshuk et al. 9 showed that individuals with obesity have a stronger hedonic response to foods than do nonobese individuals. Their work suggested that conventional scales, based on uniform perceived intensities, cannot accurately distinguish food preferences between those who are obese versus normal weight; rather, unrelated sensory and hedonic experiences should be used to make between-group comparisons. In the present study, we found that individuals with morbid obesity varied in rating their most pleasant groups, with about 43% of the sample reporting that nonfoods were the most preferred. Pilot data from our group suggest that individuals who prefer less healthy foods at baseline were most responsive to an intervention that focused on improving dietary behaviors. 27 However, the pleasant nonfood group in the present study had unacceptable internal reliability, suggesting that we need further research to capture activities that are most pleasant to individuals with morbid obesity.
Changes in preferences for less healthy and healthy foods may be key to long-term success in weight loss by behavioral intervention or bariatric surgery. Preliminary data from our group have found that adults most successful in weight loss postbariatric surgery had greater dietary quality scores than adults before the surgery 28 —the dietary quality scores were generated from survey food preferences as reported in the present study. Preliminary data, also from our group, have shown that a simple survey can explain changes in food preferences that track with weight loss across a behavioral intervention. 29 Results from a simple liking survey can inform tailored interventions for longer-term weight loss/maintenance postbariatric surgery, acknowledging that tailored interventions may be most effective for weight loss. 30
While we developed a DQI according to population-based guidelines, the method of weighting groups may need adjustment to consider dietary guidance for postbariatric surgery. For example, the fiber group, which was given a weight of +2 based on diet guidelines, may be weighted less positively considering the postsurgery dietary recommendations for bariatric patients. 31 Practitioners can score an individual's dietary quality based on their individualized recommendations for their needs and tailor the nutrition message considering the patient's reported liking. In a study of adults with obesity who participated in a 52-week weight reduction program, those who demonstrated low liking of all foods and strong inhibitory control were the most successful at weight loss at week 52. 32 It is important for practitioners to consider both liking and the patient's level of inhibitory control. 33
In conclusion, a simple liking survey can offer a valid method for clinicians to expediently measure food preferences. The main strength of this study is the use of a liking survey that had been validated against biomarkers in a large twin study 18 and utilization of multiple statistical approaches to determine that the DQI had validity and reliability. One limitation of this study was that the index was not compared with normal weight controls and the sample was of convenience. Future studies should explore the association between reported liking and outcomes of bariatric surgery success. The survey in the present study was administered in print form, but has been used in electronic form. 18 The electronic form would allow groups and indices be calculated immediately to be used for tailored interventions.
Footnotes
Author Disclosure Statement
No competing financial interests exist.