
Abstract
Purpose:
The laparoscopic sleeve gastrectomy (SG) is an effective stand-alone procedure in the surgical treatment of overweight. The present study focused on the treatment of patients with SG and documented changes regarding the nutritional status, improvement of HbA1c, and postoperative weight loss.
Methods:
One hundred fifty-seven patients were subject to an SG. The development of vitamin D-, B1-, and B12-levels, as well as HbA1c, weight, body mass index, and percentage of excess weight loss (%EWL), was obtained postoperatively.
Results:
The preoperative deficit of vitamin D (15.44 ng/L) was eliminated after SG and increased up to 27.85 ng/L. Vitamin B12 showed no significant variance at any time. Vitamin B1 and B12 were based in the reference range during the whole study. The study showed a significant %EWL in the first 12 months (maximum: 52.47%) with a mild weight regain after 24 and 36 months. HbA1c showed a decrease from 6.07% to 5.47% after 12 months and an increase up to 5.57% thereafter.
Conclusions:
Apart from a few exceptions, vitamin supplementation is not obligatorily necessary after SG. SG improves the HbA1c in correlation to the weight loss and reaches a maximum weight loss in the first postoperative year with a trend of weight gain thereafter.
Introduction
I
Initially, SG was intended to be one of two steps in the treatment of overweight. It should represent the introduction of the gastric bypass or as a secondary intervention in case the initial weight loss after a first intervention such as gastric banding is unsatisfactory.6,7 Overall the laparoscopic SG is an effective procedure in the surgical treatment of overweight due to low rate of major complications, simplicity of the technical procedure, shorter postoperative hospitalization, and the generally good results in weight reduction.8–12
While most common studies deal especially with the loss of weight and differences between various treatments, a further important aspect during the therapy of overweight is the reduction of comorbidities. A variety of studies published described that bariatric surgery achieved a reduction of diabetes mellitus type 213–15 and also has an effect on nutrient balance.16–18 Studies on bariatric surgery reported a reduction of overweight in the range of 50–75%. 19 With regard to percentage of excess weight loss (%EWL) and the improvement of comorbidities, the RYGB showed slightly better results than the SG,8,20,21 which showed better results compared with gastric banding. 22 Relating to nutrient deficiency, studies indicate that postoperative major nutritional deficiencies after RYGB are greater than after SG.16,17 In most cases, the nutrient deficiency measured was only slightly reduced and could be compensated by taking some vitamin preparations. 18
The present study focused on the treatment of patients with SG and documented changes in vitamin D, B12, and B1 levels as well as the improvement of HbA1c and postoperative weight loss. The aim of this study was to discuss if a vitamin supplementation is necessarily after SG.
Materials and Methods
This retrospective study is based on a preoperative patient collective of 157 patients (109 females, 48 males). The operative period occurred between April 2007 and January 2015. Before the start of the operation, all study participants were verbally informed about the intent of the study and the methods and treatment applied. Consent was obtained verbally (as per clause 26 of the Declaration of Helsinki).
The patients showed a body mass index (BMI) >35 kg/m2, the preoperative average BMI was 51 kg/m2. All patients received a detailed preoperative diagnostic and nutrition counseling. They were evaluated by a psychiatric, cardiologist, anesthesiologist, and endocrinologist to prevent intra- and postoperative complications. After medical elucidation and written consent, all patients underwent an SG. Postoperatively, all patients were educated for nutritional intake, as well as nutrition assistance, including a standardized nutrition script for restorative diet. As part of this retrospective study, the changes in vitamin D-, B12-, B1-levels and HbA1c were analyzed, as well as changes in weight, BMI, and %EWL. The first data were collected postoperatively after 6 weeks and in the following 3, 6, 12, 24, and 36 months. After 12 months, the number of data collected did not allow a representative statistical significance level and therefore described as an analysis of trends marked as a gray rectangle in the following charts. For several of the patients, the date of operation was too close to the analysis of the study, so the observed period did not achieve 2 or 3 years. On the contrary, some patients were lost to follow-up. A postoperative recommendation for supplementation was only pronounced in case of nutritional deficiencies in postoperative blood tests. High blood values or big differences to prior blood values, which argue to a potentially artificial supplementation, were excluded.
Statistical analysis
SPSS (IBM, SPSS Statistic 23) was used to conduct the statistical analysis of the data obtained. For nonparametric data, the Wilcoxon signed-rank test was used. Confidence intervals were set at 95%, p-value of <0.05 was considered statistically significant. The data are presented as mean or number (%). The variation of the sampling is shown as the standard error of the mean (SEM).
Results
Vitamins
The present study examined the change of vitamin balance after SG. We analyzed vitamin D, B12, and B1 (Figs. 1–3). The reference value for vitamin 20-OH-VitD3 is described as 20–100 ng/mL. Vitamin B12 has a reference range between 250 and 900 pg/mL and B1 of 28 to 85 μg/L. The scaling of the diagrams was selected according to the reference range of vitamins. Thus, the position of the vitamin levels is better illustrated.
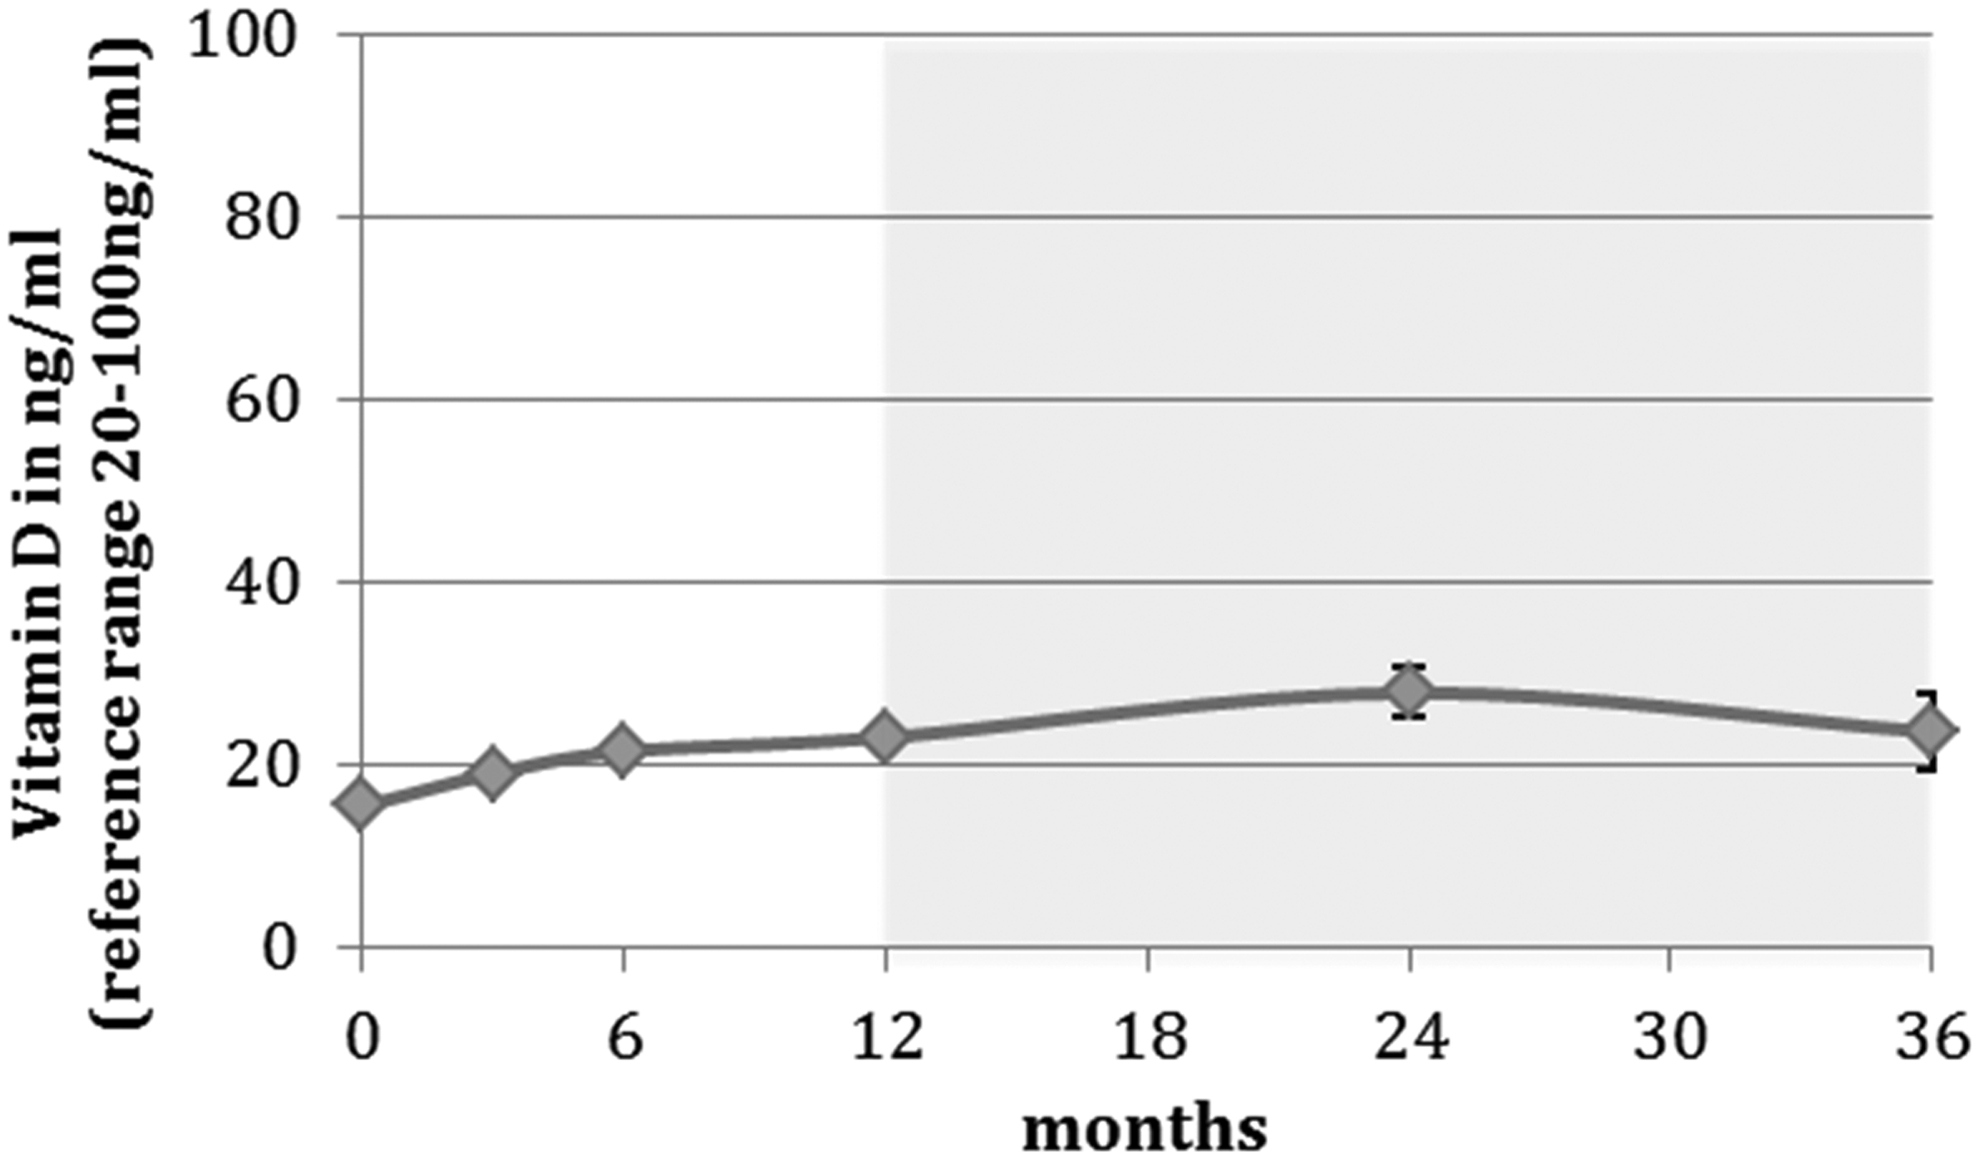
Vitamin D in ng/mL. Trend analysis is marked as a light gray rectangle (months 24 and 36).
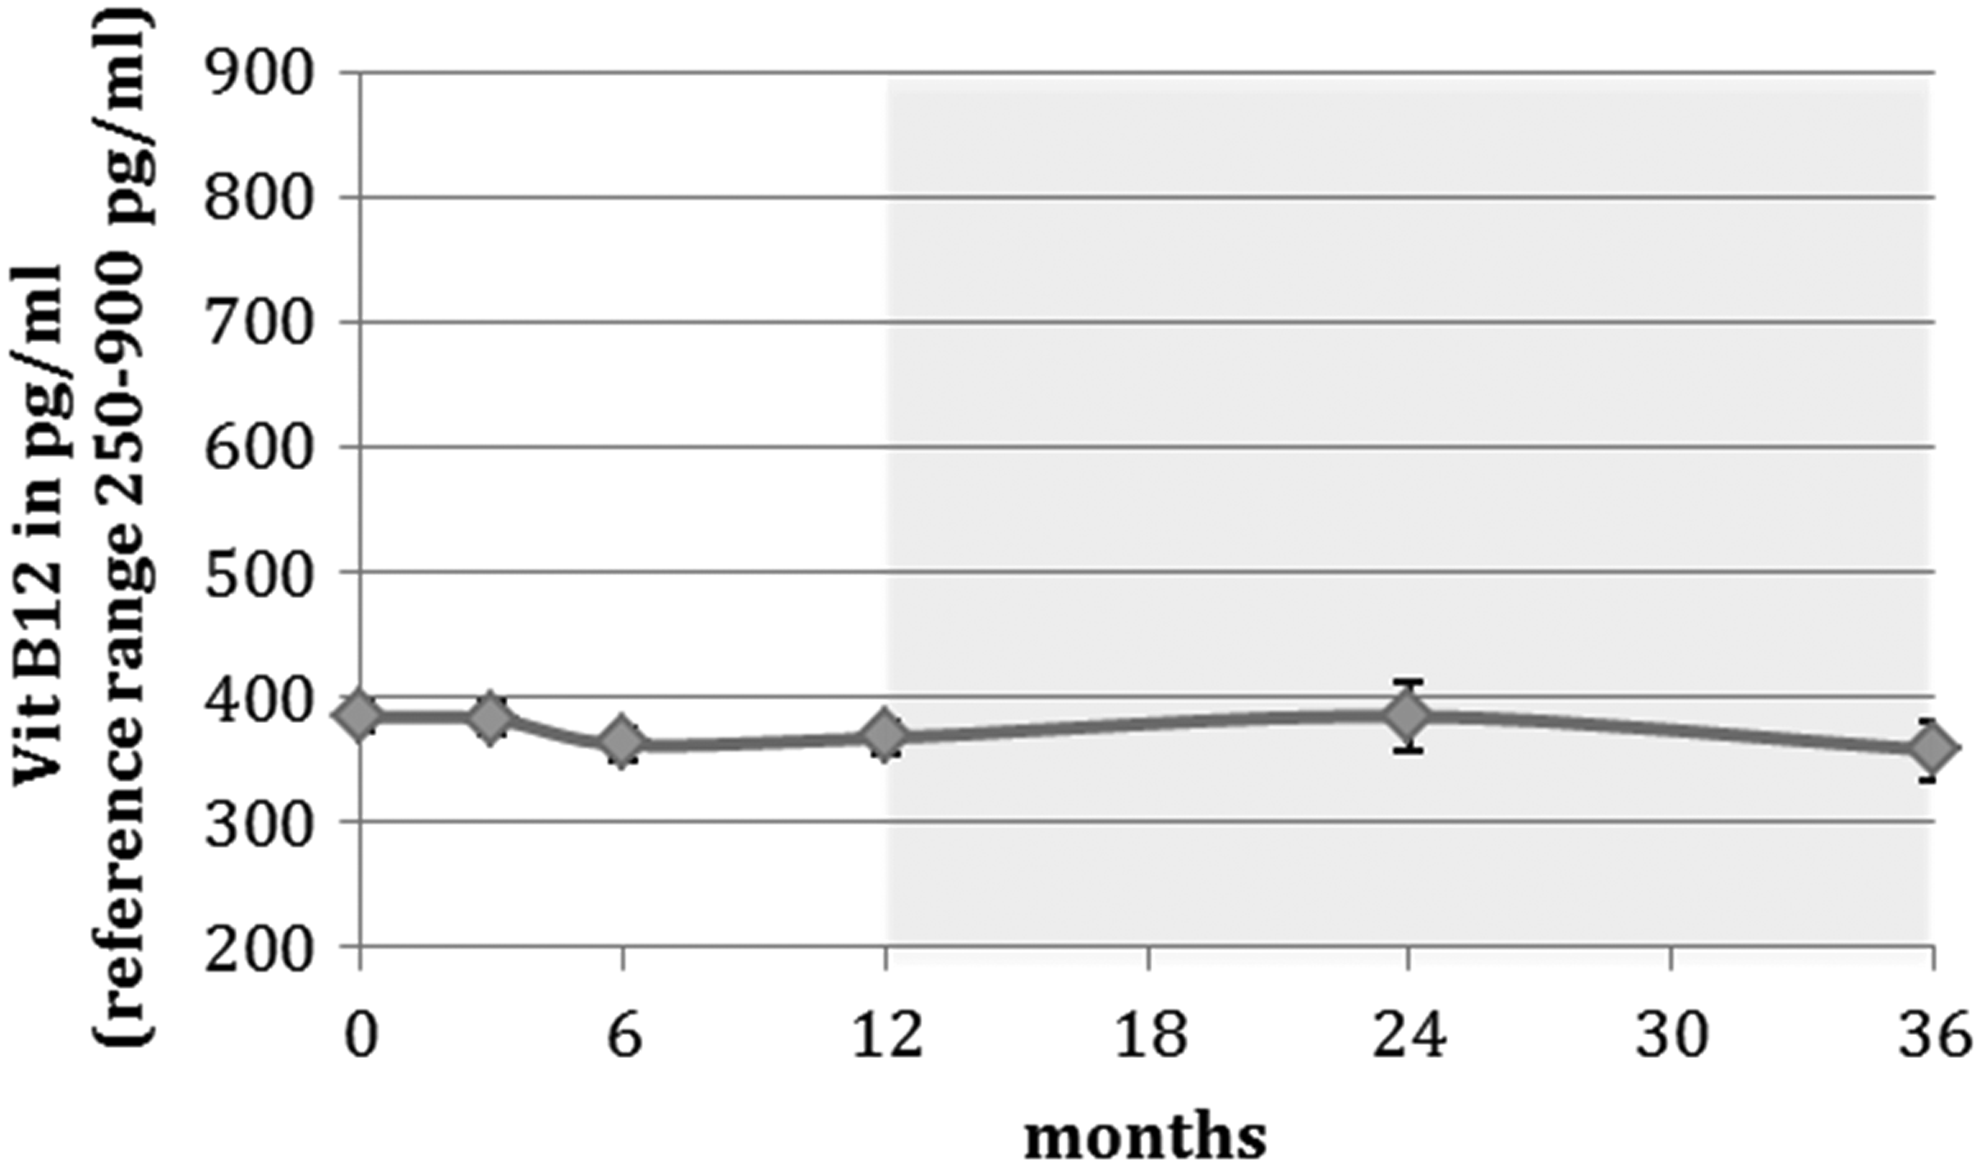
Vitamin B12 in pg/mL. Trend analysis is marked as a light gray rectangle (months 24 and 36).
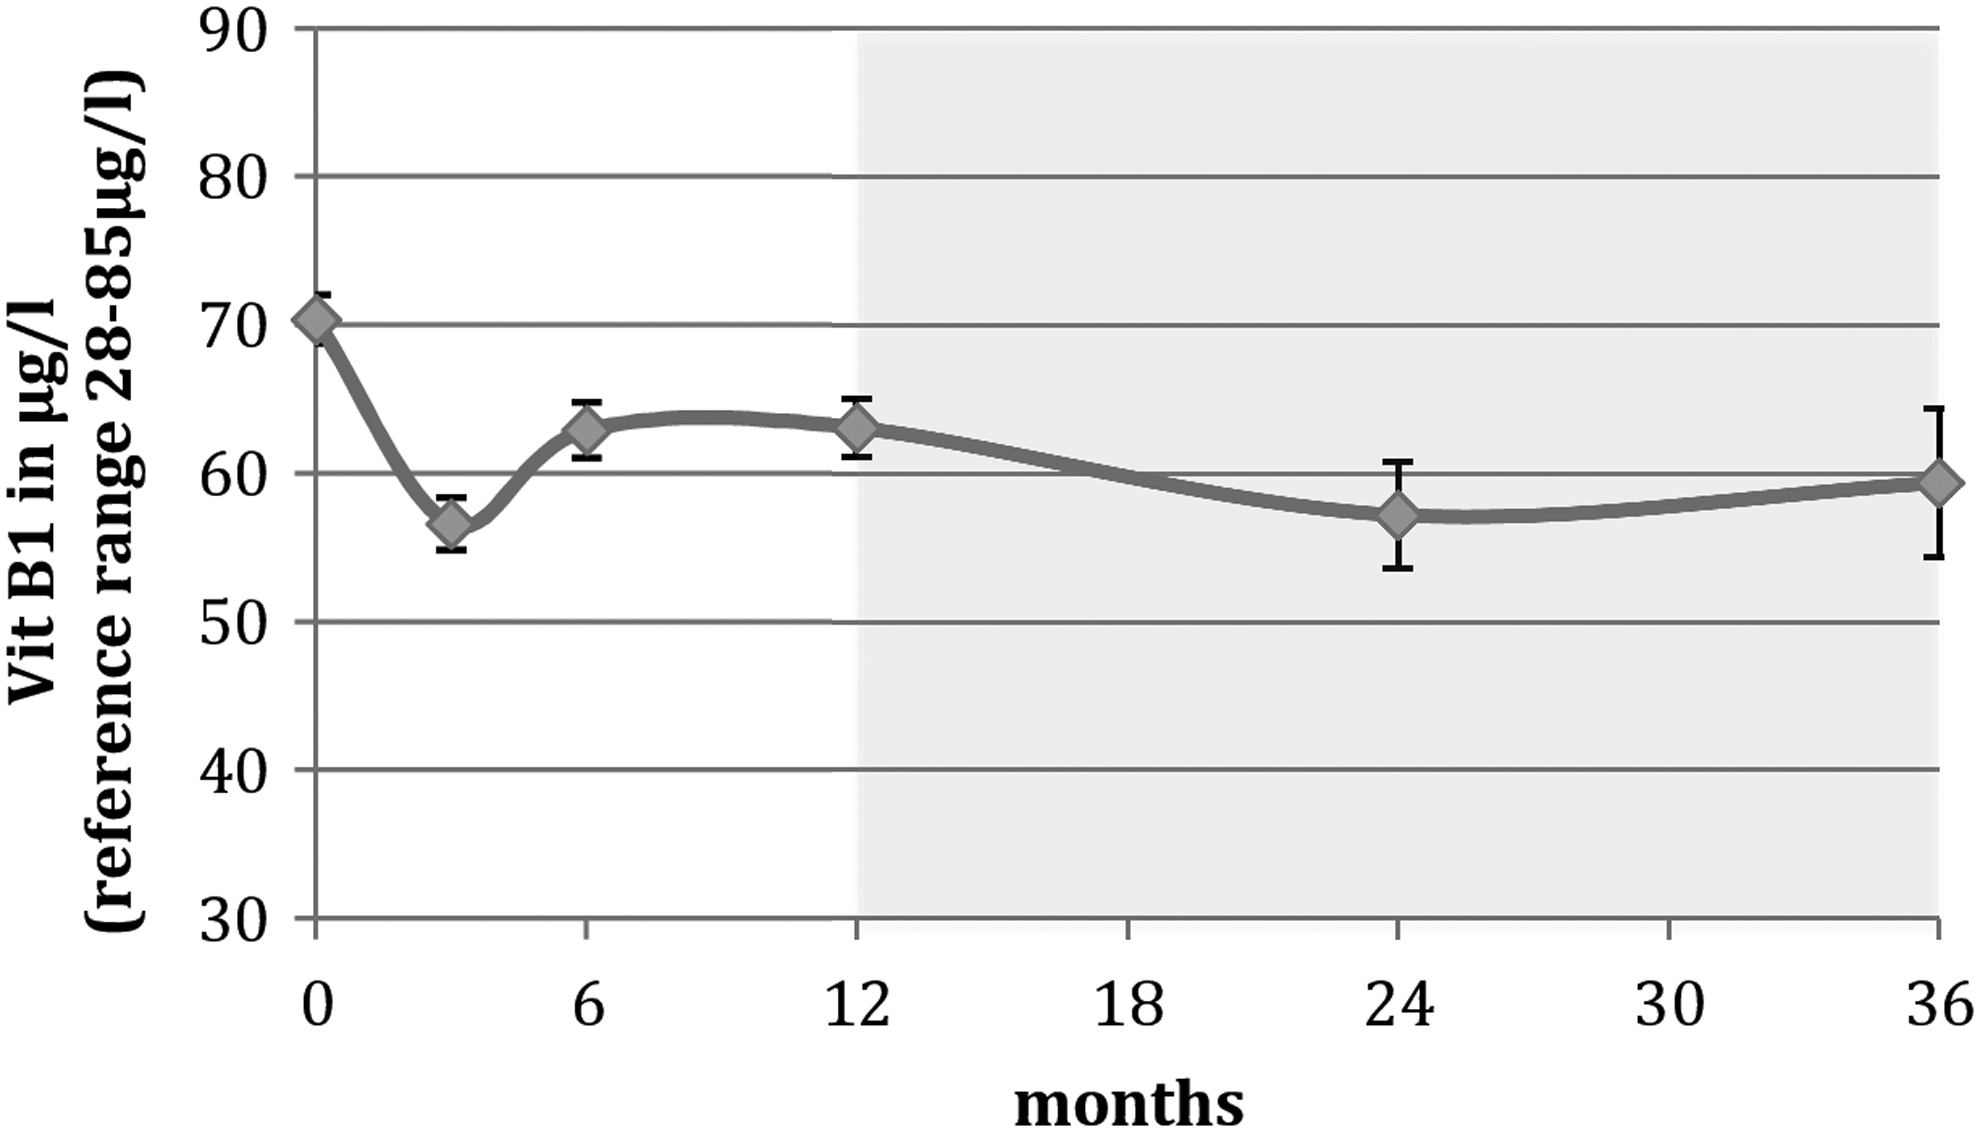
Vitamin B1 in μg/L. Trend analysis is marked as a light gray rectangle (months 24 and 36).
Preoperative patients showed a deficit of vitamin D with a mean of 15.44 ng/L (SEM = 0.81). There was no significant difference after 3 months (19.02 ng/L, SEM = 1.15, p = 0.124). Six months after the operation, vitamin D showed a significant increase up to an average of 21.44 ng/L (SEM = 0.97, p = 0.009). In the further course of the study, there were no significant changes observed. We analyzed a mean of 23.00 ng/L (SEM = 1.14, p = 0.219) after 12 months, 27.85 ng/L (SEM = 2.64, p = 0.918) after 24 months, and 23.59 ng/L (SEM = 4.12, p = 0.684) after 36 months (Fig. 1).
Regarding the level of vitamin B12, no significant variance has been identified throughout the entire measurement period. All average has been in the range of reference (250–900 pg/mL). The mean range was between 362.5 and 385.1 pg/mL (Fig. 2).
With regard to any postoperative changes of vitamin B1, the study revealed that the mean values of the data collected per patient across the entire measurement period were based within the reference range, which is from 28 to 84 μg/L (Fig. 3). While preoperatively an average of 70.38 μg/L (SEM = 1.63) was determined, we analyzed a significant (p < 0.001) decrease to 56.59 μg/L (SEM = 1.76) after 3 months followed by a significant (p = 0.007) increase to 62.9 μg/L (SEM = 1.86) after 6 months. In the following period, no further significant variances could be determined compared to prior values (12 months: 63.08 μg/L, SEM = 1.97, p = 0.79; 24 months: 57.19 μg/L, SEM = 3.61, p = 0.179; 36 months: 59.38 μg/L, SEM = 4.97, p = 1.000) (Fig. 3).
HbA1c
The HbA1c was used as an indicator, regarding the improvement of diabetes mellitus type 2. Preoperative the mean value was measured at 6.07% (SEM = 0.12). After 3 and 6 months, there was a significant (p < 0.001) reduction to 5.61% (SEM = 0.08) and 5.49% (SEM = 0.07, p = 0.011). Although percentage-wise there was a further reduction to 5.47% (SEM = 0.08) between 6 and 12 months, this represented no significant statistical difference (p = 0.543). In the following, the analysis of trends presented a significant increase (p = 0.019) after 24 months with a value of 5.57% (SEM = 0.14) compared with prior values, and after 36 months a small decrease (5.53%, SEM = 0.13) without any significance (p = 0.461). HbA1c data are presented in Figure 4.
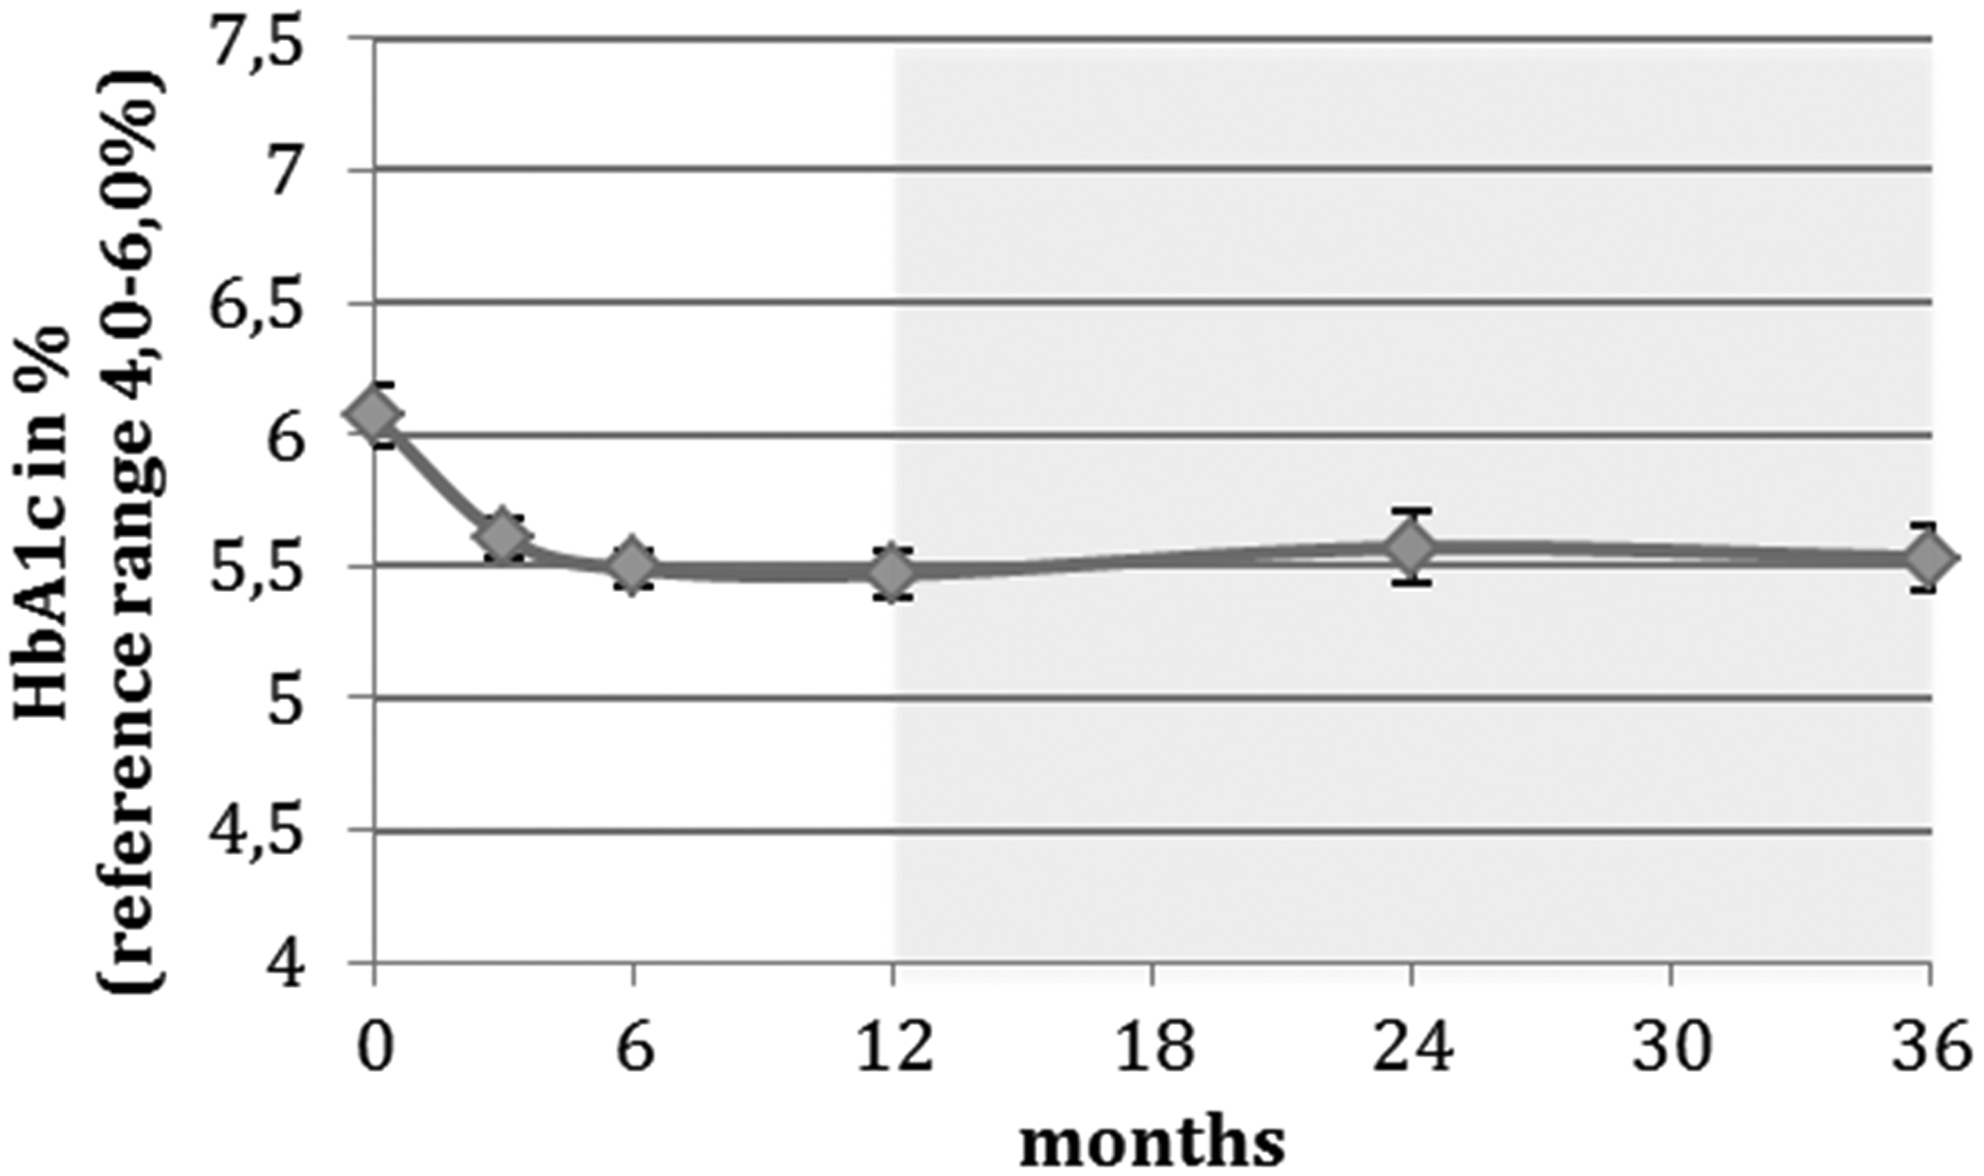
HbA1c in%. Trend analysis is marked as a light gray rectangle (months 24 and 36).
Weight loss
The preoperative average weight was 147.6 kg (range 96–236 kg) and the associated average BMI was determined at 51.04 kg/m2 (range 35.00–81.66 kg/m2). The postoperative weight showed a significant weight loss (p < 0.001) represented as the percentage of weight 89.45% (SEM = 0.29) after 6 weeks, 84.3% (SEM = 0.37) after 3 months, 77.06% (SEM = 0.55) after 6 months, as well as 71.77% (SEM = 1.04) after 12 months (Fig. 5). The analysis revealed that after 12 months the trend of average weight loss reversed. At 24 months, the percentage of weight was assessed at 73.42% (SEM = 2.3) indicating no significance (p = 0.218). After 36 months a more significant weight gain (78.57%, SEM = 3.31) compared with the prior body weight (p = 0.015) was recorded (Fig. 5).
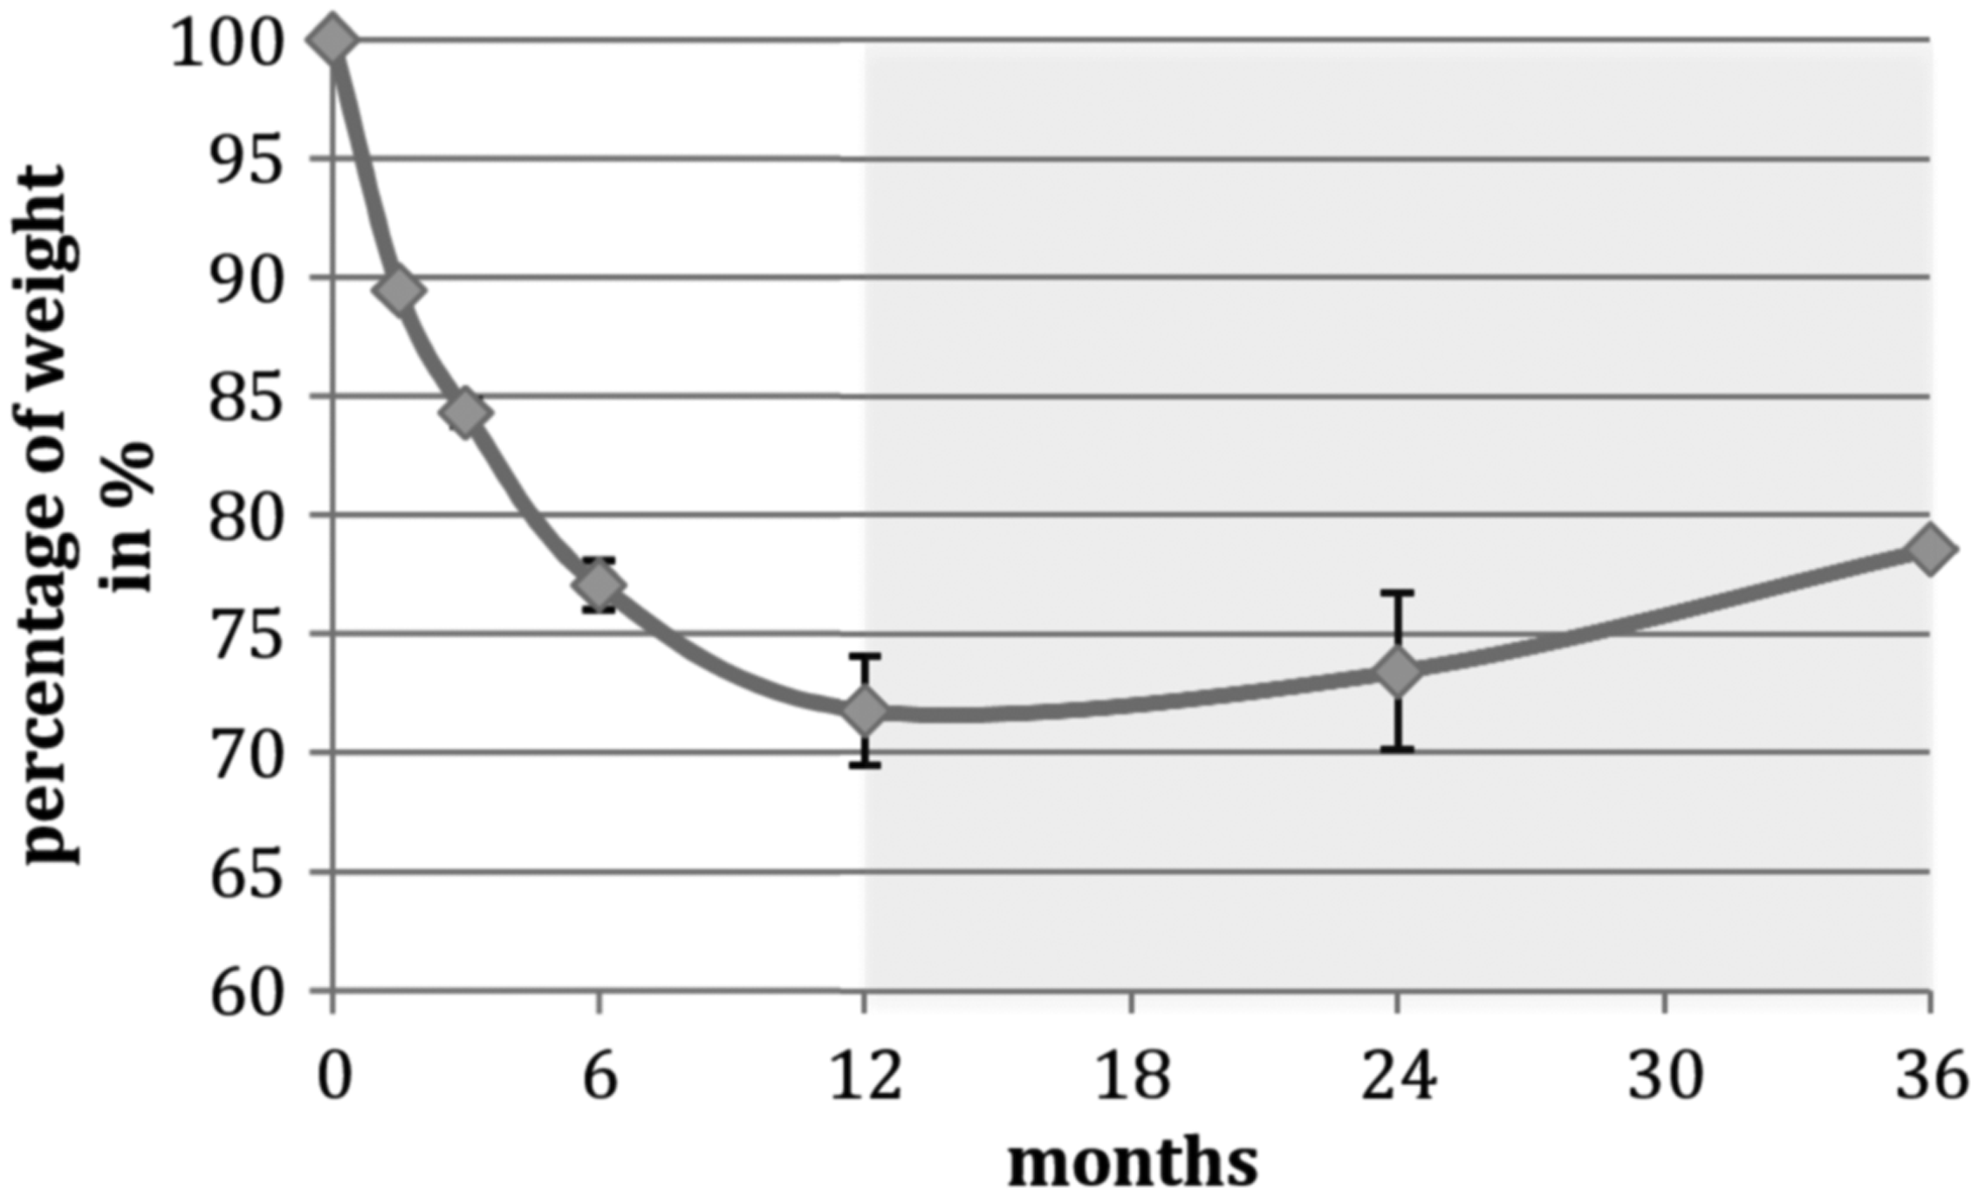
Percentage of weight. Trend analysis is marked as a light gray rectangle (months 24 and 36).
At the early points of measurement, the %EWL showed a significant (p < 0.001) weight loss after 6 weeks (19.61%, SEM = 0.61), 3 months (29.52%, SEM = 0.78), 6 months (43.51%, SEM = 1.27), and 12 months (52.47%, SEM = 2.11), pictured in Figure 6. Like for the percentage of weight loss, the analysis of trends showed no significant reduction in terms of %EWL after 24 months (49.86%, SEM = 4.61) and a reduction with significant difference after 36 months compared to the previous value (38.80%, SEM = 5.48) (Fig. 6).
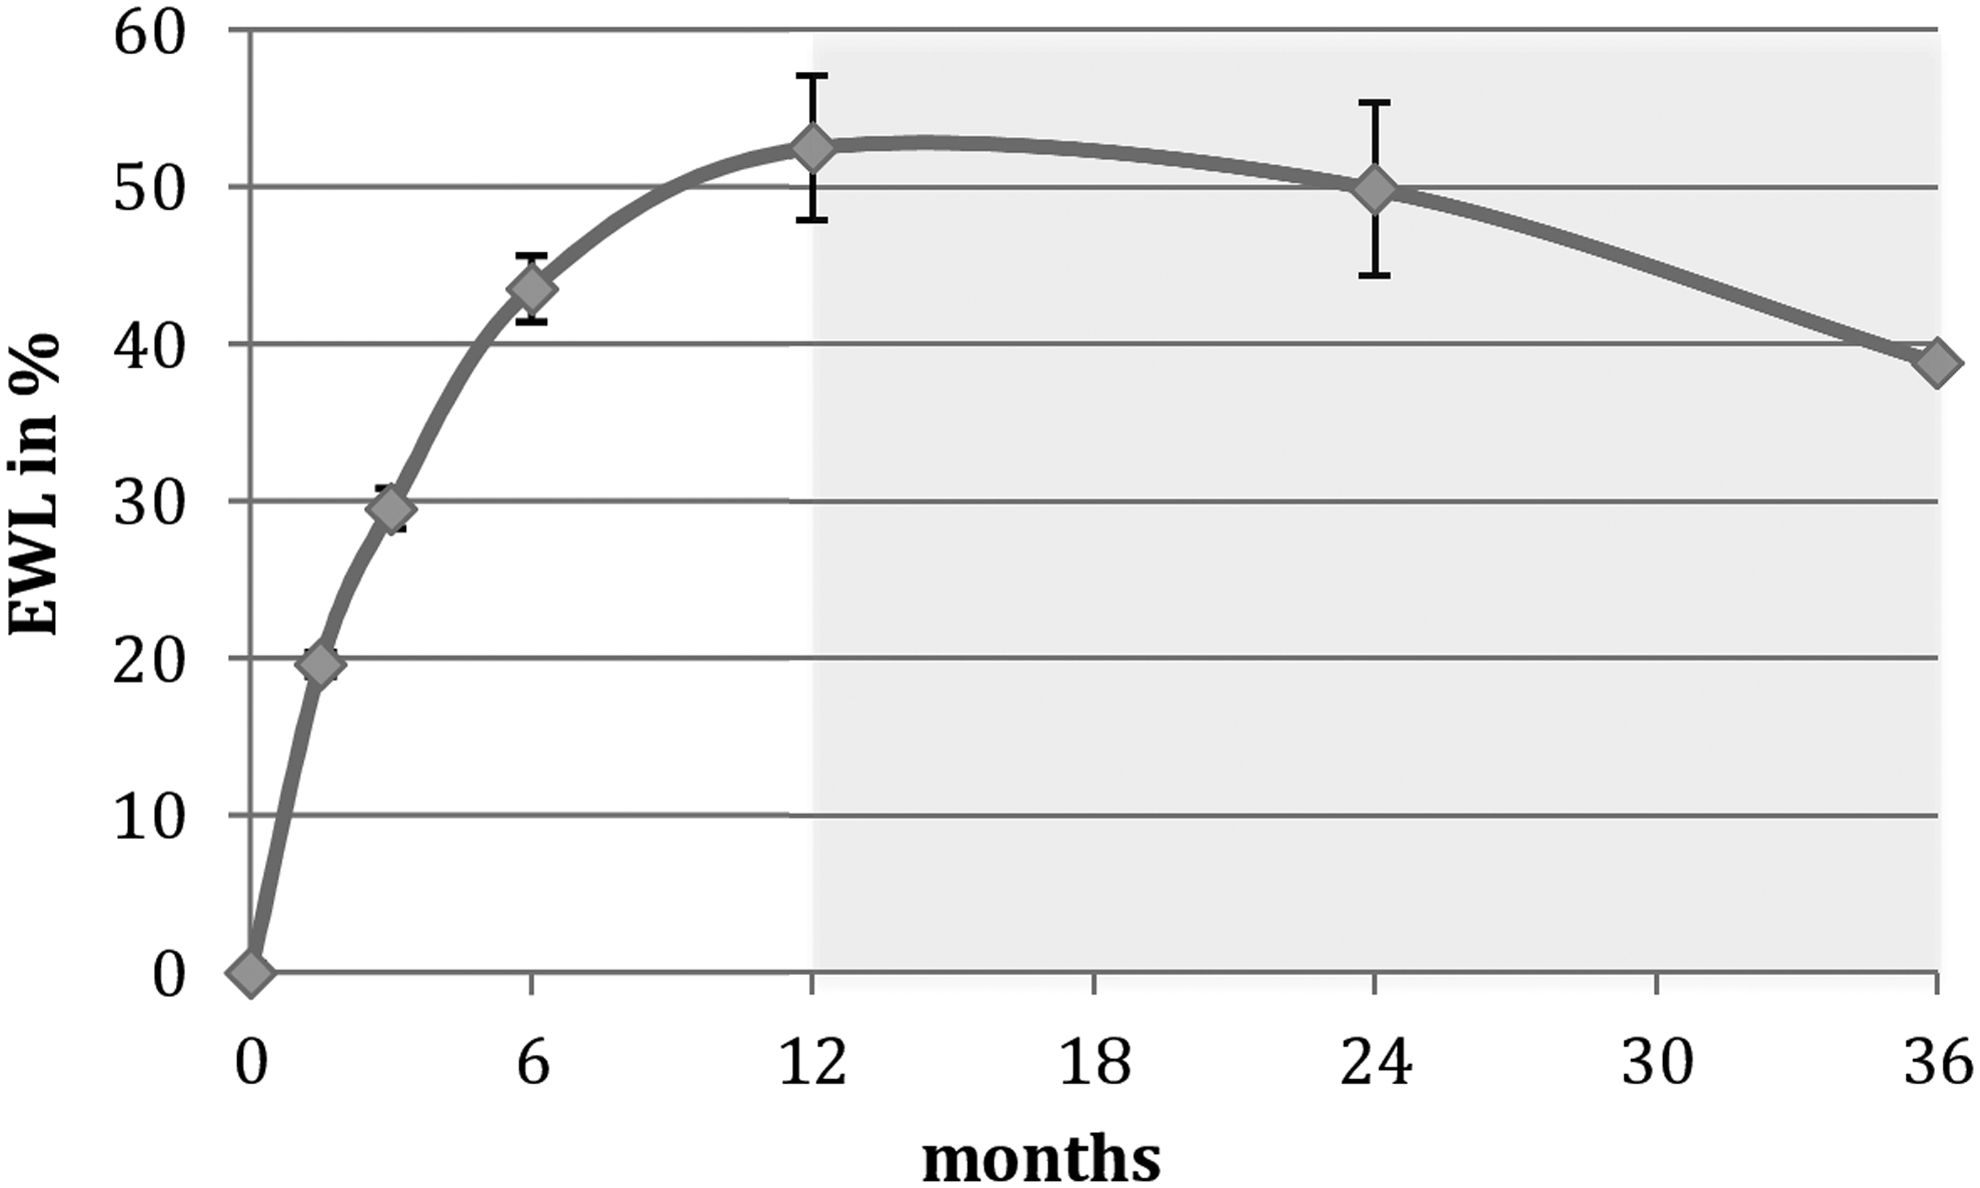
Excess of weight loss in%. Trend analysis is marked as a light gray rectangle (months 24 and 36).
A summary of all perioperative data and the corresponding statistical analysis by p-values are demonstrated in Tables 1 and 2.
Trend analysis is marked as a light gray rectangle (months 24 and 36).
POW, percentage of weight; SEM, standard error of the mean; %EWL, excess of weight loss; BMI, body mass index.
Significant p-values are marked as a dark gray rectangle, trend analysis is marked as a light gray rectangle (months 24 and 36).
Discussion
Lots of former studies described a preoperative nutrient deficiency in patients with obesity23–26 and often postoperative impairment of the nutritional status. The present collective of patients also showed preoperative lack of vitamin D with a mean of 15.44 ng/mL (SEM = 0.81). This deficiency may be due to an accumulation effect of the fat tissue. 27 Three-month postoperative vitamin D levels improved and rose steadily. The trend showed an increase with a maximum average after 24 months of 27.85 ng/mL. As described above, a postoperative recommendation for supplementation was only pronounced in case of nutrient deficiencies in postoperative blood tests. There was an increase of vitamin D levels for most of the patients after 3 months, so supplementation was not necessary. Overall, the study could not establish a deficit of vitamin D. However, the mean values of the collected data were based in the lower part of the reference range.
With regard to the postoperative value of vitamin B12, the study could reach similar results as vitamin D. Vitamin B12 is being absorbed in our stomach depending on the gastric acid and intrinsic factor, created by the stomach tissue. After stomach stapling operation, a deficit of vitamin B12 is obvious, as some studies described before.24,28 However, the present results showed no vitamin B12 deficit after SG. Similar to vitamin D, the values were based in the lower part of the reference range, but without any significant change during the whole measurements. A supplementation was recommended after a deficiency was detected as a result of blood testing.
Vitamin B1 showed the best outcome compared with all vitamins. A deficit of vitamin B1 can generate the beriberi disease or Wernicke's encephalopathy. Preoperative, the collected values were based in the upper part of the reference range with a mean of 70.38 μg/L (SEM = 1.63). The study analyzed a significant decrease after 3 months (56.59 μg/L). After 6 months, metrics showed a significant increase without any further significant change thereafter. The values of vitamin B1 had an adequate level in the entire study with no evidence of deficiency.
The present study analyzed the postoperative changes of HbA1c as an indicator for diabetes mellitus type 2. There was a significant improvement of HbA1c after 3 and 6 months. Furthermore, HbA1c improved up to the 12th month. However, this was without any statistical significance. After 12 months HbA1c increased, but showed a time delay compared with the increase in weight. This is due to the fact that an increase of HbA1c is always following a weight increase in a time delay. In addition, it may be likely that in this early stage of medical treatment, the patients have not gained such a significant weight increase, which results in a correspondingly strong HbA1c increase.
Moreover, the results of this study show a successful weight loss by laparoscopic SG. The metrics revealed a constant loss of body weight over the first 12 months, reaching a maximum of 52.47% EWL (SEM = 2.11) 1 year after the operation. However, weight gain can occur later again, as described in other studies12,14,29–32 and is replicated by the 24- and 36-month data of our study.
Compared with gastric bypass, SG does not seem to be quite as effective with regard to long-term weight loss.8,9,18,20,21 However, the reduction of weight was not the only decision criteria for the choice of surgical treatment. Studies showed benefits of SG in the lower rate of major complications, a simpler technical procedure, a shorter operation time, a shorter postoperative hospitalization, and the improvement of diabetes mellitus type 2, as well as a better outcome due to the fewer nutrient deficiencies. After performing an RYGB, the gastrointestinal anatomy is changed. A vitamin absorption is impeded resulting in closed examination, compared with SG.8,9,11,18,26
The limitations of the study are some missing data after 2 and 3 years. The data that were collected after 2 and 3 years did not allow a representative statistical significance level and therefore described as an analysis of trends marked as a gray rectangle in the charts. For several of the patients, the date of operation was too close to the analysis of the study, so the observed period did not achieve 2 or 3 years. On the contrary, some patients were lost to follow-up. Loss of follow-up is often associated with reduced compliance, which should be considered.
Conclusion
With regard to the explored period of 36 months, the study could demonstrate that laparoscopic SG does not necessarily result in a postoperative nutrient deficiency. However, supplementing vitamins is not false. Especially the patient, whose results are based at the lower part of the reference range, could benefit from supplementing. Overall, the reduction of weight improved the vitamin D level. Vitamin B12 stayed constant in the lower part of the reference range and vitamin B1 showed satisfactory values over the whole study. After SG, there was an improvement of HbA1c correlative to the weight loss. Moreover, laparoscopic SG achieves a significant weight loss in the first postoperative year with a trend of weight gain thereafter. The long-term outcome is depending on the compliance of patients after 1 year, which includes the eating habits. Overall, the study showed that surgical treatment alone is not fully sufficient to decrease weight and minimize obesity in the long term. However, it can be considered a treatment with initial and moderate success at low risk.
Footnotes
Acknowledgment
The authors acknowledge Mrs. Maucher from SHG Adipositas for her support.
This research did not receive any specific grant from funding agencies in the public, commercial, or not-for-profit sectors.
Author Disclosure Statement
No competing financial interests exist.