
Abstract
Background:
The phenomenon of “former obesity history-weight loss-easy to regain weight” is referred to as obesogenic memory. Despite its significance, the underlying mechanism remains poorly understood. This study aimed to construct a potential transcription factor (TF)-miRNA-mRNA network in obesogenic memory.
Methods:
Microarray datasets for miRNA (GSE61005) and mRNA (GSE8586 and GSE76944) were obtained from the Gene Expression Omnibus database, comparing individuals with a history of obesity to those who have never been obese. Differentially expressed genes (DEGs) and differentially expressed miRNAs (DEMs) were analyzed. Subsequent analyses involved gene ontology and pathway enrichment assessments and the construction of a TF-miRNA-mRNA network.
Results:
We discovered 63 DEGs and 48 DEMs, with DEGs predominantly linked to neutrophil chemotaxis and chemokine activity. Pathway analysis revealed enrichment in cytokines and inflammatory responses. Module network analysis identified 14 hub genes. The TF-miRNA-mRNA network involved two TFs, eight miRNAs, and nine mRNAs. Egr2 emerged as a key regulator of most miRNAs, whereas CLEC4E, CXCL1, and SERPINB6B were potential targets of identified miRNAs.
Conclusion:
Two hub TFs, eight hub miRNAs, nine hub mRNAs, and several potential TF-miRNA–mRNA interactions were identified in obesogenic memory. These TF-miRNA-mRNA interactions shed light on obesogenic memory mechanisms and offer promising therapeutic targets.
Introduction
Obesity is a chronic metabolic disease characterized by the accumulation of excess fat in the body, resulting from an imbalance between calorie intake and expenditure. 1 Currently, obesity has become a widespread public health problem, significantly impacting human well-being. According to the World Obesity Atlas 2023 Report, ∼15% of the global population is currently affected by obesity. 2 As a systemic disease, obesity affects physical appearance and can lead to a series of metabolic diseases, including type 2 diabetes, hypertension, hyperlipidemia, hyperuricemia, fatty liver, and sleep apnea–hypopnea syndrome.3,4
Currently, numerous treatment methods for obesity exist, including dietary control, exercise, drug therapy, and weight loss surgery. However, literature data show that many patients encounter challenges in achieving sustained and stable weight loss. Within 2–3 years after initial weight loss, individuals may typically regain ∼ 30–50% of their initial weight.5–7 This weight regain often leads to the resurgence of various obesity-related metabolic diseases that had previously been alleviated. This phenomenon, characterized by a history of obesity, weight loss, and a propensity for easy weight regain, is referred to as “obesogenic memory”. 8 The presence of obesogenic memory implies the existence of genetic differences between individuals with a history of obesity and those who have never been obese.
Nowadays, weight regain remains a significant clinical challenge, partially due to a limited understanding of the pathogenesis underlying obesogenic memory. Through a comparative analysis of expression profiles between individuals with a history of obesity and those who have never been obese, we could identify the related differentially expressed genes (DEGs) and differentially expressed miRNAs (DEMs). These DEGs and DEMs represent potential underlying mechanisms associated with obesogenic memory. The transcription factors (TFs) of DEMs could be predicted and then intersected with DEGs.
To our knowledge, no potential TF-miRNA-mRNA regulatory networks have been reported before for obesogenic memory. Therefore, this study aimed to construct such regulatory networks in the context of obesogenic memory.
Material and Methods
Acquisition of datasets
Utilizing the Gene Expression Omnibus (GEO) database (https://www.ncbi.nlm.nih.gov/geo/), a public repository for array and sequence data, 9 we conducted a search using the following criteria: “obesity” (study keywords), “Mus musculus” (organism), “noncoding RNA profiles by array” (study type), and “Expression profiling by array” (study type). This screening process aimed to identify mRNA and miRNA datasets relevant to obesogenic memory.
Finally, two gene expression profiling datasets by the array (GSE85846 and GSE76944) and one noncoding RNA profiling dataset by array (GSE61005) were obtained from the GEO database. The GSE85846 dataset comprises six samples of adipose tissue stromal cells from lean mice and five samples from formerly obese mice, respectively. 10 The GSE76944 dataset includes three samples of inguinal fat tissues from lean mice and three samples from formerly obese mice, respectively. 11 In addition, the GSE61005 dataset consists of three samples each from lean and formerly obese mice, respectively. 12
Acquisition of DEGs and DEMs
We used the GEO2R tool (https://www.ncbi.nlm.nih.gov/geo/geo2r) to screen for DEGs in the GSE85846 and GSE76944 datasets, as well as DEMs in the GSE61005 datasets. The criteria for significance were set at a p value < 0.05 and |log fold change| > 1. The DEGs that were consistently expressed in both the GSE85846 and GSE76944 datasets were selected for further analysis. The flow chart of this study design is shown in Figure 1.
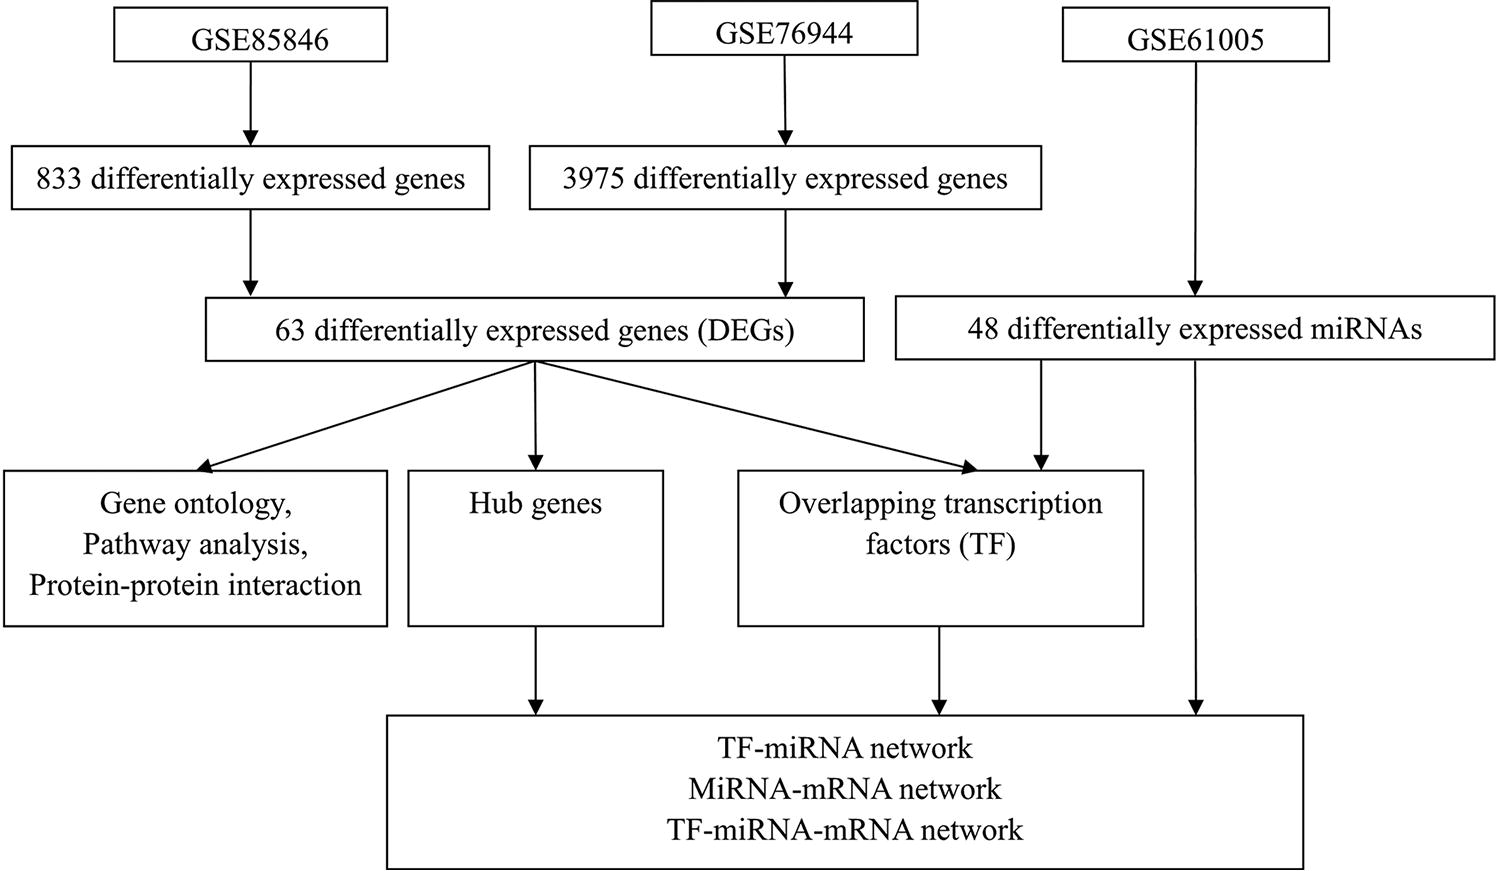
Flow chart for constructing potential transcription factor-miRNA-mRNA regulatory network in obesogenic memory based on one miRNA dataset (GSE61005) and two mRNA datasets (GSE8586 and GSE76944).
GO and pathway enrichment analysis among DEGs
We used the Web-based gene analysis toolkit (WebGestalt version 2019, available at http://www.webgestalt.org/) to perform functional enrichment analysis of DEGs, including gene ontology (GO) and pathway annotations. 13 The GO annotations included biological process (BP), cellular component (CC), and molecular function (MF), whereas the pathway annotation was based on the Wikipathway tool. A significance threshold of p < 0.05 was applied as the cutoff criterion.
Protein–protein interaction (PPI) network and hub genes among DEGs
We used the Search Tool for the Retrieval of Interacting Genes/Proteins (STRING) database (version 11.5, accessible at https://string-db.org/) to examine the known and predicted PPI among DEGs. 14 An interaction score greater than 0.4 was applied to identify the significant PPI network, which was then downloaded and imported into Cytoscape software (version 3.9.1) for further analysis. Subsequently, we identified significant modules using molecular complex detection (MCODE) with the following parameters: degree cutoff = 2, node score cutoff = 0.2, k-score = 2, and maximum depth = 100. 15 The genes in the MCODE with the highest scores were considered hub genes.
Downstream targeted gene prediction for DEMs
The targeted genes of DEMs were predicted using TargetScan (version 8.0, accessible at https://www.targetscan.org/mmu_80/). Overlapping genes between the targeted genes of DEMs and hug genes of DEGs were recorded for the subsequent construction of the miRNA-mRNA network.
Upstream transcription factors prediction for DEMs
The TransmiR database (version 8.0, available at https://www.cuilab.cn/transmir) was used to predict TFs of DEMs. 16 The predicted TFs were then intersected with DEGs to identify the overlapping TFs for the subsequent construction of the TF-miRNA network.
Construction of TF-miRNA-mRNA network in obesogenic memory
Using the aforementioned potential TF-miRNA network and miRNA-mRNA network, we used Cytoscape software to construct the TF-miRNA-mRNA regulatory network. Nodes not participating in the TF-miRNA-mRNA pathways were subsequently eliminated.
Results
Identification of DEGs and DEMs in obesogenic memory
A total of 833 and 3975 DEGs were identified from the GSE85846 and GSE76944 datasets, respectively. Furthermore, 100 common genes were shared between both datasets. However, among these 100 genes, 34 exhibited opposite expression levels between GSE85846 and GSE76944. In addition, three noncoding RNAs were observed. The remaining 63 genes consistently showed altered expression in both datasets and were considered DEMs, comprising 55 upregulated and 8 downregulated genes (refer to Table 1). In the GSE61005 dataset, 48 DEMs were identified, including 32 upregulated and 16 downregulated miRNAs.
DEGs and DEMs between Formerly Obese and Never Obese Subjects
DEGs, differentially expressed genes; DEMs, differentially expressed miRNAs.
miRNA
GO and pathway enrichment analysis for DEGs
WebGestalt was used to perform GO and pathway enrichment analyses for DEGs. In the GO analysis, DEGs were categorized into three groups: biological process, cellular components, and molecular function. The GO and pathway terms were ranked based on the false discovery rate (FDR) threshold, and significance for enrichment was determined based on the FDR-corrected p value ≤ 0.05 (Fig. 2).

Gene ontology (GO) and pathway enrichment analyses were conducted for the 63 common differentially expressed genes (DEGs) consistently expressed in GSE85846 and GSE76944 datasets. The terms were ranked by false discovery rate (FDR) value and those with FDR value ≤ 0.05 were selected.
In terms of biological processes, we observed significant enrichment of DEGs in neutrophil chemotaxis, neutrophil migration, and granulocyte chemotaxis. Examining cellular components, only two terms showed significant FDR values (p ≤ 0.05): extracellular space and extracellular region parts. Regarding molecular function, we identified enrichment in GO terms related to chemokine activity, chemokine receptor binding, and cytokine activity. In the pathway enrichment analysis, the predominant enriched pathway was associated with cytokines and inflammatory response.
PPI network and significant module analysis for DEGs
The 63 DEGs were subjected to PPI network analysis using the STRING database, revealing a network comprising 63 nodes and 127 edges. The initial PPI network was imported into Cytoscape software (Fig. 3A). Subsequently, isolated and loosely connected gene nodes were removed, and the remaining DEGs were used to construct a complex multicenter interaction map. Through MCODE analysis, 14 genes were identified as hub genes, namely CLEC4E, CXCL2, SPP1, CXCL1, CCL4, SERPINB1C, IL1B, SERPINB6B, IL6, ITGAX, IL10, TIMP1, CCL3, and CXCL10. Notably, all 14 hub genes exhibited upregulation in the formerly obese sample. The interaction network of these 14 hub genes is illustrated in Figure 3B.

Protein–protein interaction (PPI) network and identification of hub genes.
Construction of miRNA-mRNA interactions
TargetScan was used to predict the targeted genes of DEMs. Subsequently, we recorded the targeted genes that coincided with the 14 hub genes of DEGs (refer to Table 2). Finally, a total of 11 overlapping genes (TIMP1, SPP1, SERPINB6B, SERPINB1C, IL6, IL10, CXCL2, CXCL10, CXCL1, CLEC4E, and CCL3) were identified as being regulated by 22 different miRNAs (Fig. 4A).
Target Genes of DEMs Predicted by TargetScan
DEGs, differentially expressed genes; DEMs, differentially expressed miRNAs.

Construction of TF-miRNA interactions
Based on the aforementioned 22 miRNAs, the TransmiR database was used to predict the upstream TFs, revealing 261 TFs associated with the 22 miRNAs and establishing 1056 pairs of TF-miRNA interactions. Ultimately, an intersection analysis between the 261 predicted TFs and 63 DEGs yielded 2 TFs and 10 TF-miRNA interactions.
Construction of TF-miRNA-mRNA network in obesogenic memory
Based on the network relationships among TFs, miRNAs, and mRNAs, the potential TF-miRNA-mRNA regulatory network was constructed using Cytoscape software (Fig. 4B). The interactive network unveiled 2 TFs (Egr2 and Aff3), 8 miRNAs (let-7i, let-7g, miR-16, miR-15a, miR-5121, let-7f, miR-3102, and miR-1943), and 9 mRNAs (CLEC4E, IL10, SERPINB6B, TIMP1, CXCL1, SPP1, IL6, CXCL2, and CXCL10). Within the TF-miRNA-mRNA regulatory network, Egr2 was identified as a modulator for most of the miRNAs, whereas CLEC4E, CXCL1, and SERPINB6B appeared to be potentially regulated by multiple miRNAs.
Discussion
Due to the persistence of obesogenic memory, achieving complete control over obesity poses a formidable challenge. Consequently, there is an urgent need to comprehend the underlying mechanisms of obesogenic memory. The TF-miRNA-mRNA network is recognized for its involvement in the pathogenesis of various diseases. However, no TF-miRNA-mRNA network has been previously reported in the context of obesogenic memory. This bioinformatical analysis aimed to explore the potential TF-miRNA-mRNA regulatory network in obesogenic memory. Through bioinformatics analysis, the functions of TFs, DEGs, DEMs, and TF-miRNA-mRNA pairs in the pathogenesis of obesogenic memory were elucidated, providing valuable insights for future experimental research directions. The identified hub genes may serve as valuable biomarkers for the diagnosis, prognosis, and potential drug targets of obesogenic memory.
The pathway analysis of DEGs primarily showed enrichment in cytokines and inflammatory response. Previous studies have suggested a connection between weight regain and immune response. One study demonstrated that weight cycling could elevate levels of IL-6 and TNF-alpha, leading to impaired glucose metabolism and insulin sensitivity. 17 Another study in obese children found that serum inflammatory markers and insulin levels before weight reduction could predict the likelihood of weight regain. 18 In addition, a study revealed a positive correlation between weight regain and the dietary inflammatory index, assessing the impact of specific nutrients on changes in blood inflammatory parameters. 19 This evidence suggests a significant role of immune cells in the formation of obesogenic memory, particularly immune inflammation in adipose tissue and the central nervous system. 20 Besides immune inflammation, other hypotheses have been proposed, including the role of microbiota. It has been reported that in mice with a prior history of obesity, the signature of their intestinal microbiome persists and accelerates weight regain. 21
The present study extracted data from two datasets, GSE85846 and GSE76944, to identify DEGs between mice with a history of obesity and those that have never been obese. Ultimately, a total of 14 genes were identified as hub genes, all of which exhibited upregulation in the previously obese group. Existing literature supports the notion that genes from the IL-1 family contribute to the development of obesity. Specifically, the single nucleotide polymorphism (SNP–SNP) interaction (IL1B × IL1RN) has been associated with both body mass index and percentage of body fat. 22 Furthermore, IL-1 and IL-6 may contribute to the development of obesity indirectly by regulating the release of adiponectin and leptin from adipocytes. 23 In addition, obesity and insulin resistance may be facilitated by IL-10 derived from immune cells, which could suppress adipocyte energy expenditure and thermogenesis. However, the source of IL-10 necessary for inhibiting adipocyte thermogenesis remains unidentified. 24 Concerning the CXCL family, an elevated level of CXCL1 was linked to a higher degree of obesity in mice, although the effect could not be entirely distinguished from age. 25 CXCL2 plays a role in the development of cardiovascular disease by inducing inflammatory responses within the cardiovascular system. 26 Furthermore, CXCL10 can serve as a novel biomarker in the small intestine for obesity. 27
MiRNAs can regulate the progression of various diseases, yet the potential miRNAs associated with obesogenic memory are rarely reported. In this study, we identified 32 upregulated DEMs and 16 downregulated DEMs. Among upregulated DEMs, it was discovered that miR-1983 could serve as a distinct biomarker for cellular insulin resistance and may represent a promising therapeutic target for mitigating human metabolic disorders. 28 The elimination of miR-149-3p from subcutaneous adipose tissue can lead to metabolic benefits in diet-induced obese mice. 29 MiR-125a-3p could enhance adipogenesis by suppressing the pathway of RhoA/ROCK1/ERK1/2. 30 As for downregulated DEMs, the downregulation of let-7g may promote intramuscular adipogenesis during fetal muscle development in the context of maternal obesity. 31 Others observed a decrease in miR-16 levels in instances of insulin resistance and confirmed the role of miR-16 in regulating protein accumulation in skeletal muscle. 32 In addition, miR-15a has been identified as a protective factor against obesity in mice using an in vivo reductionist approach. 33 It is important to note that many of these miRNAs were initially reported in cancer pathophysiology, necessitating further investigation to determine their involvement in obesogenic memory.
TFs are proteins that bind to specific DNA regions, controlling gene transcription rates. Recent studies reveal that TFs can also interact with miRNA. By constructing the TF-miRNA-mRNA network, we found two significant TFs (Egr2 and Aff3). Egr2, known to bind to the miR-455 promoter, promotes β-cell proliferation in obesity mouse models 34 and influences adipogenesis. 35 Our study suggests Egr2 may also interact with let-7i, let-7g, miR-16, miR-15a, miR-5121, let-7f, miR-3102, and miR-1943 in obesogenic memory, though these interactions remain unverified. Concerning Aff3, miR-5121 and miR-3102 are potential downstream targets, but their roles in obesity are unclear. Hub genes are influenced by mmu-let-7c, mmu-miR-3102, and let-7f. Mmu-let-7c and mmu-miR-3102, rarely reported previously, have few experimentally verified targeted genes. The regulation axis of let-7f/Timp1 has been reported in osteogenic differentiation; we predicted such an axis in obesogenic memory in this study. Though let-7f’s decreased expression and elevated IL-6 levels are noted in high-fat diet-induced obesity, 36 the impact of the let-7f/IL-6 axis on obesity epigenetics is unexplored. A similar situation exists for the let-7c/CXCL10 axis. 37
Our current study has several limitations. First, the sample size for the included datasets in our study was relatively small. Second, our TF-miRNA-mRNA networks were predicted solely using mouse data from public databases, and the absence of data from humans and experimental validation are limitations for this study. Nonetheless, this study identified 2 hub TFs, 8 hub miRNAs, 9 hub mRNAs, and several potential TF-miRNA-mRNA networks for obesogenic memory. These TF-miRNA-mRNA networks can provide direction for subsequent molecular biological experiments, as well as potential candidate targets for clinical treatment and drug development regarding weight regain.
Conclusion
In summary, our study identified 2 hub TFs, 8 hub miRNAs, and 9 hub mRNAs and constructed some potential TF-miRNA-mRNA regulatory networks for obesogenic memory. These networks contribute to a deeper understanding of the underlying mechanisms of obesogenic memory and offer potential therapeutic targets for patients experiencing weight regain.
Footnotes
Acknowledgments
We would like to thank the Gene Expression Omnibus (GEO) database.
Authors’ Contributions
B.G., T.Z., Y.C., and J.Y. designed, wrote, and polished the main article. B.G. and T.Z. performed the differential analysis. B.G. and Y.C. performed the functional enrichment analysis. B.G. accomplished the construction of the network. All authors contributed to the article and approved the final version of the article.
Ethics Approval and Consent to Participate
Not applicable. All of the data used in this study were obtained from public databases; thus, this study does not contain any intervention experiments associated with animals or humans.
Availability of Supporting Data
The raw data of this study (GSE61005, GSE85846 and GSE76944) were downloaded from the GEO database.
Author Disclosure Statement
The authors declare no conflict of interest.
Funding Information
The work was supported by the Guangdong Medical Research Foundation (A2024313), the scientific research project of the Chinese medicine bureau in Guangdong province (20241064), the Fundamental Research Funds for the Central Universities (21622304), and the Funding by Science and Technology Projects in Guangzhou (2023A04J1918, 202201020064).