
Abstract
Abstract
Background:
Time to onset of stage II lactogenesis varies widely, and delayed onset of lactogenesis (OL) is common among first-time mothers in the United States. Higher body mass index, older age, and larger infant birth weight are identified risk factors for delayed OL; all are known correlates with glucose metabolism. Our objective was to prenatally assess maternal biomarkers related to metabolic health and determine the extent to which these biomarkers predict timing of OL.
Methods:
We enrolled a population-based sample of expectant primiparas attending a single prenatal clinic. We obtained a blood sample 1-hour post-glucose load from an antenatal oral glucose challenge test and assayed for the following biomarkers: serum insulin, glucose, adiponectin, leptin, C-reactive protein, interleukin-6, resistin, and tumor necrosis factor-α. Our outcome measure was timing of OL, based on maternal report at 3–5 days postpartum. We used linear regression to model OL hour.
Results:
Twenty-six of 29 (90%) agreed to screening, 18 delivered at term and initiated breastfeeding, and 16 have complete data. Median (minimum–maximum) postpartum body mass index was 27.4 (21.8–34.7) kg/m2, and median time to OL was 64 (10–121) hours. The model, OL = 232 – 34.9(ln[ratio insulin/glucose]) – 1.4(adiponectin), explained 56% of the variation in OL hour (p = 0.005) and was not weakened by potential confounders.
Conclusions:
Higher serum insulin secretion relative to serum glucose after a glucose challenge and higher serum adiponectin are associated with earlier onset of OL. These findings suggest that factors associated with better glucose tolerance predict earlier OL.
Introduction
To date, previous examinations of the role of metabolic health in lactation success have been limited to small studies focusing on women with type I diabetes.9,10 The objective of this study is to conduct an initial examination of relations between several metabolic health biomarkers and time to OL in a population-based sample of first-time mothers who initiate breastfeeding. We selected insulin, glucose, adiponectin, leptin, C-reactive protein (CRP), interleukin-6 (IL-6), resistin, and tumor necrosis factor-α (TNF-α) as biomarkers of glucose tolerance and systemic inflammation.
Subjects and Methods
Screening, enrollment, and initial interview
We enrolled a population-based sample of expectant primiparas attending a general care obstetric clinic in a middle-class neighborhood in west Cincinnati, OH. We restricted the sample to first-time mothers because they have a much higher risk of delayed OL compared with multiparas. 2 Thus, during the study enrollment phase, we systematically invited all expectant primiparas to participate in an eligibility interview as they presented to the clinic for the routinely administered 26-week gestation glucose challenge test. The purpose was described as “a study of the infant feeding experience of new mothers.”
Inclusion criteria were (1) expecting first live-born infant, (2) singleton pregnancy, and (3) English language fluency. Exclusion criteria were (1) less than 18 years of age, (2) no telephone access, (3) history of breast reduction or enlargement surgery, and (4) planning to formula feed from birth (no intention to breastfeed or try breastfeeding). Among the women who met the above eligibility criteria and provided written informed consent, we conducted an initial data collection interview at the same prenatal appointment. We collected sociodemographic information and assessed infant feeding attitudes and concerns, including completion of the Infant Feeding Intentions Scale. 11
Glucose challenge test, blood sample collection, and biomarker analysis
For the glucose challenge test, the clinic's protocol is as follows: The patient consumes a 50-g glucose beverage (with no provision to fast beforehand, but she is asked to avoid high sugar foods and beverages) and waits 1 hour without consuming foods or beverages, and a venous blood sample is drawn into an evacuated blood collection tube containing sodium fluoride. The serum is sent to a local clinical laboratory for analysis of glucose concentration. If the serum glucose is ≥135 mg/dL (≥7.5 mmol/dL), the patient is asked to return for the more rigorous glucose tolerance test.
Among study participants, we obtained an aliquot of serum from the glucose challenge test, which was frozen at −80°C until we completed study enrollment. We determined biomarker concentrations by enzyme-linked immunosorbent assay using Milliplex™ Multiplexing suspension array systems (Millipore, Billerica, MA): We assayed insulin, leptin, IL-6, and TNF-α as a set, undiluted (kit number KADK2-61K-B04); adiponectin and resistin as a set diluted 1:400 with phosphate-buffered saline (kit number HADK1-61K-A02); and CRP diluted 1:2,000 with phosphate-buffered saline (kit number HCVD2-67BK). We conducted all assays in duplicate and as a single batch, according to the manufacturer's protocol. We repeated the assay if the coefficient of variation between duplicates was >15% for more than 15% of the batch.
Postnatal follow-up and lactogenesis outcome assessment
We visited each study participant at the maternity unit within 12–36 hours postpartum. At this visit we confirmed post-birth inclusion criteria, which were (1) delivered at term (≥37 weeks of gestation), (2) admission to the mother–baby unit (i.e., not admitted to intensive or special care unit), and (3) the mother initiated breastfeeding as planned. For the participants who met post-birth eligibility, we then provided a handout and verbal explanation of the symptoms of lactogenesis. We telephoned mothers between 72 and 96 hours postpartum to assess progress toward lactogenesis, using a method we have validated and described previously. 2 In brief, we asked participants to describe the approximate time when they noticed that their breasts were “noticeably fuller,” based on a numeric scale where 1 = no change since giving birth, 3 = noticeably fuller, and 5 = uncomfortably full. We followed up with additional phone calls until the participant was sure that she had experienced stage II lactogenesis.
Covariates
We extracted additional data from the prenatal and maternity medical records, including maternal age, weight, height, glucose tolerance status, and mode of delivery, infant birth weight and gestational age, and total number of breastfeeds, number of formula feeds, and formula volume each day of the maternity stay. All participants stayed in the maternity unit ≥ 48 hours. We estimated postnatal BMI (kg/m2) as (maternal weight upon maternity hospital admission – [2 × infant birth weight])/(maternal height)2.
Statistical analysis
Our outcome measure was postpartum hour OL occurred (OL hour). Our primary predictors were the metabolic biomarkers—serum concentrations (1-hour post-glucose load) for insulin, glucose, insulin to glucose ratio (I:G) (as a measure of 1-hour insulin relative to 1-hour glucose concentration), adiponectin, leptin, CRP, IL-6, resistin, and TNF-α. Our aim was to identify metabolic predictors of OL hour. All statistical analyses were performed with SAS software (SAS version 9.2, SAS Institute Inc., Cary, NC). First, we examined distributions and summary measures for each variable, including means, SD, median, and range. Based on histogram distributions and visual inspection of the relationship between each predictor with OL hour, we applied natural log (ln) transformation to insulin, I:G, and CRP. We used Spearman rank correlation analysis to examine the relations between OL hour and predictors and covariates, as this ranked analysis is robust to outliers. The resulting correlation coefficient (r value) ranges between 0 (no correlation between the two variables) to 1 (perfect correlation). We used stepwise linear regression (p value for entry = 0.15, p value to stay = 0.15) in building a model that we then evaluated for violation of linear regression assumptions and thoroughly checked for influential data points. Because of the small sample size of this study, we limited the number of metabolic biomarkers in the model to two. Finally, we examined the degree to which the biomarkers in the final model were attenuated by the inclusion of other variables that may influence OL hour. The potentially confounding variables examined (individually) were Infant Feeding Intentions Scale score, delivery mode, and early postpartum breastfeeding and formula feeding practices. The resulting model R2 value (coefficient of determination) represents the proportion of variation in OL hour explained by the variables in the model.
Sample size and power
Our goal was to screen the first 30 expectant primiparas to present to the clinic, based on the assumption that this would result in approximately 20 primiparas meeting the post-birth selection criteria. This sample size allows detection of a moderate correlation between biomarker and OL hour (r ≥ 0.50) at a two-tailed significance level of p = 0.05.
Ethics
The research protocol as described here was reviewed and approved by the Human Subjects Research Committee of the Institutional Review Board, Cincinnati Children's Hospital.
Results
Final sample and their characteristics
We approached all 29 expectant primiparas, with singleton pregnancies, who presented to the clinic for their 26-week visit from November 1, 2009 to April 30, 2010. Three declined screening (10%), two did not plan to breastfeed at the time of the prenatal screening, three did not meet post-birth inclusion criteria (two with congenital defects requiring neonatal intensive care unit care and one born preterm), and three made the decision to not breastfeed between enrollment and giving birth, resulting in OL follow-up for 18 women. However, the phlebotomist forgot to set aside serum for two of the participants; thus this report is based on n = 16 with complete data.
Demographic, birth, breastfeeding, and metabolic characteristics are presented in Table 1 (n = 16). This was a predominantly white, middle-class cohort; 15 (94%) participants had private health insurance. At the time of the first prenatal visit (median [range], 7.7 [6.7–11.6] weeks of gestation), 56% of the cohort was overweight (BMI 25.0–29.9 kg/m2, n = 6) or obese (BMI ≥ 30.0 kg/m2, n = 3), and 63% (n = 10) were overweight or obese based on the estimated early postpartum BMI. The median timing of the glucose challenge test was 27.0 weeks of gestation (range, 24.1–28.3 weeks). Four women (25%) failed the 26-week gestation glucose challenge test; of these, three did not have any abnormal values on the 3-hour glucose tolerance test, and one (6%) was diagnosed as gestational diabetic.
Postnatal maternal weight estimated as (maternal weight at hospital admission – [2 × infant birth weight]).
Score ranges from 0 (not intention to breastfeed) to 16 (strongly agree to exclusively breastfeed to 6 months).
Onset of lactogenesis after 72 hours postpartum.
Serum sample, 1 hour after a 50-g oral glucose load at the glucose challenge screening test.
One participant diagnosed as gestational diabetic, none with impaired glucose tolerance.
BMI, body mass index; IL-6, interleukin-6; TNF-α, tumor necrosis factor-α.
At the time of the prenatal interview, 100% (n = 16) intended to breastfeed without the use of other milks for at least 1 month. In the postpartum, all 16 initiated breastfeeding; 63% (n = 10) exclusively breastfed throughout the first 24 hours, and 31% (n = 5) exclusively breastfed throughout the first 72 hours. Only 13% (n = 2) experienced OL within 48 hours; 38% (n = 6) experienced delayed OL (OL > 72 hours postpartum).
Associations between biomarkers, with covariates and with OL hour
Spearman rank correlations between OL hour and biomarkers and covariates are shown in Table 2. As expected, serum leptin was strongly correlated with maternal BMI measures, and, to a lesser degree, CRP, IL-6, and post-meal glucose concentrations were positively associated with maternal BMI measures as well. Lower serum adiponectin concentrations were significantly correlated with higher infant birth weight (r = –0.57, p = 0.02) and tended to be correlated with higher maternal BMI and gestational age.
p < 0.05, bp < 0.15.
Adip, adiponectin; BMI, body mas index; CRP, C-reactive protein; I:G, insulin:glucose ratio; IL-6, interleukin 6; OL, onset of lactogenesis, postpartum hour; TNF-α, tumor necrosis factor-α.
OL hour was not associated with 1-hour serum glucose concentration. However, later OL hour was significantly associated with lower 1-hour serum insulin concentration, especially when expressed as a ratio relative to 1-hour serum glucose (I:G, r = –0.70, p = 0.003). OL hour also tended to be later as CRP concentration increased. Unexpectedly, mothers with stronger prenatal breastfeeding intentions experienced later OL (r = 0.50, p = 0.049). Consistent with this pattern, women who fed less formula in the first 48 hours tended to experience later OL (r = –0.36, p = 0.17). We selected these covariates for further consideration as potential confounders in the relationship between metabolic biomarkers and OL hour. Delivery mode and breastfeeding frequency were not related to timing of OL and thus were not further considered as confounders.
Multiple variable model predicting OL hour
Using stepwise linear regression modeling to estimate OL hour from biomarker concentrations, I:G was the first variable to enter (partial R2 = 0.40, p = 0.009). Adjusting for I:G, adiponectin was the next variable to enter (partial R2 = 0.16, p = 0.04). These two variables explained 56% of variation in OL hour (p = 0.004) (Table 3); no other biomarker or covariate entered this model at p < 0.15. We then examined the I:G + adiponectin model for potential confounding. Neither Infant Feeding Intentions score nor formula use (either as total mL or divided at median) weakened the β-coefficients (<10% change) or altered the predictive value for either biomarker. We next examined the residuals (the difference between observed OL and OL predicted from the model for each individual) and related diagnostics, in order to assess the validity of the I:G + adiponectin model. The assumptions of linear regression were met (linearity, distribution of error terms, etc.). However, one data point was 0.3 units above the outlier cutoff (Studentized residual >2.0), and one data point was 0.03 units above the excess leverage cutoff (Cook's D statistic >0.25. Subsequently, we engaged robust regression analyses using both M estimated 12 and least trimmed squares estimated 13 methods. The resulting robust estimates for both I:G ratio and adiponectin were at least as large as in the regular least squares regression model. When we simply re-ran the regular linear regression model excluding the excess leverage data point, the overall model declined only slightly in predictive value (adjusted R2 declined from 0.50 to 0.46); excluding both the outlier and excess leverage data points, the adjusted R2 increased to 0.62.
Overall model R2 = 0.56, model adjusted R2 = 0.50; p < 0.005.
Overall model R2 = 0.54, model adjusted R2 = 0.47; p < 0.007.
To illustrate the combined effect of I:G ratio and adiponectin, we plotted OL hour by I:G ratio, with each data point marked as either in the lowest (4.5–11.7 μg/mL), middle (14.5–15.9 μg/mL), or highest (19.3–29.3 μg/mL) adiponectin tertile (Fig. 1).
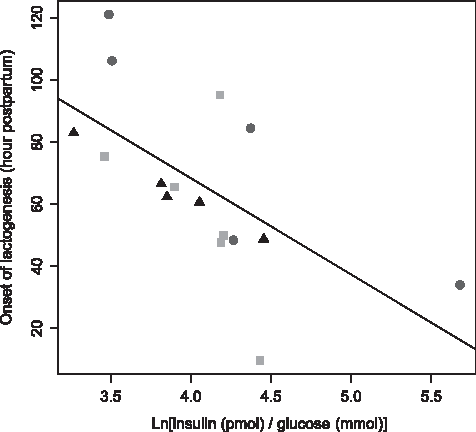
Hour of onset of lactogenesis versus ratio of insulin:glucose (pmol/mmol), 1-hour post-glucose load (natural log transformed). Each data point is designated by adiponectin concentration tertile (circles, lowest third; triangles, middle third; and squares, highest third).
In order to examine alternate “runner up” models predictive of OL hour, we first excluded adiponectin from selection using stepwise linear regression. Consequently, CRP (partial R2 = 0.10, p = 0.04) and TNF-α (partial R2 = 0.10, p = 0.11) were the next variables (after I:G) to enter, with no other variables p < 0.15. Excluding I:G from selection, insulin (partial R2 = 0.29, p = 0.003) was the first variable to enter the model, and adiponectin (partial R2 = 0.25, p = 0.02) was the second (Table 3).
Discussion
Our objective was to examine if metabolic health biomarkers are related to OL in a sample of primiparas reflecting population-level variation in glucose metabolism. Consistent with national data, 14 the large majority (94%) in our sample, who were systematically enrolled from a general obstetrics practice, tested in the normal range for glucose tolerance. Yet, we observed wide variation in metabolic health biomarkers and the timing of OL. The prevalence of delayed OL in the sample (38%) is similar to breastfeeding primiparas in other U.S. settings: 33% in Davis, CA; 2 42% in both Hartford, CT 1 and Cooperstown, NY; 7 and 44% in Sacramento, CA. 3 Thus, despite the small sample size of this preliminary study, the distributions of key measures appear to be reflective of a general primiparous population.
Our main finding is that 56% of the variation in time to OL was explained by 1-hour post-glucose challenge serum insulin concentration (in particular, relative to serum glucose concentration), plus serum adiponectin concentration, at 26 weeks of gestation. Based on our model, a woman at the median for I:G ratio (61.6 pmol of insulin/mmol of glucose) and adiponectin (15.4 μg/mL) will experience OL at approximately 66 hours. If her I:G ratio is in the bottom 25% (in our sample, 26.3–33.4 pmol/mmol), holding adiponectin at the median, her OL will be approximately 21–30 hours later—well beyond the delayed OL cutoff of 72 hours. If her adiponectin concentration is in the bottom 25% (in our sample, 4.5–11.5 μg/mL), holding I:G ratio at the median, her OL will be approximately 5–15 hours later—a less dramatic effect, but still shifting her into the delayed OL range. This is a clinically relevant finding because among exclusively breastfeeding mothers who experience delayed OL, 40% of their infants will lose in excess of 10% of birth weight by day 4 of life.15,16
There is scant published research examining the relationship between maternal metabolic hormones and early lactation outcomes. Rasmussen and Kjolhede 17 examined absolute and change in concentration between 4 and 7 days postpartum for progesterone, prolactin, insulin (spot sample), glucose, and leptin in 23 normal and 17 overweight/obese women of mixed parity; the only significant finding was a diminished prolactin response in the overweight/obese group. Whether this contributed to delayed OL or lactation difficulty was not reported.
There are limitations to our findings. First, the sample size for this initial exploration is small. Nevertheless, a p value <0.005 for the final model is strong evidence that these findings were not due to chance alone, particularly considering that the final model retained its robustness after we thoroughly examined it for alternate explanations such as influential points and confounding.
Second, we can only postulate on the underlying biologic mechanisms that may explain the observed associations among I:G ratio, adiponectin, and OL hour. It is known that glucose entry into the mammary alveoli is via the non–insulin-dependent GLUT1 glutamate transporter. 18 However, within the mammary alveoli, insulin signals the transcription of the protein α-lactalbumin, which in turn is a key enzyme in the synthesis of lactose. Thus, insulin availability to the mammary alveoli may be a limiting factor in the up-regulation of lactose synthesis, with the latter being the key determinant of OL. Coincidently, insulin is currently emerging as a key player in the regulation of milk synthesis rate in other species.19,20 The I:G ratio may represent pancreatic β-cell capacity to respond to mammary gland demand for insulin. However, the I:G ratio is a crude marker of insulin secretion. It is not known how well this ratio corresponds to established proxies for pancreatic β-cell function, which are typically based on insulin and glucose response to the more standardized glucose tolerance test. 21 We believe further examination of how I:G ratio relates to pancreatic β-cell function in general, and insulin action in the mammary gland in particular, is needed.
The additive effect of adiponectin on timing of OL is an intriguing finding. Upon the initial discovery of adiponectin, it was thought to be a marker of insulin resistance, but more recent research has established adiponectin as a metabolically active adipokine, with possible insulin-sensitizing, vasodilator, and anti-inflammatory effects. 22 Martin et al. 23 reported the presence of adiponectin in human milk; thus biologic activity in the mammary gland is plausible. Further research is needed in order to determine if adiponectin influences tight junction closure between mammary alveoli, increased vasodilatation of mammary capillaries, and/or increased insulin signaling within mammary alveoli. We know of no research to date that has examined adiponectin action in the mammary gland.
Last, we must acknowledge that our assessment of metabolic health was done prenatally. We do not know to what extent these same biomarkers are correlated with maternal metabolic health in the early postpartum, when the mammary gland is transitioning from small secretions of colostrum to copious milk production.
Even though the high level of insulin resistance characteristic of pregnancy subsides soon after the delivery of the placenta, both adiponectin concentration and β-cell function during pregnancy show a strong correlation with postpartum glucose metabolism in longitudinal studies.24,25 Alternate metabolic biomarkers, particularly those associated with inflammation (CRP, IL-6, and TNF-α), may be more influenced by events surrounding the peripartum, and thus early postpartum concentrations may not be accurately reflected by measurements at 26 weeks of gestation.
Conclusions
Longer duration of lactation is associated with decreased postpartum weight retention26,27 and protects against metabolic aberrations related to obesity.28–32 Among the offspring, the risk of childhood overweight33–36 and the development of type 137,38 and type 2 39 diabetes decreases with increasing breastfeeding duration. Yet, obese women and their offspring, who are the most likely to benefit from a longer duration of breastfeeding, are the least likely to do so.40–42 The limited interventions reported to date have not been successful in improving breastfeeding outcomes among obese women. 43 In order to develop biologically grounded interventions, it is imperative that we understand the underlying mechanisms that link obesity with delayed OL and short breastfeeding duration. This is the first study of which we are aware to examine the contribution of maternal metabolic health to timing of OL. Although preliminary, our results support the need for greater consideration of glucose metabolism parameters and other aspects of metabolic health in our quest to improve lactation outcomes among women in the United States.
Footnotes
Acknowledgments
L.N.-R. designed the study and oversaw the conduct of the research, L.N.-R. and B.H. analyzed the data, with input and feedback from L.M.D., L.N.-R., L.M.D., and B.H. wrote the article, and L.N.-R. had primary responsibility for final content. The assays were conducted (at a subsidized rate) by the Cytokine and Mediator Measurement Core Laboratory at Cincinnati Children's Hospital Medical Center (Dr. Marsha Wills-Karp, Director). The authors would like to acknowledge Cincinnati Children's Hospital Perinatal Institute for providing financial support to conduct the study. We also acknowledge the following institutions and individuals for their contributions to the study: Seven Hills Women's Health Center and The Christ Hospital maternity staff for their cooperation in participant recruitment and follow up; Jeanne Kleiman for coordinating data collection; our research interns—Philip Vatterott, Sofia Mirkopoulos, and Vicki Roessner—for conducting follow-up interviews; David D'Alessio, Laura Hernandez, and Ardythe Morrow for reviewing presubmission drafts of the manuscript; and Donna Wuest for administrative assistance with manuscript preparation and submission.
Disclosure Statement
No competing financial interests exist.