




Abstract
Abstract
Background:
This study aimed to investigate the consistency of milk ejections and milk expression characteristics within mothers at repeated expression sessions.
Methods:
Twenty-five breastfeeding mothers expressed their breasts simultaneously on three occasions within 3 weeks, and follow-up visits were performed at 6, 9, and 12 months of lactation. During the 15-minute expression, milk was collected onto a continuous weigh balance to measure milk flow rate.
Results:
The number of milk ejections was similar at the three sessions (5.1 ± 2.0), decreasing at the 12-month follow-up (3.3 ± 1.2). Mothers had a similar pattern of milk ejection at each session. The time that each milk ejection occurred was consistent for the first 9 months of lactation. Of the four milk ejection patterns identified, each removed a similar percentage of available milk but varied in the time to reach 80% of the total expression volume. The first two milk ejections produced the greatest percentage (62%) of total milk volume during breast expression.
Conclusions:
For each individual mother, the timing, pattern, and number of milk ejections were consistent, suggesting a predetermined release of oxytocin. In light of the innate oxytocin release and milk removal characteristics in women, there is potential for individual tailoring of the duration of expression.
Introduction
Breastfeeding frequency varies greatly between women, 9 as does the number of MEs during milk removal. MEs are described as short discrete uncoordinated increases in intraductal pressure, with a range of one to 17 increases observed during breastfeeds of up to 25 minutes.10–12 Similar results were found using diagnostic ultrasound to identify MEs during both breastfeeding 13 and breast expression. 14
Recently a continuous weigh balance (Showmilk, Medela AG, Baar, Switzerland) was used to measure increases in the rate of flow of expressed breastmilk that are associated with MEs. 15 As with earlier studies there was large variation between mothers in the number of MEs. It is not known, however, whether the number of MEs recorded for a mother remains constant from one milk removal session to the next.
This study investigated the consistency of both the number of MEs and the pattern of MEs within successfully lactating women during three breast expression sessions within a 3-week period and at 6, 9, and 12 months of lactation. In addition, we investigated what implications the number and pattern of MEs have on the dynamics of milk removal during breast expression.
Subjects and Methods
Subjects
Of the 34 mothers recruited, 25 completed the three sessions within 3 weeks. Mothers were recruited through the Western Australian branch of the Australian Breastfeeding Association and through Child and Adolescent Community Health Nurses in the Oceanic Health Region. Mothers provided written, informed consent before participation and could withdraw at any time. The Human Research Ethics Committee of The University of Western Australia (Crawley) approved the study. Experimental sessions were completed at the Breast Feeding Centre, King Edward Memorial Hospital for Women, Subiaco, WA, Australia.
Determination of breastfeeding characteristics
Mothers measured their 24-hour milk production in their homes under uncontrolled conditions during the three weekly sessions by test-weighing their infant before and after each breastfeed, from each breast, for a 24–28-hour period using electronic scales (BabyWeigh Scale, Medela AG). Measurements were normalized to a 24-hour period. 16 Milk samples (<1 mL) were collected before (fore) and after (hind) each breastfeed from each breast at each test-weighing. One mother was exclusively expressing and followed the same protocol but recorded the weight of the milk expressed, minus the bottle weight.
The cream content of the milk samples was analyzed using the creamatocrit method 17 to calculate the change in degree of fullness and the storage capacity as described previously.18,19 At each expression session, fore and hind samples were collected and measured for cream content and combined with the 24-hour milk production data to determine the potential breast storage capacity and the degree of fullness. 18
Protocol
The experimental protocol has been described previously. 15 Mothers were not required to alter their feeding patterns prior to the session. Simultaneous breast expression was performed using two separate electric breast pumps (Symphony, Medela AG). The expressed milk of each breast was collected onto separate Showmilk devices, recording the cumulative weight (in g) of milk, the rate of milk flow (in g/second), and the breast pump vacuum. The stimulation pattern was applied until the first ME (first jets of milk from the nipple) was observed; breast expression then continued for a further 15 minutes using the expression pattern at the mother's maximum comfortable vacuum. 18 After 1–2 mL of fore and hind milk was retained for analysis, the remaining milk was returned to the mother.
MEs
The first detection of milk by the Showmilk was termed the onset of milk flow. MEs were identified as transient peaks in milk flow rate (MFR). 15 Each identified ME (n = 783) was analyzed for the maximum MFR, time to reach maximum MFR, time from maximum MFR to baseline, total duration, volume from baseline to maximum MFR, volume from maximum MFR back to baseline, and total volume.
Statistics
Analyses were performed using R. 20 Univariate, single time point comparisons were made using paired t tests. Univariate, multiple time point analysis was performed using linear mixed effects models testing for differences between sessions (1, 2, and 3). Tukey's Contrasts analyzed permutations of the three sessions and between consecutive MEs. Residual plots of models determined data normality and model appropriateness. The time of the maximum MFR variable had noticeable heterogeneity of variance and was log transformed. As total expression volume significantly increased by session 3, all models were tested with and without volume as a covariate.
Modeling was used to identify which variables were predictors of milk output measurements and to compare timing and volume of each consecutive ME, for each breast, at each expression. Mothers not participating in follow-up sessions were excluded from the three weekly session time points, and modeling was used to identify longitudinal differences. Systematic differences between ME patterns were also modeled; however, neither pattern or follow-up models were formally tested because of the low numbers in each group. Lattice plots were visually inspected for patterns in each mother's longitudinal data.
Values are presented as average ± SD for normally distributed data and as median (interquartile range) otherwise. Values of p < 0.05 were considered statistically significant. The left and right breasts were analyzed separately, but where no significant differences were found data have been presented as a combined value.
Results
Demographic and breastfeeding characteristics
Mothers (n = 25; average age, 33 ± 3 years [range, 28–39 years]) were providing breastmilk as the predominant source of nutrition to their infants (average age at first visit, 2.9 ± 1.8 months [range, 0.9–6.9 months]), who were mainly male (n = 19). Seventeen mothers were primiparous. Fourteen (56%) delivered vaginally, nine (36%) delivered by cesarean section, and for two delivery was unknown. Mothers were demand-feeding healthy infants who were growing appropriately for age. Nineteen of the 25 mothers measured their 24-hour milk production (784 ± 210 g). The 24-h milk production data and expression data from the first session have been presented previously within a larger cohort (n = 34).15,21
Vacuum
Stimulation vacuum significantly increased by session 3 (p = 0.003), whereas the maximum expression vacuum was weaker (p = 0.040) on session 3 compared with session 2 (Table 1). Neither the initial degree of breast fullness nor the amount of milk available in the breast influenced the chosen vacuums.
Data are either the average ± SD or median (interquartile range) of 25 mothers (left and right breasts combined) for the three weekly sessions, as well as data from the 12 mothers participating in the follow-up sessions at 6 (n = 8), 9 (n = 7), and 12 (n = 5) months of lactation.
Indicates a significant difference such that session days containing the same letter are significantly different from each other (p < 0.05). No formal statistical comparisons were made between the follow-up sessions.
NA, not available.
Breast expression characteristics
The degree of breast fullness was greater at session 3 (p = 0.031) compared with session 2 (0.58 ± 0.32, 0.58 ± 0.29, and 0.68 ± 0.27 for sessions 1, 2, and 3, respectively). The amount of available milk was not different among sessions 1 (104 ± 50 g), 2 (106 ± 56 g), and 3 (121 ± 62 g). The total expression volume increased (p = 0.017) by session 3, although the same percentage of available milk was removed for the three sessions (Table 1). Larger expression volumes and a larger percentage of available milk removed were associated with a shorter time until the onset of milk flow (p < 0.001 for both) and a higher number of MEs (p < 0.001 and p = 0.007, respectively).
The percentage of total expression volume removed after 5 and 10 minutes was similar for the three sessions (Table 1). Less available milk and lower total expression volumes were associated with a greater percentage of the total expression volume removed after 5 (p = 0.002 and p < 0.001, respectively) and 10 (p < 0.001 for both) minutes. A greater percentage of the total expression volume removed after 10 minutes was associated with a shorter time until first ME (p = 0.025) and a higher maximum MFR (p = 0.046). A longer time to remove 50% of the total expression volume was observed at session 3 compared with session 2 (p = 0.010).
Longer times to remove 50% and 80% of the total expression volume were associated with higher degrees of breast fullness (p < 0.001 and p = 0.016, respectively), more available milk (p < 0.001), larger expression volumes (p < 0.001), more MEs (p = 0.047 and p = 0.005, respectively), and a longer time until the maximum MFR (p < 0.001 and 0.028, respectively).
Milk flow
The time until the first ME was significantly shorter by the third session (session 1 vs. 3, p = 0.002; session 2 vs. 3, p = 0.004), as was the time until the onset of milk flow (session 1 vs. 2 and session 1 vs. 3, p < 0.001) (Table 1). A shorter time until the onset of milk flow was associated with both stronger stimulation (p = 0.032) and expression (p = 0.028) vacuums, a higher degree of breast fullness (p = 0.017), and a larger total expression volume (p < 0.001).
The maximum MFR was similar at the three sessions, as was the time (after onset of milk flow) of its occurrence (Table 1). Larger maximum MFRs were associated with a higher degree of breast fullness (p = 0.006), more available milk (p < 0.001), and a shorter time until the onset of milk flow (p < 0.001).
Twelve mothers participated in the follow-up sessions at 6 (n = 8), 9 (n = 7), and 12 (n = 5) months (Table 1). Follow-up sessions had a longer time until the first ME and onset of milk flow. The 12-month follow-up had lower total expression volumes, lower maximum MFRs, and a lower number of MEs than the three weekly sessions (Table 1).
MEs
Similar numbers of MEs were recorded at the three weekly sessions (5.1 ± 2.0; range, two to 14) (Table 1). More MEs were associated with higher initial degrees of breast fullness (p < 0.001), more available milk (p < 0.001), shorter times until both first ME (p = 0.035) and onset of milk flow (p = 0.004), larger maximum MFRs (p < 0.001), and larger total expression volumes (p < 0.001).
MEs produced a significantly greater volume and percentage of total expression volume on the third session (p = 0.035). The time that the maximum MFR of each ME occurred was consistent within a mother (Fig. 1). Compared with session 1, the timing of each ME was similar at session 2 (p = 0.411), session 3 (p = 0.248), 6 months (p = 0.418), and 9 months (p = 0.194). However, the timing of MEs at 12 months was delayed (56 seconds; p = 0.032) compared with session 1 (Table 1).
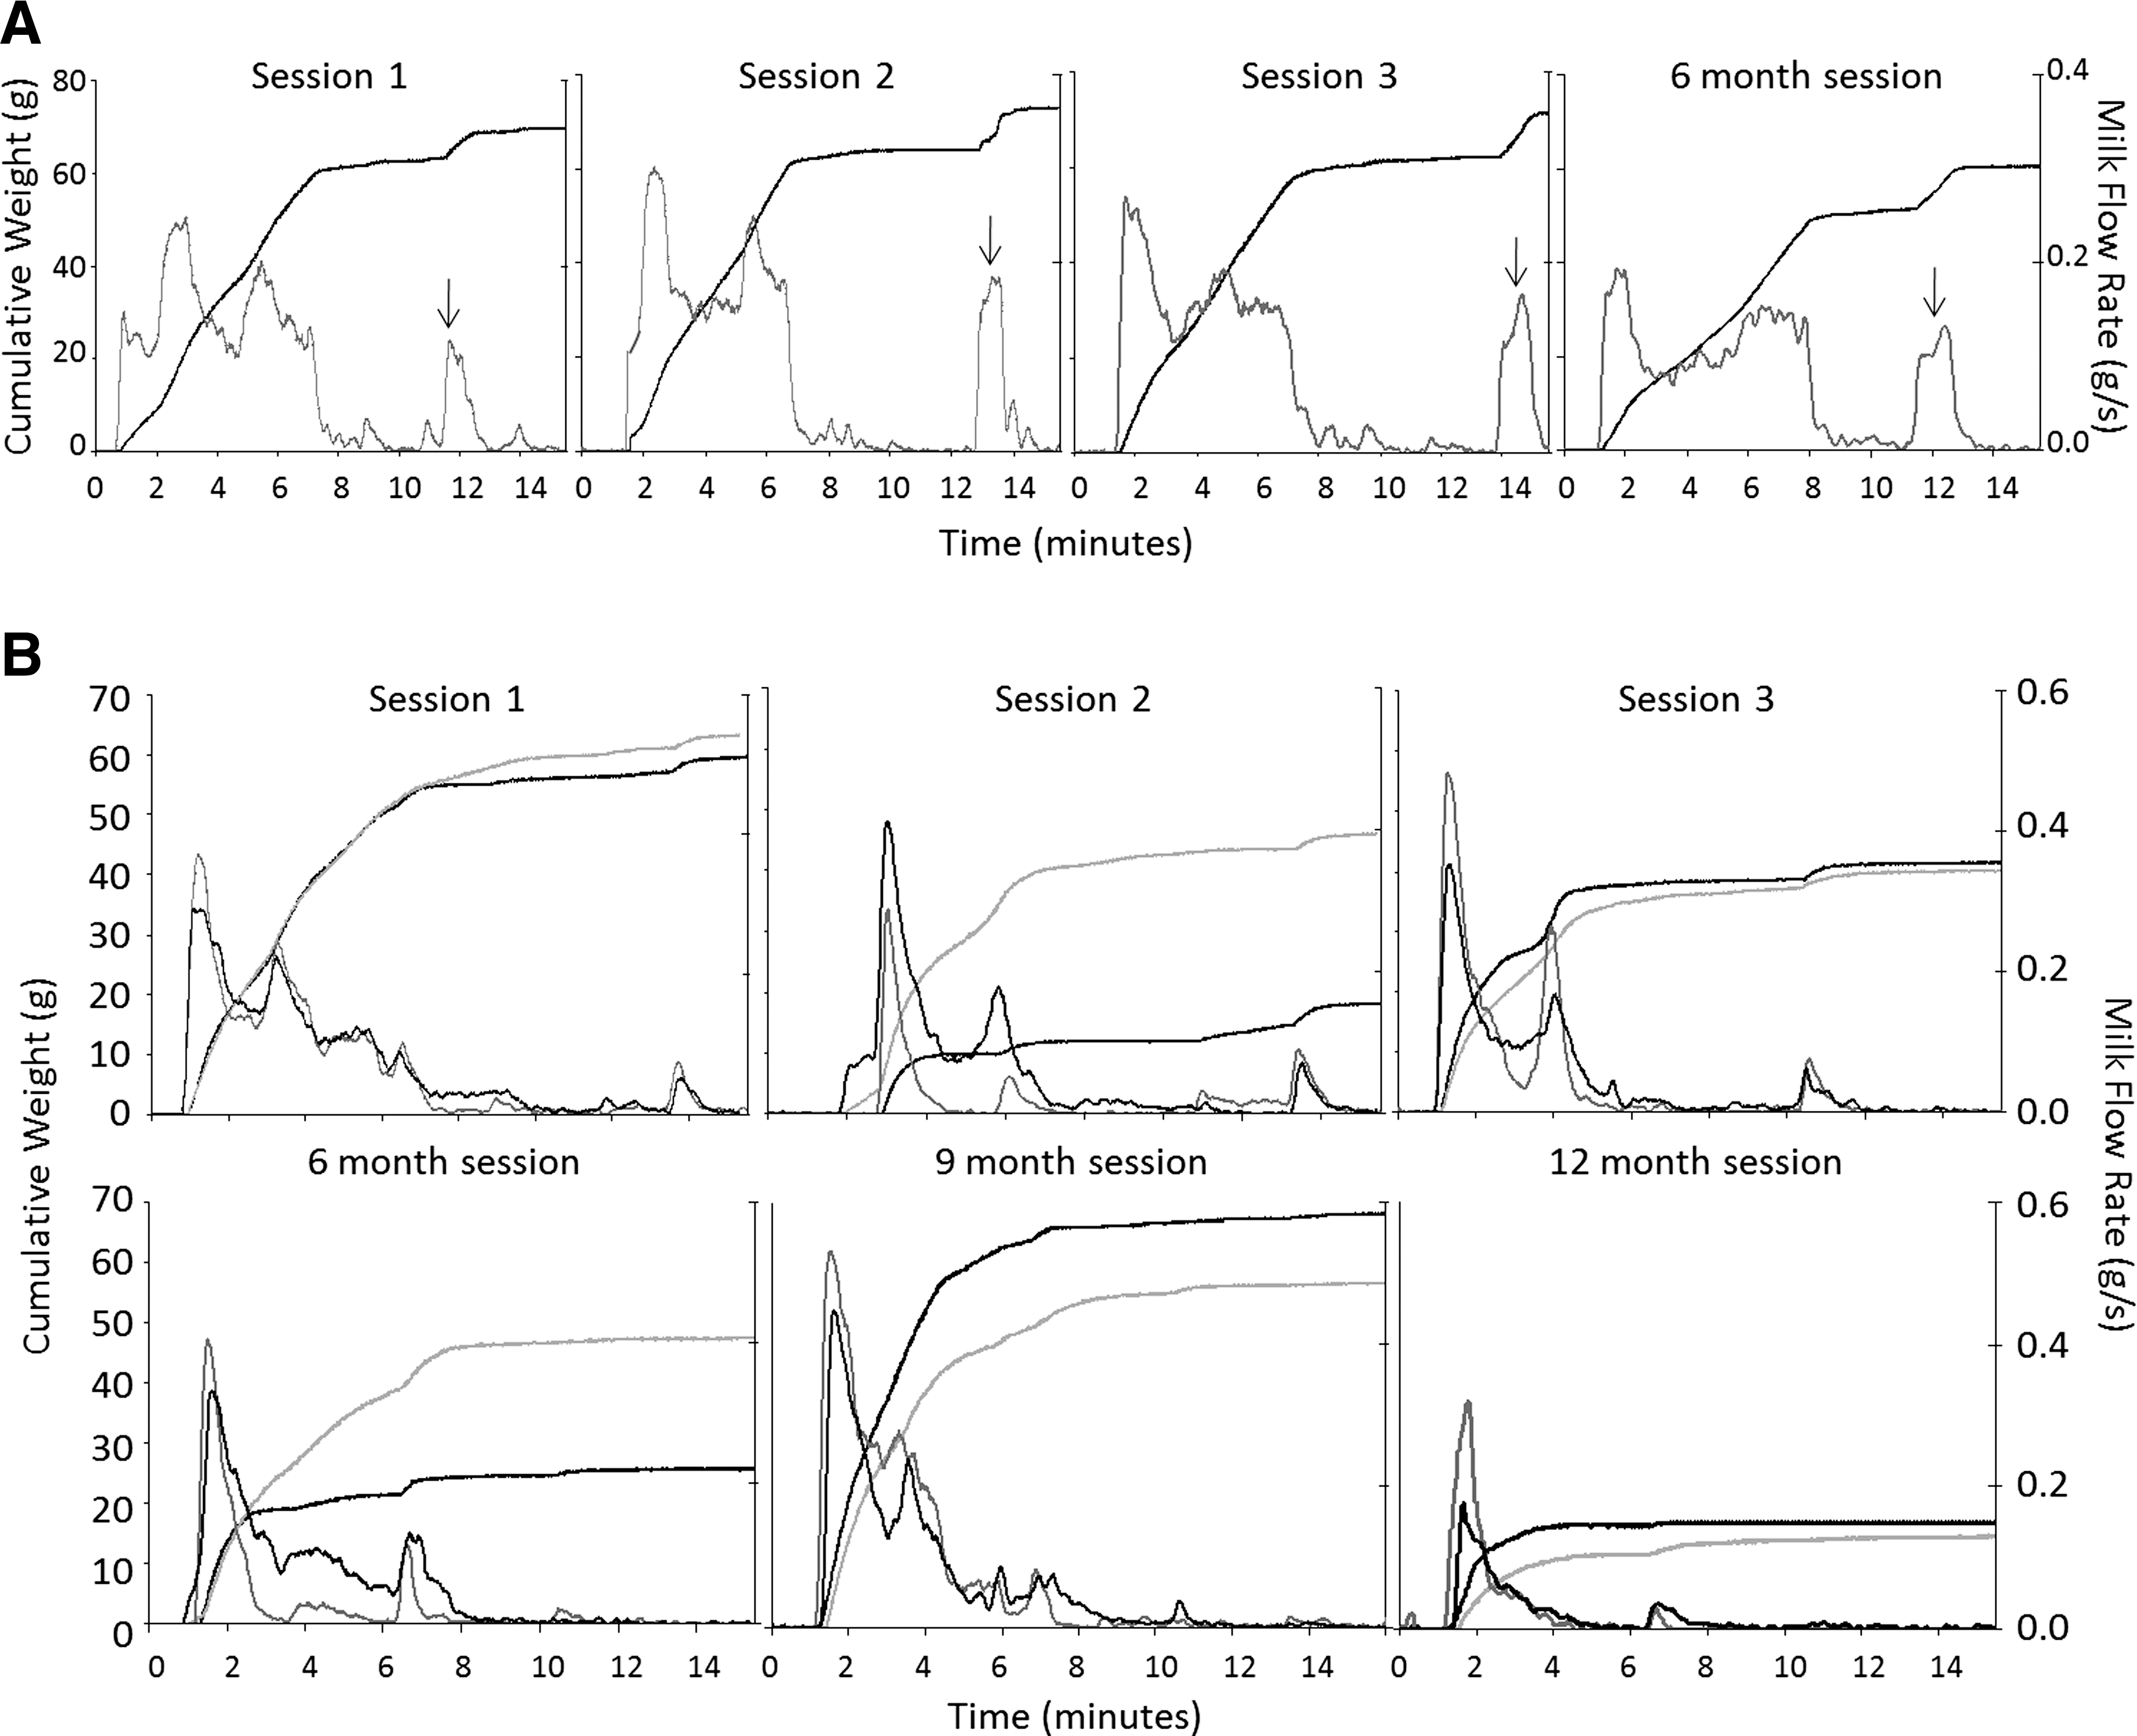
Repeatable pattern of milk ejection observed at multiple expression sessions. (
Four ME patterns were identified, differentiated by both the number and shape of MEs. Six (24%), 11 (44%), six (24%), and two (8%) of the mothers showed patterns 1, 2, 3, and 4, respectively (Table 2 and Fig. 2). MEs with a clearly defined beginning and end were defined as discrete, whereas MEs without clear definition were defined as non-discrete. Pattern 1 was discrete few (less than five MEs), pattern 2 was discrete many (five or more MEs), pattern 3 was non-discrete (five or more MEs), and pattern 4 was pulsatile (multiple, clearly defined MEs occurring with rhythmic repetition) (Fig. 2). All patterns removed a similar percentage of available milk. Pattern 4 mothers tended to have more MEs and took longer to remove 80% of the total expression volume than those with patterns 1–3. Pattern 1 mothers had less available milk, a lower number of MEs, and a lower total expression volume.
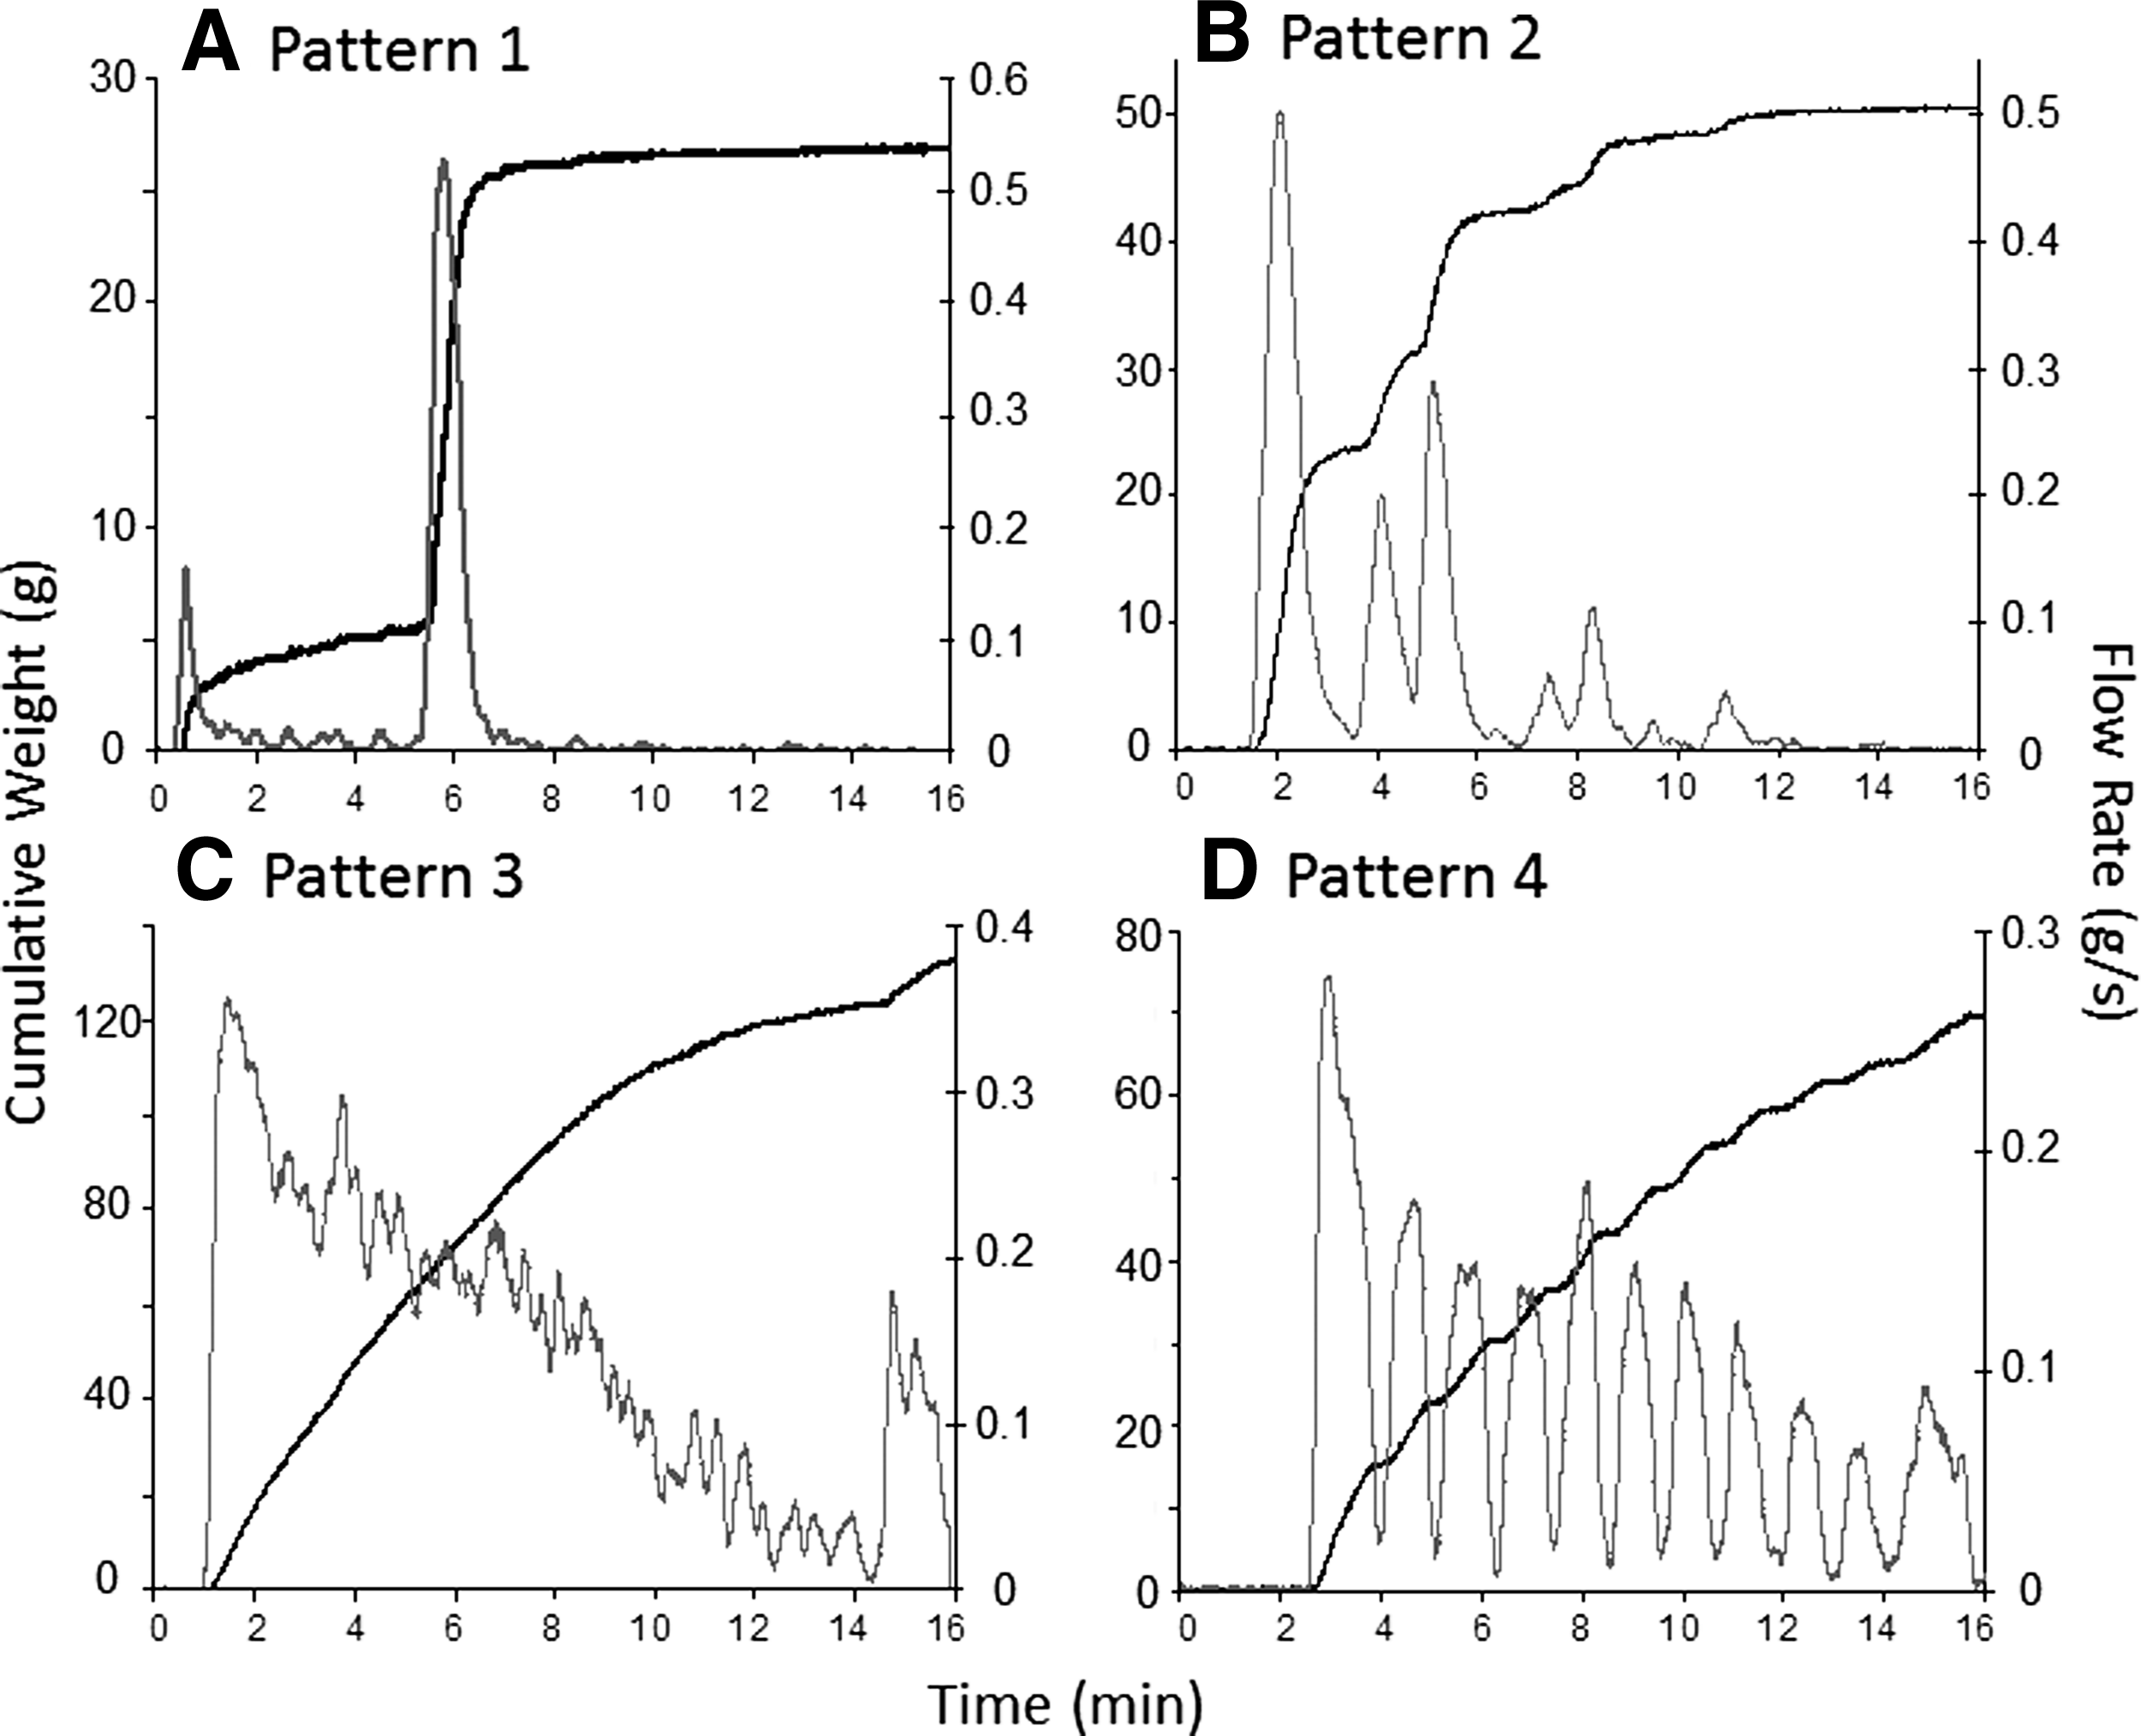
Example data outputs from representative mothers of the four milk ejection pattern groups. The cumulative volume of the milk (in g, black line) and the milk flow rate (in g/second, gray line) can be observed: (
Data are average ± SD of the left and right breasts and for the three session days combined for each of the four milk ejection patterns: Pattern 1, discrete few (n = 6); Pattern 2, discrete many (n = 11); Pattern 3, non-discrete (n = 6); and Pattern 4, pulsatile (n = 2). Statistical significance is not denoted as no formal model testing was performed because of the low number of women in each group.
The median time between MEs (from one maximum MFR to the next) was 123 seconds (range, 80–179 seconds). The median time from the end of one ME to the beginning of the next was 90 seconds (range, 40–203 seconds). The MFR between MEs varied between mothers by 0.01 g/second (range, 0.01–0.03 g/second).
The duration, volume, and maximum MFR of the first eight consecutive MEs are described in Table 3. The first and second MEs had similar total durations and were significantly longer (p < 0.01) than all subsequent MEs. The first ME contributed a greater volume (p < 0.01) and percentage of total expression volume (p < 0.01) than each of the subsequent MEs. The second ME also contributed a greater volume (p < 0.01) and percentage of total expression volume (p < 0.01) than each of the subsequent MEs, with the first two MEs contributing a combined total of 62% of the total expression volume (Table 3). The first ME had a significantly higher maximum MFR compared with the second (p = 0.015), and the first and second MEs had higher maximum MFRs than subsequent MEs (p < 0.01).
Data are the average ± SD or median (interquartile range) of the first eight milk ejections of the left and right breasts from 25 mothers and for the three session days combined. Time is measured after onset of milk flow. Levels of significance are given in Results.
The midpoint of a ME was defined by the maximum MFR. The second half of an ME was longer than the first half (p < 0.001), resulting in an asymmetrical shape. The second half contributed a significantly greater volume and percentage of total expression volume than the first half for MEs 1–4 (p < 0.001) (Table 3).
Discussion
The number of MEs was found to be consistent within a mother at repeated expression sessions (Fig. 1). We conclude, therefore, that the cause of variation in the number of MEs reported previously15,21 is the result of variation between mothers. Similarly, milk release and milk flow varies between individual ewes, with a consistent release pattern within a ewe. 6 In women, longitudinal studies of ME are few; however, one study compared blood oxytocin release in eight breastfeeding women up to 6 months of lactation. 22 The authors observed a similar oxytocin release pattern between multiple breastfeeds at 1, 3, and 6 months in an unspecified number of the eight women.
For each mother, MEs occurred with a similar periodicity at the repeated sessions (Fig. 1). The average interval between MEs was 123 seconds, agreeing with the previous measurement of 122 seconds between the beginning of each milk duct dilation during breastfeeding. 13 This value is supported by rat studies in which intervals of less than 2 minutes are rare, and an induction of shorter intervals results in a decreased action potential of the oxytocinergic neurons, likely resulting in progressive reduction of mammary contraction. 23 It is probable that variation in ME periodicity between women is the result of individual physiology, such as the minimum response time of the myoepithelial cell oxytocin receptors and the minimum interval between neurohypophyseal oxytocin releases. 24
ME patterns remained consistent until 12 months, at which the timing was delayed. The low number of mothers (n = 5) at this session makes this result difficult to interpret. Lower expression volumes at 12 months (Table 1) are likely due to a lower initial milk volume in the breast. Because myoepithelial cells respond faster to oxytocin when the alveoli contain more milk, this would result in a delayed response. 25 This delay is not likely due to variation in oxytocin levels as they remain similar up to 12 months of lactation, 26 further supporting our conclusion that women have a repeatable ME pattern for at least the first 9 months of lactation.
MEs measured by MFR have an asymmetrical shape 15 similar to intraductal pressure measurements. 12 This study quantified that the duration and volume produced in the second half of an ME were significantly greater than in the first half (Table 3). This is explained by myoepithelial cell contraction forcing milk toward the nipple, dilating the milk ducts to their maximum diameter, followed by a slower duct diameter decrease back to the tonic resting state. 13 The duration of 36 ± 24 seconds for the first half of the first ME (Table 3) is similar to the average time from resting to maximum duct diameter of 34 ± 22 seconds, 13 further supporting the physiological validity of measuring MFR.
The similar volume and periodicity of MEs explain why no difference was found in the dynamics of milk removal at repeated sessions (Table 1). Furthermore, the first two MEs contribute a significantly larger volume and proportion of total volume than subsequent MEs (Table 3). The high efficacy and effectiveness of MEs early in the expression session support our previous findings that the first 7 minutes are the most active for milk removal. 21
Breast anatomy, including duct diameter, remains relatively constant within a mother during lactation but varies greatly between women. 27 Duct diameter variation may explain why the amount of milk removed prior to ME can vary from 0 and 30 mL.19,28 Anatomical variation may also account for differences in the duration of milk flow (interquartile range, 40–203 seconds) and MFR (interquartile range, 0.01–0.03 g/second) between MEs. For example, mothers with non-discrete MEs (Fig. 2C) may have larger milk ducts, allowing a release of the milk contained within them between MEs.
Breast anatomy can account for consistency within and variation between women, but it does not explain differences in ME periodicity. Pattern 4 mothers (Fig. 2D and Table 2; n = 2) had multiple rhythmic MEs, similar to pulsatile ME patterns reported during breastfeeding.12,13 A physiological bolus of oxytocin generally produces a single ME, a supraphysiological dose can produce multiple pulses, and an oxytocin infusion can produce a coordinated and repetitive pulsatile pattern. 10 It is possible that lower oxytocinase activity or a sustained release of oxytocin could be responsible. However, long-term exposure to oxytocin progressively desensitizes oxytocin receptors and is not efficient or beneficial for the release of milk. 24 Indeed, these mothers took longer to remove a similar proportion of available milk at each session, indicating that they would be less effective at shorter expression durations (<15 minutes).
In contrast to having many MEs, some mothers (n = 6) had a low number of MEs (3.8) (Pattern 1; Fig. 2A and Table 2) at each session. These mothers consistently began breast expression with less available milk and expressed lower volumes (Table 2). It is possible that these mothers recorded fewer MEs because their breasts became drained, milk ceased to flow, and ME could not be detected by the Showmilk as an increase in MFR. 15
It is important that both clinicians and mothers are aware that there is significant variation between women, and that although each ME pattern was equally effective, removing a similar percentage of available milk, the rate of milk removal varied. Periods of no milk flow could be infrequent (Fig. 2C and D) or substantial (Fig. 2A), and, in addition, after substantial periods of no flow (up to 8 minutes) and 13–14 minutes of expression, some mothers had MEs releasing up to 23% of the total expression volume (Fig. 1A).
It is therefore possible that the ME pattern could be determined, by clinicians or mothers, by observing milk flow from the breast and that expression regimens could be tailored to the individual mother's pattern. As such, mothers with continuous milk flow (Fig. 2C and D) and large, late, MEs would take longer than 8 minutes to express most of the milk in the breast, but mothers with the alternate patterns could express most of their milk in a shorter time. Furthermore, because this study found that the pattern of ME (Fig. 1) and MFR dynamics (Table 1) were repeatable, a mother's ME pattern would only need to be characterized once, and the most effective and efficient expression regimen would be similar at subsequent expression sessions.
This study is important for expressing mothers, but it remains to be confirmed that the predetermined and robust ME pattern observed in this study is similar during breastfeeding and subsequent births. In species such as the sow 4 and the rat 8 the suckling pattern of the young does not affect the pattern of milk release. Furthermore, similar patterns of oxytocin release have been observed at repeated breastfeeds, 22 and oxytocin levels are similar between breastfeeding and breast expression. 29 Infants also have a characteristic rate of milk removal during breastfeeding. 30 Some infants efficiently remove milk in a short period (<4 minutes), consistent with our findings that the first two MEs contribute 62% of the total expression volume (Table 3); other infants fed longer, consistently transferring milk throughout the 15-minute measurement, similar to continuous flow mothers (Fig. 2C and D). Certainly it appears that similar variation in the ME pattern is observed between mothers during breastfeeding, but this is an area that requires further investigation.
Conclusions
This study identified that there are four different patterns of ME between women, which have implications for individual expression regimen recommendations. In addition, the study demonstrated that in breastfeeding women, both ME pattern and MFR dynamics during breast expression are consistent from week to week in the first 7 months of lactation, with similar trends observed up to at least 9 months of lactation. The pattern of oxytocin release appears predetermined, but the determinants of this pattern, as well as its robustness and capacity for change, require further investigation. Further studies are required to investigate the pattern of ME during breastfeeding in mothers with compromised milk supply and mothers of premature infants.
Footnotes
Acknowledgments
The authors thank the mothers and infants who participated in the study, the Australian Breastfeeding Association, and the Child and Adolescent Community Health Nurses in the Oceanic Health Region. The study was funded partly by a research grant from Medela AG (Switzerland) and by the Women and Infants Research Foundation.
Disclosure Statement
No competing financial interests exist.
Portions of this study were presented at the 15th International Society for Research in Human Milk and Lactation International Conference, held in Lima, Peru, in 2010.