
Abstract
Abstract
Aim:
This study investigated the effect of smoking, mother's age, body mass index (BMI), and parity number on density, lipids, proteins, and secreted immunoglobulin A (SIgA) of human milk.
Methods:
Transitional and mature milk samples were collected from 23 nursing smoker mothers and 43 nursing nonsmoker mothers. Proteins, lipids, and SIgA concentrations were determined as well as the milk density and the general protein profile.
Results:
Our investigation showed that the milk of smokers contained less lipids and proteins (statistically significant 26% and 12% decrease, respectively), whereas milk density was unchanged. SIgA concentration was 27% lower in milk from smokers, but the decrease was not statistically significant. The general protein profile showed no significant smoking-associated changes in the four identified proteins (β-casein, immunoglobulin A heavy chain, serum albumin, and lactoferrin). Mothers' age and residential area showed noticeable but statistically nonsignificant differences in some of the measured parameters. However, parity number, lactation stage, and BMI were associated with a significant modification of milk composition. Mature milk contained more lipids and less protein, whereas the increase of parity number was associated with an increase in lipid concentration. The group of overweight mothers showed lower milk protein concentration in comparison with the normal group. Multivariate analysis showed a statistically significant interaction effect of the variables (smoking, parity number, lactation stage, age, and BMI) on lipids and between some of them on proteins and SIgA.
Conclusion:
Our study showed that smoking was associated with lower milk lipid and protein concentrations and that the parity number and BMI were associated with a change in milk lipids and proteins content, respectively.
Introduction
Variation of breastmilk quality might affect the infant's health, growth, and development; yet, this variation is influenced by many parameters such as the gestation period, the stage of lactation (colostrum/mature milk), the circadian physiology, foremilk and hindmilk, the mother's diet, and exposure to xenobiotics. 6 For instance, preterm milk contains higher levels of proteins and fat but lower levels of lactose. 10 Milk then evolves from the colostrum (up to 6 days) to transition and mature milk (about day 15 of lactation), in which the concentration of proteins and lipids increase and that of immune system proteins decreases.1,11 Moreover, milk volume and its fat content show a significant circadian variation with a peak in the morning and in the evening. 12 During a feed, milk fat content increases from the beginning to the end, resulting in more caloric hindmilk. Moreover, the degree of breast fullness affects the milk fat content. 13 Maternal diet and nutrition status may influence milk quantity, and to some extent its quality. 14 Although a very restrictive diet decreases milk volume, its composition remains nearly unchanged. 6
Exposure of nursing mothers to xenobiotics affects milk quantity and quality. Alcohol, caffeine, and marijuana have been found in milk of exposed mothers. 15 Human milk of smokers contains a significant amount of polycyclic aromatic hydrocarbons, 16 nicotine, 17 and cadmium. 18 Therefore, nicotine is received by the baby, and the amount is inversely proportional to the elapsed time between smoking and suckling. 17
Therefore, smoking is of great concern, and its prevalence among pregnant women is between 15% and 20%. 19 The tobacco-derived toxicants alter the hormonal pattern and consequently milk secretion. For instance, nicotine inhibits prolactin release in rats 20 and in lactating women, thereby shortening the duration of breastfeeding; smokers wean their babies significantly earlier than nonsmokers. 21 Smokers also show a decreased production of milk, 22 and their babies grow at a slower rate than do infants of nonsmokers. 22
The effect of smoking and its interaction with other factors (age, body mass index [BMI], parity, etc.) on human milk composition has been poorly investigated. Very few studies have been reported, and most of them used a limited number of samples. Agostoni et al. 23 reported that cigarette smoking during pregnancy was associated with lower milk fat content and polyunsaturated fatty acids in the first 6 months of lactation. Hopkinson et al. 24 demonstrated that milk fat content was approximately 19% lower in smokers, whereas the total protein nitrogen was not affected. Our investigation used 66 human milk samples to investigate the change of milk composition associated with smoking, age, BMI, parity number, lactation stage, and geographic residential area.
Subjects and Methods
Reagents
Glycine, bovine serum albumin, acrylamide/bisacrylamide (37.5:1, 40%), Laemmli sample buffer, Bradford reagent, and molecular size marker (14.2–66 kDa) were purchased from Sigma-Aldrich (St. Louis, MO). The secreted immunoglobulin A (SIgA) measurement kit (Turbox Plus) was purchased from Fumouze Diagnostics (Levallois-Perret, France)/Orion Diagnostica (Espoo, Finland). Coomassie blue (Brilliant Blue R-250 1×) and all other chemicals and solvents were purchased from BDH (Poole, UK).
Collection of milk samples
This study was performed according to the rules of the ethics committee of Makassed Hospital (Beirut, Lebanon). By means of manual pumps, human milk samples were collected in the morning from consented nursing mothers (23 smokers and 43 nonsmokers). Each sample consisted of 5–10 mL of foremilk, representing a part of the breast content, and therefore could not be used to compare milk volumes between the donors. The degree of breast emptying was not controlled, but the last suckling occurred about 2 hours prior to sample collection. Samples were aliquoted and stored at −80°C until analysis. All mothers filled a questionnaire regarding their age, body weight, height, parity number, residential area, lactation stage, and any medications. Distribution of samples depending of the diverse parameters is summarized in Table 1.
Data are average±SD values for smokers and nonsmokers with respect to age, body mass index (BMI), parity number, average and range of breastfeeding period at sampling in days (lactation stage).
Means were not significantly different between the smoker and the nonsmoker groups for all of the variables. The proportion of smokers was not significantly different compared between the subgroups and the total group of samples [χ2(1)<3.841, p>0.05] except for the age group 30 to ≤35 years [aχ2(1)=4.08, p<0.05].
Measurement of milk density and lipid and protein concentrations
Milk density was determined by weighing 1 mL (±0.8%) of each milk sample (Eppendorf pipette) using a precision scale (±0.1 mg) (Boeco Germany, Hamburg, Germany). Density was calculated from the average of two independent measurements for each sample.
Lipid concentration was determined in duplicate for each sample using a modification of the gravimetric method. 25 In brief, 1 mL of milk was subjected to a first liquid–liquid extraction with a mixture of dichloromethane/methanol/sodium chloride (2.4 mL of CH2Cl2, 1.2 mL of CH3OH, and 0.6 mL of 0.7% NaCl). The aqueous phase was re-extracted with 1.2 mL of dichloromethane. The organic phases were pooled, washed with 0.7% NaCl, and evaporated at 25°C overnight, and the residual fat matter was weighed.25,26
Protein concentration was determined in duplicate for each sample by the method of Bradford. 27 Milk samples were diluted 20-fold in 0.15 M NaCl, and then 50 μL was mixed with 1.5 mL of 1× Bradford reagent before optical density was measured at 595 nm. A standard curve (0–1.4 mg/mL) was prepared in the same conditions using bovine serum albumin.
Investigation of the general protein profile of milk by sodium dodecyl sulfate–polyacrylamide gel electrophoresis
Sodium dodecyl sulfate (SDS)–polyacrylamide gel electrophoresis was performed to compare the general protein profile between milk of smokers and nonsmokers. Proteins (10 μg) from each milk sample were denatured in 15 μL of Laemmli sample buffer (0.004% bromophenol blue, 400 mM dithiothreitol, 20% glycerol, 4% SDS, and 0.125 M Tris, pH 6.8), heated at 100°C, and loaded on a 4% acrylamide stacking gel prepared in 125 mM Tris HCl (pH 6.8), 0.1% SDS, 0.5 μL/mL tetramethylethylenediamine (TEMED), and 0.05% ammonium persulfate. Acrylamide concentration of the resolving gel was 10% in 375 mM Tris HCl (pH 8.8), 0.2% SDS, 0.5 μL/mL TEMED, and 0.05% ammonium persulfate.
Electrophoresis was run for 2 hours at 120 V in 25 mM Tris, 192 mM glycine, and 0.1% SDS. The gels were stained with a solution of 0.02% Coomassie Brilliant Blue R-250, 25% ethanol, and 10% acetic acid in distilled water. Gel destaining was performed with the same solution without dye. Gels were scanned, and the relative quantity of proteins in each band was estimated by densitometry using Dolphin-1D software (Wealtec, Taipei, Taiwan). The identification of proteins was based on their molecular weight.
Determination of milk SIgA concentration
Milk SIgA concentration was determined in duplicate for each sample by a quantitative immunonephelometric assay using the Turbox Plus instrument and Turbox Plus immunoglobulin A kit. The protocol was applied as indicated by the supplier's manual.
Statistical analysis and sorting samples into categories
Statistical analysis was performed using SPSS (SPSS, Inc., Chicago, IL) and Microsoft (Redmond, WA) Excel. The outliers were disregarded because including them would inflate the mean squared error values and obscure the true accuracy of the results. Therefore, the sample number in some categories was less than the actual collected number. Analysis of variance was applied to compare the differences in mean age, BMI (weight [in kg]/height 2 [in m2]), parity number, and lactation stage between the smoker and nonsmoker groups. The statistical significance of the effects of smoking and other variables was tested using analysis of variance and Student's t test. To estimate whether the variables interact with one another to affect the measured parameters, a multivariate analysis was performed.
Samples were divided into subgroups according to age, BMI, parity number, lactation stage, residential area, and smoking. Ages were arbitrarily divided into four subgroups: age ≤25 years, 25<age ≤30 years, 30<age ≤35 years, and age >35 years. Samples were classified according to BMI into three groups: normal (BMI≤25 kg/m2), overweight (25<BMI≤30 kg/m2), and obese (BMI>30 kg/m2). Depending on the number of parity, samples were divided into four groups (1, 2, 3, and ≥4). Depending on the donor's residential area, milk samples were divided into two groups: those supplied by mothers living in the Beirut Metropolitan area (polluted) and those provided by mothers living in a mountainous region (less polluted). Because the lactation stage affects milk composition, milk samples were divided into two groups: transitional milk (7–14 days) and mature milk (≥15 days); no colostrum samples were collected (see Table 1).
Moreover, the χ2 test (using α=0.05 and df=1) was performed in order to compare the proportion of smokers within the different subgroups (based on age, BMI, parity, etc.) with the proportion in the total sample group (see Table 1).
Results
Variability of age, parity number, BMI, and lactation stage between the smoker and nonsmoker groups
The smoker group (n=23) and the nonsmoker group (n=43) of mothers were compared for differences in mean age, parity number, BMI, and lactation stage. Statistical analysis revealed no statistically significant differences in the means between the two groups for all of the analyzed variables (Table 1). Therefore, the nonsignificant mean differences between the smoker and nonsmoker groups should not affect our conclusions regarding the effect of smoking.
Using the χ2 test, we then compared the proportion of smokers in the different subgroups (according to age, BMI, parity number, residential area, and lactation stage) with the proportion of smokers in all of the collected samples. No statistically significant difference was found [χ2(1)<3.841, p>0.05] (Table 1) except for the group of mothers 30<age ≤35 years in which the proportion of smokers was significantly higher [χ2(1)=4.08, p<0.05].
Effect of smoking on milk density
The average±error of milk density was 1.0157±0.0017 g/cm3 (n=23) for smokers and 1.0135±0.0018 g/cm3 (n=43) for nonsmokers. No statistically significant difference was found between the two groups (by t test, p=0.19).
Effect of smoking on milk lipid and protein concentrations and their ratio
The average±error of milk lipid concentration was 42.45±2.43 mg/mL (n=31) for nonsmokers and 31.14±4.18 mg/mL (n=18) for smokers. Smoking was associated with a statistically significant 26% decrease in milk lipids (by t test, p=0.015) (Table 2 and Fig. 1). Lipid measurement on the same samples by a spectrophotometric method 28 also demonstrated a statistically significant 21% decrease associated with smoking (data not shown).
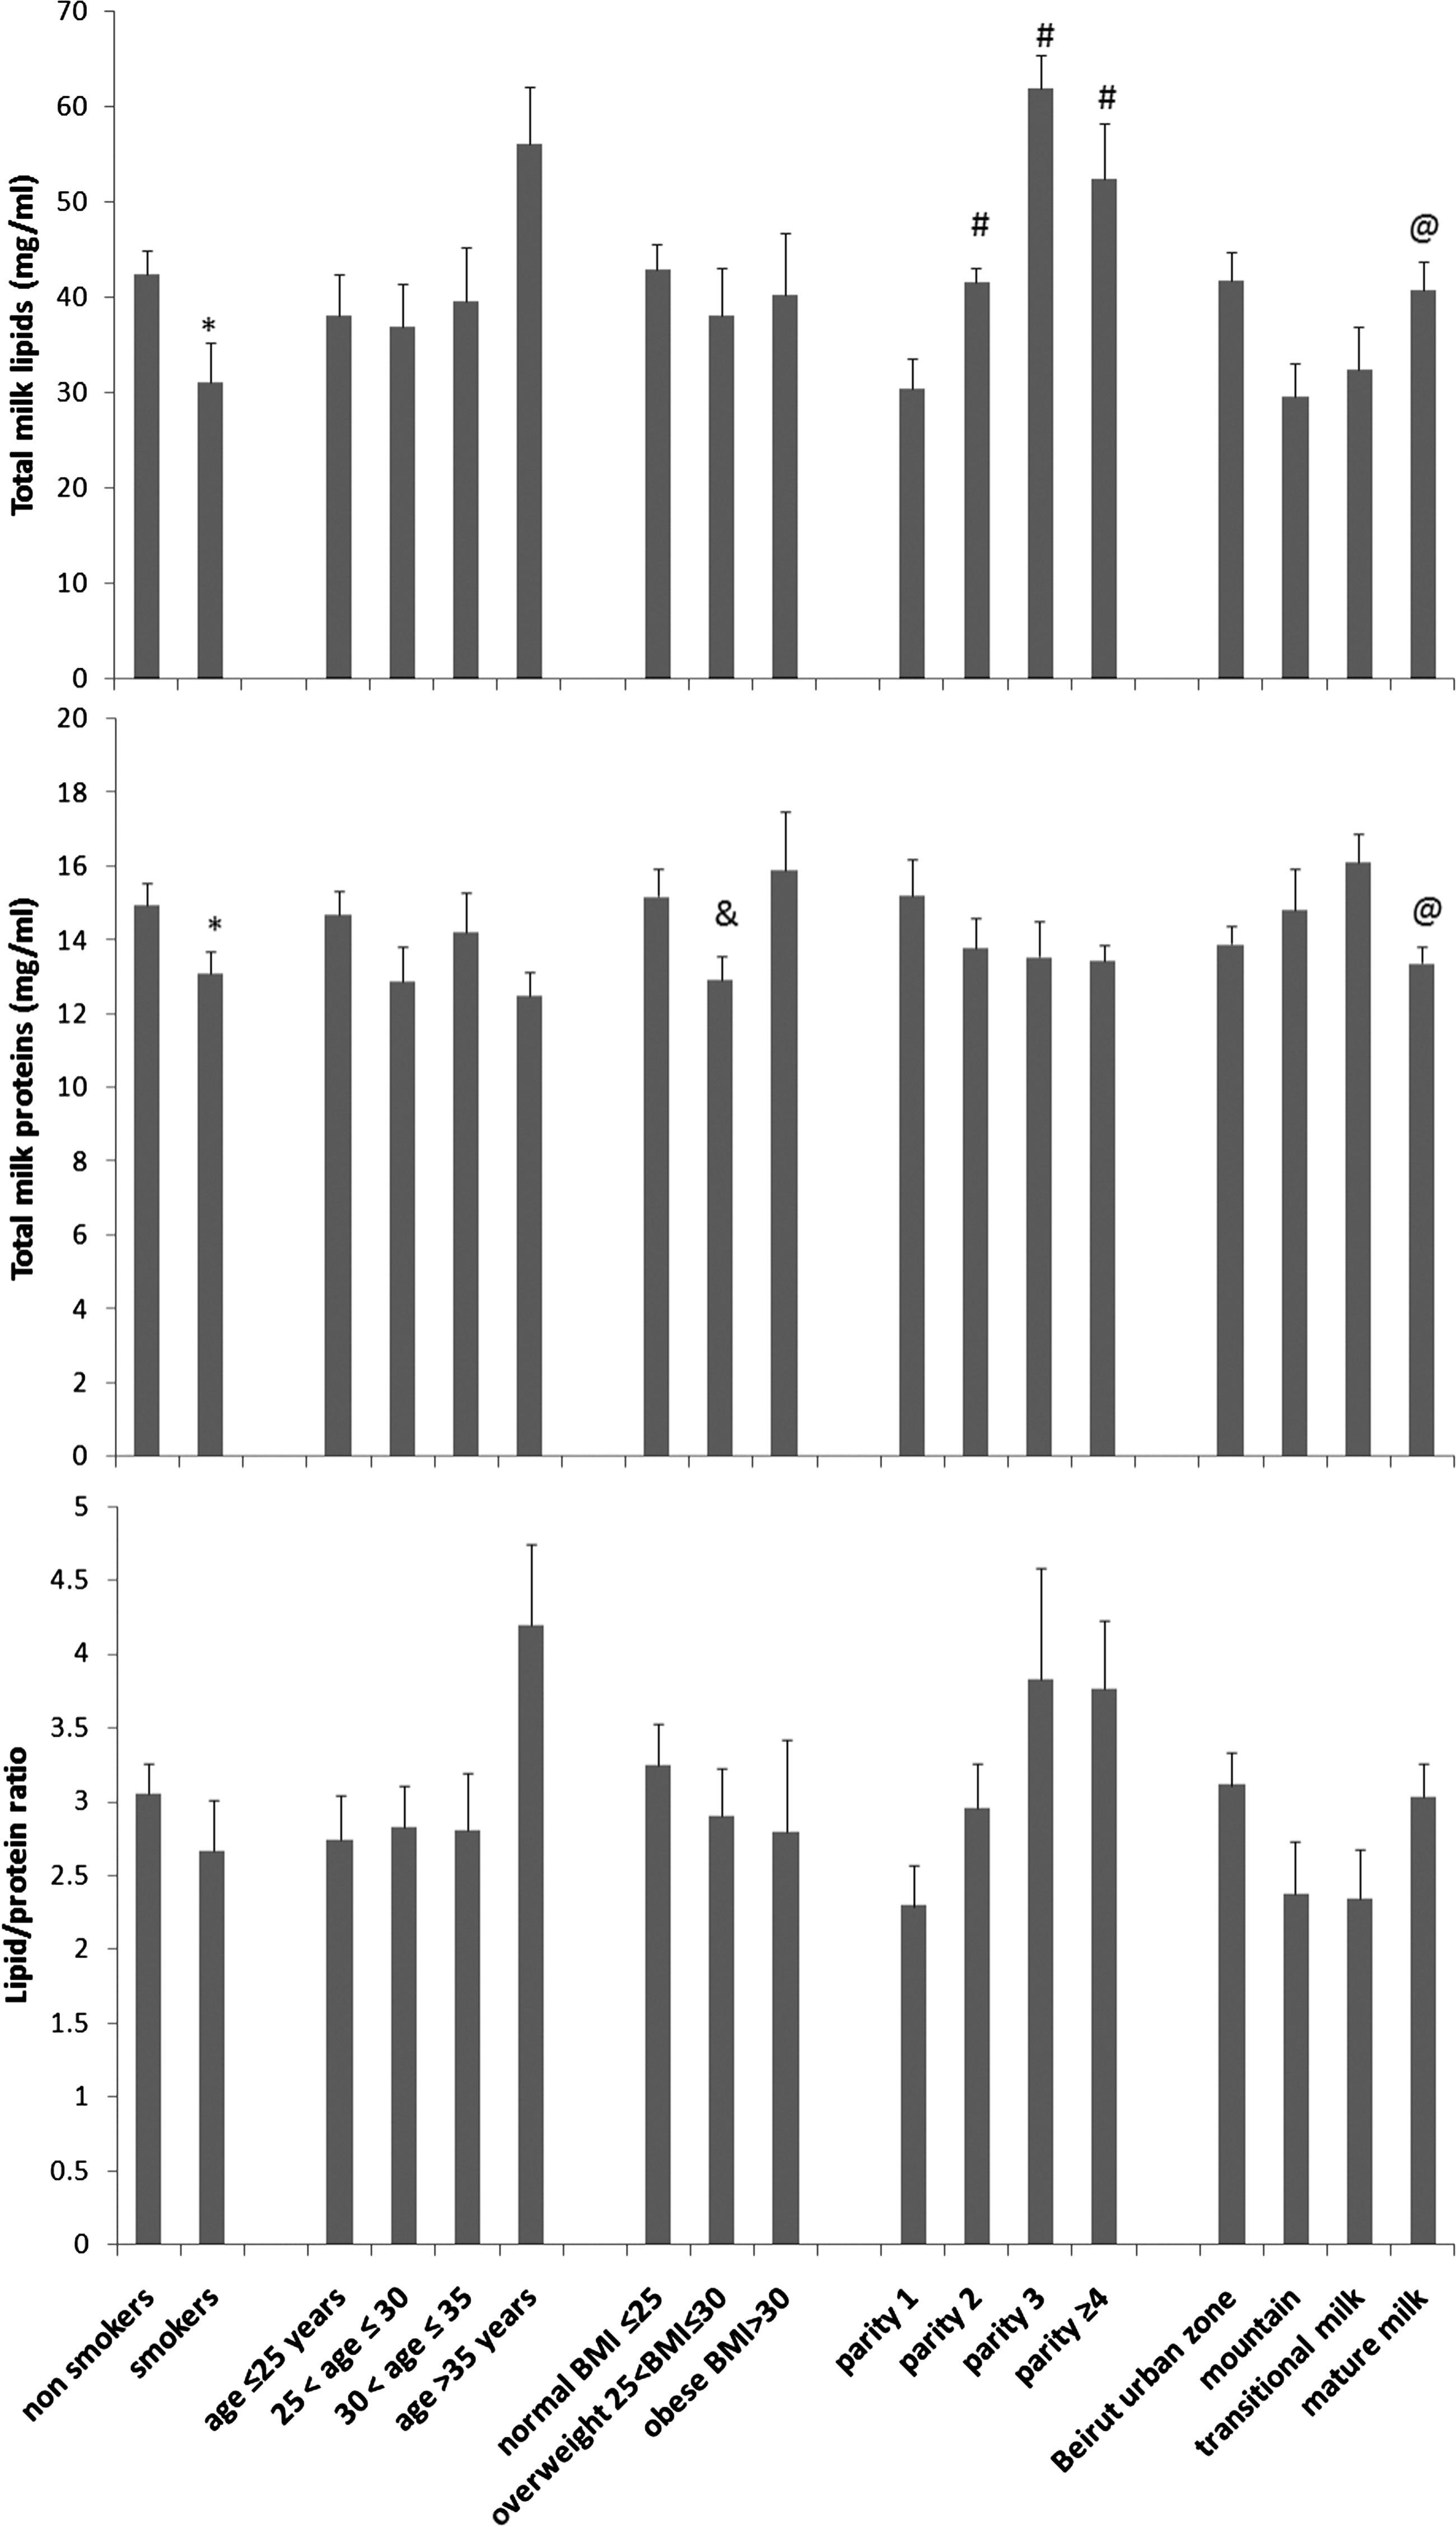
Effect of smoking, mothers' age, BMI, parity number, living area, and stage of lactation on lipid and protein concentrations and their ratios in human milk. Total lipids and proteins were measured in 23 smokers and 42 nonsmokers (see Table 2 for the other comparison groups). The values correspond to the average±error of all samples in a group, each determined in duplicate. The symbols refer to a statistically significant difference (t test, p<0.05) in comparison with *nonsmokers, #parity number 1, &normal BMI, and @transitional milk.
Data correspond to average±error values of the measured parameters (lipids, proteins, secreted immunoglobulin A [SIgA], and density) for all samples in a group or in a subgroup.
Refers to the multivariate analysis and the distinct columns correspond to different combinations among interacting variables. (+) refers to the variables that yielded significant interactions with one another.
Statistically significant differences (t test, p<0.05) are indicated between bsmokers and nonsmokers, coverweight and normal BMI, dparity number 1 or 2, and emature and transitional milk.
Regarding milk protein, the average±error was 14.94±0.60 mg/mL (n=43) for nonsmokers and 13.10±0.58 mg/mL (n=21) for smokers. This smoking-associated 12% decrease was statistically significant (by t test, p=0.048) (Table 2 and Fig. 1).
The lipid/protein ratio was calculated for each sample. The average±error was 3.05±0.21 for nonsmokers and 2.66±0.35 for smokers. This smoking-associated 12.7% decrease was not statistically significant (by t test, p=0.27) (Table 2 and Fig. 1).
Comparison of the general profile of milk proteins (smokers/nonsmokers)
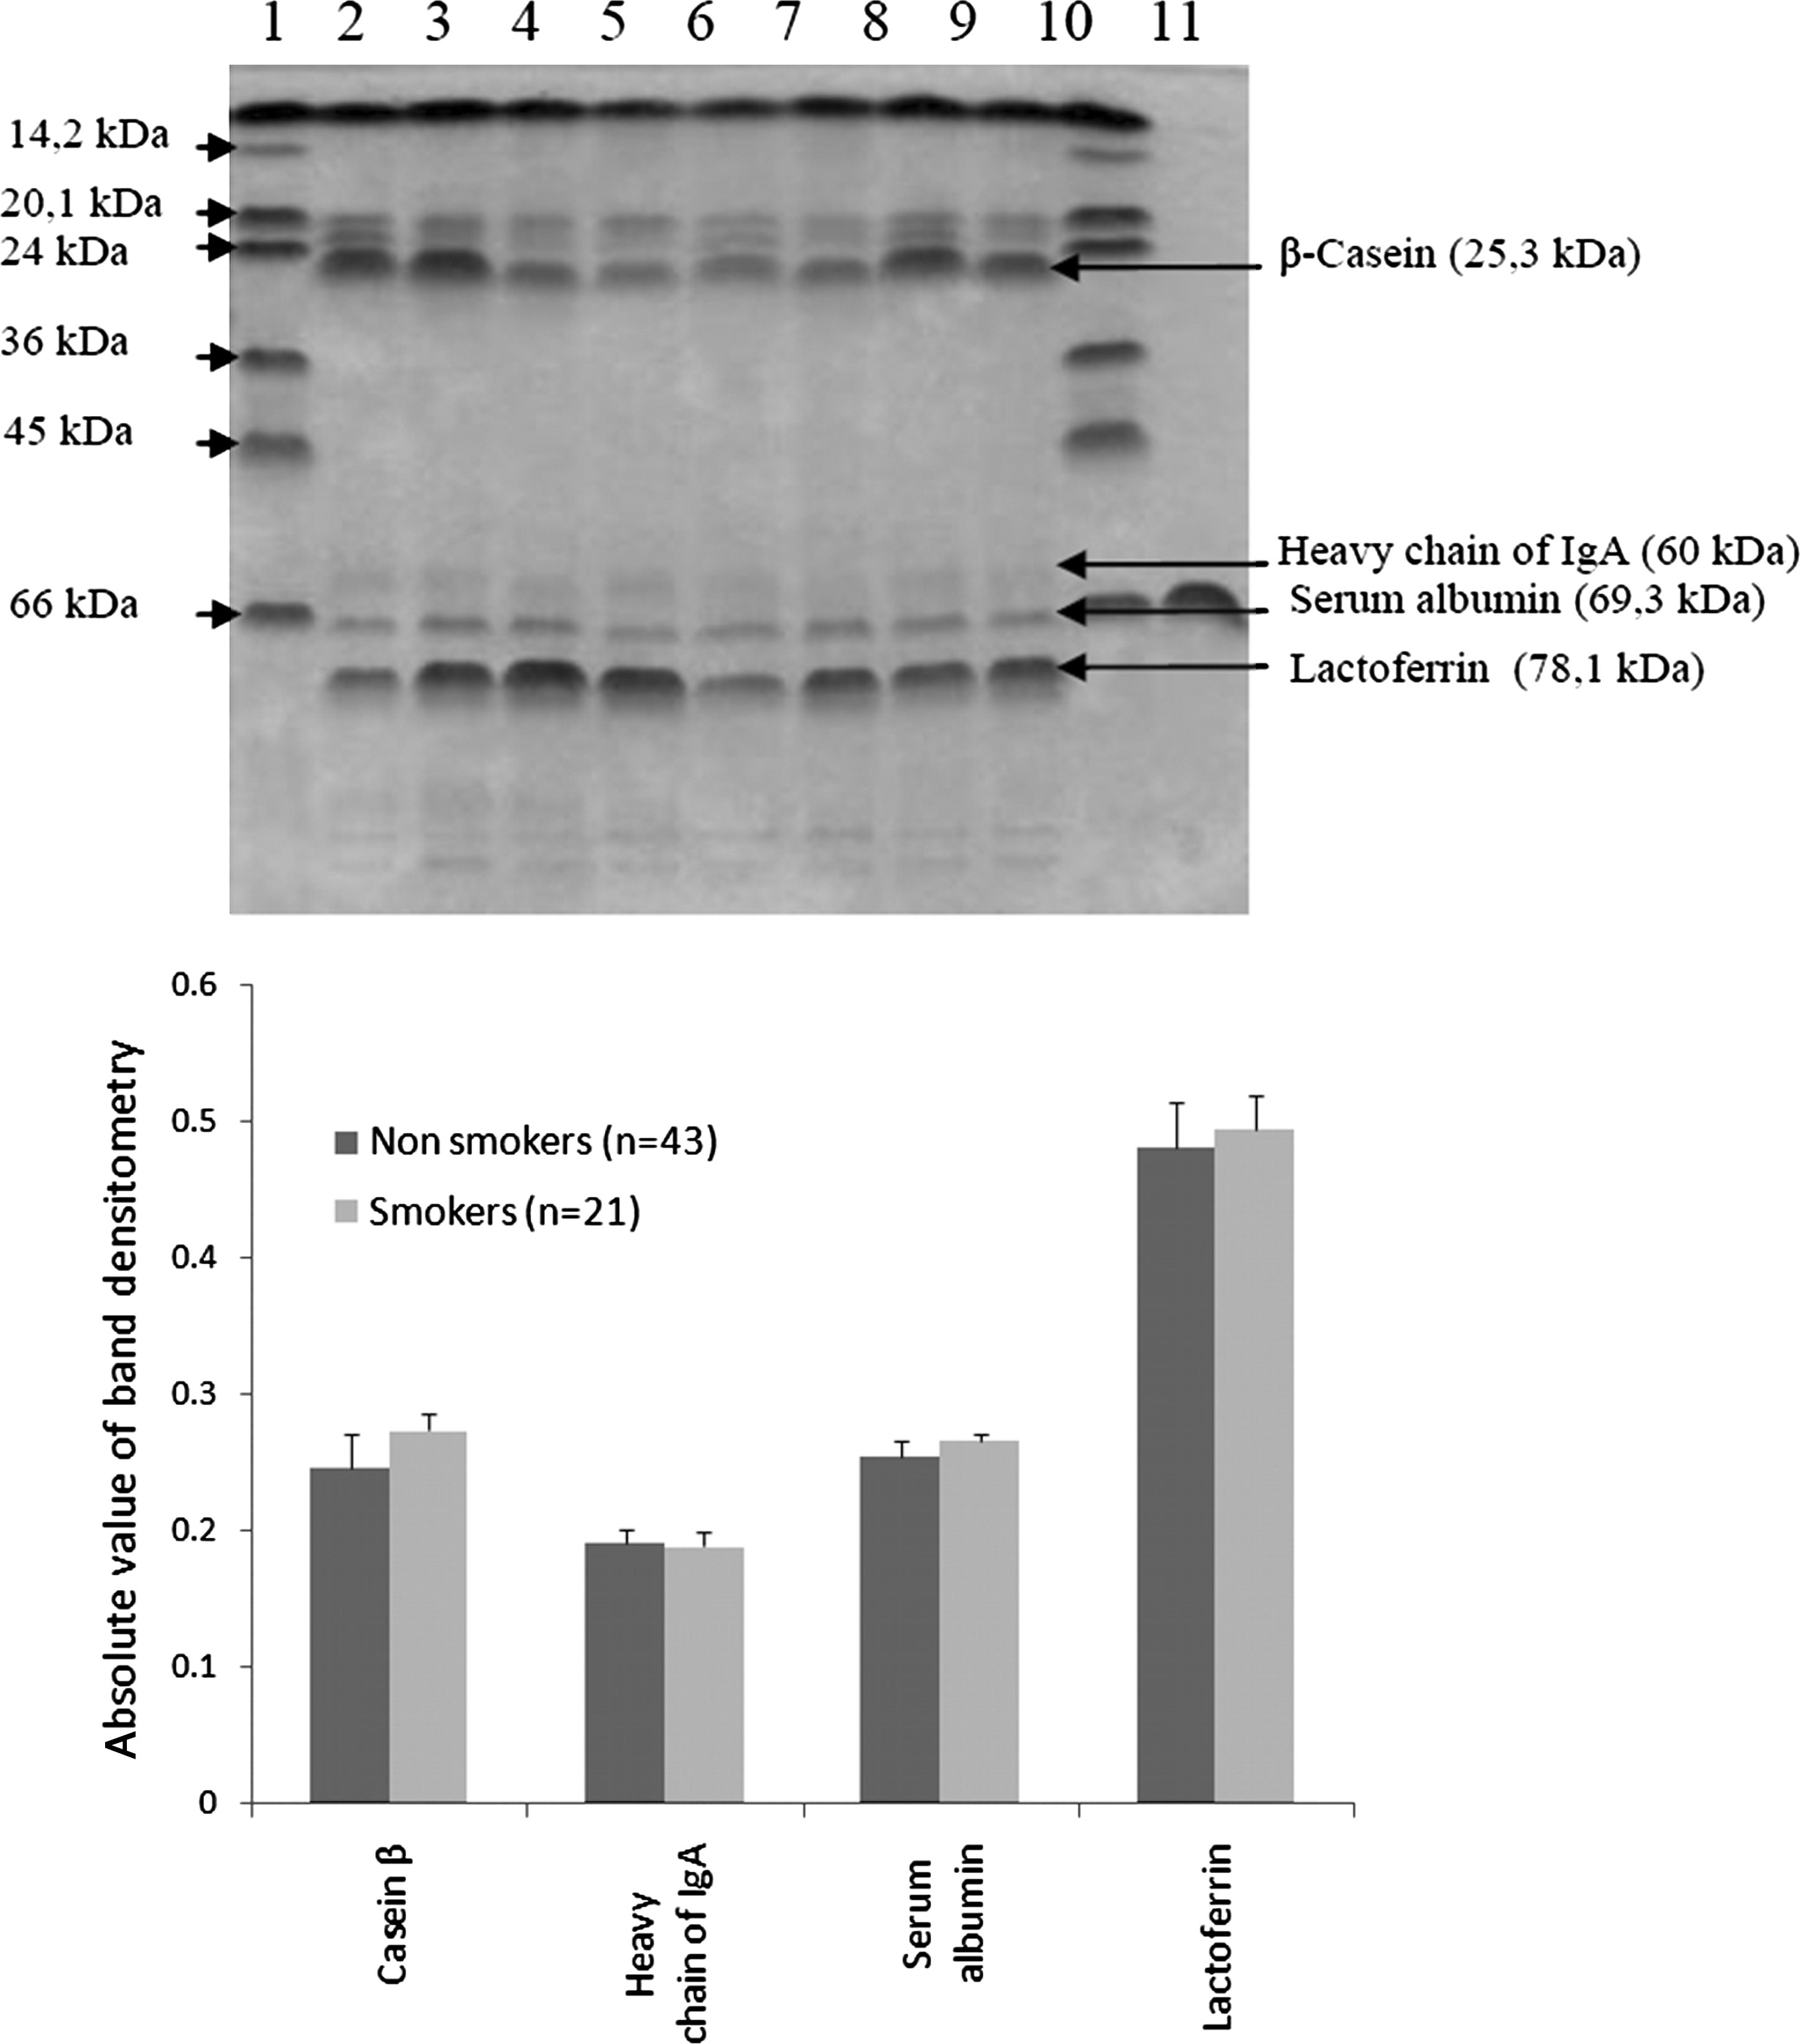
Sorting of total milk proteins was performed for all samples. The photograph of a representative gel is shown in Figure 2, where among the proteins four were identified based on the apparent molecular size and the use of reference material: β-casein (25.3 kDa), heavy chain of immunoglobulin A (60 kDa), serum albumin (69.3 kDa), and lactoferrin (78.1 kDa) (Fig. 2). Densitometry was performed, and the average of each protein relative amount was calculated for smokers and nonsmokers (Fig. 2). This semiquantitative approach did not show a significant difference between the two groups for each of the examined proteins (by t test, p>0.05). Because of the limitations of the SDS–polyacrylamide gel electrophoresis approach, this result requires confirmation using other more sensitive assays such as enzyme-linked immunosorbent assay.
(
Effect of smoking on milk SIgA concentration
The SIgA concentration in our samples ranged between 0.2 and 7.8 mg/mL. The average±error milk SIgA concentration was 0.78±0.32 mg/mL for smokers and 1.07±0.26 mg/mL for nonsmokers (Table 2 and Fig. 3). The observed 27% decrease was statistically nonsignificant (by t test, p=0.073) even when SIgA was expressed as milligram per milligram of total proteins (data not shown). However, the multivariate analysis showed a statistically significant interaction effect between smoking and lactation stage on SIgA (p=0.01) (Table 2).
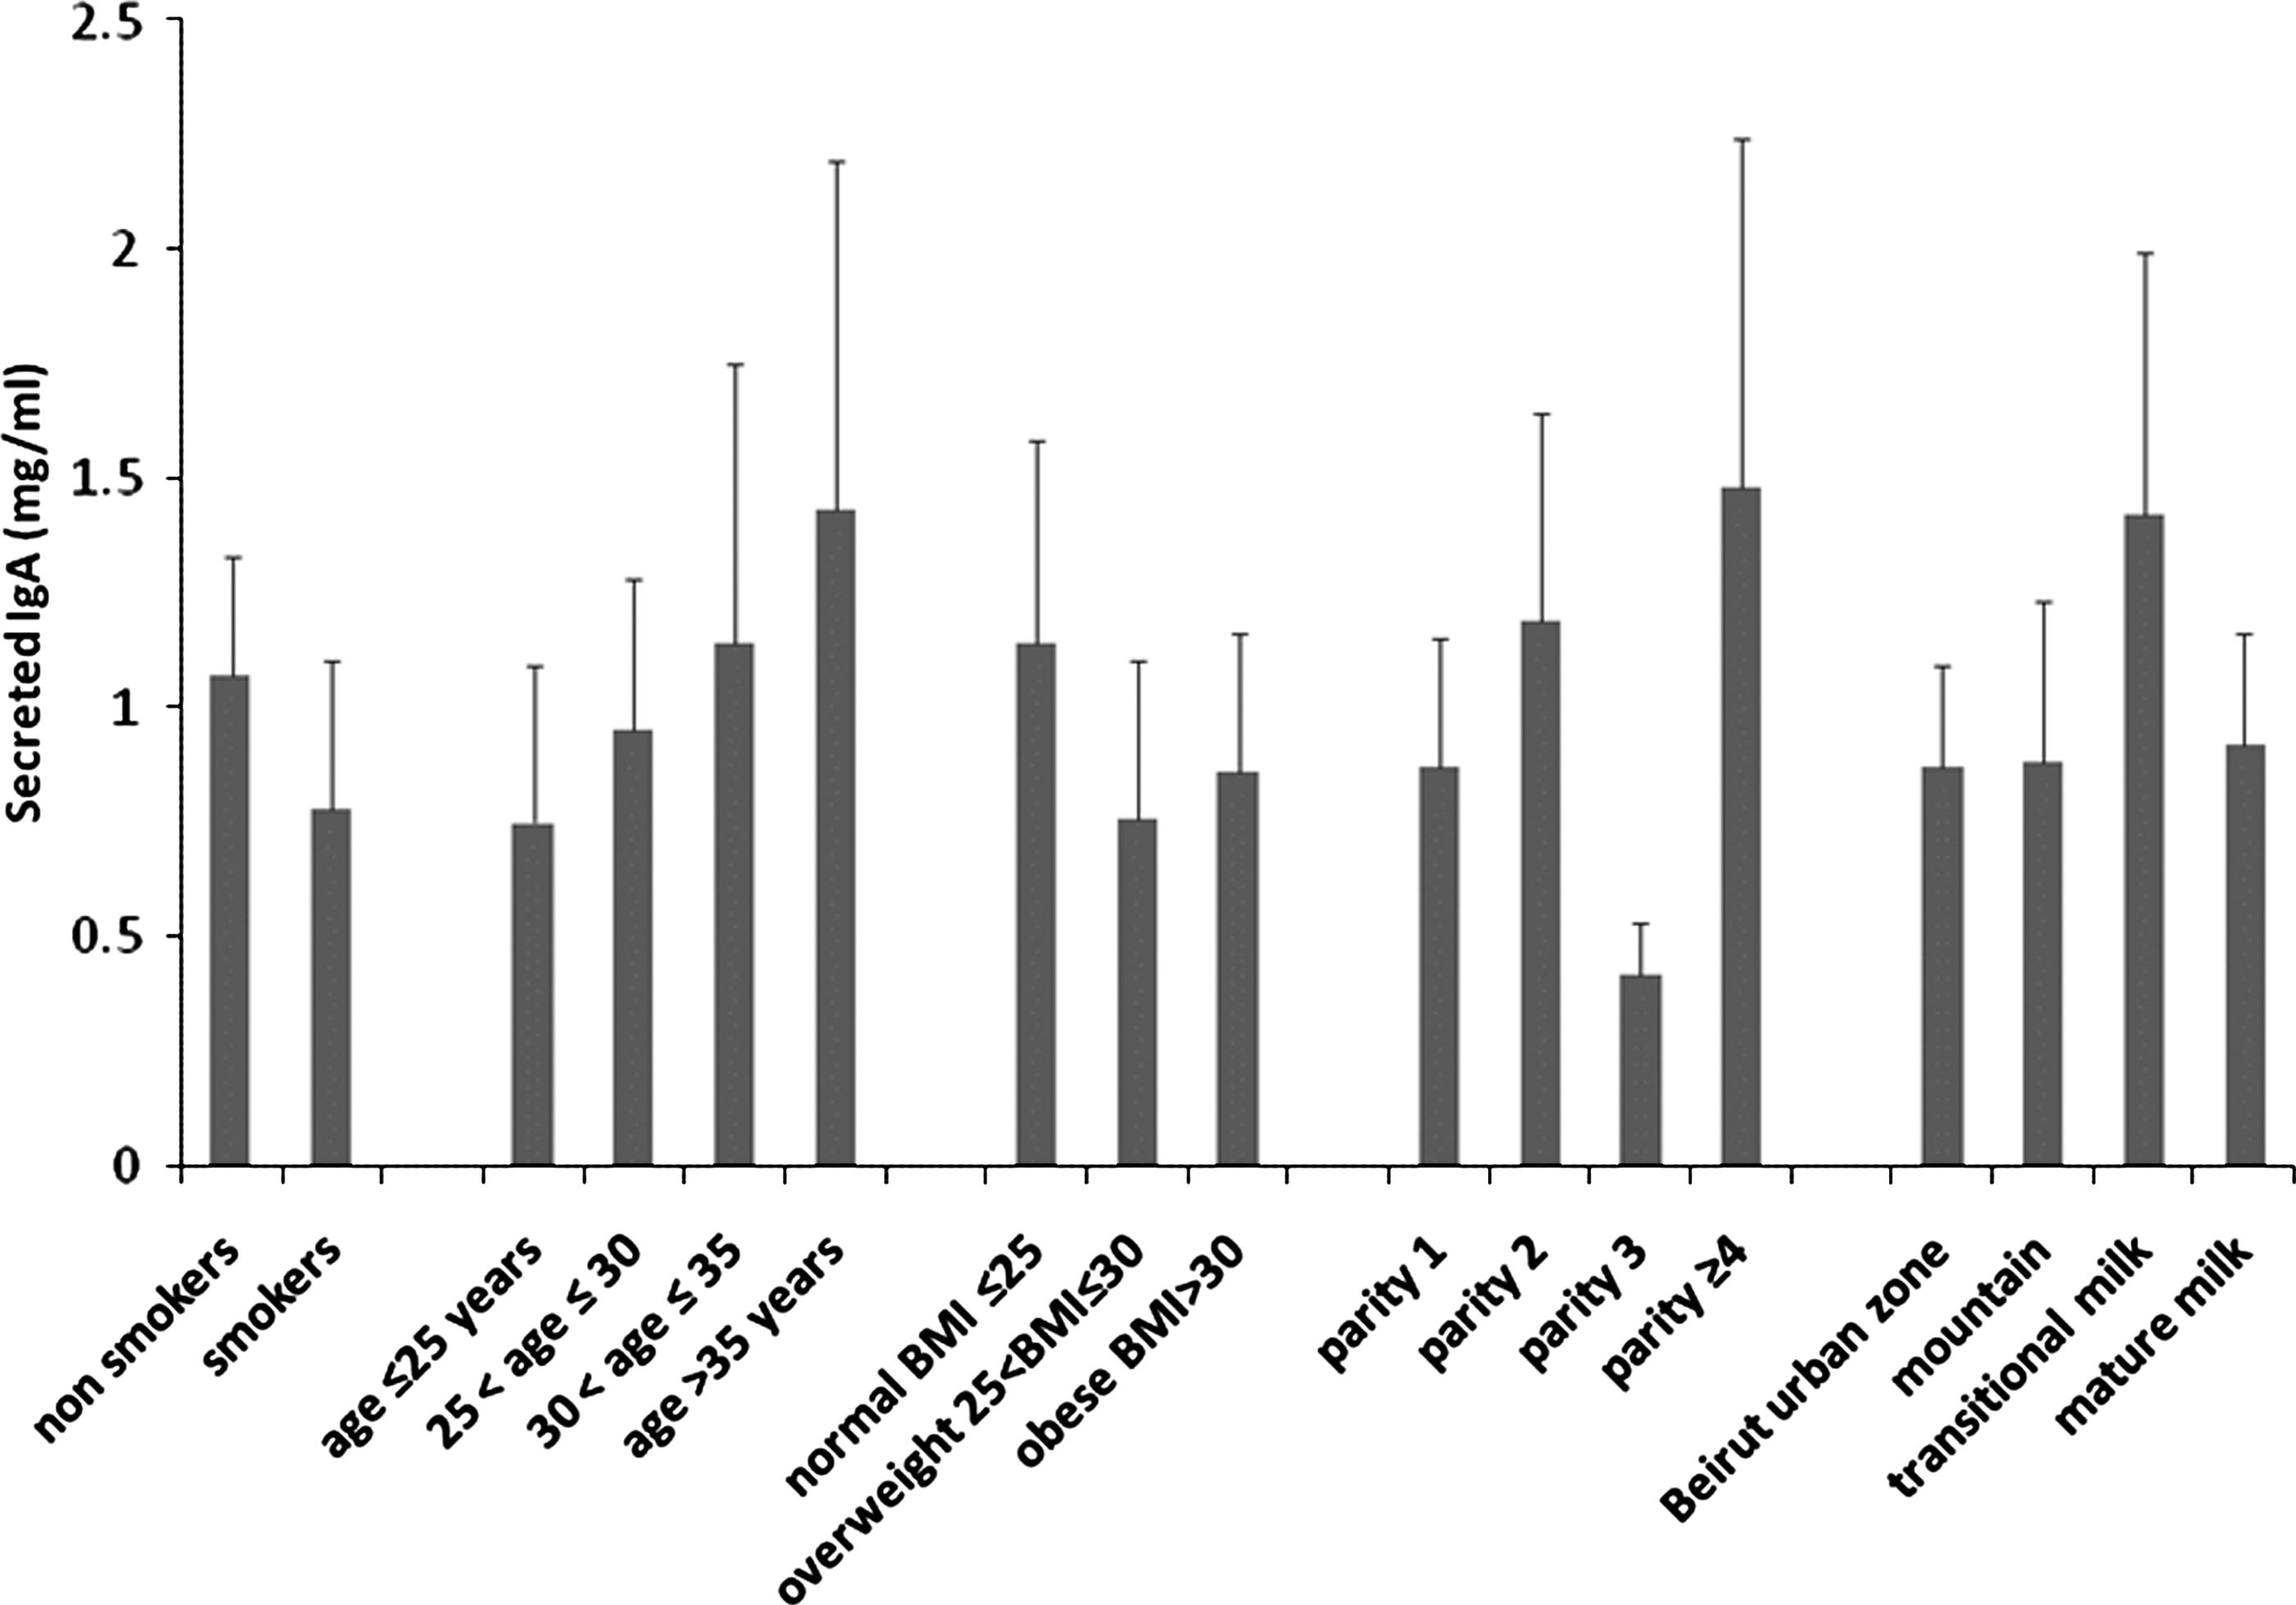
Effect of smoking, mothers' age, BMI, parity number, living area, and stage of lactation on SIgA concentration in human milk. IgA was measured in 23 smokers and 42 nonsmokers (see Table 2 for the other comparison groups). The values correspond to the average±error for all samples in a group, each determined in duplicate.
Effects of age, BMI, lactation stage, parity number, and residential area on milk composition
We analyzed the effect of mother's age, BMI, parity number, lactation stage, and geographic residential area (related to pollution) on milk composition. An increase in lipid concentration was found in the milk of mothers over 35 years of age; a decrease was found in mothers who live in a mountainous region (Figs. 1 and 3 and Table 2). However, these results were statistically nonsignificant. The concentrations of proteins and SIgA were not affected by age and residential area (Figs. 1 and 3 and Table 2). Regarding lactation stage, our results showed that mature milk protein concentration decreased by 20% (p=0.015), whereas milk lipids increased by 25% (p=0.034) in comparison with transition milk.
Regarding the effect of BMI (Fig. 1 and Table 2), it was not statistically significant for lipids or for SIgA. However, the overweight group (25<BMI≤30 kg/m2) showed 14.9% less protein than the normal group (BMI≤25 kg/m2) (p=0.044) and 18.7% fewer than the obese group (BMI>30 kg/m2) (p=0.033). No statistically significant difference was found in the average of total proteins between the normal group (BMI≤25 kg/m2) and the obese group (BMI>30 kg/m2) (p=0.611). BMI was not associated with any significant change in milk SIgA concentration.
Regarding the effect of parity number, our results showed an increase in milk lipid concentrations parallel to the increase in parity number up to 3 (F=11.87, p<0.05) (Fig. 1 and Table 2). In comparison with the single-parity group, milk lipid concentration of the two-parity group showed a 36% increase (p=0.016), of the three-parity group a 103% increase (p=0.001), and of the four-parity group a 72% increase (p=0.03). The increase of milk lipids in the three-parity group showed a 49% increase in comparison with the two-parity group (p=0.017). However, there were no statistically significant differences in lipid concentration between the groups corresponding to parity number 2 and 4 (p=0.331) or between 3 and 4 (p=0.517). Therefore, we conclude that milk lipid content increases with the number of parity, at least up to the third delivery. By contrast, milk protein concentration seemed to decrease with the increase in parity number, but the difference was not statistically significant (Fig. 1 and Table 2). The parity number was associated with irregular, statistically nonsignificant variations in SIgA concentration (Fig. 3).
Multivariate analysis of the interaction of variables on milk composition
Multivariate analysis of the effect of the six variables on lipids, proteins, their ratio, and SIgA confirmed the effects observed for the variables individually. The results of the interaction effects are summarized in Table 2.
Regarding lipids, the interaction effect of smoking, parity number, lactation stage, age, BMI, and residential area was statistically significant (p=0.028). The interaction is more significant among smoking, parity number, lactation stage, age, and BMI (p=0.009). The interaction is also significant among smoking, parity number, lactation stage, and BMI (p=0.036). The test did not show any other significant interaction effect among variables.
Regarding proteins, a statistically significant interaction effect was found among smoking, BMI, and age (p=0.048), among BMI, age, and lactation stage (p=0.042), and between age and BMI (p=0.015). No other significant interactions were found. Regarding the effects on SIgA, a significant interaction was found between smoking and lactation stage (p=0.01). Therefore, some of the variables that are considered here cause changes in milk composition individually as well as collectively through interaction, at least among some of them, as shown in Table 2.
Discussion
Smoking during lactation has been associated with many adverse health outcomes and clinical implications. Cigarette smoke comprises diverse toxicants and carcinogens that pass into milk of exposed mothers.16,17,29 The impact of smoking during lactation on progeny growth and development is well documented.22,30 A few studies using limited number of samples have investigated milk composition changes that are associated with smoking.15,16,23,24,31,32 In the present work, a relatively large number of milk samples (n=66) from smokers (n=23) and nonsmokers (n=43) was analyzed for density, protein, lipid, and SIgA content, and general protein profile.
Our results showed that smoking alters milk composition by decreasing its fat and protein content without modifying its density. A decrease in SIgA content was observed in the milk of smokers but was found to be statistically not significant, probably because of the wide variability range of SIgA among the samples in each group (0.1–7.5 mg/mL). We also found that milk composition varies depending on BMI, parity number, and lactation stage and that some of the variables under study show significant interaction effects.
Our study demonstrated that the range of lipid concentration (30–50 mg/mL) was similar to that published on human milk23,24,33 and that a statistically significant 26% decrease was associated with smoking (Fig. 1 and Table 2). This finding is consistent with previous results, 24 which showed that smoking mothers (n=11) produced less milk volume with lower fat concentration in comparison with nonsmokers (n=29), all of whom had delivered prematurely. The smoking-associated decrease was more important in the present investigation (26%) in comparison with the previous study (15%), which could be due to the greater number of samples (about twice the number) or to a more potent effect of smoking in the later lactation stages.
Our results are also in agreement with those of Agostoni et al., 23 who reported that smoking in early pregnancy was associated with a lower milk fat content later during the first months of lactation. Such a delayed (at least 5 months) effect could be attributed to smoking-derived toxicants that are stored in the adipose tissues, particularly in the mammary glands, and that continue to act on the lactation process.
We also report here a statistically significant 12% decrease of milk proteins content in smokers (Fig. 1 and Table 2). The range of protein concentration was similar to that previously published.33,34 Our results agree with those reported by Milnerowicz and Chmarek 35 regarding a smoking-associated decrease of total protein of human milk but disagree with those reported by Hopkinson et al., 24 who found no smoking-associated difference in the total nitrogen protein in milk. The discrepancy could be due to the low number of smokers enrolled in the latter study (n=11), to the method used for protein determination, or to the fact that their study was limited to premature delivery cases. 24 Despite this discrepancy, our study complements the previous ones in demonstrating that smoking is associated with a decrease in milk proteins during all lactation stages.
Considering the lipid/protein ratio may provide information on whether smoking affects the overall function of the mammary gland or whether it acts via specific mechanisms on lipid and protein synthesis and secretion. In this investigation, smoking was associated with a statistically nonsignificant 9% decrease of this ratio (Fig. 1 and Table 2). This result suggests that the smoking-associated decrease of lipids and proteins is due to a decrease of the overall process of secretion into the lumen of the mammary gland alveoli, but it cannot rule out specific effects on the genes encoding milk proteins and enzymes involved in lipid synthesis and secretion. Indeed, smoking decreases the basal prolactin levels at parturition and during lactation, 21 which could explain, at least in part the decrease in milk protein levels in smokers because prolactin induces the expression of milk protein-encoding genes such as β-lactoglobulin. 1 Archibong et al. 36 reported that benzo[a]pyrene decreased prolactin concentration in rat plasma. Because benzo[a]pyrene is known to produce a weak mitogenic signal in mammary epithelial cells in humans, 37 we hypothesize that it could mimic signaling pathways of certain growth factors in human mammary epithelial cells and may alter growth and function of these cells and the milk composition.
Regardless of the mechanism of action, it is obvious that the smoking-associated decrease in milk lipids and proteins alters its quality and can have an adverse effect on development of newborns and their energy intake, particularly between the fourth and the sixth months of an infant's life, which is a crucial period for rapid body growth where the baby accumulates approximately about 1,600 g of lipids. 38 These data agree with previous findings that infants of smoking mothers (during pregnancy and lactation) show a slower growth rate. 22
The comparison of milk general protein profile between smoker and nonsmoker groups showed no statistically significant difference in the identified proteins (Fig. 2). These results, although semiquantitative, are in agreement with those previously reported regarding albumin and lactoferrin. 35 Nevertheless, these results should be confirmed with quantitative assays.
Measurement of SIgA content of human milk in smokers and nonsmokers (Fig. 3 and Table 2) showed a 27% decrease of SIgA concentration, but the difference was not significant, which could be attributed to the wide variability range of SIgA concentration (0.2–7.8 mg/mL). In fact, the upper limit of this range is higher than what was previously reported. 33 Although our result for SIgA was not statistically significant, it seemed to contradict previous reports about a smoking-associated increase of milk IgA 31 and about a lack of difference between smokers and nonsmokers. 32 In fact, the multivariate analysis showed a significant interaction between smoking and lactation stage on SIgA (Table 2).
Regarding the effect of the other parameters on milk composition, the statistical analyses between the subgroups presented in Table 1 showed that age and residential area caused no significant change of milk density and composition (Fig. 1 and Table 2). In fact, conflicting results were reported regarding the influence of age on human milk composition. 39 Therefore, the increase of milk lipid concentration with mothers' age and its decrease in mothers living in a mountainous region reported here (Fig. 1 and Table 2), although statistically not significant, deserve further investigation.
Transition milk was richer in proteins than mature milk (Fig. 1 and Table 2), whereas mature milk was richer in lipids, which agrees with the normal milk composition evolution through lactation stages.1,40 Regarding BMI, it seems to affect milk protein concentration because the group of overweight mothers (25<BMI ≤30 kg/m2) produced less protein than the normal group (Fig. 1 and Table 2). Lipid concentration did not change with the BMI change in our samples. These data require further investigations using more samples. It is possible to attribute any potential BMI-related modification of milk composition to the increase of oxidative stress and its general metabolic consequences in obese and overweight patients. 41
As for the increase in parity number, it was associated with a statistically significant increase in milk lipid concentration regardless of the other factors. Proteins showed a trend to decrease, but the difference was not statistically significant (Fig. 1 and Table 2). Our results contradict the previously reported decrease of milk lipid (or fatty acid) concentration of multiparous women in comparison with primiparous women. 42 However, the absence of significant parity-related difference of proteins reported in our study is in agreement with previous investigations. 34 The parity-related increase of lipid concentration could be attributed to the histological and anatomical changes of the mammary gland during the successive pregnancies. This hypothesis may be supported by the increasing trend of lipid concentration with age, although not statistically significant (Fig. 1 and Table 2).
Results of the multivariate analysis (Table 2) confirmed the effects of the variables individually and indicated that they significantly interact with one another to affect milk composition. For instance, the effect on lipids is subject to a significant interaction of smoking, BMI, parity number, mother's age, and lactation stage. The effect on proteins is also subject to a significant interaction of BMI and age in combination with smoking or lactation stage. The effect on SIgA of smoking and the lactation stage was found to be statistically significant; however, the differences caused by these factors individually were not significant. These results illustrate the complex effect of the interacting factors on milk production. However, this complexity did not influence our conclusion regarding the smoking-associated changes of milk composition, especially as the means for the different variables between smoker and nonsmoker groups were not statistically different (Table 1) and because the percentage of smokers does not significantly differ between the subgroups, except for one (Table 1).
Conclusions
Our study demonstrated that parity number and BMI significantly affect human milk composition and that smoking was associated with a decrease in lipid and protein content of human milk. The SIgA concentration seemed to decrease in smokers' milk but without statistical significance. There is a significant interaction effect among some of the variables on lipids, proteins, and SIgA. The mechanism through which smoking affects milk composition and interacts with the other variables deserves a molecular investigation at the level of genes involved in synthesis and secretion of milk components.
Footnotes
Disclosure Statement
No competing financial interests exist.