
Abstract
Abstract
Objective:
There is conflicting evidence as to whether duration of lactation may decrease the risk of subsequent development of an unfavorable maternal metabolic profile, including overweight and obesity. We hypothesized that duration of lactation is associated with a more favorable metabolic profile and healthier anthropometric measurements.
Subjects and Methods:
Ninety-eight parous women were studied from the Norwegian EBBAI-study (Energy Balance and Breast cancer Aspects-study), a cross-sectional study of healthy premenopausal women 25–35 years old. Historical lactation data were collected, anthropometric measurements were taken, fasting blood samples (for serum glucose, triglycerides, total cholesterol, and high-density lipoprotein cholesterol) were drawn, and women were asked to fill in a precoded food diary.
Results:
Mean time since last birth was 4.7 years, mean number of children was 1.9, mean total duration of lactation was 19 months, and average length of lactation per child was 10.3 months. Women who on average lactated for less than 10 months per child had higher mean levels of fasting serum glucose (5.2 mmol/L vs. 5.0 mmol/L, p=0.04), serum triglyceride (0.91 mmol/L vs. 0.66 mmol/L, p=0.001), and serum cholesterol (4.78 mmol/L vs. 4.32 mmol/L, p=0.004) and a higher waist-to-hip ratio (0.81 vs. 0.77, p=0.001) than women who lactated for 10 months or more per child. The inverse association between average length of lactation per child and waist-to-hip ratio persisted after adjustment for potential confounders.
Conclusions:
These results support the hypothesis that duration of lactation may be associated with a healthier metabolic profile and healthier anthropometric measurements, especially lipid levels and waist-to-hip ratio, even years after weaning.
Introduction
For women, metabolic syndrome is defined as waist ≥80 cm (ethnicity specific), plus any two of the criteria S-triglyceride >1.7 mmol/L (150 mg/dL), S-high-density lipoprotein (HDL) cholesterol <1.29 mmol/L (50 mg/dL), systolic blood pressure ≥130 mm Hg, diastolic blood pressure ≥85 mm Hg, and fasting S-glucose ≥5.6 mmol/L (100 mg/dL). 2 In women, having an increasing number of children has been associated with a slightly higher body mass later in life 3 and higher rates of metabolic syndrome, but in women with a history of breastfeeding (>1 month) decreased rates have been observed. 4
Lactation imposes a significant metabolic burden on mothers due to an increased energy requirement,5,6 and it may seem like the changes that occur during pregnancy (visceral fat accumulates, insulin resistance, and increased lipid and triglyceride levels) reverse more quickly and more completely with lactation. 7 Lactation has been associated with a reduced risk of breast cancer, ovarian cancer, and type 2 diabetes, 8 and it has been hypothesized that the protective effects of lactation may derive from its energetic demands. 9
Among lactating mothers (compared with nonlactating mothers) an increased weight loss in the postpartum period has been seen10–12 and also a lower waist circumference among exclusively or predominantly lactating women. 13 Still, not all studies find such associations.14,15 These conflicting results may be due to methodological differences. For instance, in some studies anthropometric measures were estimated from self-reported measurements, whereas in other studies the anthropometric measurements were directly measured. The studies that find beneficial effects tend to be the ones of higher quality. 11 Another issue is the range of lactation. Most results emerge from studies with a short average duration of lactation, and they are often restricted to the first months after delivery. 13
Lactation duration in Norway is generally high. 16 We therefore wanted to examine metabolic profile and body composition related to duration of lactation in a clinical cross-sectional study of young healthy parous women in Norway. We hypothesized that a longer duration of lactation is associated with a more favorable metabolic profile and healthier anthropometric measurements.
Subjects and Methods
Subjects and study design
Historical lactation data were collected (2000–2002) among the 98 parous women who had given birth (1986–2001) from the Norwegian EBBAI-study (Energy Balance and Breast cancer Aspects-study), a cross-sectional study of 204 healthy premenopausal women 25–35 years old.17–19 The subjects were recruited through local media campaigns in the city of Tromsø and surrounding areas in North Norway and met the following eligibility criteria: self-reported regular menstruation (normal cycle length, 22–38 days within the previous 3 months), no use of steroid contraceptives, no pregnancy or lactation over the previous 6 months, no history of gynecological disorders, and no chronic medical conditions (e.g., diabetes, hypo- or hyperthyroidism). All participants came to the Department of Clinical Research, University Hospital of North Norway, Tromsø, at scheduled times. 18
As we wanted to examine metabolic profile and body composition in relation to duration of lactation, we only used data from the 98 women who had ever given birth.
Ethical considerations
Participating women signed an informed consent form. The study was approved by the Regional Committee for Medical Research Ethics and the Norwegian Data Inspectorate.
Characteristics of the study population
Questionnaires were used to collect information regarding reproductive history, lactation, marital status, age, education, height and weight at 18 years of age, and past and current lifestyle habits, including leisure time physical activity, alcohol consumption, and tobacco use. Leisure time physical activity was originally graded as low/sedentary, moderate activity, hard activity, and very hard activity.18,19 Because of the small number of women in some groups, leisure time physical activity was graded as low/moderate physical activity and hard physical activity.
Lactation history
Lactation history data from the 98 parous women were collected through retrospective questions. The women were asked to fill in the birth year of each child and the number of months each child was breastfeed. Recall aids including a lifetime calendar were used, and all answers were checked for inconsistencies during an interview by the same trained nurse. Duration of lactation was calculated in months, with less than 1 month of lactation calculated as zero.
“Average length of lactation per child” was calculated by summarizing the duration of lactation for each of the woman's children, divided by the number of children. We stratified the variable into two groups by median split: less than 10 months and 10 months or more (median, 10.2 months). Total duration of breastfeeding was computed by summarizing the length of lactation for each child.
Anthropometric and clinical measurements
On the first day possible after onset of menstrual bleeding (day 1–5 after onset of the menstrual bleeding), the participants had a clinical examination, including body height, weight, waist circumference, hip circumference, resting heart rate, blood pressure, and fasting blood sampling.18,19 Diastolic and systolic blood pressures were measured (Propaq® 102 EL; Protocol Systems, Inc., Beaverton, OR), with the subject sitting in a resting position. Anthropometric measurements were taken with participants wearing light clothing and no footwear: height was measured to the nearest 0.5 cm, and weight to the nearest 0.1 kg on an electronic scale. Waist circumference was measured in a horizontal line 2.5 cm above the umbilicus; hip circumference was measured at the largest circumference, both measured to the nearest 0.5 cm. Waist-to hip ratio (WHR) was calculated as the circumferences of the waist divided by that of the hips. A second clinical visit (day 7–12 after onset of the menstrual bleeding) included a whole-body scan using dual-energy X-ray absorptiometry (DEXA) (DPX-L 2288; Lunar Radiation Corp., Madison, WI). All clinical procedures were conducted by the same trained nurse at the Department of Clinical Research, University Hospital of North Norway. 18 For these analyses BMI was calculated and characterized as underweight (less than 18.5 kg/m2), normal (18.5–24.9 kg/m2), overweight (25–30 kg/m2), and obese (30 kg/m2 or greater).
Serum samples
At the first visit, blood samples were drawn after overnight fasting. Serum concentrations of glucose, triglycerides, total cholesterol, and HDL cholesterol were measured in fresh sera at the Department of Clinical Chemistry, University Hospital of North Norway. Serum glucose was measured enzymatically by the hexokinase method, and serum triglycerides were assayed by enzymatic hydrolysis with lipase. Serum cholesterol was determined enzymatically using cholesterol esterase and cholesterol oxidase and with HDL cholesterol quantified by a direct assay using polyethylene glycol-modified enzymes and dextran sulfate. 18
Food diary
Dietary data were collected on seven different weekdays during one menstrual cycle (days 3–6 and 21–23) using a precoded food diary developed and validated by the Department of Nutrition, University of Oslo, Oslo, Norway, 20 and thereafter modified for use in the present study population. The women completed one diary per day for all seven selected weekdays and were asked to record the type and the portion size of every food item consumed during the 24-hour period. A photo booklet facilitated quantification of portion sizes. All answers were checked by interview by the same trained nurse, and all diaries were manually coded and controlled. The Department of Nutrition computed average daily intake of energy and nutrients using established software systems and a food composition database.
Statistical analyses
Total duration of breastfeeding was analyzed both as a continuous variable and stratified as explained above. To find out if average length of lactation per child (stratified) was associated with a more favorable metabolic profile and healthier anthropometric measurements, we used analysis of variance for continuous variables and χ2 tests for categorical variables. Associations between average length of lactation per child as a continuous variable and other continuous variables were examined by Pearson's correlation coefficients. The distribution of each variable was examined and found to be sufficiently normally distributed. Mean and SD values are reported unless otherwise stated, and a value of p<0.05 was used as a criterion for reporting statistical significance. Age and multivariable linear regression models were also used to examine the relationship between average length of lactation per child (continuous) as an independent variable and maternal clinical and anthropometric measures. Similar linear regression models were performed with total duration of breastfeeding per woman (continuous). Based on a priori knowledge we made adjustments for potential confounders: age, physical activity, time since last birth, tobacco use, length of education, and marital status. All reported p values are two-sided. Statistical analyses were performed with SPSS version 18.0 software (SPSS, Inc., Chicago, IL).
Results
Demographic, lifestyle, and reproductive characteristic, along with data on diet and clinical measures, are given in Table 1. The women had an average energy intake of 8.0±1.99 MJ/day, and most of the women reported low/moderate physical activity. Anthropometric measures are presented in Table 2. Mean BMI was 25.1 kg/m2 (range, 19.4–39.8 kg/m2), and 42% of the women were overweight or obese (BMI ≥25.0 kg/m2). Mean DEXA total fat was 35.5% (range, 20.9–51.0%), mean waist circumference was 81.9 cm (range, 67.0–116.0 cm), and mean WHR was 0.79 (range, 0.65–0.98). At 18 years of age, mean BMI was 21.4 kg/m2, 12% of the women were underweight, and 7% were overweight or obese.
Data are mean (SD) values or proportions.
By one-way analysis of variance or χ2 test.
Hard physical activity.
Blood sampling first visit (days 1–5 of the menstrual cycle).
To convert values for glucose to mg/dL, multiply by 18.0182.
To convert values for triglyceride to mg/dL, multiply by 88.57396.
To convert values for cholesterol or high-density lipoprotein (HDL) cholesterol to mg/dL, multiply by 38.66976.
fS, fasting serum.
Data are mean (SD) values or proportions.
By one-way analysis of variance or χ2 test.
Self-reported height and weight at 18 years of age.
BMI, body mass index; DEXA, dual-energy X-ray absorptiometry; WHR, waist-to-hip ratio.
The women had on average 1.9 children (range, 1–5 children), and average elapsed time since last birth was 4.7 years (range, 0.7–13.9 years). Average length of lactation per child was 10.3 months (range, 0–28 months). On average, the first-, second-, and third-born children were breastfed for 9.8 months (n=98; range, 0–28 months), 10.5 months (n=65; range, 0–36 months), and 8.1 months (n=24; range, 0–18 months), respectively. The total duration of breastfeeding per woman was 19.2 months (n=98; range, 0–54 months).
Women who lactated for an average of less than 10 months per child had significantly fewer years of schooling than women who on average lactated for 10 months or more per child (14 vs. 16 years, respectively). They were also younger at their first birth (23.3 vs. 25.5 years, respectively). Average lactation per child did not differ significantly by age, marital status, number of children, and smoking pattern (Table 1).
Average length of lactation per child was weakly, but significantly, associated with total maternal energy intake (Pearson's r=0.22, p=0.05), as well as intake of protein (Pearson's r=0.24, p=0.05), carbohydrates (including fiber) (Pearson's r=0.23, p=0.05), and fiber (Pearson's r=0.30, p=0.01). In stratified analyses women who on average lactated for less than 10 months per child had a significantly lower intake of protein (69.4 vs.78.2 g/day, respectively) and a lower intake of fiber (13.9 vs. 17.1 g/day, respectively) than women who on average lactated for 10 months or more per child. No significant differences were found regarding fat or alcohol intake, and there were no differences in the energy percentage from each nutrient (Table 1). Women who on average lactated for less than 10 months per child were less likely to be physically active than women who on average lactated for 10 months or more per child (12 vs. 31%, respectively, engaged in hard physical activity) (Table 1).
Average length of lactation per child was weakly and inversely associated with serum triglyceride levels (Pearson's r=–0.22, p=0.05). Women who on average lactated for less than 10 months per child had significantly higher levels of fasting serum glucose, serum cholesterol, and serum triglyceride than women who on average lactated for 10 months or more per child (Table 1).
Relationships between different measures of body composition/indicators of adiposity (weight, BMI, waist circumference, WHR, and DEXA total fat percentage) and average length of lactation per child were evaluated using analysis of variance. WHR was significantly higher (0.81 vs. 0.77, respectively) in women who on average lactated for less than 10 months per child compared with those who on average lactated for 10 months or more per child. Mean waist circumference was also higher in women who on average lactated for less than 10 months per child compared with those who on average lactated for 10 months or more per child (Table 2). Furthermore, women with an average length of lactation of less than 10 months per child had a 4.7 times higher risk of having an unhealthy WHR (defined as >0.85), 1 compared with women with an average length of lactation of 10 months or more per child (relative risk=4.7, 95% confidence interval=1.4–15.8).
In linear regression models various anthropometric measures (BMI, waist circumference, WHR, and DEXA total fat) and clinical measures (blood pressure, fasting S-glucose, fasting S-triglyceride, fasting S-HDL cholesterol, and fasting S-cholesterol) were individually analyzed as a dependent variable, with average length of lactation per child as independent variable. The regression line for WHR is shown in Figure 1.
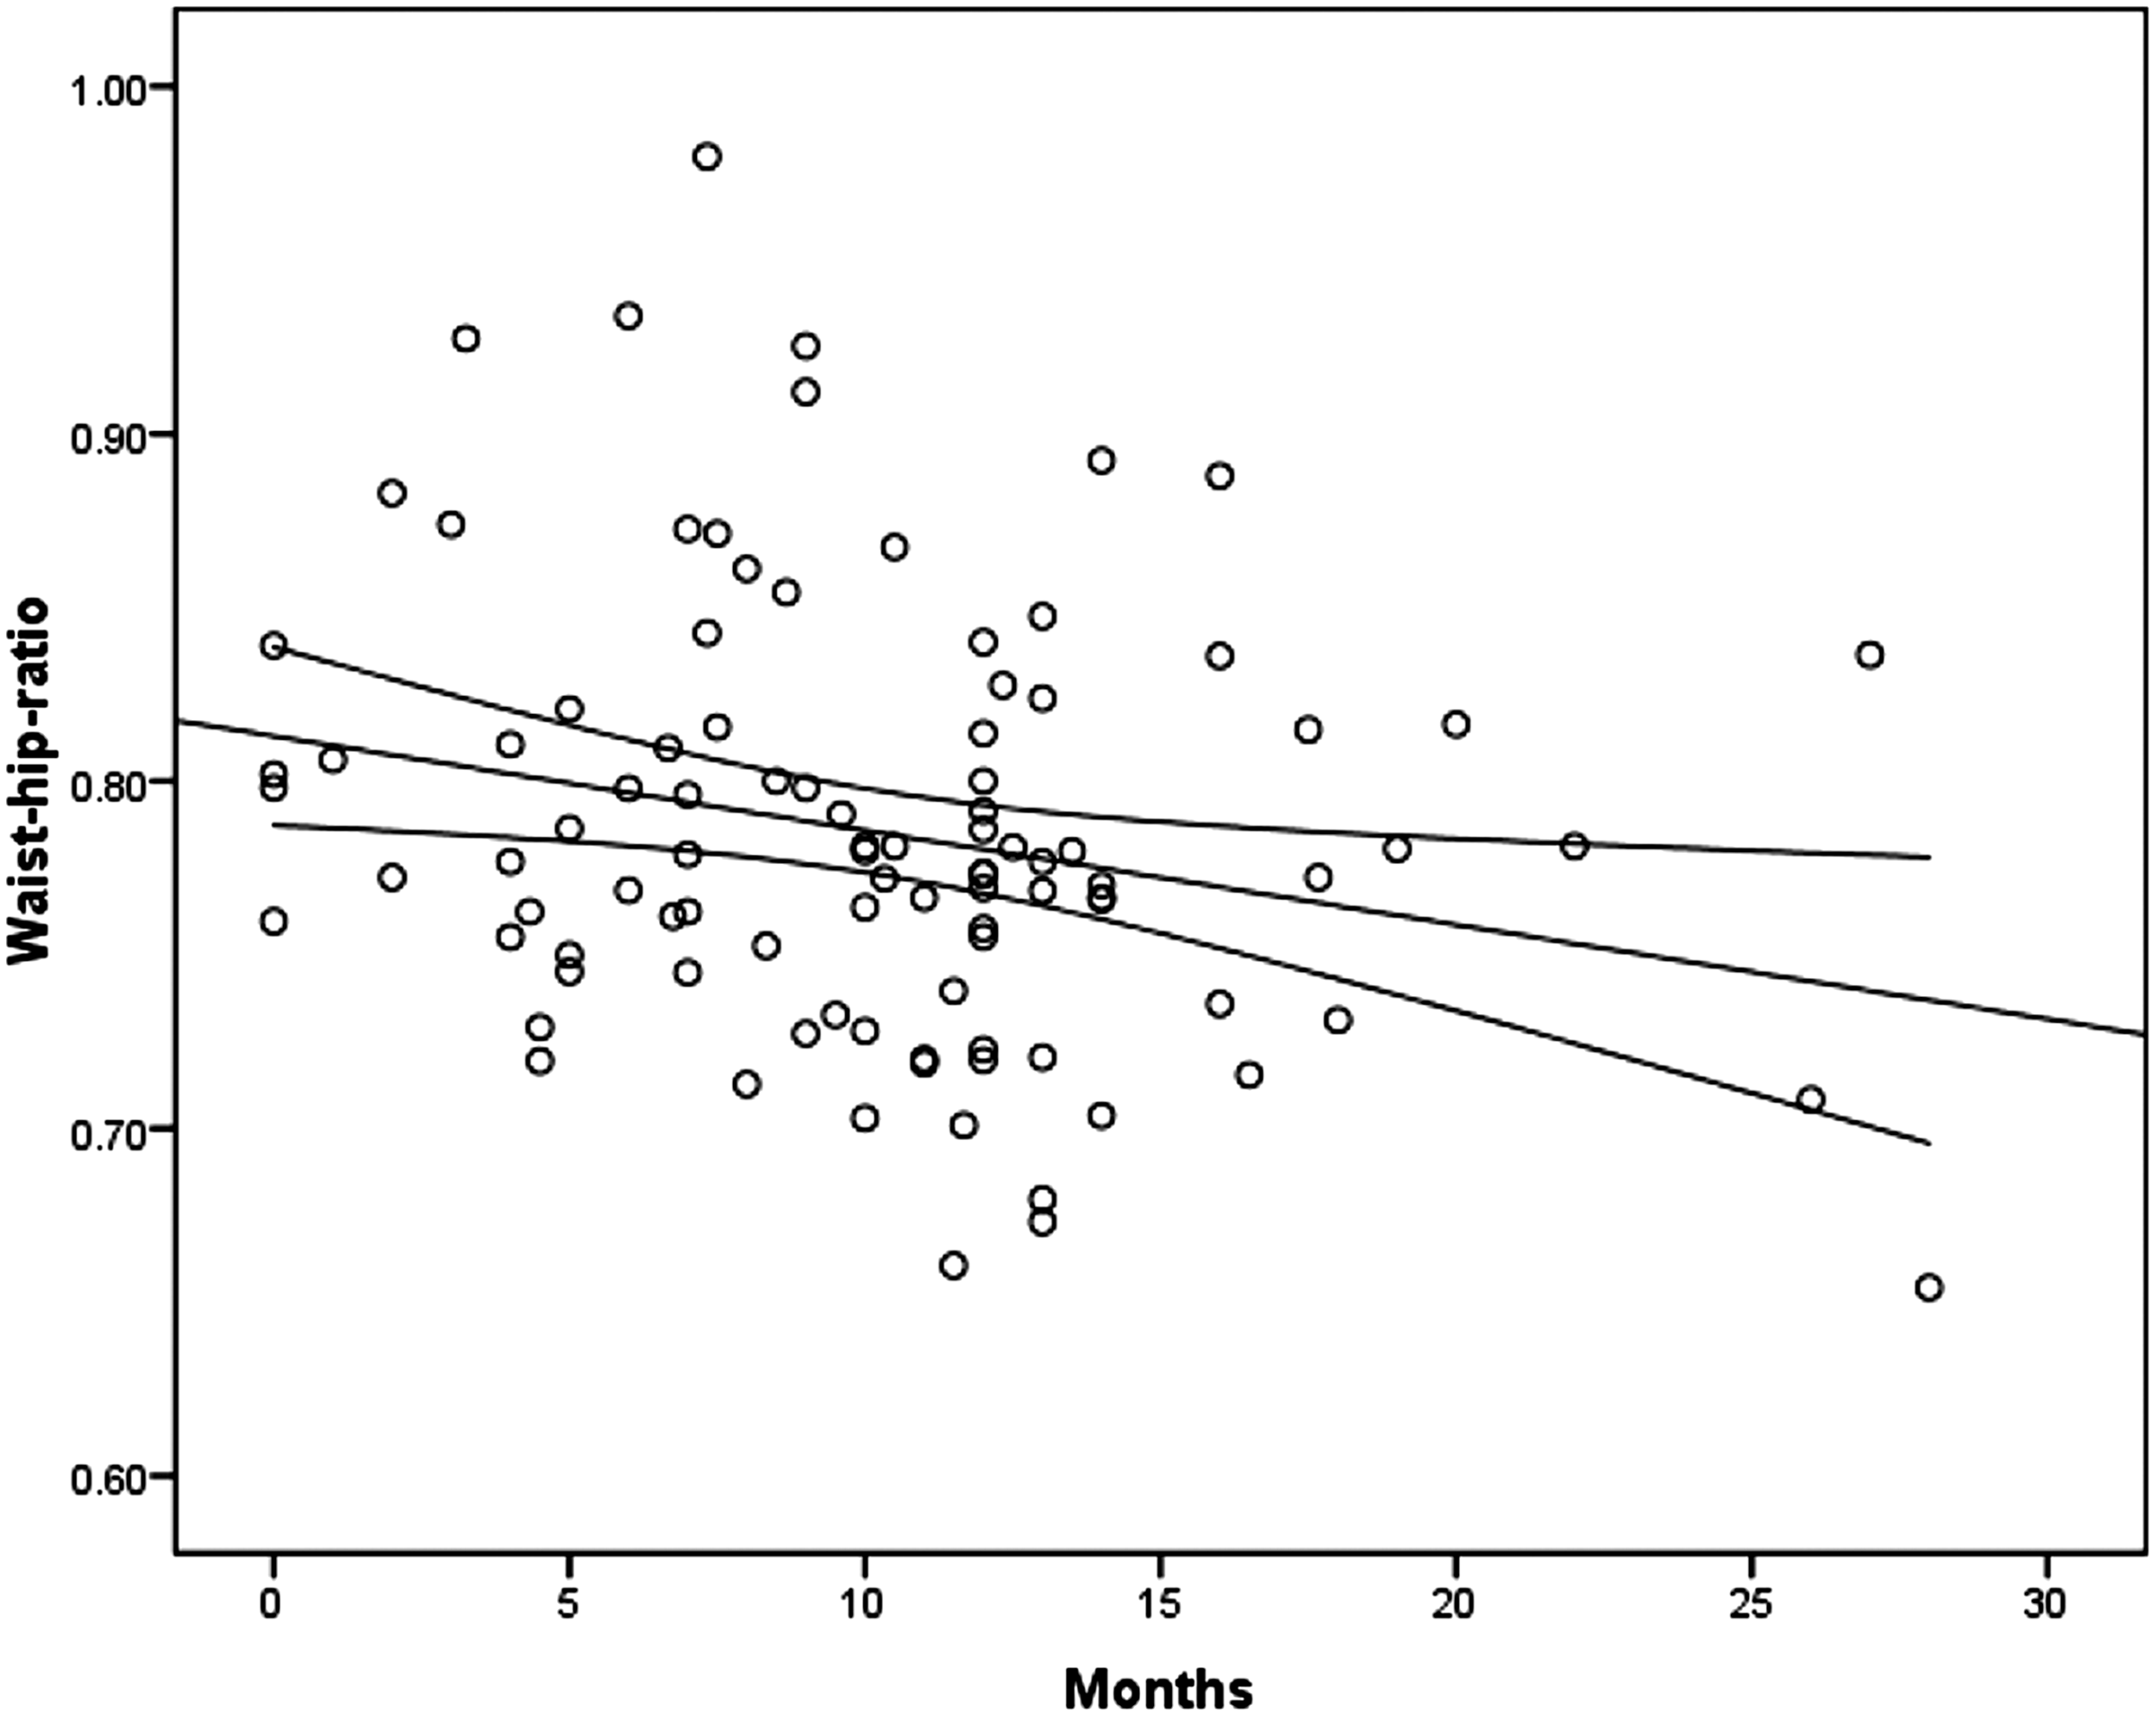
Regression line of waist-to-hip ratio and average length of lactation per child (months).
Diastolic blood pressure was positively associated and fasting S-triglyceride inversely associated with average length of lactation per child in age-adjusted models (Table 3). However, when several factors that may have confounded the association (physical activity, time since last birth, tobacco use, length of education, and marital status) were simultaneously included in the regression model, no significant associations were seen (Table 3). WHR was inversely associated with average length of lactation per child in the age-adjusted model: by each month of increase in lactation WHR fell 0.003 units (Table 4). The estimated change (β) for WHR was practically the same after adjusting for physical activity, time since last birth, tobacco use, length of education, and marital status (β=–0.003, 95% confidence interval=–0.006 to −0.001, p=0.008). Average length of lactation per child was not a statistically significant predictor of any of the other clinical or anthropometric measures in the age-adjusted or multivariable models (Table 4).
Adjusted for age, physical activity, time since last birth, tobacco use, length of education, and marital status.
Blood sampling first visit (days 1–5 of the menstrual cycle).
To convert values for glucose to mg/dL, multiply by 18.0182.
To convert values for triglyceride to mg/dL, multiply by 88.57396.
To convert values for cholesterol or high-density lipoprotein (HDL) cholesterol to mg/dL, multiply by 38.66976.
CI, confidence interval; fS, fasting serum.
Adjusted for age, physical activity, time since last birth, tobacco use, length of education and marital status.
BMI, body mass index; CI, confidence interval; DEXA, dual-energy X-ray absorptiometry; WHR, waist-to-hip ratio.
We also performed linear regression models using total duration of breastfeeding per woman as independent variable. Diastolic blood pressure was associated with total duration of breastfeeding, both in the age-adjusted model (β=0.172, 95% confidence interval=0.033–0.312, p=0.02) and in the multivariable model (β=0.169, 95% confidence interval=0.020–0.317, p=0.03). However, when adjusting for number of children in addition to age, physical activity, time since last birth, tobacco use, length of education, and marital status, the association disappeared (β=0.162, 95% confidence interval=–0.029 to 0.353, p=0.1). There was no significant associations for any of the other clinical measures (systolic blood pressure, fasting S-glucose, fasting S-triglyceride, fasting S-HDL cholesterol, or fasting S-cholesterol) and total duration of breastfeeding (data not shown).
As for the anthropometric measures (BMI, waist circumference, WHR, and DEXA total fat), there were no significant associations with total duration of breastfeeding either in the age-adjusted models or in the multivariable model (data not shown). Yet, when adjusting for number of children in addition to age, physical activity, time since last birth, tobacco use, length of education, and marital status, there was a borderline significant inverse association between total duration of breastfeeding and waist circumference (in cm) (β=–0.229, 95% confidence interval=–0.456 to −0.001, p=0.049) and WHR (β=–0.002, 95% confidence interval=–0.003 to −0.0000, p=0.012).
Discussion
Our findings suggest that longer average length of lactation per child may be associated with healthier metabolic profile and body composition, especially WHR. Moreover, we found that women who on average lactated for less than 10 months per child had slightly, but significantly, higher levels of fasting glucose, triglycerides, and cholesterol. Similar results have recently been reported by others, as increased duration of lactation was associated with a lower prevalence of hypertension, diabetes, hyperlipidemia, and cardiovascular disease among women.4,21–24
Lactation may have long-term metabolic effects, and an inverse association has been seen between longer duration of lactation and lower incidence of the metabolic syndrome years after weaning.23,24 Lactation has also been associated with the percentage of body fat as assessed by skin fold thickness13,25 and bioimpedance. 13 Other studies have found that mothers who lactate for a longer period have a larger reduction in hip circumference than those who lactate for a shorter period. 12 Some studies have shown that women who lactate have a faster return to their prepregnant weight. 26 The greatest weight loss has been observed during the first 12 months after giving birth, with weight retention for 16 months. 25
One explanation may be that lactation may attenuate unfavorable changes in metabolic risk factors that occur during pregnancy, and it has been hypothesized that the protective effects of lactation may derive from its energetic demands 9 and with effects apparent after weaning. Lactation may therefore affect women's future risk of cardiovascular and metabolic diseases, 27 even several years after cessation of lactation.
Although most studies show favorable effects of prolonged lactation, there is still conflicting evidence as to whether it may decrease the risk of maternal overweight/obesity, and some studies find no such association. 14 The conflicting results may be due to differences in methodology. Dewey 11 found that only one of six observational studies in which postpartum weight change was estimated (rather than measured directly) showed an association with lactation; in contrast, six of the seven studies where weight was measured directly found greater body weight loss or fat loss in women who lactated for longer periods.
Thus far, most studies looking at this question have been restricted to the first months after delivery. In our study we examined the associations on average 4.7 years after last delivery. Gigante et al. 13 also investigated the effect of lactation on maternal anthropometric measurements approximately 5 years after delivery; they found an inverse association between lactation and waist circumference, supporting the results in our study.
Another issue is whether a favorable effect of duration of lactation on maternal metabolic profile and anthropometric measures acts in a dose–response manner, or whether the effect is already taken out after a short period of lactation. In the present study the average duration of lactation per child was 10.3 months, and in the stratified analysis women who lactated for as long as 9.9 months were included in the “short” duration strata. The fact that the favorable associations seen with longer duration of lactation in our study were less strong than in several other studies10,27 may be influenced by the overall long duration of lactation in our study.
The observation that lower rates of lactation in women are associated with obesity may be explained by a variety of mechanisms. The reasons may be biological, or they may be psychological, behavioral, and/or cultural. 28 Some have linked this to physiological causes, such as a lower prolactin response 29 and a delayed lactogenesis (“milk coming out”), 30 which are expected to compromise the ability to produce milk and over time could lead to premature cessation of lactation. 29 Furthermore, obese women are more likely to belong to subgroups of women with lower rates of lactation than normal-weight women. Such subgroups can be of lower socioeconomic status 31 or groups with more frequent depression. 32 In our study, we observed a positive association between length of lactation and years of education.
Moreover, we also observed that longer lactation was associated with a slightly higher energy intake, a significantly higher intake of protein and fiber, and a higher level of physical activity. Lactation imposes a metabolic burden on mothers, with an increased energy requirement of approximately 2 MJ/day. 33 In Norway the recommendations for energy intake among lactating women are therefore a surplus of 2 MJ/day. It was, however, surprising that the women who had breastfed for the longest period had on average 0.7 MJ higher energy intake per day even several years after finishing lactation (range, 0.7–13.9 years). The concentration of leptin (a hormone involved in energy regulation and metabolism) in breastmilk decreases with time during lactation and shows significant relationships with those of other maternal hormones. 34
Our study has several advantages. There was no interobserver error because the same trained nurse traced all the participants throughout the study and took all anthropometric measurements. All the women met in the same clinical research department at the same time during the menstrual cycle. They were all answering a questionnaire and interviewed using a lifetime calendar in order to improve the quality of the data. The multiple different measurements of adiposity/obesity (weight, waist circumference, WHR, and DEXA total fat) all correlated significantly with BMI (all p<0.01). The studied population was homogeneous with regard to ethnicity and cultural background. However, cross-sectional studies are limited by the facts that they are carried out at one time point and that they give no indication of the sequence of events and cannot address potential confounding by prepregnancy factors. Also, as the number of parous women in our study is limited, the study lacks statistical power to examine associations for a wider range of lactation length strata (e.g., no lactation vs. years of lactation). Length of lactation was statistically significant associated with a healthier metabolic profile and body composition. Thus, our findings support the hypothesis that lactation may play a role for mothers who have given birth to develop a healthier metabolic profile. However, our study is small and underlines the need for larger prospective studies in order to clarify another potential important and positive role of breastfeeding in preventive medicine.
Conclusions
This study has shown that in a group of premenopausal women in Norway, women with an average lactation length of 10 months or more per child had a more favorable metabolic profile with significantly lower levels of glucose, triglyceride, and cholesterol than women who lactated for less than 10 months. The women with lactation length for 10 months or more per child also had a significantly lower WHR and waist circumference, despite the fact that they had a higher energy intake. The inverse association between length of lactation and WHR remained statistically significant even after controlling for several potential confounders.
Footnotes
Acknowledgments
We gratefully acknowledge the participants in the EBBAI-study and give special thanks to Gunn Knudsen, Heidi Jakobsen, Anna Kirsti Jensen, and Sissel Andersen for professional assistance and the Clinical Research Department, University Hospital, Tromsø, Norway, for the skilled and always professional setting.
Disclosure Statement
No competing financial interests exist.