
Abstract
Abstract
Objective:
We sought to determine the impact of changes in breastfeeding rates on population health.
Materials and Methods:
We used a Monte Carlo simulation model to estimate the population-level changes in disease burden associated with marginal changes in rates of any breastfeeding at each month from birth to 12 months of life, and in rates of exclusive breastfeeding from birth to 6 months of life. We used these marginal estimates to construct an interactive online calculator (available at www.usbreastfeeding.org/saving-calc). The Institutional Review Board of the Cambridge Health Alliance exempted the study.
Results:
Using our interactive online calculator, we found that a 5% point increase in breastfeeding rates was associated with statistically significant differences in child infectious morbidity for the U.S. population, including otitis media (101,952 cases, 95% confidence interval [CI] 77,929–131,894 cases) and gastrointestinal infection (236,073 cases, 95% CI 190,643–290,278 cases). Associated medical cost differences were $31,784,763 (95% CI $24,295,235–$41,119,548) for otitis media and $12,588,848 ($10,166,203–$15,479,352) for gastrointestinal infection. The state-level impact of attaining Healthy People 2020 goals varied by population size and current breastfeeding rates.
Conclusion:
Modest increases in breastfeeding rates substantially impact healthcare costs in the first year of life.
Introduction
B
Estimating the impact of changes in breastfeeding on health outcomes is complex, because associations vary for different health conditions, depending on the prevalence of the disease and the dose of breastfeeding associated with a change in disease risk. Our group previously used a Monte Carlo simulation model to estimate the population-level changes in disease burden associated with a change from current, 2012 breastfeeding rates to optimal breastfeeding. 2 Recognizing that ∼10% of mothers and infants are not able to breastfeed, 3 optimal breastfeeding was defined as 90% of women exclusively breastfeeding each of her children for 6 months and continuing to breastfeed for 12 months, as recommended by major U.S. medical organizations.4–6 We found that, across the lifetime of a cohort of women born in a single year, a change from current to optimal breastfeeding would prevent 2,619 maternal deaths (95% confidence interval [CI] 1,978–3,259) and 721 child deaths (543–899). 2 Given a steady-state population, these results approximate the annual impact of 90% optimal breastfeeding for the population as a whole.
Although 90% optimal breastfeeding is a worthy goal, existing interventions have produced more modest changes in breastfeeding rates.7,8 We therefore sought to develop an approach to estimate the impact of smaller changes in breastfeeding rates, and to estimate impact within an individual state in the United States. Using the same Monte Carlo simulation model, we calculated the marginal effect of a 10% absolute change in any breastfeeding at each month from 0 to 12 months postpartum, and in exclusive breastfeeding at each month from 0 to 6 months postpartum. We used these data to create an online calculator, which allows users to estimate the impact of a change in breastfeeding rates on disease rates as well as medical costs and societal costs due to premature death in a population of women and their children.
Materials and Methods
The methods for our Monte Carlo simulation have previously been described in detail. 2 Briefly, we modeled health outcomes for a cohort of women who were aged 15 in 2002 and their children. Women were modeled through age 70, and their offspring were modeled through age 20. We used population birth rates for 2012 to model number of births for each modeled woman across her lifetime. We considered health outcomes for which there are consistent data supporting a protective association with breastfeeding. For children, we modeled acute lymphoblastic leukemia, 9 acute otitis media, 10 Crohn's disease and ulcerative colitis,11–13 gastrointestinal infection, 14 lower respiratory tract infection requiring hospitalization, 10 necrotizing enterocolitis (NEC), 15 sudden infant death syndrome, 16 and, for non-Hispanic White (NHW) children, childhood obesity. 17 For mothers, we modeled premenopausal ovarian cancer, 18 breast cancer, 19 diabetes, 20 hypertension, 21 and myocardial infarction. 22
We sought to calculate the population health impact of a given change absolute rates of any breastfeeding from birth through 12 months, and in exclusive breastfeeding from birth through 6 months. We assumed that the health impact of a change in breastfeeding rates would be additive; for example, an absolute increase in exclusive breastfeeding rates at 6 months from 20% to 25%—a 5% absolute difference—would have half the impact of an absolute increase in exclusive breastfeeding rates at 6 months from 20% to 30%—a 10% absolute difference. To estimate the impact of an absolute difference in exclusive and/or total breastfeeding rates at a given month, we ran separate models, varying each by the breastfeeding rate at a single time point.
For example, in model A, we simulated a rate of any breastfeeding of 90% from 0 to 12 months postpartum, and a rate of exclusive breastfeeding of 80% from 0 to 6 months postpartum. In model B, breastfeeding rates were identical to model A, except that we simulated an exclusive breastfeeding rate at 6 months of 70%. Thus, the difference in disease burden between model A and model B approximated the effect of a 10% change in exclusive breastfeeding at 6 months, holding all else constant. To calculate the effect of a 10% change at each of the 20 time points, 0–12 months for any breastfeeding and 0–6 months for exclusive breastfeeding, we modeled outcomes under 21 different breastfeeding rates (Appendix Table A1).
For each of the 21 models, we performed 5,000 replications, modeling 100,000 women per replication. We chose a smaller number of replications than used in our previous work 2 to allow for greater uncertainty given that the calculator would be used to predict changes for smaller populations (e.g., individual states, communities). As associations between breastfeeding and disease outcomes in the literature are estimates, we drew key parameters at random from triangular distributions covering the range of estimates available in the literature associating breastfeeding with maternal and pediatric disease outcomes, centered on the point estimate provided in the literature and a distribution width related to the standard error or CI reported in the literature.
We analyzed variability in the diseases over this population; this analysis represents a form of probabilistic sensitivity analysis. To calculate CIs for maternal and childhood diseases, we randomly grouped the replications into batches of 20, representing 2 million women to approximate the 1.994 million women aged 15 in 2002, and then identified the 2.5% and 97.5% for each outcome.
We used the results of these 21 models to calculate the effect of a change in breastfeeding rates as described earlier. This process was repeated for 13 time points for any breastfeeding (month 0 through month 12) and for 7 time points for exclusive breastfeeding (month 0 through month 6). CIs for differences were added in quadrature, for example, the upper confidence interval (UCI) for Model B to Model A = (UCIA2 + UCIB2)1/2. Thus, for each disease outcome, we calculated a total of 20 marginal effect estimates, with upper and lower confidence limits (Appendix Table A2).
Using these marginal effects, we constructed a calculator to estimate the effect of changes in breastfeeding rates across the first year of life. For current rates, we used national- and state-level data 23 for breastfeeding initiation, exclusive breastfeeding at 2 days, 3 months, and 6 months, and any breastfeeding at 6 and 12 months (Appendix Tables A3 and A4); users entered “future” rates at the same time points. These data were used to interpolate differences in breastfeeding rates at each of the 20 time points modeled. For each disease, the difference in breastfeeding rate at each time point was multiplied by marginal effect estimate at that time point, and these values were summed. CIs were calculated by summing CIs for each time point in quadrature.
Finally, the summed estimate of change in disease outcomes was weighted by the population of interest. For the United States, after our prior study, 2 we used the total population of women who were aged 15 in 2002, 1,994,060, and a total of 3,952,841 births over their lifetime. For the outcome of NEC, we modeled a total of 56,252 very low birth weight (VLBW) births. For the outcome of childhood obesity, we used the number of NHW women in 2002, which was 1,259,336.
To estimate the effect of changes in breastfeeding rates for each of the 50 states in the United States, we used census data to determine the population of 15-year-old women in each state in 2002, and we used 2012 vital statistics data to determine the number of overall births and the number of VLBW births in each state (Appendix Table A5). Detailed data on births by maternal age are not available for each state; therefore, our models use national data to estimate age at each birth and cumulative lifetime parity. For each state, we weighted results by the ratio of the number of births in that state in 2012 to the state population of women who were aged 15 in 2002.
We similarly weighted NEC by the ratio of the number of VLBW births in that state to the number of women who were aged 15 in 2002. Of note, because state-level breastfeeding rates for VLBW infants are not available, we assumed that, under current conditions, VLBW infants were breastfed at the same rate as term infants in the same state. For child obesity, we weighted results by the ratio of state NHW births in 2012 per 15-year-old NHW women in 2002 to the national number of NHW births in 2012 per 15-year-old NHW women in 2002. All ratios used appear in Appendix Table A5.
Costs were calculated by multiplying number of cases and deaths for each disease by the average cost per case over the cohort's lifetime, estimated in our previous paper (Appendix Table A6). Deaths and costs were summed, with CIs summed in quadrature, to estimate total direct and indirect medical costs, total non-medical costs, and societal costs due to premature death. To validate this approach, we compared results by using our marginal model to results previously published by our group from two sets of Monte Carlo simulations, one under suboptimal conditions, using breastfeeding rates from 2012, and one under optimal conditions, defined as 90% of women achieving exclusive breastfeeding for 6 months. Next, we used our marginal model approach to estimate the impact on disease burden of (1) a 5% increase in breastfeeding rates at each time point, for national disease burden; and (2) achieving Healthy People 2020 (HP 2020) goals for national- and state-level disease burden.
To allow others to calculate differences in health outcomes by state and change in breastfeeding rates, we deployed the calculator as a Javascript-based interactive tool, which is publically available at www.usbreastfeeding.org/saving-calc. The Institutional Review Board of the Cambridge Health Alliance exempted the study.
Results
Using the techniques described, we estimated the marginal impact on cases and costs of a 10% change in breastfeeding rates for each of five maternal and nine child diseases. We found marked effects on particular time points, reflecting that the literature on which our model is based uses cut points for breastfeeding duration (Figs. 1 and 2). For example, for otitis media, exclusive breastfeeding for >3 months is associated with an odds ratio of 0.5 (95% CI 0.36–0.70). Thus, a 10% change in exclusive breastfeeding at 3 months is associated with a difference of 5,423.41 cases per 100,000 mothers, whereas a 10% change in exclusive breastfeeding at 4 months is not associated with a meaningful difference.
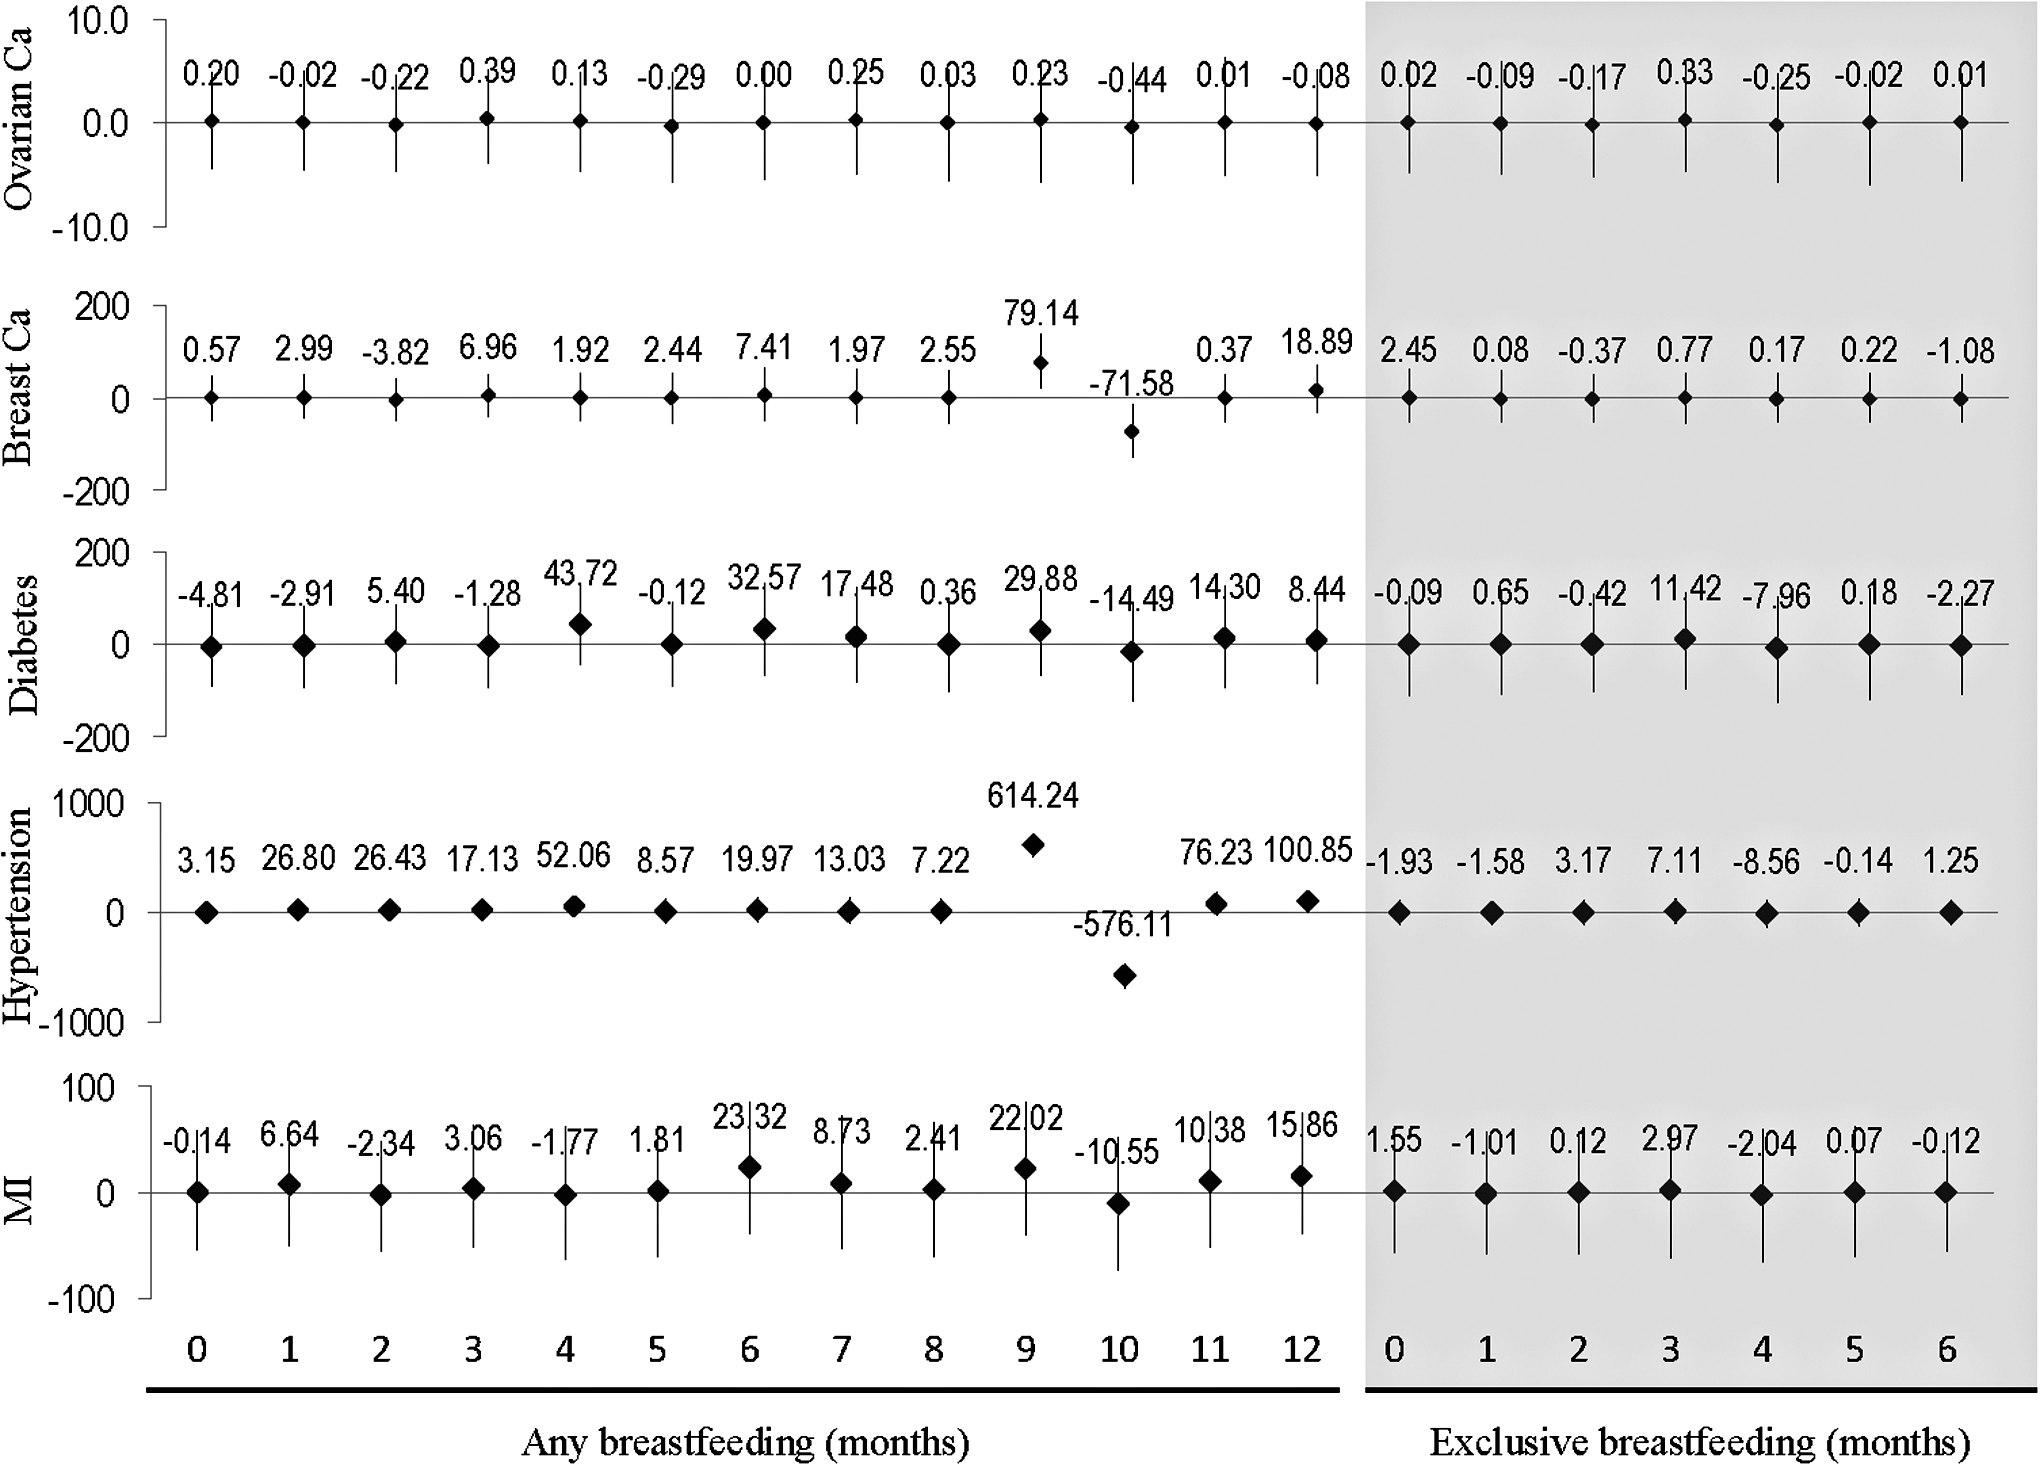
Maternal outcomes, difference, 95% CI for change number of cases per 100,000 mothers for a 10% absolute change in any breastfeeding, months 0–12, and exclusive breastfeeding, months 0–6 shaded. CI, confidence interval.
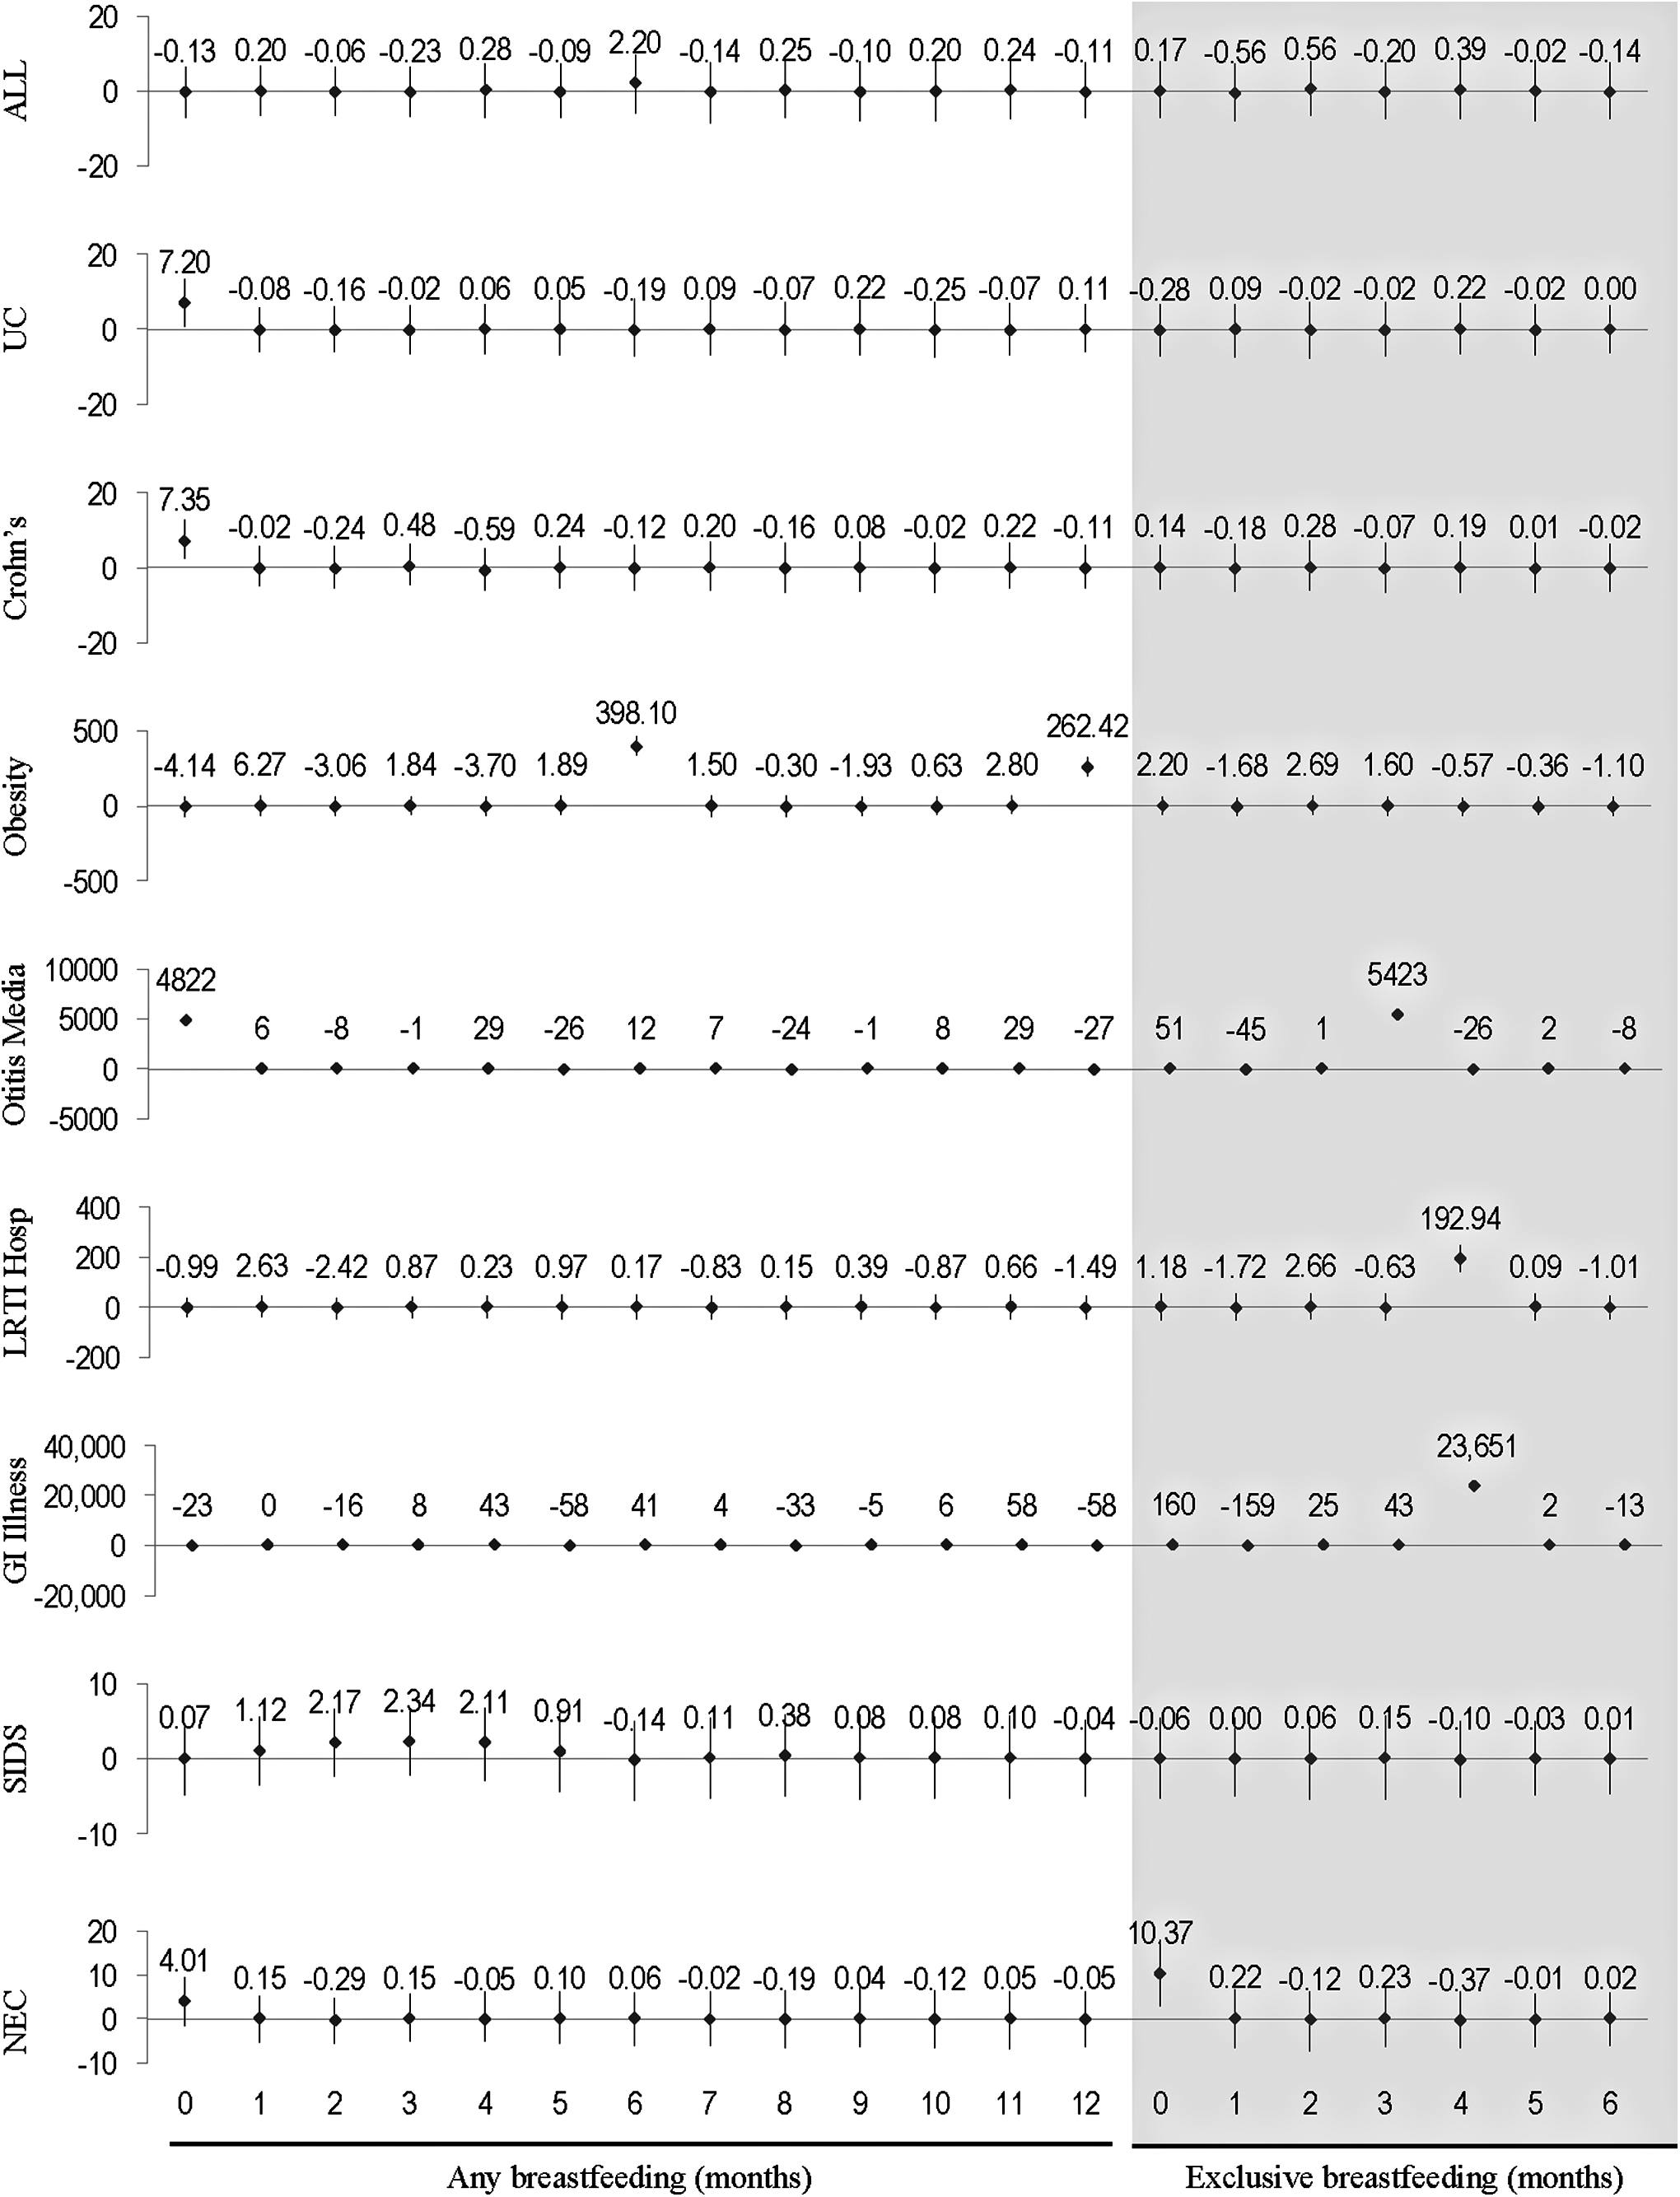
Child outcomes, difference, 95% CI for change number of cases per 100,000 mothers for a 10% absolute change in any breastfeeding, months 0–12, and exclusive breastfeeding, months 0–6 shaded.
When we compared results from our calculated model with our previously published Monte Carlo simulation model (Table 1), we found that our effect estimates were very similar for common conditions, such as otitis media and gastrointestinal illness, although CIs were wider. For less common conditions (e.g., Crohn's/ulcerative colitis and sudden infant death syndrome), differences were more pronounced, and for ovarian cancer, which was not statistically significant in our previously published models, results were markedly different, reflecting the instability of these effect estimates. NEC disease burden was markedly lower in our calculated model, because we used population-level data for baseline breastfeeding rates, rather than VLBW-specific breastfeeding rates.
CI, confidence interval; NHW, non-Hispanic White; OC, ovarian cancer.
We found that a 5% point increase in national breastfeeding rates at all time points (Table 2) was associated with statistically significant differences in child infectious morbidity, including otitis media (101,952 cases, 95% CI 77,929–131,894 cases) and gastrointestinal infection (236,073 cases, 95% CI 190,643–290,278 cases). Associated medical cost differences were $31,784,763 (95% CI $24,295,235–$41,119,548) for otitis media and $12,588,848 ($10,166,203–$15,479,352) for gastrointestinal infection. A 5% absolute increase in breastfeeding was also associated with a reduction in child obesity (4,188 cases, 95% CI 379–7,659). For differences in maternal health outcomes and less common child outcomes, CIs were wide.
When we considered the national impact of achieving HP 2020 goals, we similarly found statistically significant differences in otitis media (49,642 cases, 95% CI 25,619 – 79,584) gastrointestinal infection (148,362 cases, 95% CI 102,931, 202,566), and obesity (6,266 cases, 95% CI 2,457 – 9,737). For state-level analyses, the impact of attaining HP 2020 goals varied, depending on population size, birth rate, and current breastfeeding rates. For Mississippi, which had the lowest breastfeeding initiation rate in the United States in 2012, achieving HP 2020 goals was associated with a statistically significant difference in maternal hypertension (236 cases, 95% CI 146–339) and diabetes (83 cases, 95% CI 1–177), and with total maternal direct and indirect medical costs of $15,216,972 (95% CI $5,812,423–$26,022,813).
For child outcomes in Mississippi, achieving HP 2020 goals was associated with differences in otitis media (4,742 cases, 95% CI 4,506–5,035), gastrointestinal infection (9,550 cases, 95% CI 9,105–10,081 cases), and hospitalization for lower respiratory tract infection (78 cases, 95% CI 46–120 cases). Achieving HP 2020 goals would also avert 10 cases of NEC (95% CI 3–18 cases) and 224 cases of child obesity (95% CI 188–257). Child medical costs averted totaled $3,607,151 (95% CI $2,698,500–$4,614,066). Finally, achieving HP 2020 goals in Mississippi would avert seven child deaths (95% CI 1–14) with societal savings of $69,461,935 (95% CI $14,646,198–130,408,942).
By contrast, Washington had the highest rate of breastfeeding initiation in 2012, at 93.6%, and it exceeds HP 2020 goals on every metric. As a result, if rates were to fall to HP 2020 target levels in Washington, disease burden would increase, with 4,132 excess otitis media cases (95% CI 3,471–4,662) and 4,800 excess gastrointestinal infections (95% CI 3,603–5,803). Point estimates for all other conditions indicated a higher disease burden with HP 2020 breastfeeding rates, but CIs were wide.
Discussion
We used a Monte Carlo simulation to estimate the change in disease rates associated with changes in rates of any and exclusive breastfeeding; we used these results to create a calculator to estimate the effects of changes in breastfeeding on population health. Our results suggest that even modest increases in breastfeeding rates are associated with changes in disease burden and costs, particularly for childhood otitis media and gastrointestinal infections, which are common and for which breastfeeding is associated with a marked reduction in risk.
Evidence suggests that the 5% difference in breastfeeding rates modeled can be achieved with individual-level interventions to support healthy breastfeeding mothers with healthy babies. 24 In a recent Cochrane review of 52 studies among 56,451 mother-infant pairs from 21 countries, Renfrew et al. 7 found that breastfeeding support increased rates of any breastfeeding at 6 months from 45% to 49%, and exclusive breastfeeding at 6 months from 17% to 26%. Patnode et al. 25 similarly systematically reviewed interventions to support breastfeeding, finding that interventions increased rates of exclusive breastfeeding at 6 months, Relative Risk (RR) 1.16 (95% CI, 1.02–1.32), with absolute differences ranging from a decrease of 2.9% to an increase of 21%.
Further, there is evidence that systems-level factors, such as maternity care practices, 26 formula marketing, 27 and the composition of the Women, Infants and Children food package, 28 affect the likelihood that mother-infant dyads will be able to breastfeed exclusively. We estimated that a 5% absolute increase in breastfeeding rates would save $31,784,763 in otitis media medical costs (95% CI $24,295,235–$41,119,548) and $12,588,848 in gastrointestinal infection costs (95% CI $10,166,203–$15,479,352), suggesting that investing in existing strategies is cost effective.
Our modeling approach has several important limitations. To generate marginal effect estimates, we performed 5,000 replications of 100,000 women per replication, half the number of replications in our prior work. The higher the number of replications, the greater the precision of estimates, and the narrower the CI around each marginal effect. For rare outcomes, in particular, running 5,000, rather than 10,000, replications resulted in larger CIs. Given the smaller size of state populations, these wider CIs for rare outcomes are more conservative and likely appropriate.
Further, the Monte Carlo simulation models a cohort of women who were aged 15 in 2002 across their lifetimes, assuming a steady-state population. In some regions, it is common for young adults to relocate away from their state of birth after age 15; in other regions, large numbers of reproductive-aged women move into a state after age 15. These population shifts likely drive differences in the ratio of births per year to the number of women aged 15 in 2002. Nationally, the ratio is 1.88; whereas in the District of Columbia, the ratio is 3.60, and in New Hampshire, it is 1.35. We used these ratios to weight the number of child cases in our simulation results; however, our estimates for maternal disease burden did not account for migration of women into or out of a state.
We also used national birth rate data to model the timing of births for cohort participants. Birth timing affects costs, because child health costs are discounted, and the later in life a birth occurs, the greater the discounting of costs for that child. In states where women tend to give birth at younger ages than the national average, our model, therefore, overestimates cost; whereas in states where women tend to give birth at older ages than the national average, our model underestimates cost.
Our estimates of cases and costs for NEC were limited by lack of state-level data on breastfeeding rates among VLBW infants. In our prior publications,2,15 we used data from Rush Hospital to estimate breastfeeding rates for VLBW infants. At 36 weeks post-menstrual age, 24% of infants at Rush receive exclusive human milk. National rates of exclusive breastfeeding at 3 months are 43.3%, with state rates ranging from 23% to 56%. In the absence of any information on the extent to which state breastfeeding rates are correlated with breastfeeding rates for VLBW infants, we did not model different breastfeeding rates for VLBW infants in our calculator. To the extent that overall breastfeeding rates are higher than VLBW rates, modeled differences between current and future rates would be smaller, and our calculator model likely underestimates reductions in NEC that are attributable to achieving a given breastfeeding rate.
Conclusion
We created a web-based calculator to estimate the expected impact of changes in breastfeeding rates on population health outcomes for each of the 50 U.S. states. This tool allows policy makers and healthcare payers to estimate the impact of changes in breastfeeding rates on maternal and child health and healthcare costs, subject to the limitations in our modeling approach described earlier. Our results suggest that even a 5% increase in breastfeeding rates could substantially impact disease burden for otitis media and gastrointestinal infection in the first year of life, with savings of more than $44,000,000 in direct medical costs for these two conditions alone. This tool can inform policymakers about the expected return on investments to enable more women to achieve their infant feeding goals.
Footnotes
Acknowledgment
This research was funded by the W.K. Kellogg Foundation. The funder had no role in the study design or article preparation.
Disclosure Statement
No competing financial interests exist.
Appendix
| Disease | 2% Discount direct medical ($) | 2% Discount indirect medical ($) | 2% Discount total medical ($) | 2% Discount indirect non-medical ($) | 2% Discount death ($) |
|---|---|---|---|---|---|
| Pre-menopausal ovarian cancer | 96,543.61 | 17,037.10 | 113,580.72 | 26,009.99 | 4,864,140.94 |
| Breast cancer | 20,065.27 | 3,540.93 | 23,606.19 | 5,405.82 | 2,818,223.32 |
| Hypertension | 6,963.97 | 1,228.92 | 8,192.90 | 1,076.72 | 2,619,232.48 |
| Diabetes | 83,265.99 | 14,694.00 | 97,959.99 | 25,879.49 | 3,178,292.58 |
| Myocardial infarction | 79,823.00 | 14,086.44 | 93,909.44 | 4,303.99 | 2,399,441.00 |
| Acute lymphoblastic leukemia | 125,040.33 | 18,756.05 | 143,796.38 | 10,428.85 | 7,677,080.96 |
| Crohn's disease | 8,364.97 | 1,476.17 | 9,841.14 | 170.12 | |
| Ulcerative colitis | 6,214.07 | 1,096.60 | 7,310.67 | 460.06 | |
| Sudden infant death syndrome | 9,886,863.68 | ||||
| Otitis media | 265.00 | 46.76 | 311.76 | 170.16 | |
| Gastrointestinal illness | 48.92 | 4.40 | 53.33 | 272.18 | |
| Obesity (NHW only) | 2,481.16 | 437.85 | 2,919.02 | 235.47 | |
| Lower respiratory tract infection requiring hospitalization | 4,613.64 | 814.17 | 5,427.81 | 961.81 | 9,895,677.23 |
| Necrotizing enterocolitis | 20,883.35 | 3,257.94 | 24,141.29 | 477.11 | 9,936,233.24 |