
Abstract
Objectives:
This study aimed to explore the associations of growth and body composition with gut microbiome and metabolome in preterm infants.
Materials and Methods:
A prospective cohort study including 73 human milk-fed very preterm infants was conducted. During hospitalization, fecal samples were collected to detect microbes and metabolites using 16S rRNA gene sequencing and liquid chromatography-mass spectrometry. Growth and body composition indices were measured at term equivalent age (TEA) and 6 months of corrected age (CA). Associations of the fecal microbiome and metabolome profiles with growth and body composition indices, as well as their changes, were analyzed.
Results:
A higher abundance of Streptococcus was associated with a lower fat-free mass (FFM) z-score at 6 months of CA (p = 0.002) and a smaller increase in FFM z-score from TEA to 6 months of CA (p = 0.018). Higher levels of 3′-sialyllactose and 6′-sialyllactose (6′-SL) in feces were correlated with a lower z-score of percentage body fat (PBF) (p = 0.018 and 0.020, respectively) and a lower z-score of fat mass (p = 0.044 and 0.043, respectively) at 6 months of CA. A higher level of 6′-SL in feces was correlated with a greater increase in FFM z-score from TEA to 6 months of CA (p = 0.021).
Conclusions:
This study sheds light on the role of specific microbial-host interactions in metabolic changes in preterm infants, indicating the potential role of sialylated human milk oligosaccharides in optimizing body composition.
Introduction
In recent decades, advancements in perinatal and neonatal medicine have significantly improved the survival rates of preterm infants. 1 Nevertheless, these infants, especially very preterm (VPT) or extremely preterm infants, still face a higher risk of metabolic diseases such as obesity, type II diabetes, and cardiovascular diseases than their full-term counterparts. 2 Previously, our research team focused on body composition in VPT infants and pioneered the disclosure of the body composition distribution of VPT infants in the Chinese population, which demonstrated higher fat mass (FM) and percentage body fat (PBF) and lower fat-free mass (FFM) at term relative to full-term infants. 3 A deficit in early-life FFM gains in preterm infants is substantially linked to poorer neurodevelopmental prognosis, 4 and it is reported that neonatal adiposity is associated with a higher risk of childhood obesity. 5 Studies on factors influencing body composition have drawn imprecise conclusions. However, feeding patterns, 6 nutritional intake, and human milk components are all potential contributors. 7
Gut microbes and metabolites have long been recognized for their influence on energy regulation and metabolism, 8 albeit with sparse precise evidence within the preterm population. Colonization of gut microbes affects the energy harvesting capacity and fat storage. 9 Variations in microbial profiles have been consistently reported in adults with metabolic disorders such as obesity and type II diabetes. 10 In infants, the early gut microbiome composition is involved in the regulation of long-term body mass index (BMI) and the incidence of obesity. 11 The distribution of gut microbes in VPT infants remains incompletely understood owing to significant individual differences and various destabilizing influences. Studies exploring the relationship between gut microbial distribution and body composition are limited. Fecal metabolites serve as signaling molecules and substrates for metabolic reactions that may reflect and influence host physiological functions. 12 However, their role in VPT infants has seldom been investigated. Understanding the intricate interplay between the gut microbiomes, metabolites, and host intestinal cells is essential to grasp the impact of the gut microbiome on host energy metabolism. 13
This study aimed to explore the associations between early microbiome and metabolome profiles and growth and body composition indices in human milk-fed VPT infants. In addition, we aimed to identify key bacteria and metabolites that may affect the long-term metabolic health of preterm infants.
Materials and Methods
Study design and participants
The participants were from a prospective observational cohort study investigating the effects of early nutritional intake on the growth and body composition of VPT or very low birth weight (VLBW) infants, which had been published before. 3 The inclusion and exclusion criteria were consistent with the previous study. 3 Briefly, VPT/VLBW infants without serious diseases; born between January 1, 2018, and February 28, 2019; and admitted to the neonatal intensive care unit (NICU) of the Children’s Hospital of Fudan University were consecutively recruited. This study further excluded infants who received human milk feeding for <80% of all enteral feeding volumes during hospitalization and whose fecal samples were not available during hospitalization.
The feeding practices in the NICU followed standardized rules during the study period. Enteral feeding via a nasogastric tube was initiated immediately when the condition of the infants was stabilized. Thereafter, the daily milk intake was increased according to tolerance until the amount of 150–160 mL/kg/day and then maintained until discharge. Mother’s milk was the first choice for feeding. When the mother’s milk was not available, donor milk or formula was preferred.
Infant and maternal data were collected from medical records. The VPT/VLBW infants were born between 28 and 32 weeks of gestational age or weighed between 1,000 and 1,500 g. The term equivalent age (TEA) was defined as 40 weeks of postmenstrual age (PMA). In the present study, we treated all growth indicators measured between 38 and 42 weeks of PMA as measured at TEA. The corrected age (CA) was calculated as the additional age from the TEA. Full enteral feeding was defined as enteral nutritional volume exceeding 120 mL/kg/day. Days of life (DOL) were defined as the postnatal age of fecal sampling. We also collected information on daily enteral feeding volume, condition of antibiotic and probiotic usage, and major morbidities during hospitalization.
This study was approved by the Institution Ethics Committee (Research Ethics Board of the Children’s Hospital of Fudan University, Regional Code: 2018-149) and conformed to the Declaration of Helsinki. Oral informed consent was obtained from the guardians of all eligible infants.
Fecal sample collection and preparation
Fecal samples were collected weekly from each patient during hospitalization. After collection, fecal samples were immediately stored at 4°C and transferred to −80°C within 1 hour. To avoid confounding factors, we excluded samples from patients who had used antibiotics within the previous week or samples collected before achieving full enteral nutrition. Thus, we kept fecal samples from infants who had achieved full enteral nutrition and had not received antibiotics in the past week. In the association analyses, we included only one fecal sample that was closest to the discharge date.
Microbiome analysis by 16S rRNA gene sequencing
Microbial genomic DNA was isolated from each fecal specimen using an EZNA Soil DNA Kit (Omega Bio-Tek, Norcross, GA, USA) according to the manufacturer’s instructions. 16S rRNA sequencing and raw data preprocessing were performed according to standard protocols provided by Majorbio Bio-Pharm Technology Co. Ltd., as previously described. 14 In brief, the V3-V4 hypervariable regions of the bacterial 16S rRNA gene were amplified using the primer pairs 338F (5′-ACTCCTACGGGAGGCAGCAG-3′) and 806R (5′-GGACTACHVGG GTWTCTAAT-3′) using a thermocycler polymerase chain reaction (PCR) system (GeneAmp 9700, Applied Biosystems, USA). Chimeras were detected and removed by the UCHIME algorithm. Taxonomic identity was assigned to the resulting operational taxonomic units (OTUs; 97% similarity) by alignment with the Silva (SSU123) 16S rRNA database using a confidence threshold of 70%. Copy numbers were adjusted using the rrnDB.
The numeration of total bacteria was performed in triplicate as previously described. 15 The bacterial abundance in the fecal samples was measured using quantitative PCR for a conserved region of the 16S rRNA gene (primer pairs 338F and 806R). Dominant bacterial taxa (phylum, family, or genus level) were defined by having a prevalence of ≥20% of samples with an abundance of ≥106 cells/g.
Metabolome profiling of fecal samples
Untargeted liquid chromatograph-mass spectrometer (LC-MS) was performed using an ACQUITY UHPLC system (Waters Corporation, Milford, USA) coupled with an AB SCIEX Triple TOF 5600 System (AB SCIEX, Framingham, MA, USA). Metabolic profiling was analyzed in both ESI-positive and ESI-negative ion modes. The acquired raw data were processed using Progenesis QI (Waters Corporation, Milford, MA, USA) to obtain a two-dimensional data matrix containing retention time, positive or negative mode, mass-to-charge ratio, observations (sample), and peak intensity.
Statistical interrogations and data preprocessing were conducted using the “MetaboAnalystR” package (ver. 2.0.1) in the R software. All the metabolites with annotated Human Metabolome Database (HMDB) 16 IDs were included in the downstream analysis. Metabolites with a relative standard deviation of >25% in the QC pools were filtered out. For each metabolite feature, the missing values were replaced with half the minimum peak intensity of the entire dataset. Quantile normalization and log transformation were applied to all the metabolome data.
Growth and body composition measurements
Growth indices including weight, length, and head circumference (HC) were measured at birth, TEA and 6 months of CA by trained pediatricians. Weight, length, and HC were measured using a digital balance (SECA- 376, Germany), length board (SECA-233, Germany), and tape, respectively. The z-scores of growth at birth and TEA were calculated based on the Fenton preterm growth chart, 17 and those at 6 months of CA were calculated based on the 2006 World Health Organization growth standards. 18 Body composition indices, including FFM, FM, and PBF, were examined using an air-displacement plethysmograph (PEA POD Infant Body Composition System) that was described previously 19 at TEA and 6 months of CA. The z-scores of the body composition indices were calculated based on postconceptional age charts published by Norris et al. 20
Statistical Analysis
Statistical analyses were performed and graphical outputs were generated using R (ver. 3.6.1) and RStudio (ver. 1.2.5001). Graphs were created using the R packages “ggplot2” and “ggpubr.” Parametric and nonparametric pairwise comparisons were performed using the R package “rstatix.” Continuous data are presented as means and standard deviations if normally distributed or medians and interquartile ranges if not normally distributed. Categorical variables were compared by using Pearson χ2 tests or Fisher’s exact tests, when appropriate. Continuous data were compared using the Student’s t-test or Mann–Whitney U test for two groups when appropriate or using the one-way analysis of variance or Kruskal–Wallis rank sum test for three groups when appropriate. Considering the changes in body composition, along with catch-up growth from TEA to 6 months of CA in preterm infants, we also analyzed the changes in z-scores. The false discovery rate approach was used to control false positives in multiple tests.
Taxa bar plots of microbial composition were generated using the “phyloseq” 21 (ver. 1.30.0) package. Correlations of z-scores of growth and body composition at different time points and their changes with the absolute or relative abundance of dominated bacteria gut at different taxanomy levels were calculated and visualized by Spearman’s method using the “rcorr” function of “Hmisc” package and the “corrplot” function of “corrplot” package. Fecal metabolite abundances were log-transformed and then weighted gene co-expression network analysis (WGCNA) was performed using the “WGCNA package” in R. Positively correlated metabolites were clustered together using “signed hybrid” networks and biweight midcorrelation. Correlations between the normalized metabolite intensities and growth and body composition at different time points and their changes were explored using Spearman’s methods. To eliminate confounding factors, a multiple regression model was used to adjust for DOL (days), gestational age (weeks), volume of enteral feeding during hospitalization (mL), sex, and mode of delivery.
Results
Demographic characteristics of participants
This study included 73 VPT/VLBW infants with a gestational age of 30.00 [28.86, 30.43] weeks and a birth weight of 1,300 [1,180, 1,440] g. Two follow-up visits were conducted after discharge, at TEA, and at 6 months of CA (Fig. 1). Neonatal and maternal characteristics are summarized in Table 1. No significant differences in the demographic characteristics were observed between infants who underwent follow-up visits at TEA and 6 months of CA (all p values > 0.05) (Supplementary Table S1). At TEA, all 73 infants underwent growth measurements, among whom 45 received body composition measurements (Fig. 1). At 6 months of CA, 59 and 26 infants underwent growth and body composition measurements, respectively (Fig. 1). Comparative analysis of baseline data revealed no significant differences between the infants who received body composition measurements and those who did not (Supplementary Table S1).
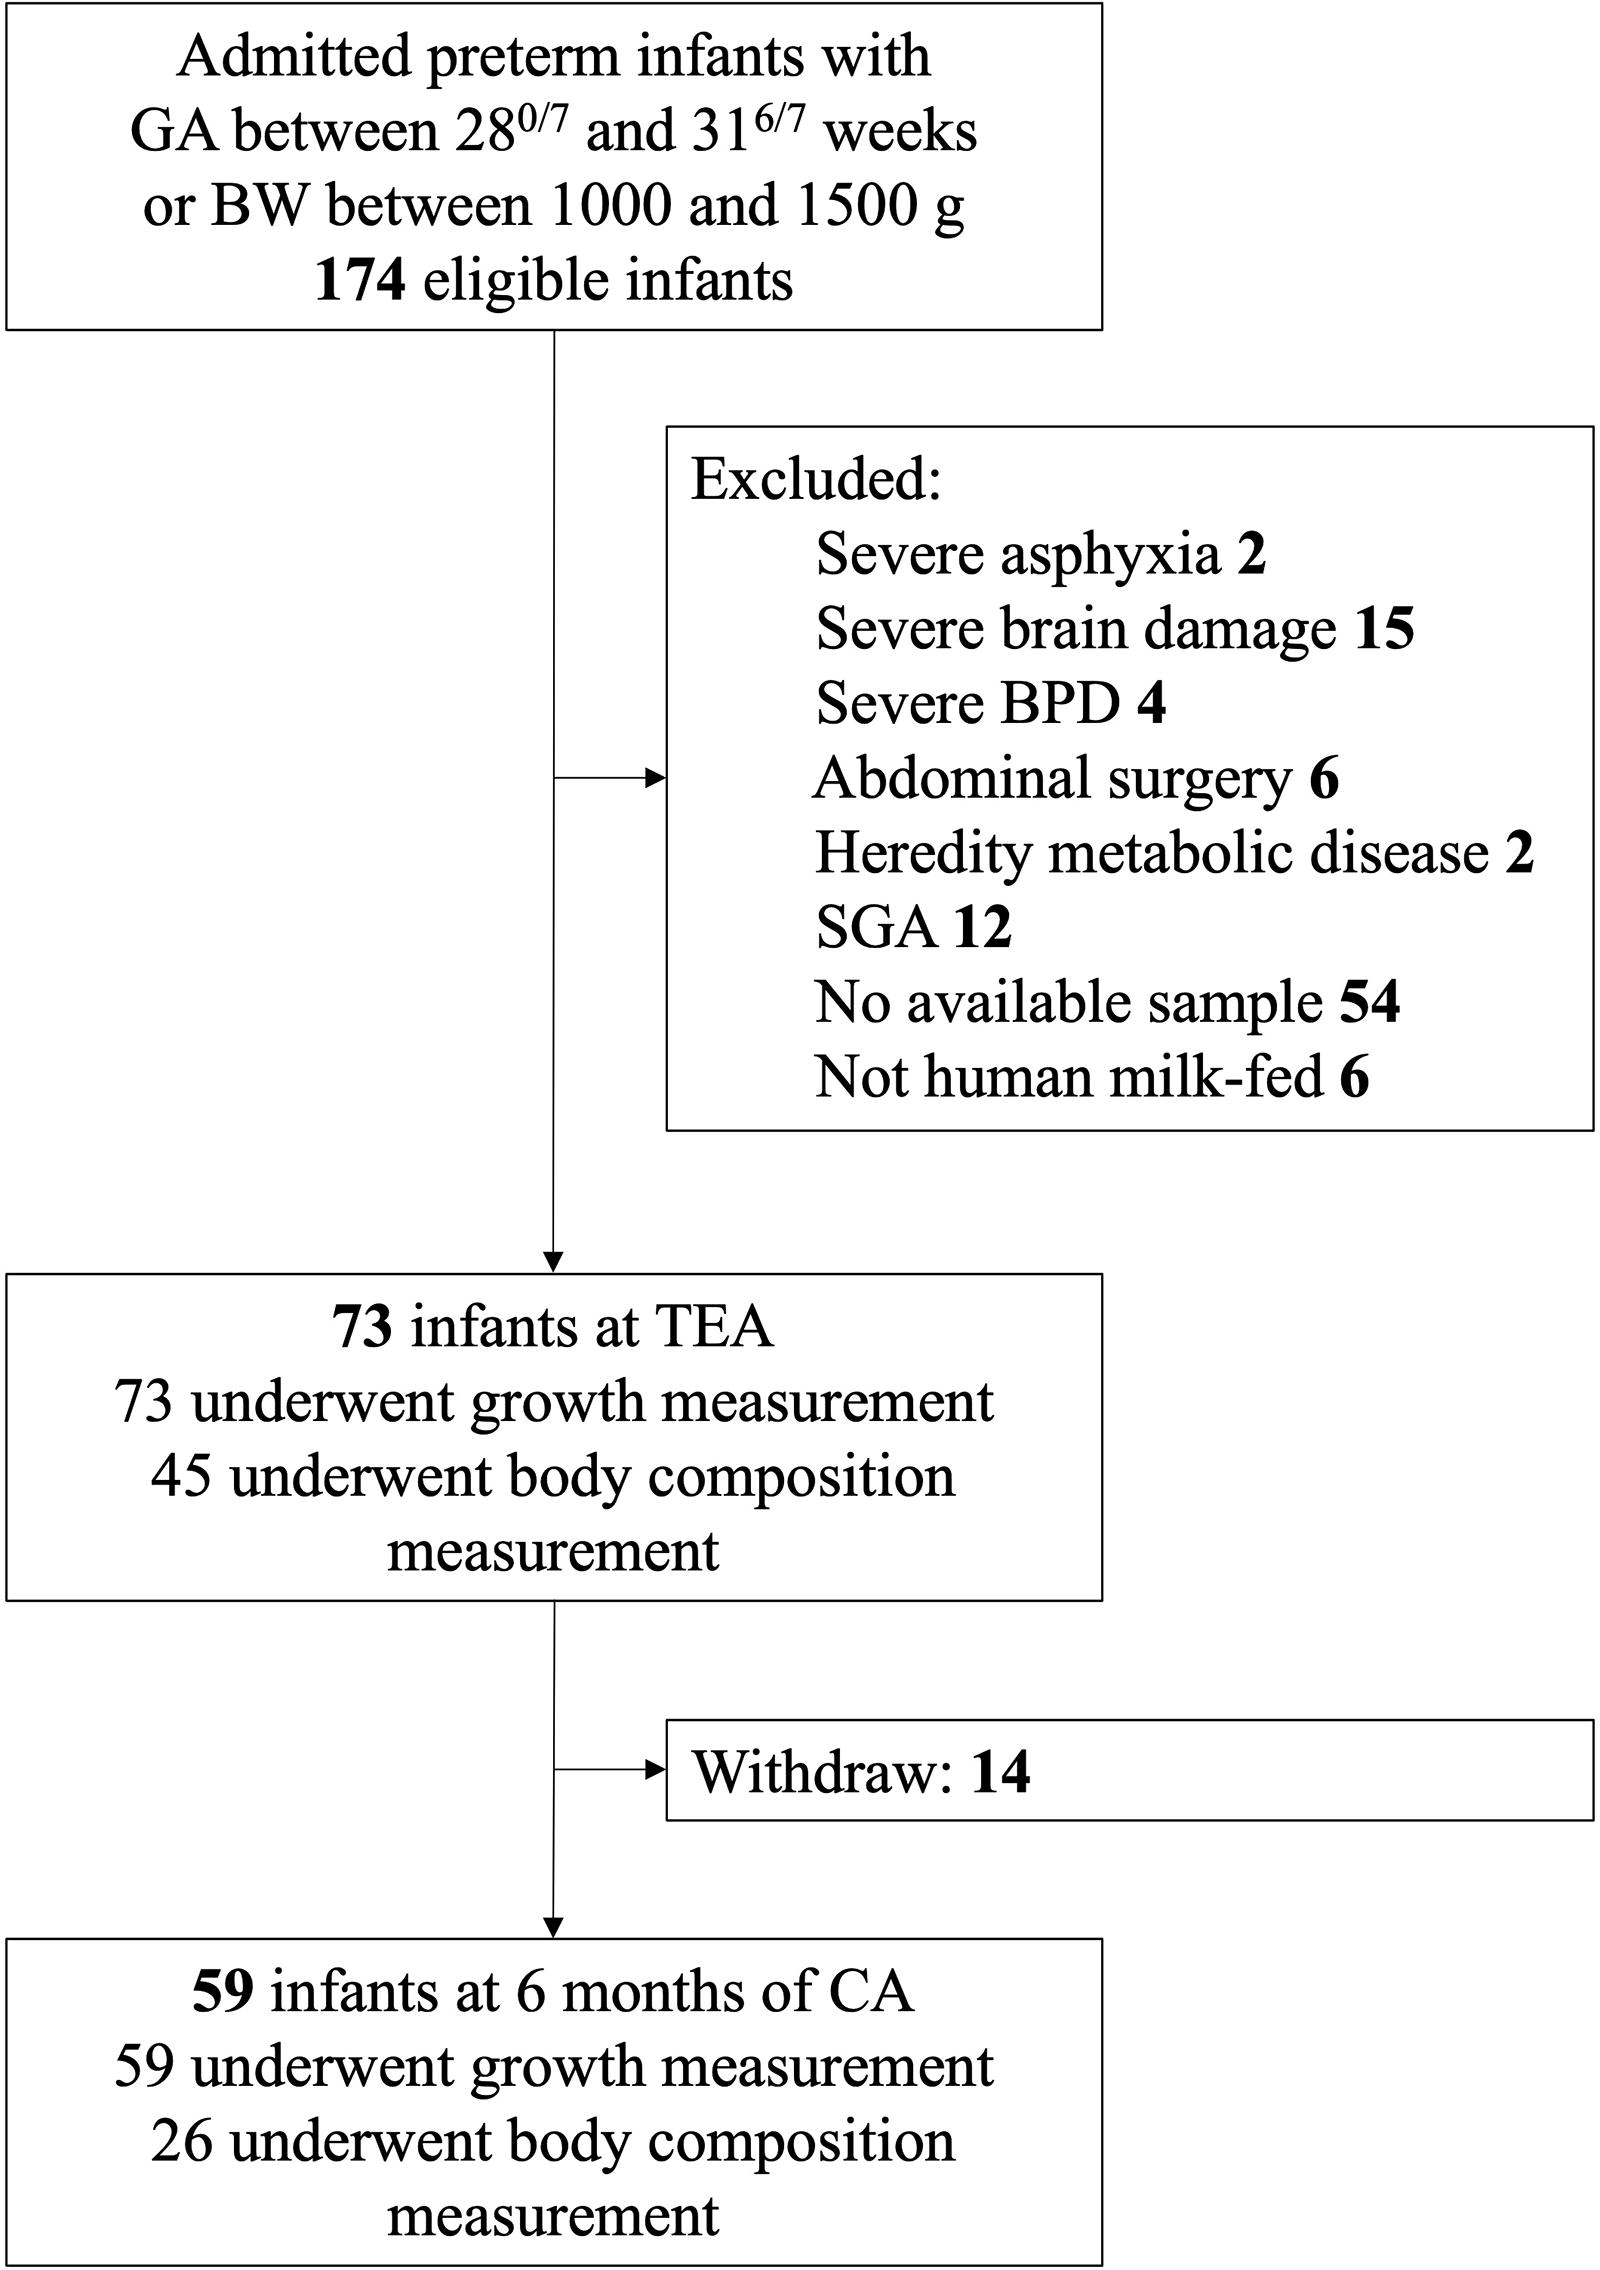
Flow diagram of participants. BPD, bronchopulmonary dysplasia; CA, corrected age; BW, birth weight; GA, gestational age; SGA, small for gestational age; TEA, term equivalent age.
The Baseline Characteristics and Maternal Data (N = 73)
IQR, interquartile range; BPD, bronchopulmonary dysplasia; NEC, necrotizing enterocolitis ≥ stage II according to Bell’s criteria; ROP, retinopathy of prematurity; NICU, neonatal intensive care unit.
Growth and body composition at TEA and 6 months of CA
The z-scores of body weight and length demonstrated a significant decrease at TEA compared with those at birth (p < 0.001)(Fig. 2a, b). However, catch-up growth in body weight and length was observed from TEA to 6 months of CA, as indicated by a significant rebound in the z-scores (p < 0.001) (Fig. 2a, b). HC showed no significant changes (Fig. 2c). At TEA, preterm infants demonstrated relatively high z-scores of FM (2.20 [1.57, 3.28]) and PBF (3.06 [2.31, 3.97]), and a low FFM z-score (−1.65 [−2.36, −0.73]). However, these indices recovered from TEA to 6 months of CA, as indicated by the decrease in FM z-score (0.86 [−0.65, 1.92]) and PBF z-score (0.29 [−0.47, 1.37]), and the increase in FFM z-score (0.79 [−0.12, 2.05]) (all p values < 0.001) (Fig. 2d–f).
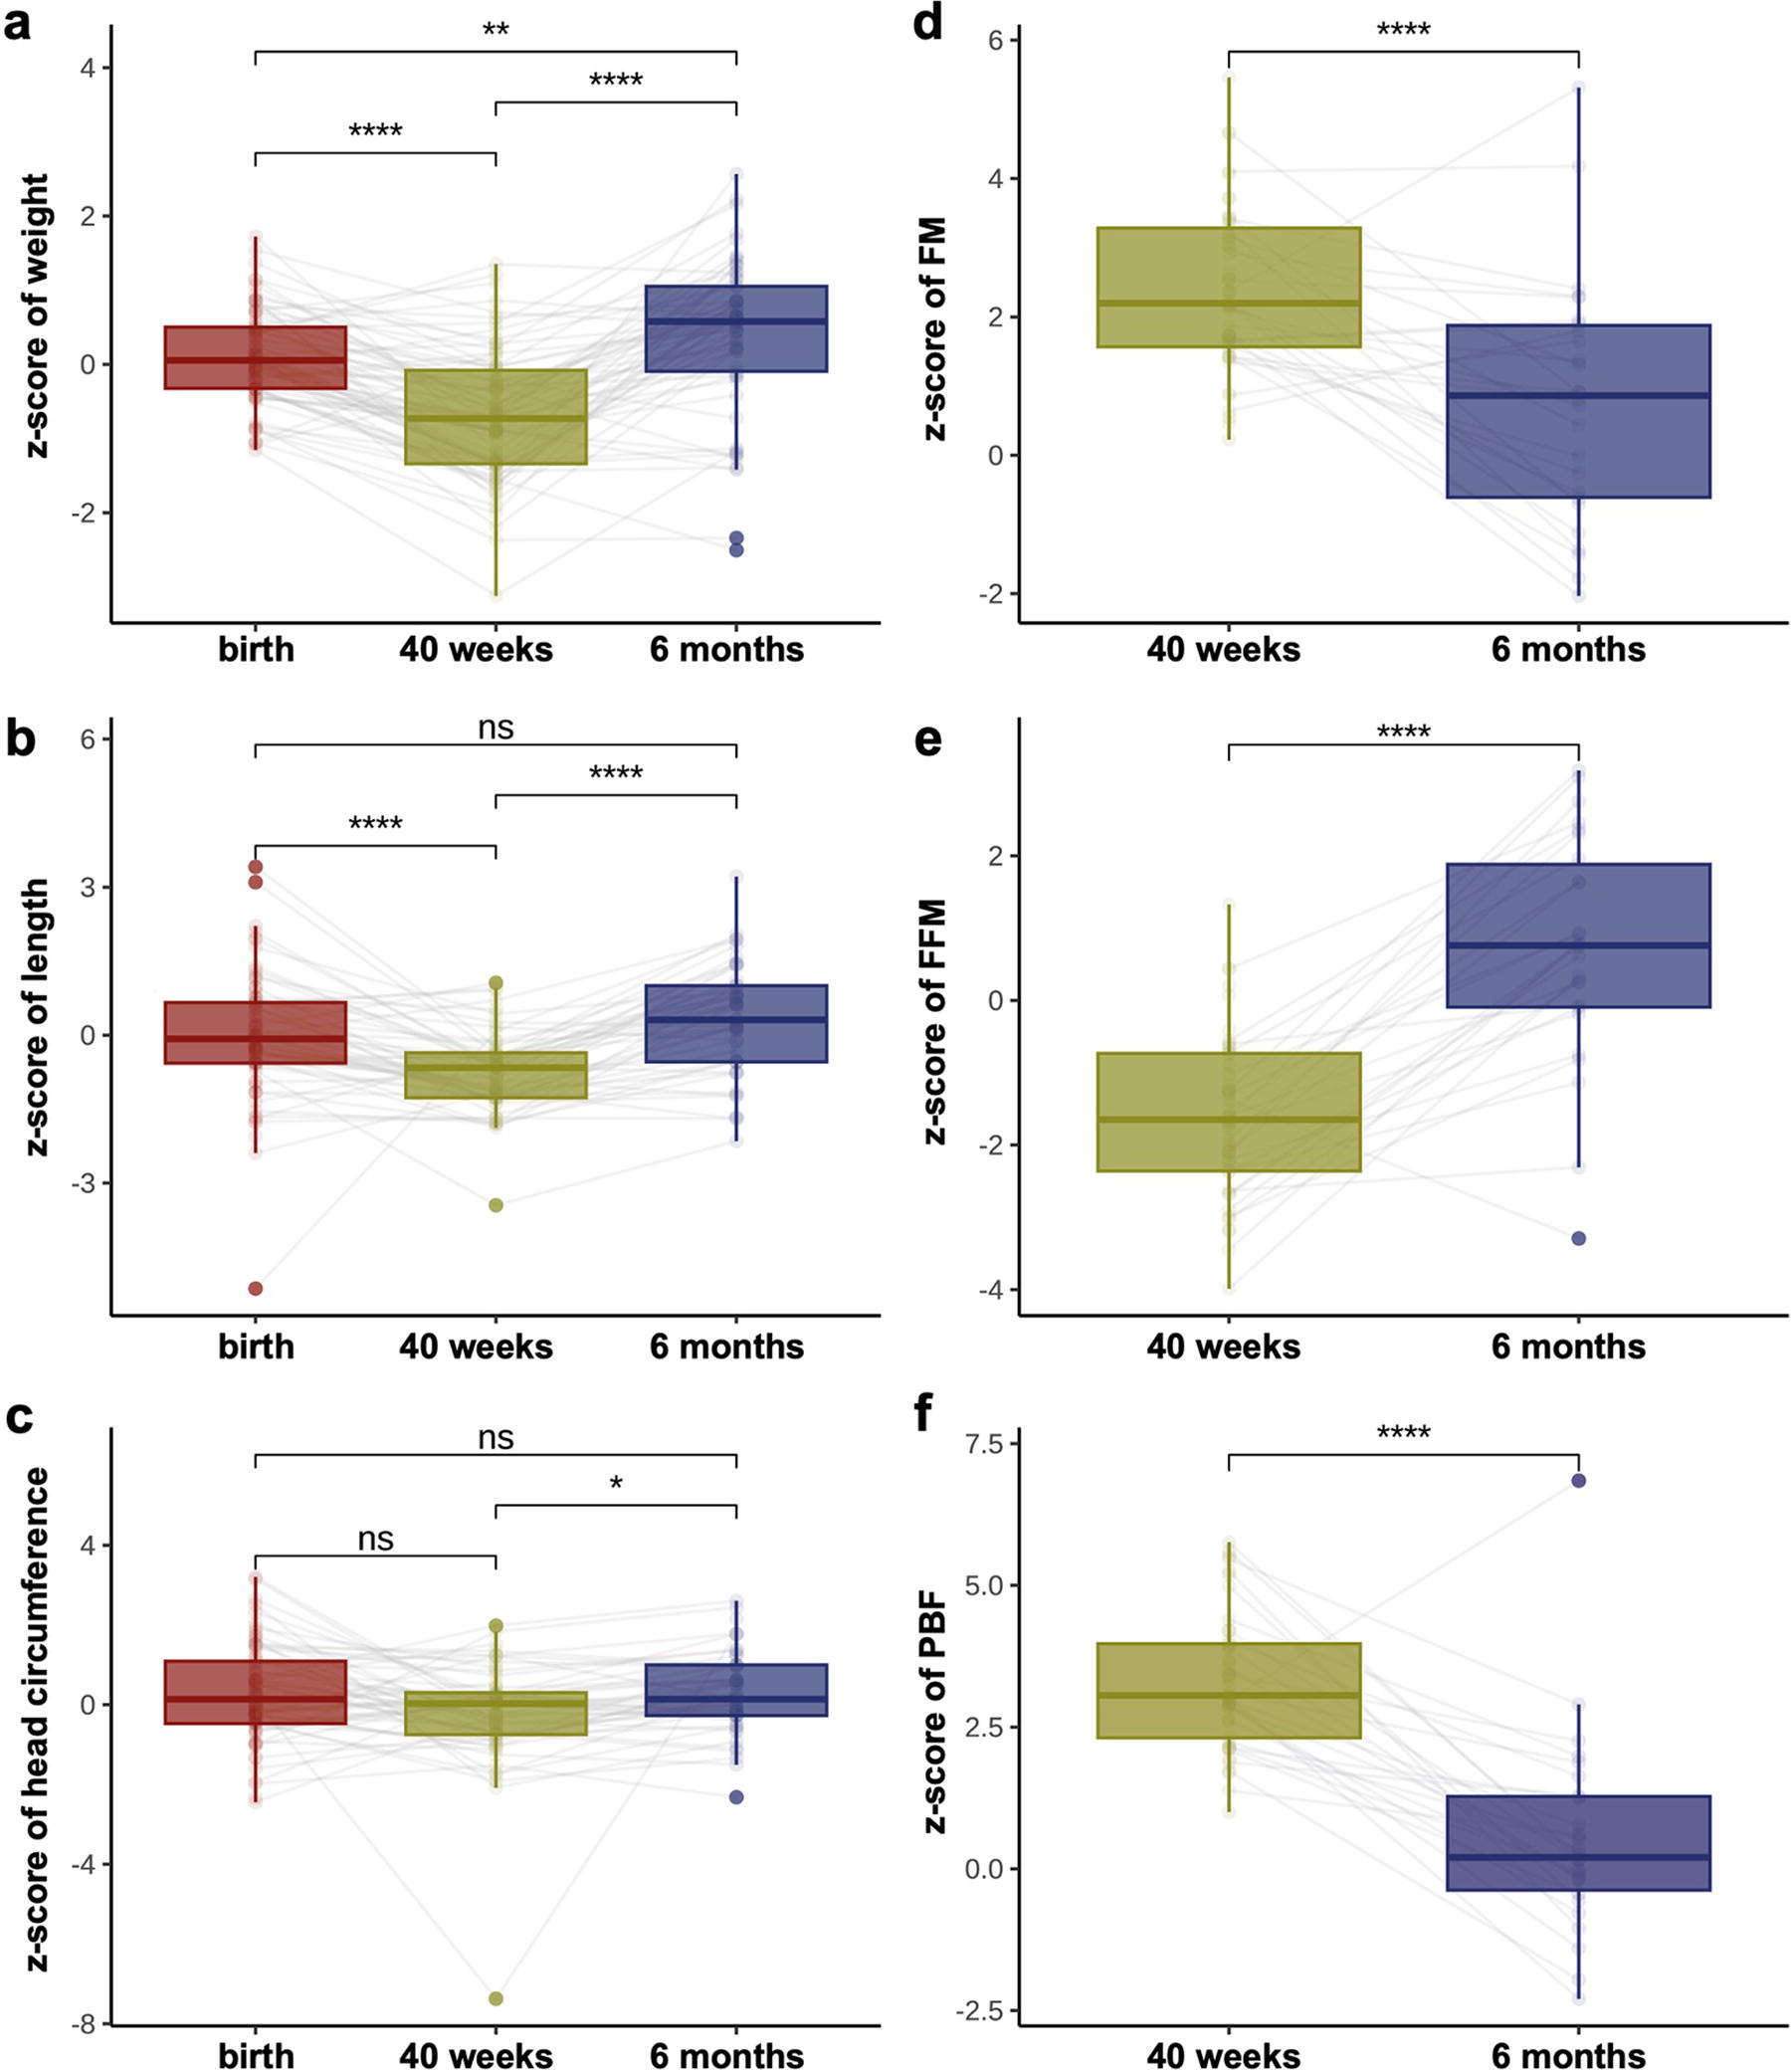
Trend of growth and body composition z-scores.
Associations of gut microbiome with growth and body composition indices
The gut microbiome composition of participating infants (n = 73) was analyzed using 16S rRNA sequencing. At the family level, the predominant components of the gut microbiome in full-enteral feeding preterm infants were Enterobacteriaceae and Clostridiaceae (Fig. 3a). Quantitative analysis revealed considerable interindividual variability in the overall absolute bacterial load, ranging from 3.4 × 10⁷ to 1.8 × 10¹¹ cells/g of feces (Fig. 3b).
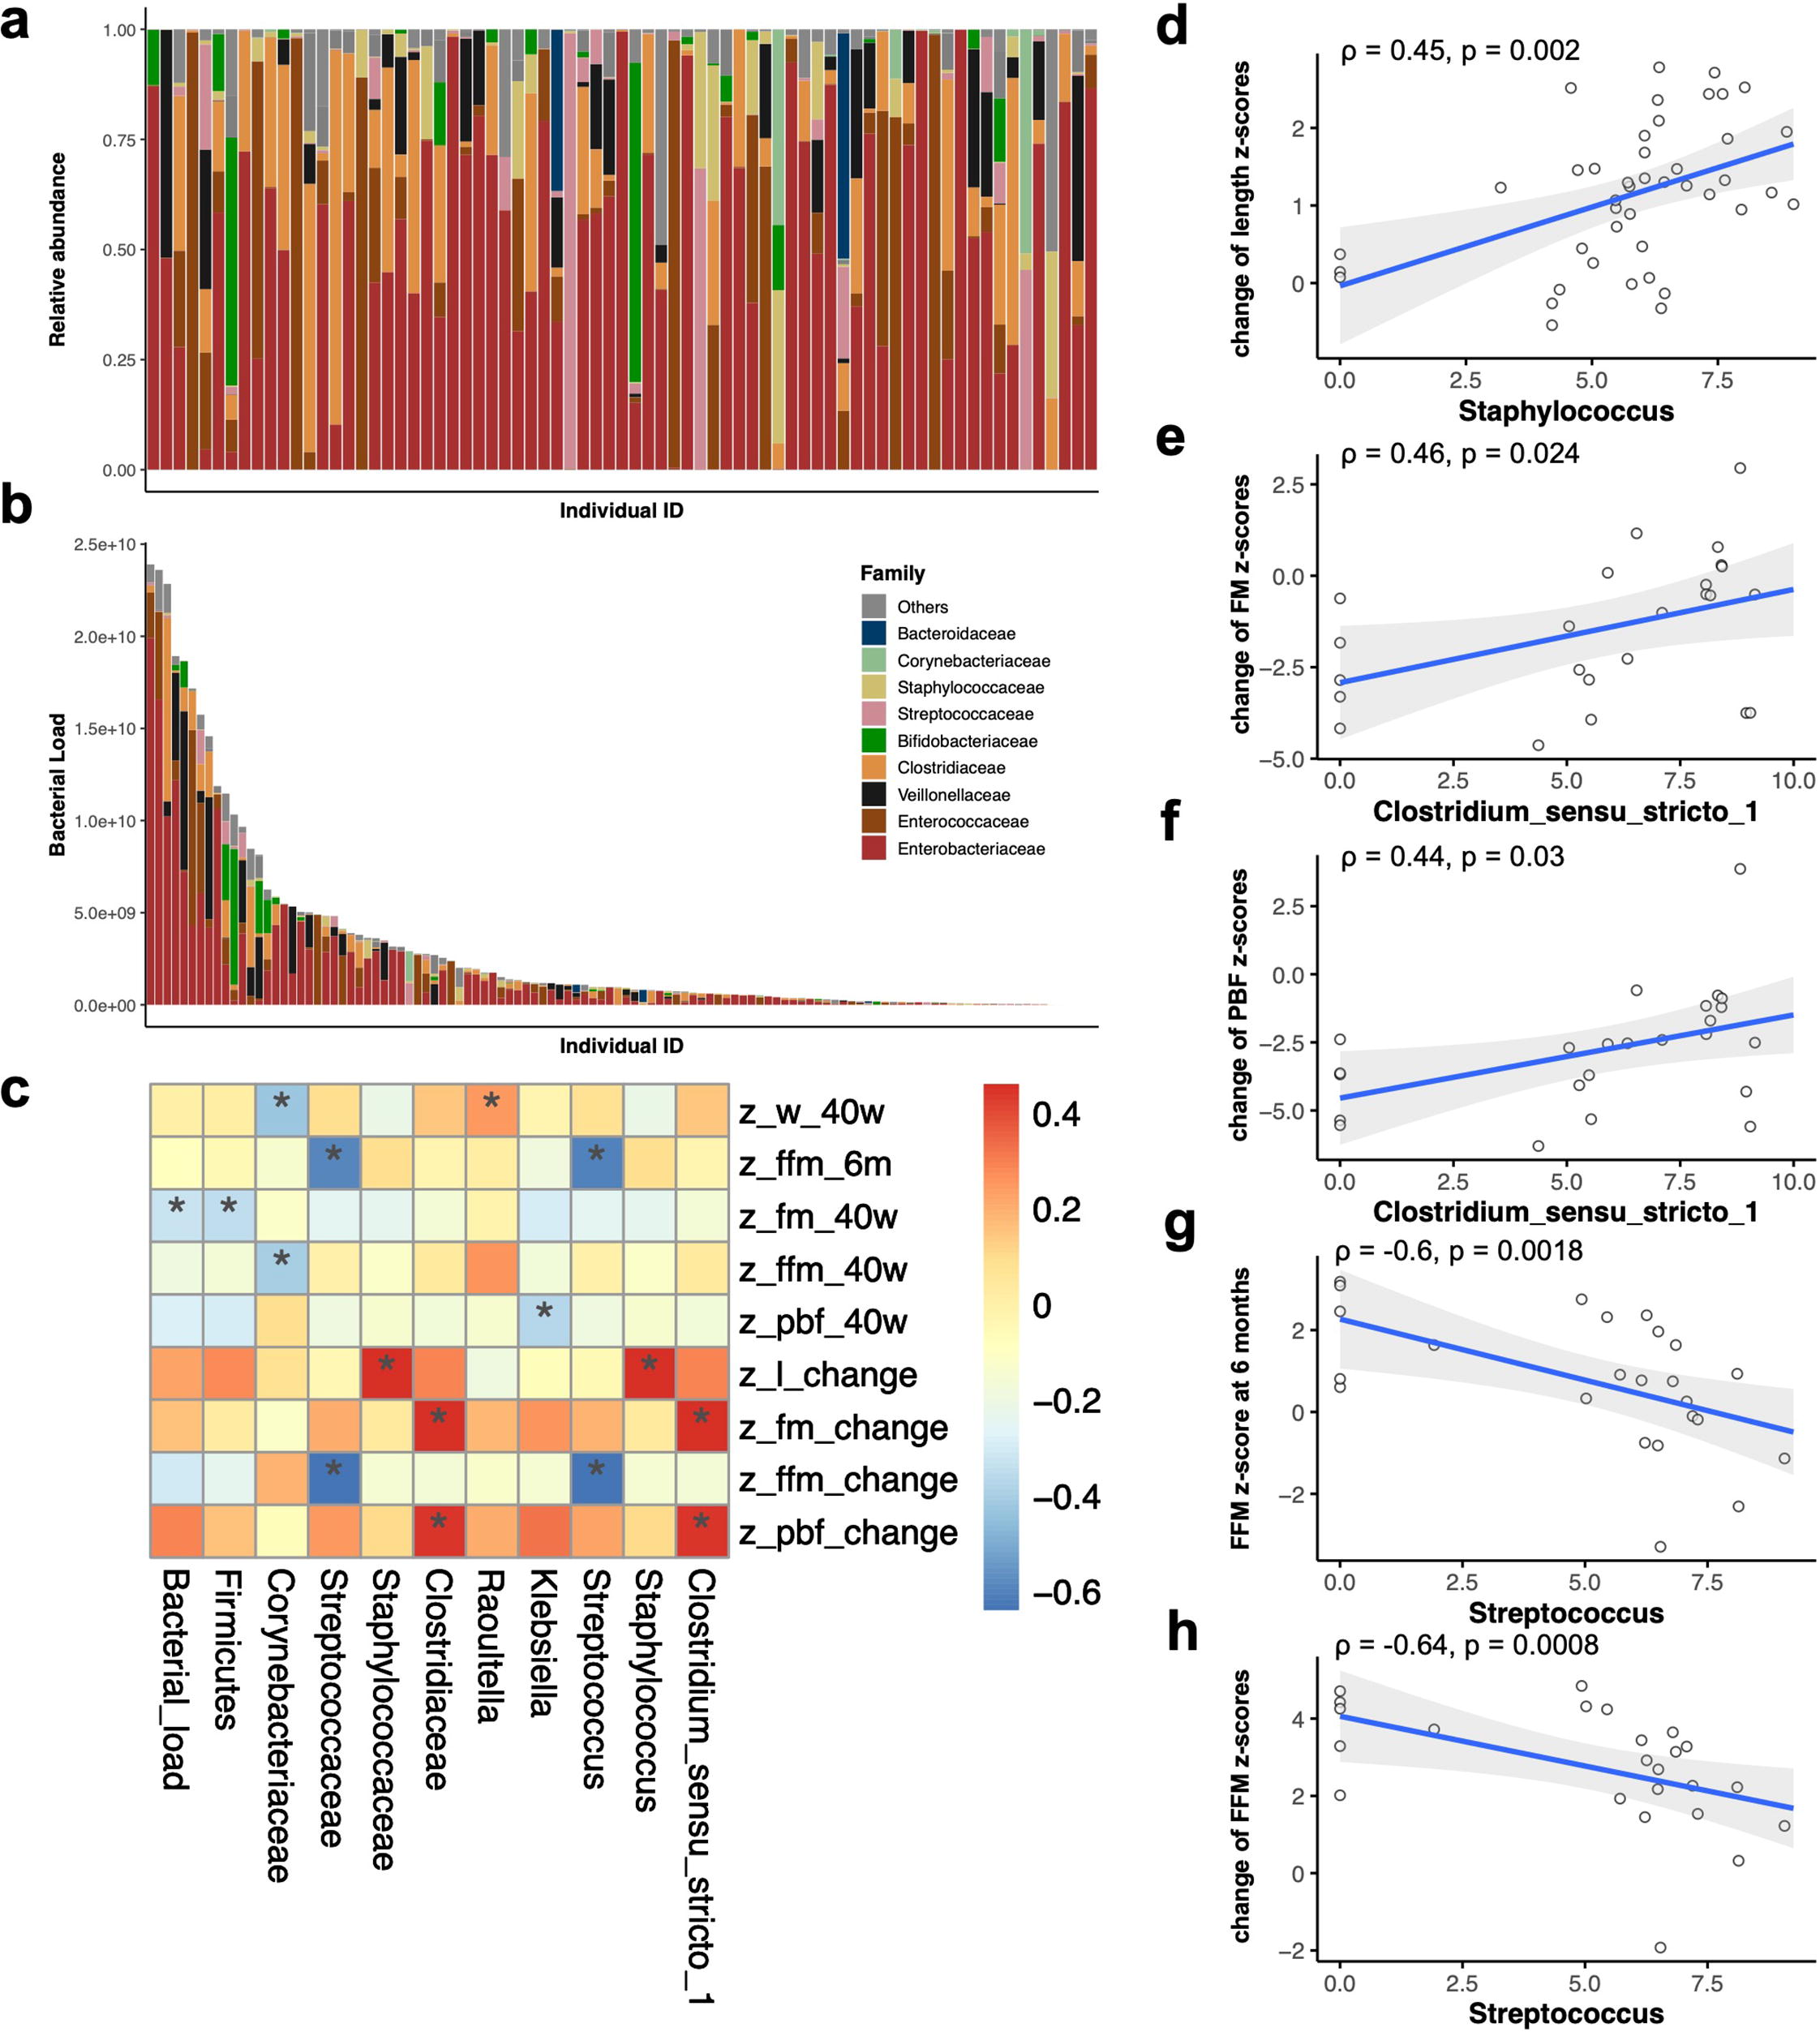
The association of gut microbiome with growth and body composition indices.
We investigated the association of growth and body composition indices with the alpha diversities, as reflected by Shannon index, and observed the number of OTUs, overall bacterial load, and absolute load of dominant bacteria across various taxonomic levels (phylum, family, and genus) (Supplementary Fig. S1). Significant correlations (p < 0.05) are presented in Figure 3c. The overall bacterial load was associated with a lower FM z-score at TEA (Fig. 3c). At the genus level, a negative correlation was identified between the absolute abundance of Streptococcus and FFM z-score at 6 months of CA (ρ = −0.6, p = 0.002) as well as the increase of FFM z-scores from TEA to 6 months of CA (ρ = −0.64, p < 0.001) (Fig. 3g, h). A higher abundance of Staphylococcus demonstrated a correlation with an increase in length z-scores from TEA to 6 months of CA (ρ = 0.45, p = 0.002) (Fig. 3d). Clostridium_sensu_stricto_1 abundance demonstrated a correlation with smaller decreases in FM z-scores (ρ = 0.4, p = 0.024) and PBF z-scores (ρ = 0.44, p = 0.030) (Fig. 3e–f). Parallel results were observed at the family level (Streptococcaceae, Staphylococcaceae, and Clostridiaceae) (Fig. 3c).
We further evaluated these correlations at the genus level by adjusting for major perinatal confounders including DOL, gestational age, volume of enteral feeding during hospitalization, sex, and mode of delivery. After adjustment, the higher inferred absolute abundance of Streptococcus remained significantly associated with a lower FFM z-score at 6 months of CA (β = −0.59; 95% confidence interval [CI]: −0.93, −0.26; p = 0.002) and a smaller increase in FFM z-score from TEA to 6 months of CA (β = −0.46; 95% CI: −0.82, −0.09; p = 0.018). However, the inferred abundances of Staphylococcus and Clostridium_sensu_stricto_1 were no longer significantly associated with changes in the z-scores (both p values > 0.05).
Associations of fecal metabolome with growth and body composition indices
LC-MS metabolomic analyses were conducted on the fecal samples (n = 52). All 1,908 detected metabolites with HMDB annotations were clustered into 19 highly correlated modules using WGCNA (Fig. 4a). The correlations of these metabolite modules with growth and body composition z-scores were analyzed (Fig. 4b). Intriguingly, the metabolites in the green-yellow and light green modules were negatively correlated with FM and PBF z-scores but positively correlated with FFM z-scores at 6 months of CA (p < 0.05). These modules also exhibited similar correlations with changes in the z-scores of FM, PBF, and FFM (p < 0.05) (Fig. 4b).

The association of gut metabolome with growth and body composition indices.
Further analyses of the metabolite composition of these two key modules revealed that human milk oligosaccharides (HMOs), a group of indigestible oligosaccharides present in human milk, constituted a significant portion of the green-yellow (8/42) and light green (7/21) modules. We screened all fecal HMOs for associations with body composition or growth(Fig. 4c). Of the 19 HMOs detected, 10 demonstrated significant correlations with body composition indices. Higher levels of these 10 HMOs correlated with lower z-scores of FM and PBF, and higher z-scores of FFM at 6 months of CA (Fig. 4c). Upon categorizing HMOs into sialylated and neutral types based on the presence or absence of sialic acid, stronger associations were observed for sialylated HMOs. Specifically, higher 3′-sialyllactose (3′-SL) correlated with lower PBF and FM z-scores (p = 0.028 and p = 0.044) at 6 months of CA (Fig. 4d, e). Furthermore, 6′-sialyllactose (6′-SL) demonstrated a similar correlation with PBF and FM z-scores (p = 0.0097 and p = 0.017) at 6 months of CA. Higher level of 6′-SL also correlated with a greater decrease in FM z-scores and a greater increase in FFM z-scores (p = 0.042 and p = 0.04, respectively) (Fig. 4f–i).
After adjustment for major confounders, both higher 3′-SL and 6′-SL remained significantly correlated with lower FM z-scores (β = −0.43 and −0.36; 95% CI: −0.85, −0.01 and −0.70, −0.01; p = 0.044 and 0.043, respectively) and PBF z-scores (β = −0.58 and −0.47; 95% CI: −1.03, −0.12 and −0.85, −0.09; p = 0.018 and 0.020, respectively) at 6 months of CA, and 6'-SL maintained a correlation with the increase in FFM z-scores (β = 0.43; 95% CI: 0.08, 0.78; p = 0.021).
Considering that HMOs can act as prebiotics to modulate the gut microbiota, we further investigated the association between gut HMOs and the gut microbiome (Supplementary Fig. S2). The abundance of Clostridium_sensu_stricto_1 demonstrated a negative correlation with 3′-SL, 6′-SL, DSLNH I, and DSLNH II (all p values < 0.05), whereas the abundance of Streptococcus was negatively correlated with 2′-Focusllactose as well as others (all p values < 0.05; Supplementary Fig. S2).
Discussion
In this study, we investigated the associations of the gut microbiome and metabolome profiles in human milk-fed VPT/VLBW infants during the early life period with growth and body composition at TEA and 6 months of CA and their changes. The Streptococcus abundance may adversely affect the recovery of FFM from TEA to 6 months of CA. The intensities of sialylated HMOs in feces were correlated with FFM and FM z-scores at 6 months of CA, indicating a potential regulatory function of HMOs in the recuperation of body fat in preterm infants.
The intimate connection between host metabolism, growth, and the intestinal microbiome has been widely reported in previous studies.10,22 In line with this understanding, our research identified an association between variations in the gut microbiome and body composition of preterm infants at 6 months of CA. This suggests that the specific microbial composition of preterm infants could predict the risk of obesity and metabolic disorders later in life. Particularly noteworthy in our findings was the influence of Streptococcus, which was negatively correlated with the z-score of FFM at 6 months of CA, as well as its change over time. This correlation persisted, even after adjusting for potential confounding factors. However, the metabolic roles of Streptococcus species remain elusive. Although some studies have reported a positive correlation between the relative abundance of Streptococci and later BMI, 23 others have considered Streptococcus as a probiotic capable of preventing obesity or metabolic disorders in adolescents 24 and adults. 25 Factors that contribute to this difference may include differences in the stage of life, term and preterm infants, and the diverse composition of strains in the genus Streptococcus.
On the other hand, our study identified that Clostridium_sensu_stricto_1 was correlated with a smaller decrease in FM and PBF z-scores. This aligns with the existing research demonstrating a positive association between Clostridium_sensu_stricto_1 and obesity in various populations, including infants, 26 adults, 27 and rodent models. 28 These results suggested a possible adverse effect of this bacterial genus that may contribute to reduced lean mass gain and further metabolic problems. Nevertheless, the precise mechanisms underlying body composition remain elusive, and existing research offers various interpretations. Future studies should focus on elucidating these mechanisms and developing targeted interventions to promote healthy growth trajectories and long-term metabolic health in this highly vulnerable population.
Metabolites serve as reflections of diverse physiological metabolic processes, notably those impacting fat storage and utilization. 12 We uncovered a substantial association between fecal HMOs intensities and the recuperation of body composition indices from TEA to 6 months of CA. Our research revealed that sialylated HMOs were significantly correlated with the recovery of body composition compared with neutral HMOs. Importantly, 3′-SL and 6′-SL, the most plentiful sialylated HMOs in human milk, exhibited a correlation with a higher FFM z-score and a lower FM z-score at 6 months of CA. This suggests the role of sialylated HMOs in the balanced recuperation of body composition in preterm infants.
Human milk feeding has been linked to the prevention of obesity in both full-term 29 and preterm infants, 30 although the mechanism remains inconclusive. Studies on the association between HMOs and infant body composition, particularly in preterm cohorts, 31 are limited and have yielded inconclusive results.32,33 HMOs are the third most prevalent solid components, and the most abundant bioactive substances in human milk, 34 and can be bifurcated into two categories: neutral HMOs lacking sialic acid structures and acidic HMOs containing sialic acid structures. Sialyllactoses (SLs) are well recognized for their multifaceted roles in infection prevention, gut barrier enhancement, and cognitive development improvement. 35 Previous studies have reported that sialylated bovine milk oligosaccharides can enhance lean body mass gain in a bacteria-dependent manner. 36 Concurrently, animal models have illustrated that enforced maternal treadmill exercise can reduce body weight and PBF, and improve glucose tolerance in offspring in a 3′-SL-dependent manner. 37 By contrast, full-term infants aged between 2 and 6 months have demonstrated a positive correlation between FM and the intake of 3′-SL and 6′-SL. 32 This disparity may arise from variations in developmental trajectories and fat accumulation between full-term infants, 32 stunted preterm infants, 36 and animal models. 37 Furthermore, we identified negative correlations between 3′-SL and Clostridium_sensu_stricto_1 abundance in the gut, which has been associated with less lean body mass gain.
To the best of our knowledge, this is the first study to examine the relationship of the gut microbiome and metabolome with body composition in preterm infants. However, it is important to acknowledge the limitations of our study. First, our study encountered a notable attrition rate in body composition measurement, resulting in some gaps in this dataset. Our study lacked long-term follow-up data, leaving the prognoses of obesity and metabolic disease in the participating infants unresolved. Second, although we reported the role of human milk-derived fecal HMOs intensities in relation to long-term body composition, we did not collect milk samples to further examine the correlations. Although prior research indicates a strong correlation between the intensity of fecal HMOs and those in the breast milk of both term 38 and preterm infants, 39 which may lend credence to our findings, our observations warrant further validation through a targeted metabolomic analysis involving a larger cohort. Third, owing to the limitations and difficulty of feeding information and fecal sample collection, this study only analyzed the association between microbial and metabolic profiles during the early postnatal period and body composition at TEA and CA 6 months without adjusting for the confounding factors of postdischarge feeding patterns, which might lead to some bias in the results. Further studies are required to explore this issue in the future.
Conclusions
Our research underscored the role of the gut microbiome and metabolome in the body composition of preterm infants, emphasizing the role of Streptococcus and HMOs. SLs are potentially associated with the recovery of body composition. Further exploration of the effects of HMOs on the body composition of preterm infants and the underlying mechanisms is highly recommended.
Footnotes
Acknowledgments
The authors would like to thank the other staff of the Neonatal Department and Child Healthcare Department of Children’s Hospital of Fudan University who are not included in the authors’ list. The authors are also grateful for the time of families who participated.
Authors’ Contributions
Y.C. conceived and designed the study and guided the article writing as corresponding author. X.G. and J.H. participated in data collection, data cleaning and analyses, interpreted results, and drafted the article. Y.H., S.L., L.Z., W.Y., and P.D. carried out growth and body composition measurements and sample collections. L.H. and X.G. and Y.Y. conducted data cleaning and analyses and reviewed the article draft. All authors were involved in writing the article, interpreting the results, and had final approval of the submitted and published version.
Disclosure Statement
The authors have no conflicts of interest to declare.
Funding Information
The authors declare that no funds, grants, or other support were received during the preparation of this article.
References
Supplementary Material
Please find the following supplemental material available below.
For Open Access articles published under a Creative Commons License, all supplemental material carries the same license as the article it is associated with.
For non-Open Access articles published, all supplemental material carries a non-exclusive license, and permission requests for re-use of supplemental material or any part of supplemental material shall be sent directly to the copyright owner as specified in the copyright notice associated with the article.