
Abstract
Background:
The benefits of breastfeeding a newborn are well documented. Identification of mothers who do not initiate breastfeeding is essential for developing initiatives to improve breastfeeding initiation.
Methods:
The study used data from the National Center for Health Statistics (NCHS) National Vital Statistics System (NVSS) birth certificate data (2014–2021) to identifying 15,599,930 in-hospital deliveries. We used multivariable logistic regression to assess the association between seven body mass index (BMI) categories and initiation of breastfeeding before hospital discharge. Prepregnancy BMI (weight in kilograms/height in meters2) included underweight (<18.5), healthy weight (18.5–24.9), overweight (25.0–29.9), Obesity Class I (30–34.9), Obesity Class II (35–39.9), and Obesity Class III (40–49.9) classes, in addition to a class newly identified in the literature as super obese (≥50), hereafter “Obesity Class IV.” “This project was deemed non-human subjects research.”
Results:
Approximately, 83% of mothers initiated breastfeeding before hospital discharge. Compared to mothers with a healthy prepregnancy BMI, the likelihood of breastfeeding initiation before hospital discharge decreased with increasing prepregnancy BMI. Specifically, we found reduced likelihood of initiation for mothers who were overweight (adjusted odds ratio [aOR]: 0.952, 95% confidence interval [CI]: [0.948–0.955]), Obesity Class I (aOR: 0.884, 95% CI: [0.880–0.888]), Obesity Class II (aOR: 0.816, 95% CI: [0.811–0.820]), Obesity Class III (aOR: 0.750, 95% CI: [0.745–0.755]), and Obesity Class IV (aOR 0.672: 95% CI: [0.662–0.683]).
Conclusions:
Mothers with prepregnancy BMI above the healthy range had reduced likelihood of initiating breastfeeding prior hospital discharge. This information should be used to develop and initiate interventions for mothers who wish to breastfeed but may need additional lactation assistance support.
Introduction
The American Academy of Pediatrics recommends that infants are exclusively breastfed for the first 6 months of life. 1 The positive effects of breastfeeding, even for shorter durations than 6 months, have been well established. Infants who are not breastfed have higher risk of childhood obesity, asthma, atopy, and other perinatal and pediatric outcomes.2–4 Breastfeeding also protects against infectious diseases such as respiratory illness, gastrointestinal infections, and otitis media. 5
Understanding factors associated with breastfeeding status is important for developing educational outreach materials and for resource allocation to promote breastfeeding initiation. One potential factor that may reduce breastfeeding is maternal obesity. 6 Several studies have also shown that women with higher than a healthy prepregnancy body mass index (BMI) are less likely to initiate breastfeeding. While the reasons why women who experience obesity have lower breastfeeding rates are not completely understood, increased levels of progesterone and altered prolactin response may make breastfeeding more difficult to initiate.7–9 As such, overweight and obese mothers may need additional breastfeeding support.
While most studies generally limit the upper BMI weight category to 30 or higher, our study uses four granular categories within this common “BMI ≥30” category, with specific attention given to BMI ≥50, a category that has been referred to in the literature as super morbid obesity. 8 Specifically, we adopt and expand the BMI categories set forth by the Centers for Disease Control and Prevention (CDC). 10 The CDC subcategorizes BMI ≥30 as Obesity Class I (BMI 30–34.9), Obesity Class II (BMI 35–39.9), Obesity Class III (BMI ≥40). In this study, we modified the CDC's class III obesity to include individuals with BMI 40–49.9, and we add a new class (“class IV”) of BMI ≥50. While the relationship between prepregnancy weight and breastfeeding initiation has been studied, research studying subcategories of the BMI ≥30 category is lacking.
Breastfeeding before discharge from delivery has been associated with longer breastfeeding duration. 11 As such, the aim of this study was to evaluate breastfeeding initiation before discharge following delivery among mothers with different BMI categories, with an emphasis on the more granular categories of BMI ≥30 and our newly defined class IV obesity (BMI ≥50).
Methods
Study population
This study used Natality data with geographic information from the National Vital Statistics System (NVSS) of the National Center for Health Statistics (NCHS), years 2014 to 2021. Birth certificate data collection and reporting for all newborns are required by all 50 states and Washington, D.C. 12
Birth records from states reporting less than 5% of any included variable for a given calendar year were excluded from analysis in that year (Fig. 1). For example, Connecticut did not report breastfeeding initiation for years 2014 and 2015, and as such, these years' data were not included in the analysis for that state in years 2014 and 2015. California does not report breastfeeding initiation before hospital discharge and therefore is not included in the analyses.
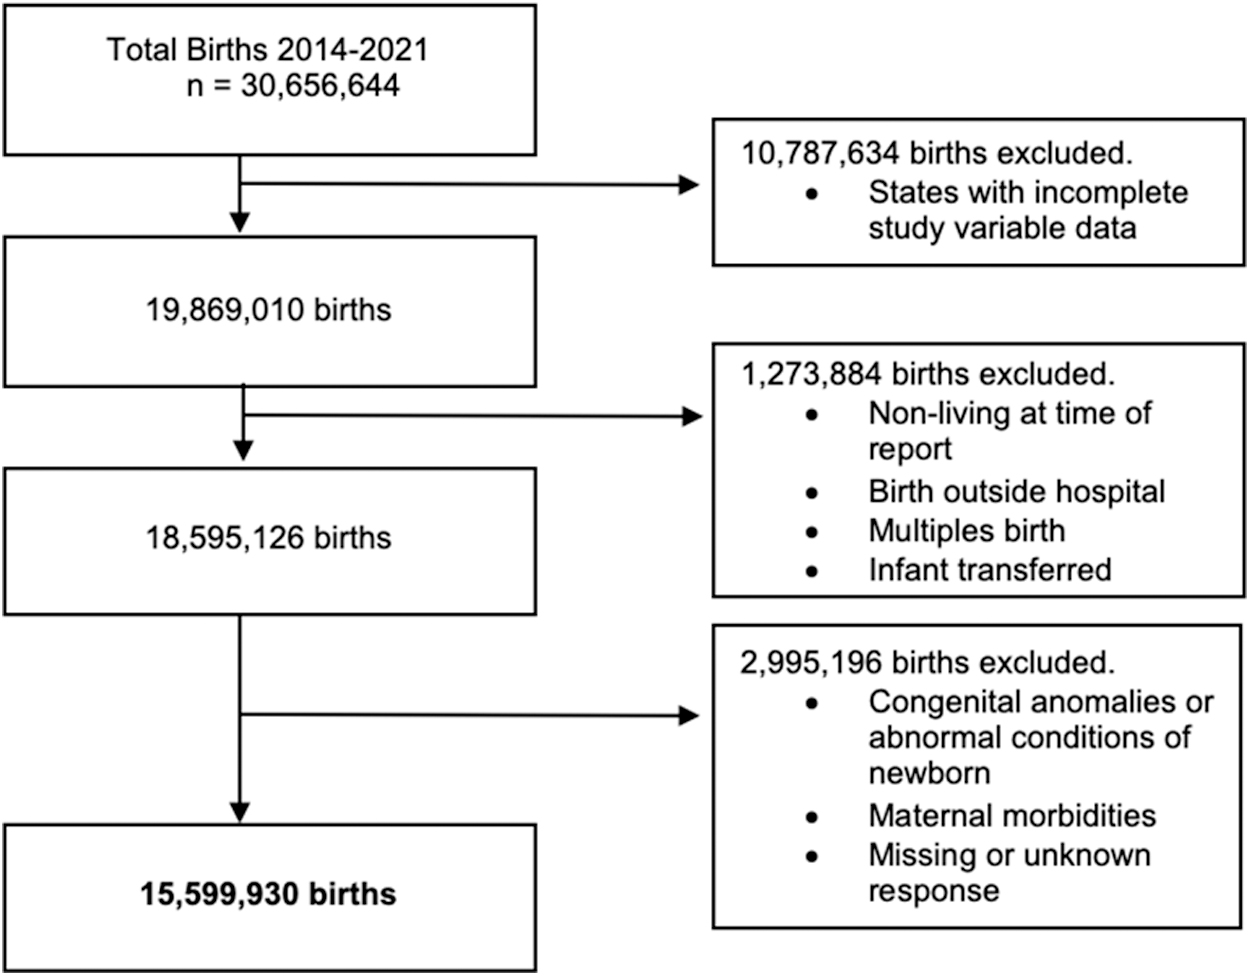
Development of analytic sample.
We identified 19,869,010 birth records with complete information on study variables. Births occurring outside of the hospital, multiple births, births to mothers with morbidities related to delivery, and births to infants who were transferred to another facility, who died during the birth hospital stay, or with congenital anomalies or abnormal conditions were excluded from the analyses. These conditions potentially required mother and newborn to be separated following birth and could introduce selection bias in the breastfeeding initiation population. After exclusions, the analytic sample included 15,599,930 singleton births.
Model variables
The outcome of interest was breastfeeding initiation (0 = No; 1 = Yes) before discharge from the delivering hospital. Breastfeeding initiation is recommended by the National Centers for Health Statistics to be a data field documented on the birth record, and should be noted as “no” when initiation had not occurred, regardless of breastfeeding intention. 13
The main independent variable was maternal prepregnancy BMI (weight in kilograms/height in meters 2 ). Seven categories were constructed, including Underweight (BMI <18.5), Healthy (BMI: 18.5–24.9), Overweight (25.0–29.9), Obesity Class I (BMI: 30.0–34.9), Obesity II (BMI: 35.0–34.9), Obesity Class III (BMI: 40.0–49.9), and Obesity Class IV (BMI ≥50.0).
Confounders and potential breastfeeding initiation covariates were determined a priori based on previous literature.14,15 Maternal demographics included age at delivery (<20, 20–24, 25–29, 30–34, 35–39, and ≥40 years), highest level of educational attainment (less than high school, high school, and any college education), marital status (married or unmarried), and race/ethnicity (Hispanic, non-Hispanic White, non-Hispanic Black, and non-Hispanic other).
Pregnancy and delivery characteristics included timing of first prenatal care visit (first trimester or later/no visits), tobacco use during pregnancy (yes or no), live birth order (first or greater than first), receipt of Special Supplemental Nutrition Program for Women, Infants, and Children (WIC) (yes or no), delivery mode (vaginal or cesarean), delivery day (weekday or weekend), time of delivery (day or night), gestational age at delivery (<37 weeks or ≥37 weeks), maternal weight gain during pregnancy (<11, 11–20, 21–30, 31–40, or ≥41), payment method (private insurance, Medicaid, self-pay, or other), and six conditions associated with pregnancy, including hypertensive eclampsia, gestational diabetes, gestational hypertension, prepregnancy diabetes, prepregnancy hypertension, and previous preterm birth (each coded as yes or no).
Statistical analysis
Bivariate associations between breastfeeding initiation before discharge and study characteristics were assessed using Pearson's chi-square tests.
A series of three separate logistic regression models were conducted to measure the association of the seven BMI categories and breastfeeding initiation before discharge. First, we included only the BMI category variable and no other covariates (unadjusted base model). Second, the model was adjusted for maternal demographics and comorbidities. Finally, the model was further adjusted to additionally include pregnancy characteristics, delivery characteristics, and state fixed effects.
Due to the large number of overall births included in the study, we used a statistical significance level for testing associations of α = 0.005.16,17 Data preparation and analyses for this study was performed using SAS 9.4 (SAS Institute, Cary, NC). Data in this study did not contain personal identifiers and was determined as nonhuman subjects by the University of Arkansas for Medical Sciences Institutional Review Board.
Results
Overall, ∼83% of mothers initiated breastfeeding before hospital discharge. Table 1 provides the distribution of maternal characteristics overall and stratified BMI classification. Over one-half of mothers had a pregnancy BMI categorized as overweight or obese (54.6%), and 3.2% had a prepregnancy BMI categorization of underweight. Most mothers were married (60.1%), attended college (61.4%), were ages 25–34 years old (57.5%), were non-Hispanic White (55.5%), and had private insurance (49.9%). In the highest BMI subcategories, Obese Classes III and IV, the highest percentage of mothers in these BMI subcategories were 25–29 years of age (5.8%), non-Hispanic Black (8.7%), unmarried (6.3%), had high school as the highest level of education attainment (6.6%), and those covered by Medicaid (6.6%). Detailed tables for all model covariates are available in the appendix.
Percentage of Mothers Initiating Breastfeeding by Demographic and Body Mass Index Sub-category
P-values were <0.001 from each chi square test assessing the difference in mothers initiating breastfeeding by demographic characteristic and BMI Subcategory.
BMI, body mass index.
Figure 2 provides the percentage of mothers who initiated breastfeeding before hospital discharge, by BMI category. There was a decline in breastfeeding initiation across obesity categories, with 85.1% of healthy BMI mothers initiating breastfeeding compared to 70.3% of mothers with BMI Class IV obesity (p < 0.001). Rates of breastfeeding initiation by each study covariate are available in the Appendix Tables A1 through A3.

Breastfeeding initiation percentage by BMI subcategory. BMI, body mass index.
Table 2 provides the association of prepregnancy BMI subcategories with breastfeeding initiation based on three logistic regression models with increasing levels of adjustment, including an unadjusted model (left panel), a model adjusted for maternal demographics and comorbidities (middle panel), and a model adjusted for all study covariates (right panel). Increased BMI was associated with reduced breastfeeding initiation in all three models. In the model fully adjusted by maternal demographics and comorbidities, pregnancy characteristics, delivery characteristics, and fixed state effects (right most panel), there was a strong inverse relationship (Cochrane–Armitage Trend Test p < 0.001) between BMI classification and breastfeeding initiation. Compared to mothers who had a healthy prepregnancy BMI, there was decreased odds of breastfeeding initiation among mothers with Obesity Class I (adjusted odds ratio [aOR]: 0.884, 95% confidence interval [CI]: [0.880–0.888]), Obesity Class II (aOR: 0.816, 95% CI: [0.811–0.820]), Obesity Class III (aOR: 0.750, 95% CI: [0.745–0.755]), and Obesity Class IV (aOR: 0.672, 95% CI: [0.662–0.683]).
Unadjusted and Adjusted Association Between Body Mass Index Sub-categories and Breastfeeding Initiation
OR, odds ratio.
Non-Hispanic Black mothers and mothers who were not married, had less than a college education, had Medicaid coverage, or used tobacco had at least 80% lower odds of initiation breast feeding relative to their counterparts (see Appendix Table A4 for all adjusted ORs and CIs).
Discussion
This study evaluated a population of ∼16 million births from 2014 to 2021 to assess the impact of prepregnancy BMI on breastfeeding initiation before hospital discharge. We found that as BMI increased, breastfeeding initiation decreased. In 2019, the U.S. rate for breastfeeding initiation was greater than 83%. 18 This study found that among mothers giving birth and who had a prepregnancy BMI ≥50, breastfeeding initiation was 32.8% lower than mothers with healthy prepregnancy BMI, adjusting for covariates.
Previous studies have found that women with higher than a healthy BMI are less likely to initiate breastfeeding and more likely to also discontinue breastfeeding sooner (before 6 months postpartum) than woman with healthy BMI levels.7,19,20 Unmeasured confounders in this study that impact breastfeeding initiation as well as duration may be different for mothers with a BMI ≥50. Mothers with higher than healthy BMI may have delayed stage II lactogenesis due to raised progesterone levels. 8 Cesarean sections and diabetes, common in mothers with higher than healthy BMI, are also associated with delayed lactogenesis. 21 Mothers with a higher than healthy BMI may also experience an altered lower prolactin response to newborn breastfeeding. 9 Additional barriers to breastfeeding initiation and duration for mothers with higher than healthy BMI include psychosocial factors such as fewer social breastfeeding influences and body image stigma.22–24
It has also been shown that mothers in higher than healthy BMI may receive less, not more, help initiating breastfeeding than other mothers. 25 Identifying and understanding groups with reduced breastfeeding initiation are critical for development and implementation of successful breastfeeding support and outreach programs. Interventions aimed at increasing breastfeeding initiation among women with prepregnancy BMI exceeding 30 may include prenatal and postpartum telephone calls, provided breast pumps and slings, postpartum home visits, and peer counselor support.26–28 Interventions consisting of scheduled support showed higher impact than those requiring mothers to request assistance. 29
Of critical importance is understanding the need for lactation assistance that extends from the pregnancy through postpartum periods. Hospitals implementing the 10-Step Baby Friendly Hospital Initiatives (BFHI) 30 may diminish barriers to effective breastfeeding by introducing specialized education components. Namely, initiatives such as ensuring that staff have sufficient knowledge, competence, and skills to support breastfeeding and supporting mothers to initiate and maintain breastfeeding and manage common barriers.
Study limitations
There are possible limitations to this study due to the nature of the birth certificate data. First, California does not report breastfeeding initiation on the birth certificate, and some states also did not report breastfeeding data every year of the study, which may slightly limit the generalizability of our study. However, we included data from 300 state-years out of a possible 408. Second, the outcome measured in this study was the initiation of breastfeeding. While breastfeeding initiation before hospital discharge is an important first step for breastfeeding throughout infancy, it is not possible to determine the length of breastfeeding from the data used in this study. Relatedly, we were unable to separate mothers who did not wish to breastfeed versus those who attempted breastfeeding but were unsuccessful before discharge. Finally, some indicators included on birth certificates (e.g., tobacco use) are self-reported by the mother and may be subject to social desirability bias. Of note is that breastfeeding is recommended by the National Centers for Health Statistics to be collected by the medical record. 31
Conclusion
This national evaluation found a strong negative relationship between prepregnancy BMI and breastfeeding before hospital discharge following birth. Additional education and counselling for mothers with a greater than healthy BMI status may be warranted to support all mothers who wish to breastfeed their infants.
Footnotes
Authors' Contributions
Drs. A.G. and C.C.B. conceptualized and designed the study. Ms. M.B. carried out analysis and drafted the initial manuscript. All authors reviewed and revised the manuscript.
Disclaimer
The content of this study is solely the responsibility of the authors and does not necessarily represent the official views of the funders. Funders had no role in the design, analysis, or writing of this article.
Disclosure Statement
No competing financial interests exist.
Funding Information
C.C.B. reports receiving funding from National Institute on Minority Health and Health Disparities (1K01MD018072). M.B. reports receiving funding from National Institute on Minority Health and Health Disparities (5T32MD015016).
Appendix
Secondary Variables Adjusted Models
| Adjusted for maternal demographics and comorbidities aOR (95% CI) | Fully adjusted model aOR (95% CI) | |
|---|---|---|
| Mother's age (Ref.: 25–29) | ||
| Under 20 | 1.015 (1.009–1.021) | 0.730 (0.725–0.735) |
| 20–24 | 0.980 (0.976–0.984) | 0.894 (0.891–0.898) |
| 30–34 | 1.074 (1.070–1.078) | 1.096 (1.091–1.100) |
| 35–39 | 1.092 (1.086–1.097) | 1.123 (1.117–1.129) |
| 40+ | 1.087 (1.077–1.097) | 1.106 (1.095–1.116) |
| Mother's race/Hispanic Origin (Ref.: Non-Hispanic White) | ||
| Non-Hispanic Black | 0.792 (0.789–0.795) | 0.767 (0.764–0.770) |
| Non-Hispanic other | 1.281 (1.274–1.288) | 1.038 (1.032–1.044) |
| Hispanic | 2.362 (2.352–2.371) | 1.628 (1.621–1.635) |
| Marital status (Ref.: Married) | ||
| Unmarried | 0.567 (0.565–0.569) | 0.601 (0.599 0.603) |
| Mother's education (Ref.: College) | ||
| Less than high school | 0.402 (0.400–0.403) | 0.490 (0.488–0.493) |
| High school | 0.530 (0.529–0.532) | 0.591 (0.589–0.593) |
| Payment (Ref.: Private insurance) | ||
| Medicaid | 0.638 (0.635–0.640) | 0.785 (0.782–0.788) |
| Self-pay | 0.925 (0.917–0.933) | 1.060 (1.051–1.070) |
| Other | 0.974 (0.966–0.982) | 0.977 (0.969–0.986) |
| Hypertension eclampsia (Ref.: No) | ||
| Yes | 0.953 (0.925–0.982) | 0.929 (0.900–0.958) |
| Gestational hypertension (Ref.: No) | ||
| Yes | 0.989 (0.983–0.994) | 0.909 (0.903–0.914) |
| Pre-pregnancy hypertension (Ref.: No) | ||
| Yes | 0.816 (0.809–0.824) | 0.820 (0.813–0.828) |
| Gestational diabetes (Ref.: No) | ||
| Yes | 1.000 (0.994–1.006) | 0.997 (0.991–1.003) |
| Pre-pregnancy diabetes (Ref.: No) | ||
| Yes | 0.866 (0.853–0.879) | 0.887 (0.873–0.901) |
| Previous preterm birth (Ref.: No) | ||
| Yes | 0.764 (0.759–0.769) | 0.920 (0.913–0.927) |
| Delivery method (Ref.: Cesarean section) | ||
| Vaginal | 1.120 (1.116–1.123) | |
| Time of day (Ref.: Night) | ||
| Day | 0.956 (0.953–0.959) | |
| Time of week (Ref.: Weekend) | ||
| Weekday | 0.969 (0.965–0.972) | |
| Gestation age (Ref.: 37 weeks or more) | ||
| Under 37 weeks | 0.808 (0.804–0.812) | |
| Live birth order (Ref.: More than one) | ||
| One | 1.655 (1.650–1.661) | |
| Month prenatal care began (Ref.: Other) | ||
| Month 1–3 | 1.124 (1.120–1.128) | |
| Mother weight gain (Ref.: 41–98 pounds) | ||
| Less than 11 pounds | 0.876 (0.872–0.881) | |
| 11–20 pounds | 0.946 (0.941–0.950) | |
| 21–30 pounds | 1.008 (1.004–1.013) | |
| 31–40 pounds | 1.042 (1.037–1.047) | |
| Tobacco use (Ref.: No) | ||
| Yes | 0.520 (0.518–0.522) | |
| WIC supplemental nutrition program (Ref.: No) | ||
| Yes | 0.808 (0.806–0.811) |
aOR, adjusted odds ratio; CI, confidence interval.