
Abstract
Abstract
We present a new approach to population health, in which data-driven predictive models are learned for outcomes such as type 2 diabetes. Our approach enables risk assessment from readily available electronic claims data on large populations, without additional screening cost. Proposed model uncovers early and late-stage risk factors. Using administrative claims, pharmacy records, healthcare utilization, and laboratory results of 4.1 million individuals between 2005 and 2009, an initial set of 42,000 variables were derived that together describe the full health status and history of every individual. Machine learning was then used to methodically enhance predictive variable set and fit models predicting onset of type 2 diabetes in 2009–2011, 2010–2012, and 2011–2013. We compared the enhanced model with a parsimonious model consisting of known diabetes risk factors in a real-world environment, where missing values are common and prevalent. Furthermore, we analyzed novel and known risk factors emerging from the model at different age groups at different stages before the onset. Parsimonious model using 21 classic diabetes risk factors resulted in area under ROC curve (AUC) of 0.75 for diabetes prediction within a 2-year window following the baseline. The enhanced model increased the AUC to 0.80, with about 900 variables selected as predictive (p < 0.0001 for differences between AUCs). Similar improvements were observed for models predicting diabetes onset 1–3 years and 2–4 years after baseline. The enhanced model improved positive predictive value by at least 50% and identified novel surrogate risk factors for type 2 diabetes, such as chronic liver disease (odds ratio [OR] 3.71), high alanine aminotransferase (OR 2.26), esophageal reflux (OR 1.85), and history of acute bronchitis (OR 1.45). Liver risk factors emerge later in the process of diabetes development compared with obesity-related factors such as hypertension and high hemoglobin A1c. In conclusion, population-level risk prediction for type 2 diabetes using readily available administrative data is feasible and has better prediction performance than classical diabetes risk prediction algorithms on very large populations with missing data. The new model enables intervention allocation at national scale quickly and accurately and recovers potentially novel risk factors at different stages before the disease onset.
Introduction
The recent availability of the electronic health record and claims datasets offers an unprecedented opportunity to apply predictive analytics to improve the practice of medicine and to infer potentially novel risk factors.1–3 Successful examples of previously deployed large-scale risk assessment models include hospital readmission models,4,5 disease onset prediction,6–13 and prediction of healthcare utilization and cost. 14
Type 2 diabetes is a global public health challenge. The total number of people with diabetes (including type 1 and 2) is estimated to rise from 171 million in 2000 to 366 million in 2030, 15 and current statistics show that the vast majority of diabetic patients are suffering from type 2 diabetes. 16 In 2002, the Centers for Disease Control (CDC) Diabetes Prevention Program (DPP) 17 showed that intensive lifestyle intervention 18 focusing on exercise and weight loss was more effective at lowering the risk of type 2 diabetes than medication with Metformin. Similar studies in other countries have confirmed the benefits.19–21
Despite the academic success of the DPP, implementation of the program by major insurance or public health service providers has been hindered by a number of limitations. The interventions can only be cost-effective when the target population has a high likelihood of developing diabetes at the baseline. 22 The DPP program, which selected participants based on obesity and elevated glucose levels, observed only an 11% positive predictive value (PPV) 18 (i.e., only 11% of the participants without any lifestyle or Metformin intervention developed diabetes within 3 years). This emphasizes the need for models with better risk assessment for diabetes onset. Traditional well-known models for type 2 diabetes onset, including ARIC, 23 San-Antonio, 24 AUSDRISK, 25 and FINDRISC, 26 provide potential solutions for more accurate risk assessment, but these models have another major limitation: they require a time-consuming and costly screening step, which again makes the interventions infeasible.
The primary purpose of our study is to develop a population-level risk prediction model for type 2 diabetes, which can be directly applied to health insurance claims and other readily available clinical and utilization data. Using machine learning, we methodically discover surrogates for variables that would otherwise be missing.
The secondary purpose of our study is to identify the relative importance of different risk factors in terms of how early they may predict onset of type 2 diabetes. Observational studies using clinical and utilization data provide a window into the lives of patients before clinical diagnosis of type 2 diabetes at a scale much larger than what would be feasible within the scope of a clinical trial or prospective cohort study.
Materials and Methods
We performed a retrospective cohort study of beneficiaries of Independence Blue Cross (Independence), a major insurance provider in southeastern Pennsylvania. The primary data source for the study was Independence claims data, which included enrollment information, utilization records such as hospitalizations, outpatient visits, laboratory orders, and medication fulfillment, for all beneficiaries, and laboratory test results for 95% of the laboratory claims.
Our initial population included ∼4.1 million deidentified Independence beneficiaries, at least 18 years of age, who enrolled in Independence's insurance program between the years 2005 and 2013.
Outcome
Our primary outcome was the confirmed diagnosis of type 2 diabetes. A beneficiary was confirmed as having type 2 diabetes if any of the following three criteria were observed on two distinct days: (1) an International Classification of Diseases, Clinical Modification (ICD-9-CM) code of 250.xx, listed as a hospital discharge diagnosis or physician clinical encounter; (2) use of a diabetes medication, including Glimepiride, Glipizide, Glyburide, Chlorpropamide, Tolazamide, Tolbutamide, Pioglitazone, Rosiglitazone, Acarbose, Miglitol, Repaglinide, Nateglinide, Sitagliptin, Saxagliptin, Linagliptin, Alogliptin, Pramlintide, Exenatide, Liraglutide, Canagliflozin, and Insulin (any); or (3) HbA1C value ≥6.5%. The list of medications was based on existing diabetes outcome definitions, 27 and we excluded Metformin from the definition of diabetes due to its significant usage in treatment of polycystic ovarian syndrome 28 and prediabetes. To derive our final outcome definition, we compared the performance of multiple clinically relevant definitions of diabetes among a representative subgroup of beneficiaries who, based on the Standard of Care for Diabetes, 29 could be definitively labeled as either having diabetes or being free from diabetes (see Supplementary Material, Part-A; Supplementary Data are available online at www.liebertpub.com/big).
Parsimonious model based on known risk factors: baseline
We built a parsimonious baseline model, using risk factors derived from seven landmark studies of risk prediction models for predicting incident diabetes: ARIC, 23 KORA, 30 FRAMINGHAM, 31 AUSDRISC, 25 FINDRISC, 26 and the San-Antonio Model. 24 To build our parsimonious model, we included every variable that was used in any of these models for which we had direct or surrogate measurements. The variables include age (continuous variable), gender (binary indicator), overweight (binary indicator), underweight (binary indicator), diagnosis of obesity (binary indicator), hypercholesterolemia history (binary indicator), cardiovascular disease history (binary indicator), lipid disorder history (binary indicator), history of high alcohol in blood (binary indicator), history of unspecified hypertension (binary indicator), prediabetic fasting glucose level (binary variable, set to 1 if the fasting glucose level was ≥100.0 and ≤125.0), high triglyceride level (binary variable, set to 1 if the triglyceride level was ≥150.0), high C-reactive protein level (binary variable, set to 1 if level ≥0.75 percentile), 32 and a protective HDL-C level (binary variable, set to 1 if value ≥40 for male or ≥50 for female). We included the diagnosis of obesity as a surrogate variable for high body–mass index (BMI), and the diagnoses of hypertension and hypertensive heart and renal diseases as surrogates for elevated blood pressure. Because the cited models were not developed for use with claims datasets, and moreover in some cases we used surrogates for variables not observable in claims data, we retrained the parameters of the parsimonious baseline using the training data.
Enhanced model
We next built an enhanced model using beneficiary demographics (11 continuous and binary variables), including age as one continuous variable in addition to three binary variables for age intervals of 18–39, 40–64, and 65+ years, gender, and number of months with vision and dental insurance coverage; all past and current medical conditions (16,632 binary variables); temporal procedures received (457 variables for each of three different time intervals); temporal physician specialty visits (50 × 3 binary variables); temporal laboratory orders and results (7000 × 3 binary variables); and temporal medication utilization (990 × 3 binary variables). For all temporal variables, we calculated the feature over the past 6 months, 24 months, and entire past history. If a variable was not observed, it was referenced as 0 and we did not impute it.
Medical conditions were encoded as indicator variables based on all International Classification of Diseases (ICD-9) diagnosis codes. In our initial studies, we had used the Clinical Classification Software (CCS) 33 hierarchy of ICD-9 codes in a temporal manner. However, we saw no gain in the predictive power compared with using individual diagnosis variables. To preserve the granularity of the risk factors, we therefore did not encode past medical conditions temporally or hierarchically. Procedure information variables were based on the Current Procedure Terminology (CPT) and ICD-9 procedural codes, each grouped by CCS. 33 Additional variables included indicators for visiting every physician specialty possible in clinical encounters (which are available in claims data) and indicators for all medications as specified by the national drug code and grouped by therapeutic class codes.
Patient laboratory measurement variables were based on logical observation identifiers, names, and codes. We used the 1000 most frequent laboratory tests based on our cohort. For each of these laboratory tests at each time span considered, we derived seven variables: an indicator of whether the test was administered, an indicator for whether the result was reported as low, high, or normal according to the reference range of the laboratory, and whether the value increased, decreased, or fluctuated.
In total, each beneficiary was represented as a set of ∼42,000 variables that summarized all their past and current medical states. We emphasize that these variables were not selected specifically for the purpose of studying type 2 diabetes. Our approach thus has the potential to discover novel risk factors associated with type 2 diabetes.
Study framework and inclusion criteria
We designed our study to determine the risk of developing type 2 diabetes in three time spans into the future. We built the feature vectors from beneficiary data up to December 31, 2008. We then predicted whether subjects were to develop type 2 diabetes within a 2-year prediction window: immediately within the following 2 years (i.e., between January 1, 2009, and January 1, 2011); at least 1 year into the future (i.e., between January 1, 2010, and January 1, 2012); or at least 2 years into the future (i.e., between January 1, 2011, and January 1, 2013). For each of these analyses, we excluded beneficiaries who had already developed diabetes before the start of the prediction window. We required a minimum of 6 months of enrollment before December 31, 2008, to include the beneficiary in our study. The framework is summarized in Figure 1. We refer to the time span between data collection and the beginning of the prediction window as the gap period.
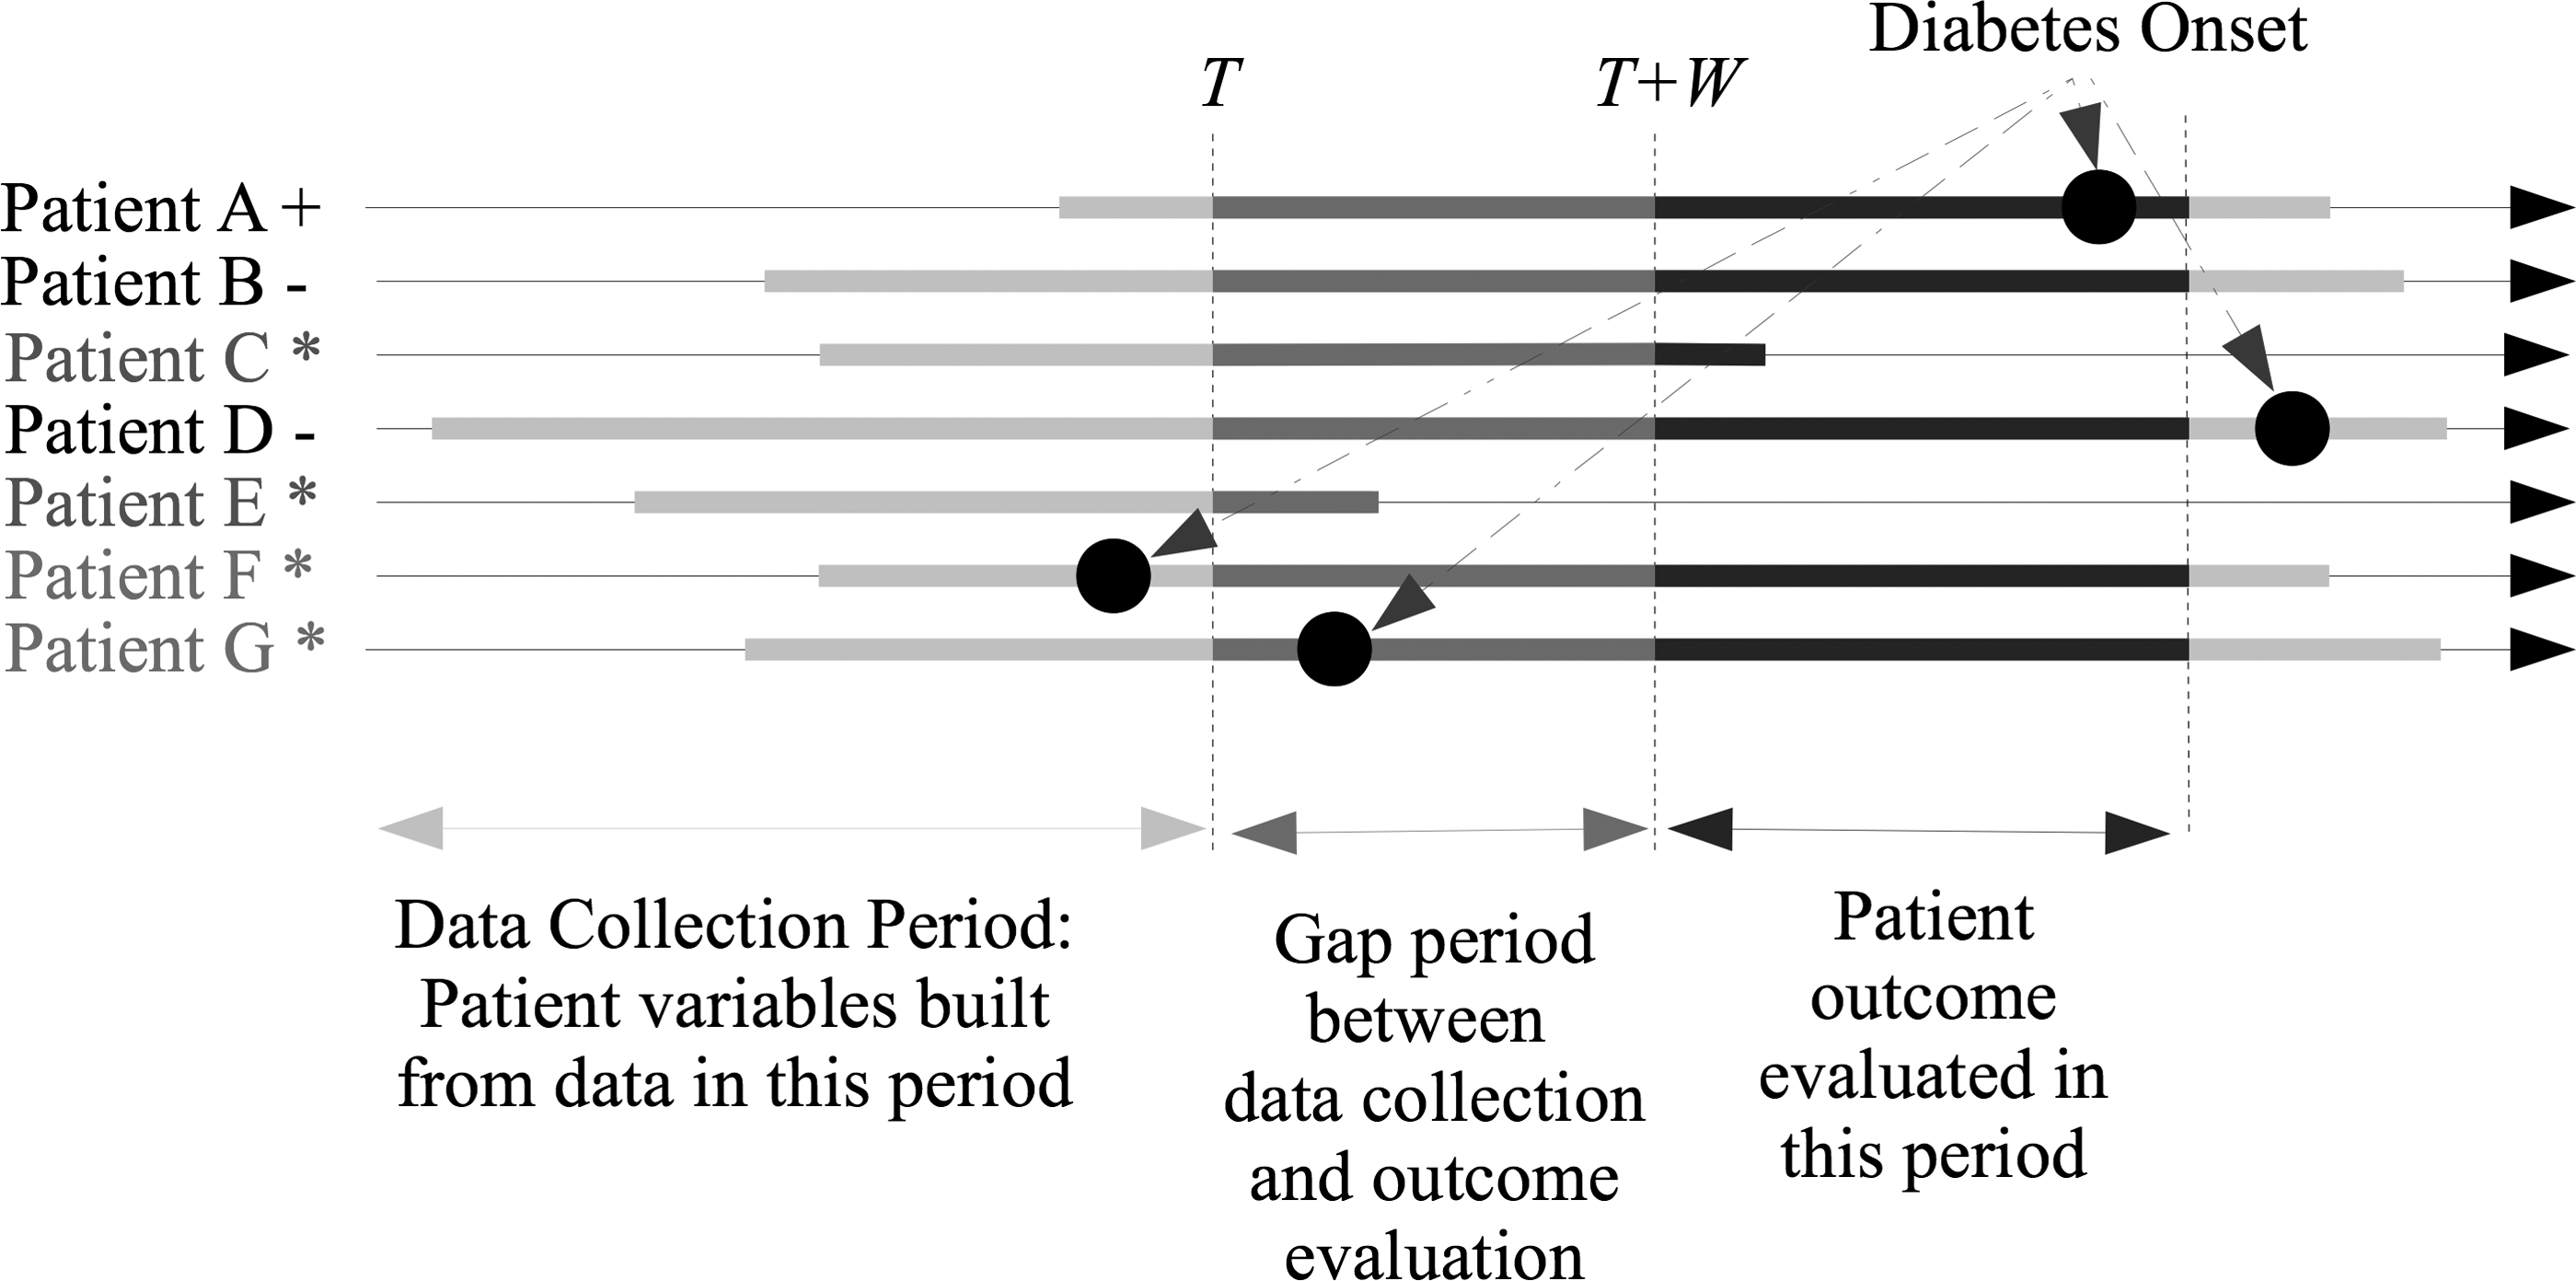
Framework for the prediction task. Features are derived from patient data up to time T. Outcome is evaluated in the 2-year follow-up window after a gap of size W. Patients who have diabetes before T + W, or have insufficient enrollment, are excluded during training and evaluation (denoted as *). Patient outcome is positive (denoted as +) if diabetes onset happens in the outcome evaluation period and negative (denoted as −) otherwise.
Statistical analysis
We developed the prediction models using sparse, or L1-regularized, logistic regression. 34 This method provides a computationally efficient alternative to commonly used variable selection methods, such as forward selection and backward elimination, and eliminates both variable ordering bias and the need to adjust for the p-value inflation coming from multiple comparison tests on the same dataset. 35 L1 regularization simultaneously searches over all relevant and irrelevant variables. 36 It comes with a strong mathematical guarantee to recover the true set of predictors and learn the corresponding beta coefficients, even when the number of samples is smaller than the number of irrelevant variables. 37
L1 regularization works by adding a penalty to the classification loss. This penalty is the sum of absolute values of the coefficients (called L1 penalty) and guides the optimization algorithm to select a beta coefficient vector that pushes very low weights to zero when those low weights do not improve the accuracy of the prediction. As a result, the final beta coefficient vectors will be sparse, interpretable, robust to noise, and statistically powerful. Fast algorithms to optimize the accuracy of such models are available.36,38 We use an algorithm based on Dual Coordinate Descent, 38 which handles massive datasets very efficiently, to train these models from data.39,40 We optimized a reweighted log likelihood to correct for the class imbalance during the training. We use the area under the ROC curve (AUC) as the primary evaluation metric. AUC is invariant to the prior class probabilities and thus suitable for imbalanced datasets.
We used randomly selected 67% of the data for training, with the remaining 33% held out for the validation set, and used a fivefold cross-validation on the training data to choose the L1 regularization hyperparameter. For regularization parameters, we searched over values of [0.001, 0.01, 0.1, 1, 10], and 0.1 was selected to be optimum in all our settings and cross-validation folds. We used the same methodology and the reweighted log likelihood objective to fit the parameters of the parsimonious model. Additional details of our method for presenting the results are included in Supplementary Part-B.
For each predictive model, we calculated the AUC on the validation set. We also report a PPV for the 100, 1000, and 10,000 individuals predicted to develop diabetes with highest probability based on our enhanced models, compared with the parsimonious model, using the validation data. We calculated the odds ratio (OR) for each discovered risk factor and present them for three age categories. In all cases, we report the unadjusted ORs directly calculated from the data, which link each risk factor to diabetes onset independently of the other variables. For all reported risk factors, we reported 95% confidence intervals (CIs) in addition to p-values for the ORs. To report AUC CIs, we used a standard error upper bound 41 and reported 95% CIs. For PPV, we reported 95% CI. 42 In all comparisons, we used the Wald test for reporting p-values of differences.
Results
Data
The original cohort included about 4.1 million beneficiaries. A total of 793,153 beneficiaries matched the inclusion criteria for predicting onset of type 2 diabetes between January 1, 2009, and January 1, 2011, using beneficiaries' data through December 31, 2008. These beneficiaries' characteristics are included in Table 1. Of these, 19,307 developed diabetes within the prediction window. After training, 967 variables were selected for the enhanced model. For predicting onset of type 2 diabetes between January 1, 2010, and January 1, 2012 (gap period 1 year), a total of 697,502 beneficiaries matched the inclusion criteria; of these 13,835 beneficiaries developed diabetes within the prediction window. After training, 769 variables were selected in the enhanced model as predictive. For predicting onset of type 2 diabetes between January 1, 2011, and January 1, 2013, 629,817 beneficiaries matched our inclusion criteria, 8498 of which had a positive label in the prediction window. After training, 538 variables were selected as predictive.
SD, standard deviation.
Prediction results
For immediate prediction of diabetes, the enhanced model had an AUC of 0.80 compared with an AUC of 0.75 for the baseline parsimonious model (p < 0.0001). The AUCs of the enhanced models were also superior to those of the parsimonious models for prediction of diabetes in the 1- or 2-year gap periods (Table 2). Similarly, PPV values for the top 100, 1000, and 10,000 beneficiaries predicted to be diabetic were between 1.6 and 2.3 times higher in the enhanced model than the parsimonious model (Table 2). Our models are highly specific, and the sensitivity increases to 21% at the 10,000 level. The ROC curves corresponding to the enhanced versus parsimonious models for different gap periods are included in Figure 2. Predicting onset of diabetes further into the future, with a larger gap between data collection and the evaluation window, is (expectedly) less accurate.
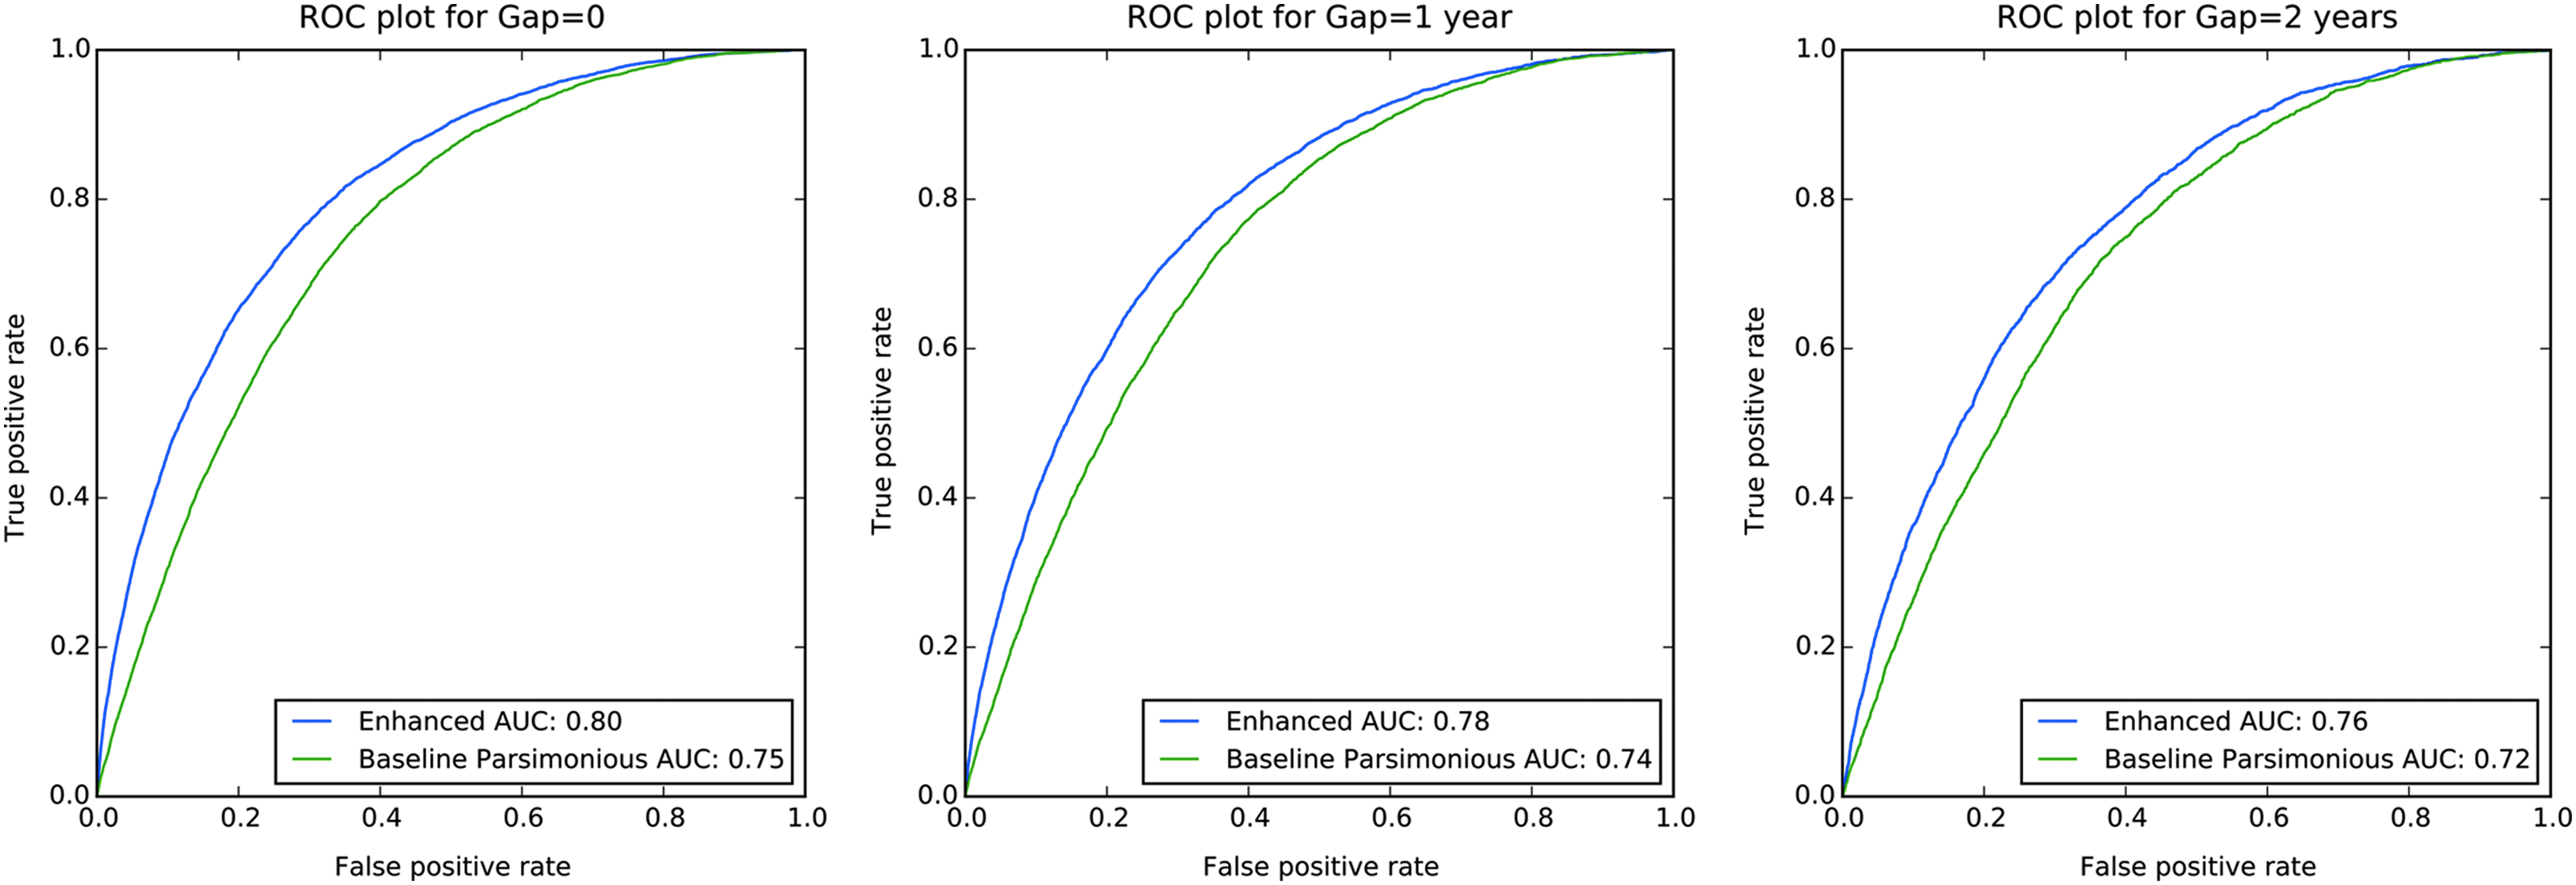
ROC curves for predicting type 2 diabetes onset for 0, 1, and 2 years into the future.
Differences in AUC significant with p < 0.0001 in this validation set.
All reported values have 95% CI of less than 0.002.
AUC, area under curve; CI, confidence interval; PPV, positive predictive value.
Table 3 shows the top predictive variables for immediate onset of diabetes. Most top variables are directly related to prediabetes or diabetes, including history of prediabetes or related conditions, elevated glucose, elevated HbA1c, and Metformin medication utilization. However, other variables, such as history of sleep apnea, acute bronchitis, hypothyroidism, and anemia, as well as high serum alanine aminotransferase, have significant predictive value for immediate confirmation of onset of diabetes. Measures of healthcare utilization also contribute to the prediction of onset of type 2 diabetes. Expanded lists of the laboratory values and disease history that are predictive of diabetes diagnosis are included in Supplementary Tables S1 and S2. Noteworthy is the difference in the OR within the young, middle-aged, and older population for different factors. Specifically, the OR of all risk factors is higher when the factor is observed in younger individuals. OR of factors such as elevated HbA1c and glucose in the young population is almost thrice that of the middle-aged population, and almost four times that of the older population.
Shown here are the variables with the highest magnitude of beta coefficient, sorted by the unadjusted OR.
Entire history refers to our current setting and cohort, which is limited to max 4 years before 2009.
OR, odds ratio.
Table 4 shows the top predictive variables for diabetes onset within 1 to 3 years after the data collection period (gap = 1). Not surprisingly, previously identified risk factors such as high glucose, high HbA1c, obesity, and impaired fasting glucose emerged as strongly predictive of diabetes diagnosis. Interestingly, 1 year before the confirmed diagnosis of diabetes, shortness of breath, esophageal reflux, and acute bronchitis also have significant predictive value. Healthcare usage variables such as need for emergency room service and routine child health examination are also significant in assessment of risk of impending diabetes. Expanded lists of predictive laboratory values and disease history are included in Supplementary Tables S3 and S4. The top predictive variables for the model with the 2-year gap are included in Supplementary Table S5.
Shown here are the variables with the highest magnitude of beta coefficient, sorted by the unadjusted OR.
Entire history refers to our current setting and cohort, which is limited to max 4 years before 2009.
LOINC, logical observation identifiers, names, and codes; NDC, national drug code.
Discussion
Related work on machine learning and data mining for early detection of type 2 diabetes can be categorized into three groups. The first group of related works uses the classic clinical diabetes risk prediction studies,23–26,30 which focus on large cohorts, but rely on small feature sets and logistic regression models. Our parsimonious baseline is based on these models. The second group uses classical diabetes risk factors as features, but focuses on comparing machine learning models such as Support Vector Machines, 43 CART, 44 and decision trees 45 to combine the features.46–49 These models do not consider the potential impact of using a broader set of features. In contrast, our work uses a broad, rich, set of features together with a linear model trained with L1-regularized logistic regression. Although it is beyond the scope of the current study to explore in detail, we found that this was better than or comparable with carefully tuned random forests, 50 gradient-boosted decision trees, 51 and neural networks 52 on our dataset.
The third group of related work considers a broader set of features, which can be utilized to predict outcomes such as heart failure12,53 and the occurrence of urgent care events and uncontrolled A1c for diabetic patients. 6 These related works also use (variants of) logistic regression for predictive modeling. Our approach is related to this group in terms of the generalizability of the method to multiple outcomes. However, we focus on diabetes onset as the outcome and provide an in-depth analysis of the selected features. Moreover, we investigate differences in risk factors at multiple stages before the disease onset. The temporal aspect of the risk factors, both in terms of early or late risk factors, 46 and also the temporal trends for variables such as laboratory measurements54,55 are less studied. Temporal features are often studied for a handful of variables at a time, whereas in our study, we utilize basic temporal patterns on all 1000 laboratory measurements.
The present study is the largest study to date of early detection of type 2 diabetes, both in terms of cohort size and the number of variables considered. Model fitting and validation were conducted using more than 42,000 variables. Hundreds of variables were selected as predictive of future type 2 diabetes. We demonstrated that compared with using a parsimonious set of variables, using big data and machine learning improves PPVs by 67% and AUC by 6.6%. The resulting models are already deployed at Independence Blue Cross for the purpose of intervention allocation.
Our risk models do not require additional 56 tests, screening, or chart reviews beyond what is readily available in health records and administrative data. This allows our approach to scale to millions of beneficiaries on a regular schedule. The reported sensitivity, specificity, and positive predictive values for our models can provide guidance for intervention targeting. For focused high-cost interventions, our method is able to (with 37% positive predictive value compared with only 12% using the parsimonious baseline) select the most vulnerable. When the interventions are more scalable, they could be performed on the 10,000 most vulnerable individuals, with a sensitivity of 21.6% in a validation set of more than 220,000 beneficiaries compared with only 11.4% using traditional risk prediction methods.
Our study is strengthened by a derived definition for diabetes, which was found to have a highly accurate definition of diabetes in our dataset. This is an important strength as prior studies of predictive modeling for diabetes have primarily relied on screening tests and clinical evaluation on specific clinical visits.23–26
Our models include both known risk factors for diabetes and less established risk factors, many of which are likely surrogates for established risk factors. Many of the strongest predictors in our models describe prediabetes or elements of the metabolic syndrome, including elevated HbA1c, high blood sugar, and hyperlipidemia (Tables 3 and 4). While obesity was found to be predictive of diabetes in our model (Tables 3 and 4), it was likely underreported in the insurance claims as only 6% of beneficiaries were documented as obese, despite 35% of the American population being defined as obese according to the CDC. 57 As a result, some less traditional risk factors found in our models may be acting as partial surrogates for obesity and its risk on the development of diabetes. For instance, esophageal reflux, which is documented for 12.6% of our population (Table 4), is known to have a high prevalence in obesity and may act as a surrogate for obesity in our data.58,59 Similarly, sleep apnea and markers of inflammation such as leukocytosis have known associations with metabolic syndrome (Tables 3 and 4). 60 We also found other makers of cardiovascular disease, such as coronary atherosclerosis (Supplementary Table S2), hypertension (Tables 3 and 4), and kidney disease (Table 4 and Supplementary Tables S1–S3), to be predictive of diabetes onset. Although these conditions may be complications of diabetes, they also may be risk factors or diagnosed before diabetes onset.61,62
A number of risk factors related to liver disease were included in the predictive model for diabetes, including elevated alanine aminotransferase (Table 3 and Supplementary Tables S1 and S3) and the presence of chronic liver disease (Table 3 and Supplementary Tables S2 and S4). Elevated liver function tests are early manifestations of insulin resistance 63 and are detectable earlier than fasting glycemia. 64 Nonalcoholic fatty liver disease (Supplementary Tables S2 and S4) has a well-documented association with both obesity and diabetes. 65 Our method also selects hypothyroidism (Table 3 and Supplementary Table S4), which has known causal effects for insulin resistance, 66 as predictive. Our model also included a number of cardiopulmonary findings, including acute bronchitis (Tables 3 and 4), shortness of breath (Table 4), and chest X-rays (Tables 3 and 4), as predictive for diabetes. While we are unable to make any direct associated link, these factors may reflect association between cardiovascular diseases such as heart failure with subsequent diabetes or may point to an association that individuals with acute pulmonary conditions may be at risk for the development of diabetes.
Our study has several limitations. First, there may be more missing data among beneficiaries who have only recently enrolled in the health insurance plan or who have little healthcare utilization, reducing the sensitivity of the model among these beneficiaries. A possible solution would be to complement the administrative data with data gathered by other sources, such as by mobile health applications. Second, the study population may not be representative of the whole of the United States as 80% of the studied population resides in the greater Philadelphia, which may contribute both demographic and behavioral bias. However, we emphasize that our models can be easily retrained with other insurance companies' or providers' data. Third, since our outcome is derived from clinical and utilization data, we are unable to determine if a person has existing, but undiagnosed and untreated, type 2 diabetes. Due to the lack of a true gold standard for diabetes in our population, we were unable to confirm the sensitivity of our diabetes definition. Fourth, our parsimonious model used obesity as a surrogate measure for BMI. We found that the obesity diagnosis was likely underreported in our dataset, which may have limited the accuracy of the parsimonious model. Nonetheless, such limitations are common in claims datasets and highlight why previous models may not always be practical for population-level risk assessment.
Conclusion
Machine learning on administrative data provides a powerful new tool for population health and clinical hypothesis generation for risk factor discovery, enabling population-level risk assessment that may help guide interventions to the most at-risk population. Using the approach described herein, it is possible to identify patients likely to develop type 2 diabetes with at least 67% better PPV compared with traditional risk assessment methods for 0–2 years into the future. The extensive set of risk factors recovered by our method, for different stages of disease onset, can be a basis for additional hypothesis testing in medical research laboratories. Finally, our approach is general enough to be applied to different outcomes of interest, to build predictive models for different years into the future, and to analyze the risk factors as they emerge at different stages before the onset.
Footnotes
Acknowledgments
The authors thank Ravi Chawla for comments on the manuscript and Rahul Krishnan and Youngduck Choi for technical assistance. D.S. had full access to all the data in the study and takes responsibility for the integrity of the data and the accuracy of the data analysis.
Author Disclosure Statement
Research was financially supported by a grant from Independence Blue Cross, which also contributed the data for the study. The sponsor collected the data, reviewed the manuscript, and approved the decision to submit the manuscript for publication. All authors contributed to the conception and design of the study. N.R., S.B., A.M.S., and D.S. interpreted the data and performed the statistical analysis. N.R. drafted the manuscript, and all authors performed critical revision of the manuscript. Two authors, A.S.-M. and S.N., are employees at Independence Blue Cross. There are no other conflicts of interest to report.
Abbreviations Used
References
Supplementary Material
Please find the following supplemental material available below.
For Open Access articles published under a Creative Commons License, all supplemental material carries the same license as the article it is associated with.
For non-Open Access articles published, all supplemental material carries a non-exclusive license, and permission requests for re-use of supplemental material or any part of supplemental material shall be sent directly to the copyright owner as specified in the copyright notice associated with the article.