
Abstract
Abstract
Historically, domains such as business intelligence would require a single analyst to engage with data, develop a model, answer operational questions, and predict future behaviors. However, as the problems and domains become more complex, organizations are employing teams of analysts to explore and model data to generate knowledge. Furthermore, given the rapid increase in data collection, organizations are struggling to develop practices for intelligence analysis in the era of big data. Currently, a variety of machine learning and data mining techniques are available to model data and to generate insights and predictions, and developments in the field of visual analytics have focused on how to effectively link data mining algorithms with interactive visuals to enable analysts to explore, understand, and interact with data and data models. Although studies have explored the role of single analysts in the visual analytics pipeline, little work has explored the role of teamwork and visual analytics in the analysis of big data. In this article, we present an experiment integrating statistical models, visual analytics techniques, and user experiments to study the role of teamwork in predictive analytics. We frame our experiment around the analysis of social media data for box office prediction problems and compare the prediction performance of teams, groups, and individuals. Our results indicate that a team's performance is mediated by the team's characteristics such as openness of individual members to others' positions and the type of planning that goes into the team's analysis. These findings have important implications for how organizations should create teams in order to make effective use of information from their analytic models.
Introduction
As the amount of data being generated has increased, intelligence analysis has begun to rely largely on automated analyses. However, a critical step in the knowledge generation process is fusing all of the relevant and contextual information from data, data analysis, and domain expertise. As such, intelligence analysis in the era of big data necessitates the integration of automatic analysis and human knowledge in the decision-making process. However, not all analysts are created equally, and as the breadth of problems has increased, the domain knowledge needed to gain knowledge from data analysis has also increased. As such, many intelligence analysis problems now require teams of experts who can bring multiple fields of expertise to bear on a problem. Unfortunately, the Intelligence Community still places much of its emphasis on individual contributions, even though recent work has demonstrated that teamwork in intelligence analysis has been shown to reduce biases,1,2 lead to more accurate forecasting of events, 3 and improve overall intelligence analysis. 4
This problem of the individual as the analyst is further compounded by a lack of tools that can support collaboration, and although the visualization community has defined challenges for collaborative visualization, 5 there are few studies comparing how individuals, groups, and teams would engage with a visual analytics (VA) environment. Although some work has been done on collaboration analysis in VA systems,6,7 these systems often focus on enabling group communication and do not encourage work as a real team. What we mean is that in teamwork, each member has his or her expertise in a particular domain and is responsible for a part of the work. This requires team members to further discuss and share opinions and discoveries with teammates as they work toward a common goal that would be too large for a single analyst.
Literature reporting on intelligence issues often depicts analysts as socially interacting with one another, working together, collaborating, and corroborating each other's analysis before the results are moved up the chain of command.8,9 However, teams are more than a collection of analysts (a group) working together, 10 because team members have specific roles, responsibilities, and work toward a common goal interdependently, adaptively, and dynamically. 11 Incorporating teamwork into the intelligence process would mean that analysts work on intelligence problems together, from the start, with each analyst fulfilling a different role, working on certain pieces of an analysis, developing expertise within a given problem statement, and collaborating and coordinating through communication to assess intelligence issues. The added benefit of teamwork in the intelligence process is that it extends an individual's capabilities by adding various abilities, skills, experiences, and knowledge to the intelligence process. 12
To study how teams may perform predictive analytics tasks, we have conducted a user experiment that integrates big data intelligence, VA, and teamwork analysis. The experiment involves 90 participants in three conditions (Individual, Group, and Team) who predict the opening weekend gross of movies by using large-scale social media data and a suite of VA tools. By investigating the prediction performance, collaboration between team members, and characteristics of participants, we show that teamwork may not necessarily improve the prediction accuracy while their performance could be mediated by their characteristics and collaboration mode.
Related Work
The importance of teamwork in intelligence has been demonstrated in many situations. For instance, it is generally acknowledged that systematic communication, collaboration, and coordination failures among analysts have contributed to some of the most recent intelligence failures, for example, the 9/11 terrorist attack and Iraqi weapons of mass destruction. 13 Although most of today's intelligence analysis is still conducted individually, 2 the complexity of analyzing big data will soon surpass the abilities of an individual analysis and will require a shift toward teamwork analysis. 12 The intelligence literature indicates the need for more empirical studies within the intelligence domain, particularly when it comes to what role teamwork plays within the intelligence process.2,14,15
Team cognition
Intelligence analysts' work is predominantly cognitive in nature, and team cognition, defined as cognitive processes occurring at the team level, 16 is an important aspect of team intelligence analysis. Thus, understanding teams' cognitive processes requires that we observe how teams learn, reason, problem solve, decide, and make judgments. 17 By assessing the teams' cognitive processes, we can parse out which processes lead to better assessments of intelligence issues and which ones do not. Furthermore, team cognition is closely tied to team performance,18,19 and developing infrastructure to support team cognition should equate to superior intelligence analysis.
Interactive Team Cognition (ITC), a theory proposed by Cooke et al., 17 states that team cognition is an activity, not a property or product, that needs to be measured at the team level and is closely tied to context. This view, contrary to the more traditional theories of team cognition, emphasizes cognition that develops through interactions among team members. Although this theory does not dismiss the importance of individual-based knowledge, which is necessary, it does dismiss the notion that the sum of all individual-based knowledge equals team cognition. Through interactions, team members bounce ideas back and forth, learn from one another, gain new insights, and, more importantly, develop solutions to intricate problems. Therefore, team cognition unfolds in real time, as members communicate with one another. In turn, measuring team cognition equates to monitoring team communication in context and, preferably, in real time. As such, our experiments emphasize team interactions as well as the overall performance.
The team analytical process
There has been some progress toward using teamwork within the Intelligence Community, but, overall, this effort seems to be limited. For instance, intelligence colleges may require their students to work together while analyzing intelligence issues as part of their assignments20,21; however, this generally does not translate to real-world situations. Once graduated, most of the intelligence work is still conducted individually. 12 Nonetheless, simply advocating the need for teamwork in Intelligence is not sufficient; one needs to demonstrate its associated benefits during the analytical process first. For example, Mellers et al. 3 conducted a large-scale, 2-year, geopolitical forecasting tournament in which 743 forecasters participated. These “analysts” generated >150,000 forecasts on 199 events, ranging from North Korea security concerns to the Greece debt crisis. In the first year of the experiment, the researchers manipulated group composition (independent forecasters, crowd-belief forecasters, and team forecasters), as well as training (probabilistic-reasoning training, scenario training, and no training). During the second year, similar manipulations were conducted again, with group compositions being one manipulation (team forecasters vs. independent forecasters) and training (probabilistic-reasoning training and no training) being the other.
One of their main findings during both years was that forecasting teams outperformed all other forecasters (independent forecasters and crowd-belief forecasters). The researchers attributed the teams' success to collaboration and knowledge sharing. They also hypothesized that working in teams increased motivation, partly because team members may have not wanted to let each other down. Although other competencies played a significant part in ensuring successful analysis, it showed that, with all else being equal, collaborative teams outperformed all other forecasters. However, the researchers did not measure team cognition to understand precisely why teams outperformed independent forecasters or crowd-belief forecasters.
The purpose of the study reported here is to evaluate the role of teamwork in analyzing big data compared with group and individual work. The current study used a team testbed to investigate whether the results from previous team studies can be extended to intelligence analysis more generally. The next section describes the analytic testbed, the data behind it, and the task given to the participants. This is followed by a description of the experimental design, methods, measures, and hypotheses that incorporated the testbed and the task. Other than previous works, we find in our experiment that team forecasters do not always perform better than other forecasters (individuals and groups), and their performance also depends on the collaboration between team members.
The Analytic Testbed
The testbed is an abstracted version of the analysts' tasks that uses box office earning of movies as an analog to intelligence information. The task requires participants to have previously acquired knowledge (i.e., background knowledge about the movies) and the ability to extract and integrate information through the analytics process. This analog allows researchers to investigate the domain of intelligence analysis without having to gain security clearances and access to analysts.
In our study, the participants interact with the VA framework that uses social media data (Twitter) to model opening weekend movies' earnings.22,23 In addition, our framework supports more advanced intelligence analysis, such as comparing similar movies and examining the word of mouth for each movie by looking at its tweets sentiment polarity. We also explored whether predictive models were useful during analysis, as well as meaningful ways to visualize “big” data. The general study procedure is to have participants predict four movies' opening weekend grosses, where the first prediction is a practice prediction that is used to solidify learned material and practice using the tool. Before starting their prediction, standard training and a quiz are given to make sure that subjects have mastered the usage and proper understanding of the system.
Dataset
Our box office prediction task uses a movie's metadata and related tweets. The metadata are collected from the Internet Movie Database (IMDB), and we have used the movie's release date, genre, Motion Picture Association of America (MPAA) rating, and estimated budget. For social media data, following the data collection strategy of 2013 VAST Box Office challenge, 23 we have collected movie-related tweets for 214 movies that were widely released in the United States from January 2013 to January 2015. Tweets are crawled by using the Twitter Streaming API 24 by searching the hashtag keywords extracted from a movie's official tweet account. In this work, we use tweets posted 2 weeks before each movie's release date, totaling 4,795,176 tweets.
VA system design
VA is the science of analytic reasoning facilitated by interactive visual interfaces.
25
Our intelligence analysis utilizes a previously developed VA framework for box office analysis and prediction that has been modified to: (1) facilitate the recording and implementation of the experiment, and (2) provide a convenient way for analysts to explore and analyze the data. Extracting useful information from the large-scale, noisy, and unstructured social media data is critical in the data processing step, and the results are integrated in the VA system so that the participants can easily use the abstracted information. We have extracted a list of numerical and nominal features, summarized in Table 1, that are used in this experiment. For the intelligence analysis task, we use the model proposed in our previous work
23
to assist with the predictions. The following linear regression model [Eq. (1)] is used for a single movie's box office prediction. With an ∼0.6 R2,22,23 this model is far from an accurate prediction and it encourages participants to explore the data and utilize their domain knowledge and analysis to generate confident predictions.
IMDB, Internet Movie Database; MPAA, Motion Picture Association of America; TBD, tweets by day; TSS, tweet sentiment score; MSS, movie sentiment score.
In addition to the regression model, a weekend revenue model is used to provide further insights for analysis. Similar to the temporal model in a previous work, 23 we implement this model in our data to approximate the total weekend gross for all newly released movies and visualize a comparison to the actual value of previous existing weekends and the total revenue for all online movies. Although this prediction is crude, it inspires the participants to gauge their analysis and prediction from the point of a market share and can help provide bounds for their predictions.
In addition to supporting interactive analytics of the social media data and the baseline models, the VA system is also designed to facilitate tutoring participants, recording prediction results, and saving task durations for each user. Our framework begins with a tutorial, which is followed by a practice prediction, and then the three experimental predictions. Once started, a new record is created in the database to save the experimental information for the current participant. The system will automatically move to the next prediction after each submission and record the total duration time and all the prediction results after the entire process is complete.
The interface of this VA system consists of six pages: Homepage, Weekend Prediction, Weekend Market Share, Sentiment Analysis, Movie Similarity, and Make Prediction. The Homepage shows the basic information for the weekend under prediction and a tutorial on using the system. It contains the date of the weekend and a brief introduction to the released movies on that weekend, so that the participant has a general context for the movie under prediction. A tutorial can be opened from the Homepage for a detailed introduction of each function in the system. The Make Prediction page allows the participant to submit his or her final prediction. This page also lists the prediction of the single movie model and the weekend market share model. These two predictions can be referred to by the participant while analyzing the data and making a decision. The other three pages are the main exploration interfaces, and the participants can move between these pages to interactively explore the data.
The Weekend Prediction page (Fig. 1a) shows the single movie prediction model's results and performance for the previous 3 weeks and its prediction for the current week. It uses a scatter plot with prediction ranges, where the x-axis is the revenue value and the y-axis lists the movies ordered by their release date. Solid lines are used to separate movies by their release week, and the top movies are those released in the current week under prediction. The circle and a surrounding bar show the single movie model's prediction value and its 95% confidence range, whereas the squares indicate the actual opening weekend gross for previous movies. Mousing over the scatter plot shows a dashed line referring to the opening weekend gross axis. To look at the exact values of a movie, the participant can simply click on the circle to open a pop-up context window and fill the content of the selected movie information on the right-hand side.
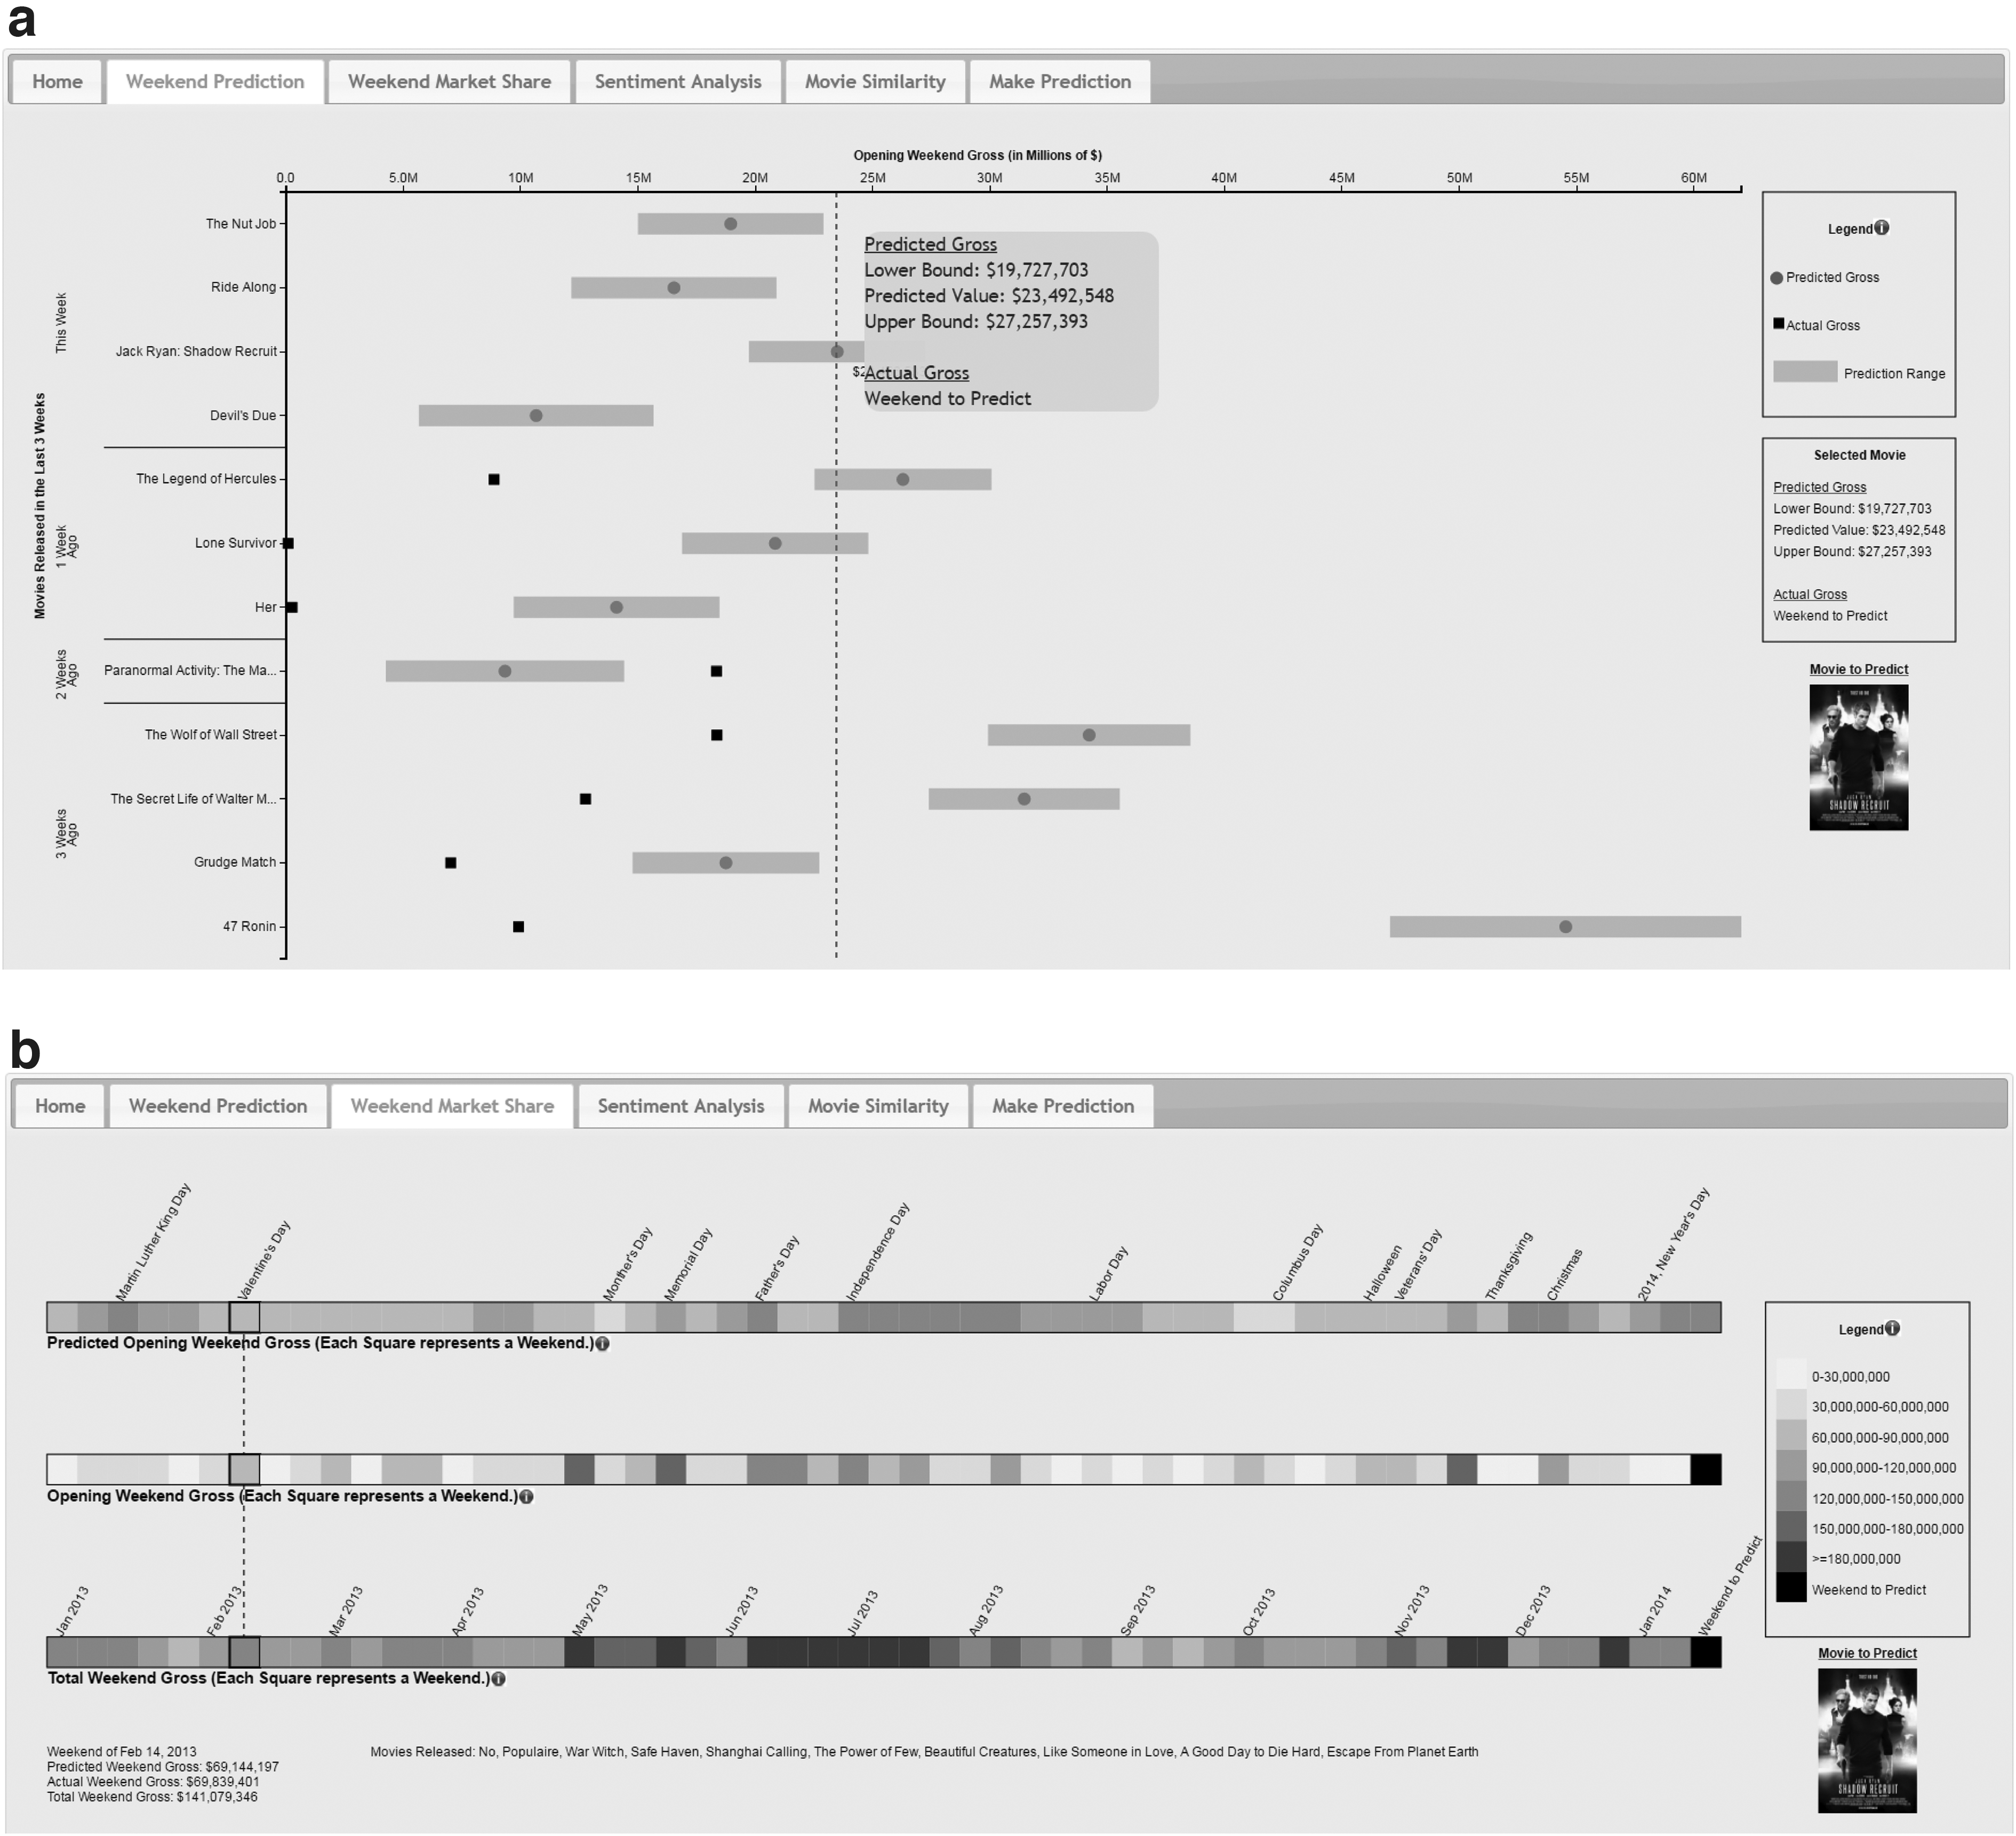
The interface of our VA System.
The Weekend Market Share page (Fig. 1b) visualizes the result from the weekend revenue model for the participants to identify seasonal patterns in the movie industry. This page has three horizontal bars, where each one consists of 55 squares covering a whole year's weekends before the weekend under prediction. The revenue of each weekend is shown by the color of its square according to a sequential color scale, where the light color means low revenue and the dark color means high revenue. The three horizontal bars correspond to the model's prediction, the real value of the sum of all newly released movies, and the real total weekend gross of all currently playing movies. Mousing over these squares will line up the weekends from these three bars, and clicking on the square can highlight this weekend and display the details of the released movies and the revenue of that weekend.
The Sentiment Analysis page (Fig. 1c) consists of a sentiment wordle and a sentiment river plot. 23 By exploring these plots, participants can determine the most frequent positive and negative words regarding a movie and perceive a general understanding of the public's review/expectation of a movie. Positive sentiment and negative sentiment are visualized using a divergent color scale (not shown in the grayscale figure).
The VA environment also supports the comparison of features between movies in the Movie Similarity page (Fig. 1d). Given that a model may overestimate or underestimate the response variable but may perform similarly to similar items, 22 this page supports the three similarity metrics: the trend of Tweet volume, the recently released movies sharing the same Genre, and the recently released movies sharing the same MPAA rating. Once a metric is selected, the five most similar movies are displayed and the user can compare their social media trends as well as the regression model's predictions for each movie. The left side of this page lists the three options of the similarity metrics, and the right side uses small multiple views to show the five most similar movies and the current movie under prediction (the top one). The view of each movie contains a line chart of the tweet volume trend and the single movie model's prediction.
Hypotheses
Our experiment examines the role of teamwork (among three individuals with different roles assigned to different data analysis tasks) as compared with group work (three individuals with no roles) and with three individuals working alone (i.e., not communicating). The main measures include performance, communication, and workload.
Performance
The main dependent variable is the accuracy of the predictions; that is, how close are the participants' predictions to the actual “Opening Weekend Gross” earnings amount for the selected movies. We hypothesized that teams will be more accurate in their “Opening Weekend Gross” earnings predictions than groups who should be better than individuals.
Team interaction
Participants' communication was recorded to address the following questions. (1) Are participants actively sharing information, giving updates, helping each other out, etc.? (2) Are participants organizing information presented in any particular way? (3) What is the quality of their communication? Is there any group/team leader in the communication? And are the participants usually agreeing or disagreeing on their final prediction? (4) What strategies, if any, did the group/team use to make their decisions (weighing pros and cons, majority vote, compromising, etc.)?
It was predicted that teams would exchange greater amounts of relevant information. For one, team members need to work together to cast their prediction, because no one member has all the data. On the other hand, group members may spend more time “chatting” about unrelated things, because they can access all the data at the same time and, therefore, do not need to communicate crucial information to one another. Furthermore, team members should not be as cognitively overloaded, because they do not need to process all data, and hence, they should have additional cognitive resources to collaborate, discuss, and estimate “Opening Weekend Gross” earnings amount.
Workload
It was expected that teams will perceive the tasks as easier to complete than groups and individuals, because team members did not have to process all the data by themselves. Hence, using the NASA Task Load Index (NASA TLX), the workload measure scores should reflect this.
User Experiment
Experimental design
To study the role of teamwork in intelligence analysis and big data analysis, the experiment is designed to be a 3 × 3 mixed-factor experiment with Movie as a within-subject factor (Movies 1, 2, and 3) and Type of Unit as a between-subject factor (Individual, Group, and Team). The Movie task consists of making predictions on three different movies, The Hobbit, About Last Night, and RoboCop. To cover the different cases of accuracy by the single movie model, these three movies are predicted with relatively close, under-predicted, and over-predicted, respectively.
Participants
There were 90 participants, 30 for each Type of Unit. Each group and team comprised 3 participants, and 3 individuals participated simultaneously in the individual condition. Out of the 90 participants, 68 were men (76%) and 22 were women (24%). The average age of the participants was 24.1 years old (with standard deviation 6.2).
Procedure
In the Individual condition, the participants were trained on the whole interface: Home, Weekend Prediction, Weekend Market Share, Sentiment Analysis, Movie Similarity, and Make Prediction. They were given all of the information and asked to make their predictions individually. The individual participants provided one estimate for each task, including the practice session, for a total number of four estimates for each participant.
In the Group condition, the participants were also trained on the whole interface: Home, Weekend Prediction, Weekend Market Share, Sentiment Analysis, Movie Similarity, and Make Prediction. However, they were given all of the information and asked to collaborate with each other to make their predictions as a group. The group provided one estimate for each task, including the practice session, for a total number of four estimates per group.
In the Team condition, the participants were randomly assigned roles. Roles consisted of “Weekend Market Share Specialist” (computer station 1), “Sentiment Analysis Specialist” (computer station 2), and “Movie Similarity Specialist” (computer station 3). Training corresponded to their assigned role (expert domain). However, the overall training content was not manipulated. That is, the same PowerPoint training material was used as in the individual/group condition, just broken up into three parts. Lastly, all team members were trained on the common features on the Home, Weekend Prediction, and Make Prediction pages. As in the group condition, the participants were asked to collaborate to make their predictions of opening gross movie earnings. The team provided one estimate for each task, including practice session, for a total number of four estimates per team.
After obtaining informed consent, participants were randomly assigned to one of the three conditions (individual, group, or team). Also, they were randomly assigned to sit at one of our three computer stations (work stations 1, 2, or 3). The procedure of one experiment has the following steps: training, practice prediction, real prediction, and interview. The measures we use are summarized in Table 2.
Training
Before each experimental session, the participants were trained. Training was presented by using PowerPoint (slides) that covered the purpose of the study (to accurately predict a movie's opening weekend gross), how to navigate through the system's interface, what information is available to them, and why this information is useful when predicting opening weekend gross. The Disney movie, Frozen, was selected to illustrate all points made during training. A short quiz was administered after the training (10 questions, 5 minutes). The quiz tested several crucial pieces of information presented during the training. The quiz was immediately reviewed as a group to allow the participants to ask questions about the tested material. At the same time, the researcher provided feedback on the recently tested material.
After taking the quiz, the participants were given a 10-minute break. During the break, the researchers loaded the movie interface on all participants' computers according to condition and opened the “calculator.” The training PowerPoint remained open for the rest of the experiment so that the participants could refer to it throughout the experiment. Participants were instructed to access the system “Tutorial” once they returned from their break to familiarize themselves with the references available to them.
Predictions
Exploration and predictions consist of four chunks: a practice session and three real predictions. The participants started with a 15-minute practice session. During the practice session, the participants were given the movie Jack Ryan: Shadow Recruit to explore. At the end of the practice session, the participants were given 5 minutes to finalize their findings and to discuss them with their group/team members. In the individual condition, the participants were also given 5 minutes to finalize their findings and estimation but they were not prompted to collaborate with each other. The participants were prompted to give their estimate of “Opening Weekend Gross” once the 5 minutes were up. In the individual condition, the participants gave their movie earning estimate individually (three individual estimates); in the group condition, as a group (one group estimate); and in the team condition, as a team (one team estimate). Participants were given feedback on how close they were to the actual revenue for only the practice movie. Next, the participants completed three real prediction sessions lasting 20 minutes each (15 minutes to research the given movie and 5 minutes to finalize and discuss findings). The following movies were presented to the participants in the following order: The Hobbit, About Last Night, and RoboCop. After each scenario, the participants were prompted to make their predictions and the measures defined in Table 2 were then collected.
Verbal coding
To study the interactive cognition, verbal coding was used to record the communication between the participants. Positive and negative exchanges of information that was relevant to team behavior found in the team literature16,27,28 were coded. For example, the following was noted: who talked to whom and why, 29 close-loop communication (exchanges of information and acknowledgment of received information 30 ), shared understanding for the situation, feedback, and conflict resolution, 31 and others. Hence, when participants shared information with their group/team, the responses were coded by tallying these responses in the appropriate box, “Share Information.” Thus, verbal communication can be coded for team competencies and their frequency of occurrence. In addition, an overall assessment of group/team communication was made at the end of each experimental session by using a 7-point Likert scale (Team Communication Process Rating score sheet). Lastly, some inter-personal/team behaviors were also captured. It was noted whether groups/teams engaged in supportive backup behavior and whether a team leader was emerging 32 and why (due to a better grasp of the data, ability to organize information, outgoing nature of the participant, etc.). The researcher also noted whether the participants were gathered around a particular participant, and if so, why (e.g., because they are looking at a graph together, gathering around the team leader, etc.). These interactions, and other unexpected behaviors, were noted in the “Additional Comment” section of the “Team Processes” rating score sheet. The communication was coded in real time, and an audio recording was conducted for back-up and for reliability checks.
Interview coding
Semi-structured interviews were used to obtain feedback from the participants. The experimenter interviewed participants at the end of the experiment, and these discussions were recorded and transcribed. The participants were mainly asked about what data they used to make their decisions and predictions and why. Asking the participants directly led to a deeper understanding of how participants used the presented data to make their predictions. These interviews were seen as exploratory. The interviews were audio recorded and coded by using thematic analysis. 33 The following six phases were applied to the interview data: familiarization of the data, generation of initial codes, searching for themes, reviewing of themes, defining and naming themes, and producing the report. 34
To evaluate the workload, NASA TLX was administered twice during the experiment. It was administered the first time after the practice session (the first prediction of the movie Jack Ryan: Shadow Recruit) and the second time after the entire experiment (after the fourth prediction was made). It was expected that teams would perceive the tasks easier to complete than groups and individuals, because team members did not have to process all the data by themselves.
To understand the participants' background knowledge, a questionnaire on demographics was given after the NASA TLX. Demographics questions covered participants' background (age, gender, education), domain knowledge (movie familiarity, frequency of “going to the movies”), social media usage (frequency), and knowledge of predictive analytics (familiarity with mathematical models).
Experimental Result and Analysis
To evaluate the role of teamwork from this experiment, we analyze the final predictions by our participants, the records of their communication during the experiment time, and the interview and questionnaire data after the experiment. Our analysis includes the prediction performance, the communication between team members, and the usability of the VA system. Excel and the Statistical Package for the Social Sciences (SPSS) were used for all statistical analysis.
Prediction performance
Performance on each movie prediction is quantified in terms of (1) the deviation from the actual box office income (in terms of millions of dollars), and (2) relative absolute error (RAE) calculated as the proportion of deviation from the actual income. The RAE values are used to determine whether there is a significant difference in predictions among the three different groups (Individual/Group/Team), because these values are normalized by the real gross and best represent how much over/under the predictions are. Specifically, the RAE value is calculated as follows:
Figure 2 provides summary statistics of the performance of each team that participated in the movie experiment. All three groups (Individual/Group/Team) over predicted the “Opening Weekend Gross” earnings amount for the first movie (Hobbit) by $8.1M to $27.1M, under predicted the second movie (About Last Night) by $12M to $19.3M, and over predicted the third movie (RoboCop) by $0.5M to $7.5M.

Summary statistics of the performance in terms of actual revenue and relative absolute error.
Figure 3 shows the mean RAE scores and the standard error of the score for the three groups (Individual/Group/Team) by Movie (prediction for Hobbit, About Last Night, and RoboCop). The largest error rate was for About Last Night at 0.60, followed by the RoboCop prediction at 0.42, with the lowest error rate in prediction being 0.32 for the Hobbit.
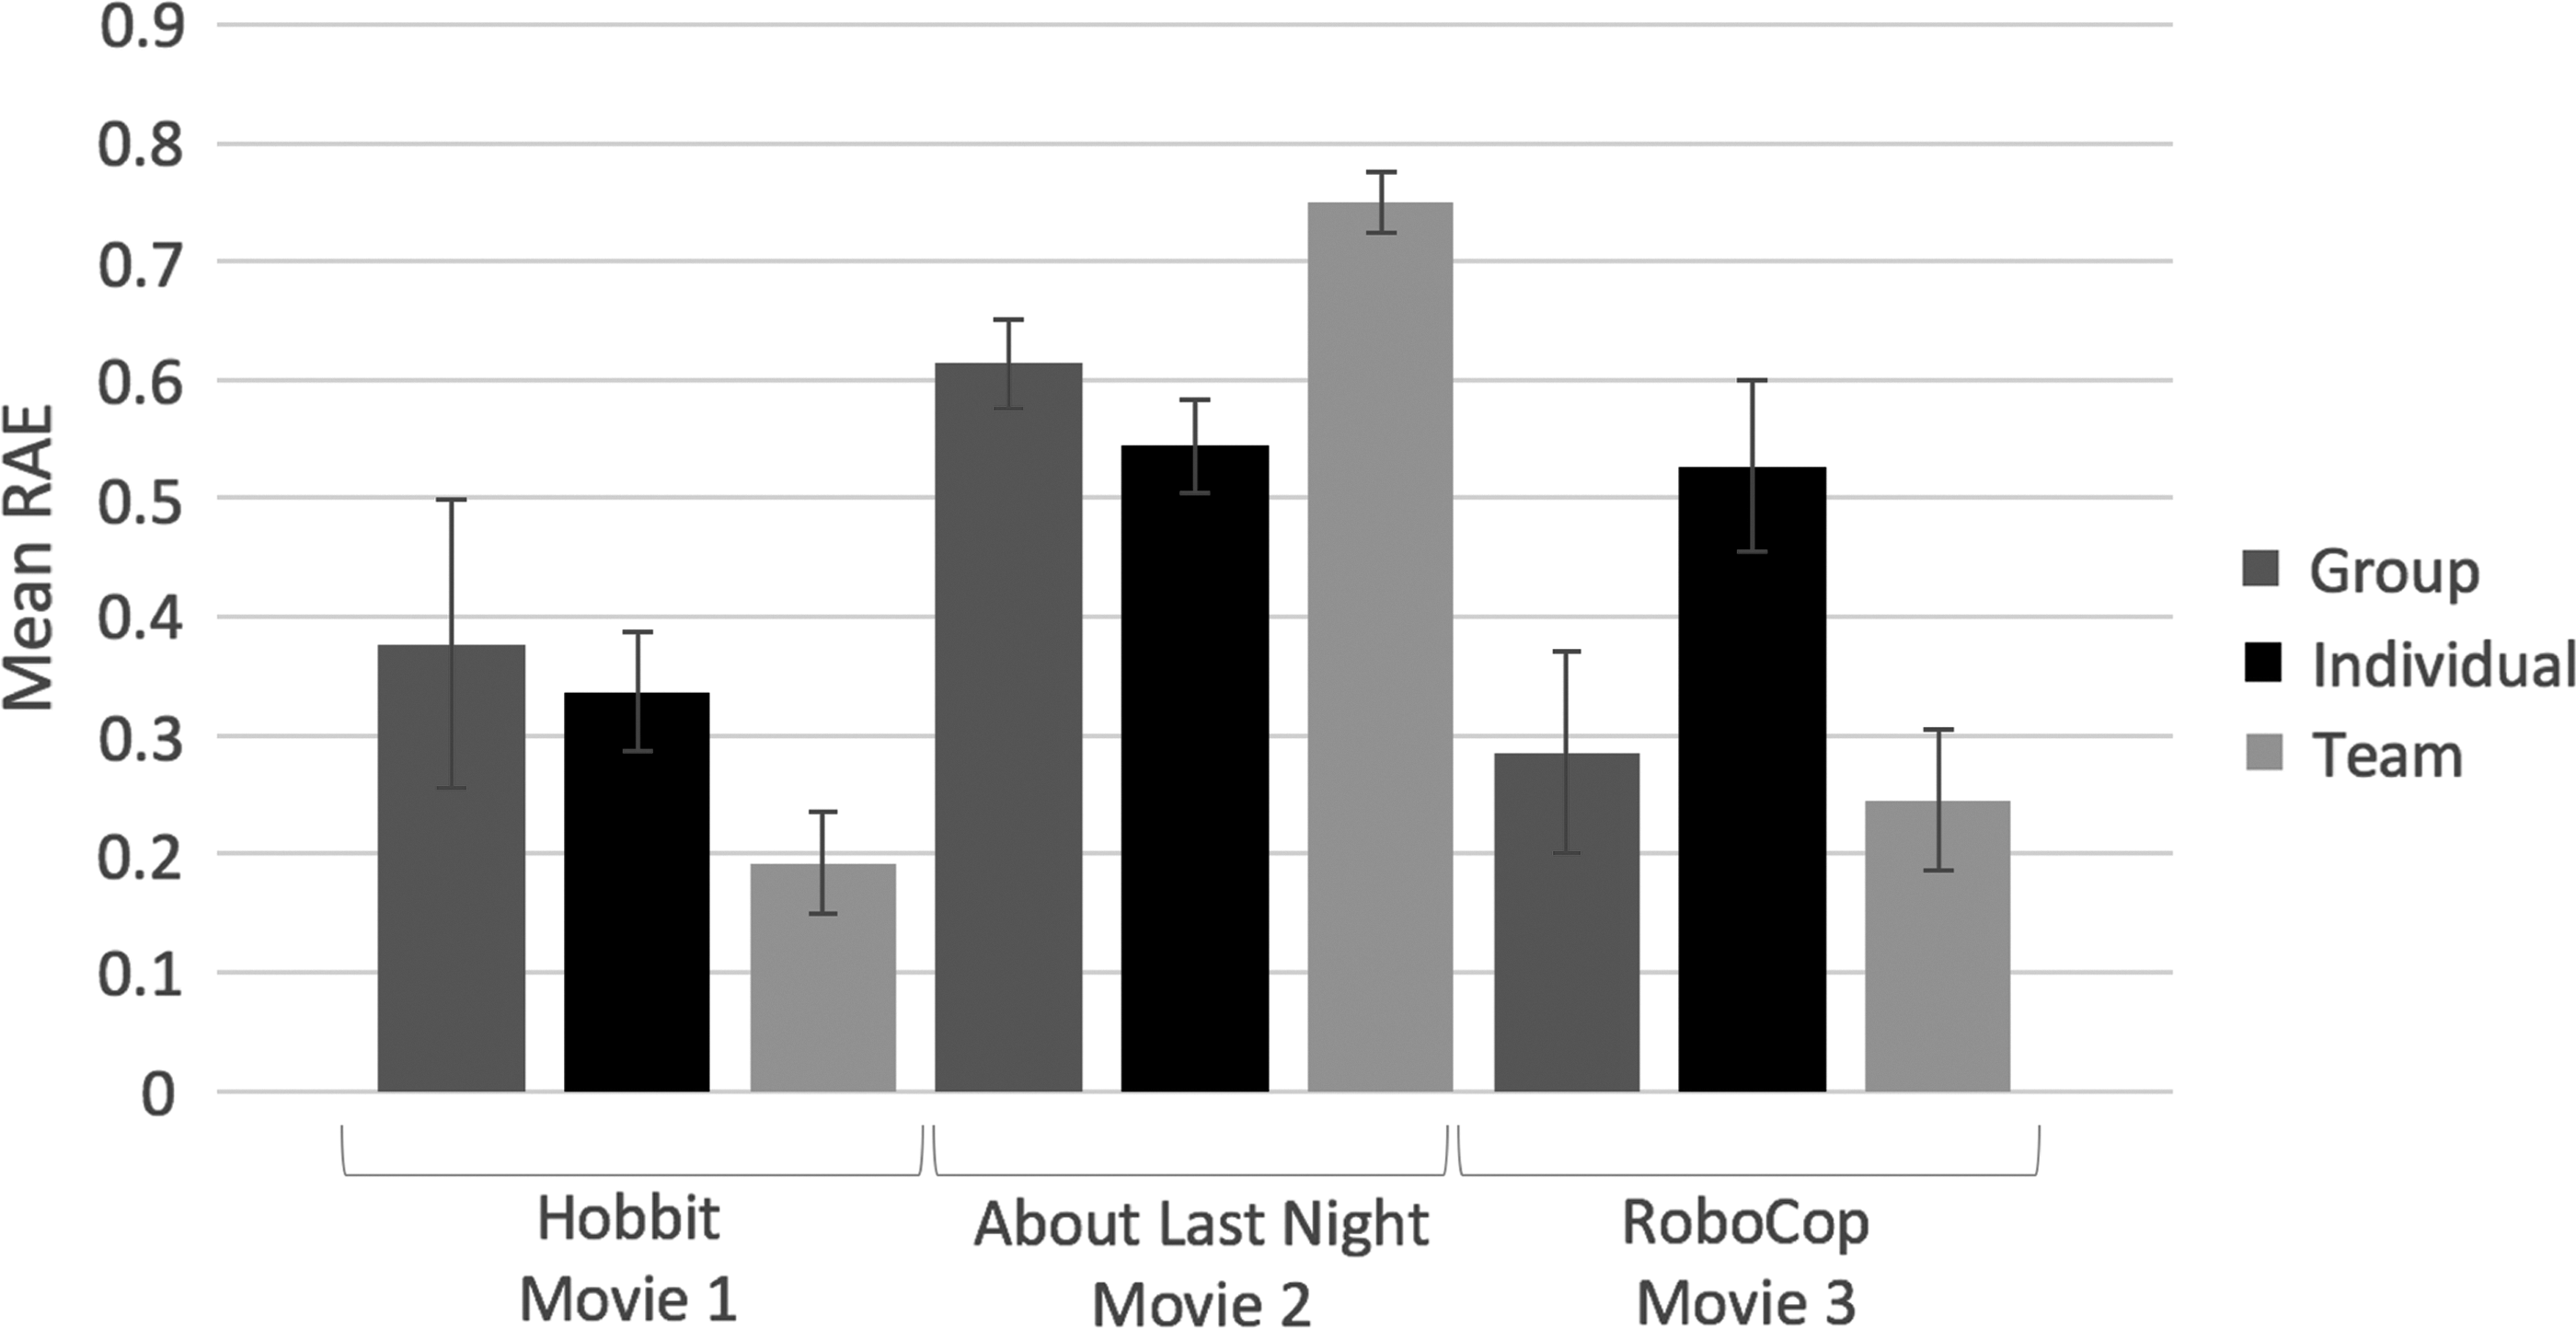
Mean RAE values for the three conditions by movie (Group, Individual, and Team from left to right for each movie). RAE, relative absolute error.
The Mauchly's test of sphericity was not significant, and, therefore, no corrections were needed. The 3 × 3 mixed analysis of variance (ANOVA) performed on these data revealed a significant main effect of Movie [F(2, 94) = 15.49, MSe = 1.25, p = 0.000, partial
To further understand the significant two-way interaction, three one-way ANOVAs were conducted. The assumption of homogeneity of variance was violated; therefore, the Brown–Forsythe F-ratio was reported for Movie 1 (Hobbit) and Movie 2 (About Last Night), but not for Movie 3 (For RoboCop, no corrections were needed, because the assumption of homogeneity of variance was not violated.). There was no significant effect of Type of Unit for Movie 1 (Hobbit) RAE scores (p > 0.3). There was a significant effect of Type of Unit for Movie 2 (About Last Night) RAE scores, F(2, 42.39) = 4.84, p = 0.001, and a significant effect of Type of Unit for Movie 3 (RoboCop) RAE scores, F(2, 47) = 3.48, p = 0.039.
To understand whether teams were more accurate than individuals or groups, independent t-test comparisons were conducted for Movie 2 (Hobbit) and Movie 3 (RoboCop). The p-value was corrected to p < 0.025 for multiple tests, with a significance level of 0.05. For the “Opening Weekend Gross” prediction (About Last Night), there was a significant difference in RAE scores between Team (M = 0.75, SD = 0.08) and Individual (M = 0.55, SD = 0.22) conditions, t(37.06) = 4.33, SE = 0.05, p = 0.00, d = 1.21, as well as between Team (M = 0.75, SD = 0.08) and Group (M = 0.61, SD = 0.12) conditions, t(16.01) = 2.96, SE = 0.05, p = 0.01, d = 1.37. Individuals and groups were closer to the actual “Opening Weekend Gross” earnings amount of the movie About Last Night compared with teams. Overall, all three conditions (Individual/Group/Team) underestimated the actual “Opening Weekend Gross” earnings amount; however, teams significantly underestimated the earnings amount compared with the other two groups. These significant differences were observed with a large effect size.
For the third “Opening Weekend Gross” prediction (RoboCop), there was a significant difference in RAE scores between Team (M = 0.25, SD = 0.19) and Individual (M = 0.53, SD = 0.40) conditions, t(38) = −2.14, SE = 0.13, p = 0.005, d = −0.90, but not between Team (M = 0.25, SD = 0.19) and Group (M = 0.29, SD = 0.27) conditions, t(18) = −0.39, SE = 0.10, p = 0.705, d = −0.17. Both groups and teams outperformed individuals in this third and last prediction. The significant differences between teams and individuals were observed with a large effect size.
In addition, analysis of these data revealed that there is no correlation between accuracy of prediction and age of participants. There was also no correlation observed between accuracy of prediction and age when combined with education level and gender.
Communication between team members
Group and team communication were coded by using the Team Process and Team Communication Process rating sheets. To ensure interrater reliability, a random sample of 5% coded data was used to conduct a Cohen's kappa. Interrater reliability for verbal data indicated a good agreement among the two raters, with a Cohen's kappa of K = 0.76. However, out of all the communication measures, only seeking information was significant. That is, teams (M = 4.2, SD = 2.74) sought out information significantly more than the Group (M = 1.3, SD = 1.98) condition, t(16.42) = 2.71, SE = 1.07, p = 0.01, d = 1.21. Lastly, these results were achieved with a relatively high effect size.
Usability of VA interfaces
The NASA TLX workload measure of mental effort and task demands significantly differed across Type of Unit. There was a significant difference between Individual (M = −0.55, SD = 2.41) and Team (M = 0.62, SD = 1.84) conditions, t(52.3) = 2.08, SE = 0.56, p = 0.02, d = 0.55 in their mental effort rating. Overall, individuals found that predicting movie earning amounts required more mental effort than teams. There was also a significant difference between Individual (M = −0.59, SD = 2.73) and Team (M = 0.48, SD = 1.74) conditions, t(47.6) = 1.78, SE = 0.60, p = 0.04, d = 0.47 in their task demands' rating. In this case, individuals found that the tasks were more demanding than the participants working in the teams.
There was a significant statistical difference in interface usage of the “Movie Similarity” page between Team (M = 3.59, SD = 1.09) and Group (M = 2.90, SD = 1.59) conditions, t(49.48) = 1.93, SE = 0.36, p = 0.03, d = 0.51, as well as between Team (M = 3.59, SD = 1.09) and Individual (M = 2.31, SD = 1.89) conditions, t(44.65) = 1.93, SE = 0.41, p = 0.00, d = 0.83. This difference was due to teams using the “Movie Similarity” page more often than either the individuals or groups.
There was also a significant statistical difference in interface usage of the “Weekend Market Share” page between Individual (M = 1.45, SD = 1.78) and Team (M = 2.66, SD = 1.76) conditions, t(55.99) = 2.59, SE = 0.47, p = 0.01, d = −0.68. This difference was due to the fact that teams used the “Weekend Market Share” page more often than the individual participants.
Discussion
Results from this study indicate that teamwork did not lead to more accurate predictions compared with individual or group work. Teams performed equally well as individuals and groups for the Hobbit prediction, worse than individuals and groups for the About Last Night prediction, and better than individuals and equally well as groups for the RoboCop prediction. Hence, Hypothesis 1, teamwork will result in more accurate predictions than individual and group work, was not supported.
To gain an understanding of why teams performed so poorly, we turn our attention to the theory of ITC. 17 Particularly, the ITC theory states that monitoring group/team communication would allow the researcher to gain an understanding of how groups/teams reasoned through their data analysis and how they decided on the “Opening Weekend Gross” prediction amount. For example, the majority of individuals working in either groups or teams seemed to already have an estimate of the “Opening Weekend Gross” in mind before they discussed it with their group/team members (after individual data analysis but before group/team discussion). In turn, a consensus was often reached by meeting in the middle (between each individual's estimated amounts). This sequence of decision making may have contributed to the low performance of teams, because individual team members had already formed opinions on how much the presented movies made during the opening weekend without having all the information. Therefore, when team members came together to discuss their findings, they may have been too fixated on their own initial estimate instead of considering their teammates' data.
In particular, one of the worst performing teams spent a considerable amount of time arguing with each other, insisting that each one's prediction was correct and missing out on the actual data analysis. This poor performing team provided a prime example of how being focused on the wrong thing, insisting that they individually were right, led to poor prediction estimates. In addition, the low performance of the teams could be attributed to some teams considering “common” data to a greater extent than unique data. That is, they were more focused on data that everyone had—that they could assess simultaneously (by pulling them up on their computer screens)—instead of discussing unique data points. Conversely, this type of information processing indicates that team members were ineffective in pooling information together due to cognitive biases.2,35,36 That is, team members seemed to be vulnerable to information pooling bias in which analysts tend to discuss information that is known to everyone, but ignore and hide unique information sharing.36,37
Evaluating the results from this experiment thus far indicates that although team members actively interacted with each other, they were handicapped by their inability to share unique information with each other, which, in turn, seemed to have exuberated their cognitive biases. However, interface features that support individual work and collaborative work are crucial for effective teamwork, particularly when considering the intelligence domain. 38 Furthermore, intelligence analysts operate under constant time pressure. However, working with others often requires additional time, which analysts do not have. Collaborative tools, on the other hand, could make the process of sharing and requesting information among team members easier. For instance, co-located teams, such as the ones in our experiment, would have benefited from being able to display data sets onto a common screen while analyzing and discussing them. However, teams operating within the intelligence domain are often distributed and, therefore, would need additional interface features to support collaborative VA. For example, these features should include support mechanisms for division and allocation of work, foster common ground and awareness, aid in the decision-making process, enable the process of establishing trust, etc. 39 It is imperative to remember that these suggested design features will aid the analytical team only if they are easy, intuitive, and fluid to use, because otherwise they would just add to analysts' workload.
Next, Hypothesis 2 predicted that teams would engage in significantly more information exchanges than groups. In particular, they would seek and share relevant information significantly more than groups. This was only partially supported, because teams sought significantly more information, but they did not share significantly more information. Again, this indicates that teams were prone to information pooling bias, because they “held” onto information instead of sharing it. However, team members should have ideally shared more information with each other, because they knew that not everyone had the same data. That extra step, sharing additional information, was not taken. Once more, fostering information sharing among participants via collaborative tools might have led to increased information exchanges.
Furthermore, Hypothesis 3, which predicted that teams would have significantly lower task demand scores, was also partially supported. This indicated that teams found this task easier than individuals, even though teams did not differ in difficulty ratings between the Group condition. Lastly, there were no differences in how the three groups felt emotionally during the experiment.
The interviews yielded another interesting result. As already stated, there was a significant statistical difference in interface usage of the “Movie Similarity” page, as teams used the “Movie Similarity” page more often than either the individuals or groups. There was also a significant statistical difference in interface usage of the “Weekend Market Share” page. This difference was due to teams using the “Weekend Market Share” page more often than the individual participants. It should be noted that both of these interface pages contain relatively large amounts of data compared with the rest of the interface. Hence, teams did not shy away from using these data sets during their analyses, whereas individuals and groups did. One possible explanation for these results could be that participants in the team condition were cognitively less overloaded18,19 than participants in the individual and group conditions. In this case, fewer cognitive demands lead team members to analyze more complex data sets, suggesting that working in teams can be beneficial during “big” data exploration, as long VA tools foster data sharing and collaboration among team members.
Lastly, one of the most interesting findings was that only one team (out of all teams and all groups) planned their “attack.” That is, these team members decided ahead of time the sequence of their data discussion (what data to discuss first, second, etc.), and how they would work together and share information. This finding becomes even more interesting when considering that this team was the best team in predicting “Opening Weekend Gross” for movie 2, About Last Night. This seems to suggest that in big data exploration, planning matters, especially when things are unknown (in this case, unfamiliar movie), is important. Hence, collaborative data exploration tools should provide the ability to plan the sequence of analysis, assist with the division of work and sharing/seeking of information. However, one weakness of this experiment is that even if individuals/groups/teams make good predictions the quality of the predictions could be due to unknown reasons or factors not being used in the model. As such, this study provides insights into the organizational processes that enable groups/teams to better use the available information at human experts.
Conclusions and Future Work
This work administered a user study with predictive analytics in the context of big data to explore the role of teamwork.
Above all, this study illustrated that it is difficult to make predictions since each run takes about 2.5 hours and the participants were quite active in analyzing, discussing, and exchanging opinions in the decision-making process for their final predictions.
Using statistical analysis, verbal coding, and interviews, the results of this experiment partially support our hypothesis that teamwork helps participants in their prediction accuracy and cognition for complex data analysis. Teamwork has also been shown to be useful in relieving the workload of each member. Besides the benefits that we see from the results, we also discussed possible reasons of some outcomes and stated the limitations of our experiment design. The workload of each analytic task should be designed relatively equal, and the order of different prediction tasks should be able to change so that this influential factor can be avoided.
In light of this, one can only imagine what today's analysts face. Surrounded by an ever-increasing availability of data coupled with an ever-shrinking time frame for their analysis, analysts are still expected to accurately assess and predict future events and values. One would assume that even the best analysts struggle under such constraints. Therefore, it is imperative for researchers to continue exploring avenues of predictive analytics. Future direction should focus on increasing the complexity of data to replicate more accurately what analysts are faced with day to day. Along with data complexity, future studies should also explore modifications to the team makeup in terms of size and participant roles as well as explore inducing external factors, such as stress, during the analysis. This would further replicate high stress prediction environments, such as stock prediction or other time-sensitive domains. Although teamwork does not show significantly improved prediction accuracy, these data suggest that there is the potential for teams to benefit from exploration of complex data sets and lower levels of workload. Moreover, these data suggest that teamwork could greatly benefit from appropriate collaboration technology. Lastly, this research adds to the overall knowledge of team science as well as predictive analytics.
Footnotes
Acknowledgments
This work was supported in part by the U.S. Department of Homeland Security's VACCINE Center under Award No. 2009-ST-061-CI000 and the NSF under Grant No. 1350573.
Author Disclosure Statement
No competing financial interests exist.