
Abstract
Abstract
This article demonstrates how time-dependent, interacting, and repeating risk factors can be used to create more accurate predictive medicine. In particular, we show how emergence of anemia can be predicted from medical history within electronic health records. We used the Veterans Affairs Informatics and Computing Infrastructure database to examine a retrospective cohort of 9,738,838 veterans over an 11-year period. Using International Clinical Diagnoses Version 9 codes organized into 25 major diagnostic categories, we measured progression of disease by examining changes in risk over time, interactions in risk of combination of diseases, and elevated risk associated with repeated hospitalization for the same diagnostic category. The maximum risk associated with each diagnostic category was used to predict anemia. The accuracy of the model was assessed using a validation cohort. Age and several diagnostic categories significantly contributed to the prediction of anemia. The largest contributors were health status (
Introduction
This article demonstrates how large scale redundant models with thousands of overlapping variables can be used for predictive medicine. In modeling health hazards, investigators typically use Cox Regression or artificial intelligence models to relate risk factors to probability of an event. 1 Typically a linear combination of risk factors is included in the analysis, whereas changes in risk factors over time and repeated treatments for the same diagnosis are ignored. In a sample of 20 recently published articles using Cox regression, 80% used less than 30 variables, 5% explored the interaction among the variables, 0% examined change in risk factors over time, and only 25% reported the fit of the model to the data. 2 Naturally, when the input to a predictive model is limited, model accuracy drops and its use to guide clinical practice is not reasonable. Predictive medicine calls for methods that can produce more accurate models by allowing time-dependent, interacting, and repetitive variables as risk factors. In this article, we show, by way of an example, how this can be done. To demonstrate, we focus on predicting anemia.
Anemia is a common, but often underappreciated, diagnosis affecting millions of Americans. 3 The public health importance of this disease is particularly relevant given the aging population. 4 Adequate identification and risk stratification of presence of anemia is a central issue in clinical decision making. Several indices for predicting anemia exist, but they have mainly been developed for, and assessed in, very specific populations, such as post-partum women, patients receiving chemotherapy, patients with hepatitis C, or end-stage renal disease.5–10 Furthermore, the small sample sizes and the selective number of risk factors investigated limit the generalizability of these models and their direct use in clinical care. In contrast, this article develops a model for predicting the presence of anemia from the patient's current medical history, as coded within the patient's medical diagnoses.
In our model, anemia is predicted from medical history. There are more than 14,000 diagnoses within the International Classification of Diseases (ICDs) Version 9 that can be used to describe the patient's medical history. These diagnoses are used to measure progression of risk for anemia within 25 major diagnostic categories, which are organized into body systems. 11 Then, progression of risk factors within body systems is used to predict anemia. In this article, we report the percentage of variation in the presence of anemia explained by our model.
Materials and Methods
Model development
The general conceptualization of the problem is depicted in Figure 1. Electronic health records report encounters with the patient. Each encounter has a diagnosis. We use these diagnoses to examine change in risk for anemia. Statisticians refer to these events as “risk factors” or “covariates.” Covariates or risk factors are calculated over some baseline period, which is an interval of time before the presence of anemia. The objective is to estimate the anemia-free time of the patient, starting from the end of the baseline period (i.e., point b in Fig. 1).
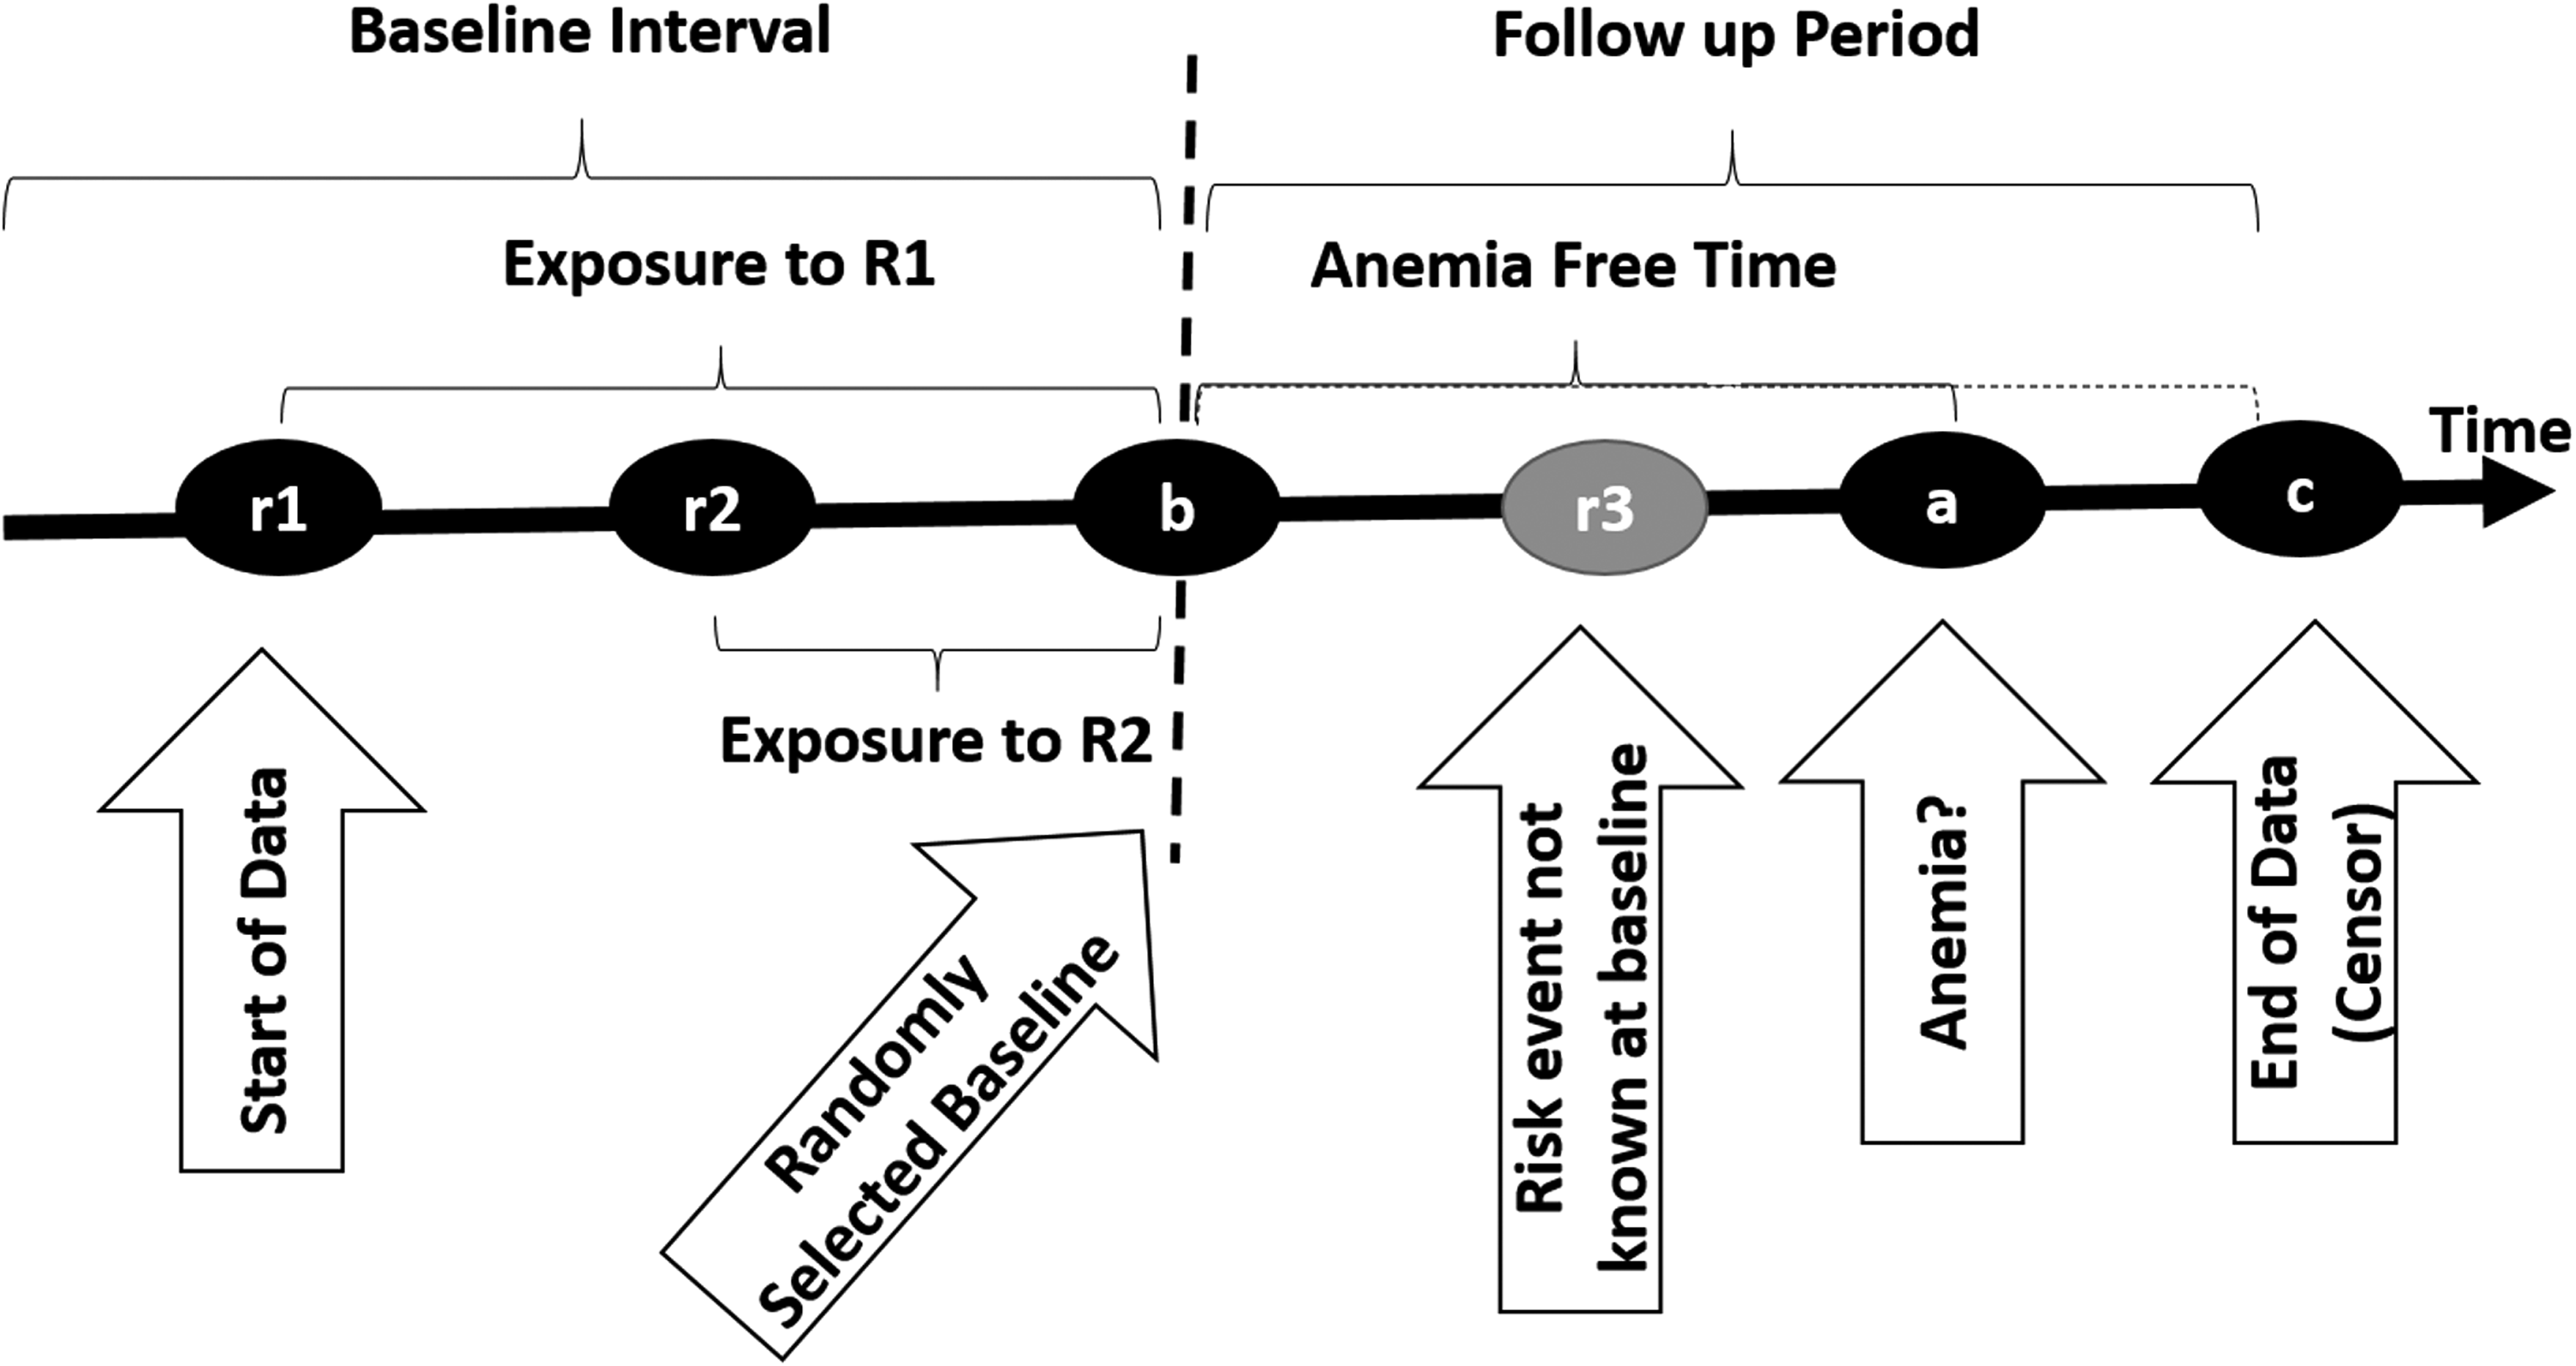
Depiction of risk of anemia over time for purposes of model development.
Patients' health statuses can change dynamically after each encounter. Therefore, it is reasonable to assume that covariates or risk factors change during the baseline period and may depend on time. Furthermore, covariates are present for various lengths of time during the baseline period, creating different exposure times to risk factors. For example, in patients without anemia at the end of the baseline period, time b, the prediction model should give an assessment of the probability of anemia in the interval from b + 1 to a, based on all covariate and exposure time information available at time before b. In Figure 1, two covariates (diagnoses) R1 and R2 are shown occurring at times r1 and r2. These covariates are used to predict the time the patient is anemia free, or time to censor event.
The traditional approach to predicting anemia over time is to develop a model of the cumulative hazard faced by the patient over time. In this approach, the patient in shown in Figure 1 has hazard R1 for b − r1 time periods and hazard R2 for b − r2 time periods. Investigators have proposed several different ways to model this, including Cox regression, with time-dependent covariates, multistate models, accelerated failure models, proportional odds models, and additive hazard models.
12
Among these approaches, we chose to use the additive hazard model because of its simplicity.
13
In this model, the conditional hazard is defined as
where
where
In scoring progression of risk, we chose to focus on the condition with the maximum risk, as opposed to average risk across conditions. We chose this approach because we are most concerned about the worst condition that the patient had. Furthermore, we chose maximum, as opposed to latest risk, on the assumption that later conditions may be lower and may mask an earlier higher risk. Thus, we are assuming that lower later risk is not a true reduction of risk and what matters is the worst condition in the patient's history, no matter how much earlier it is reported.
For example, if a person has diseases A, B, and C within a particular body system, then the disease with the highest risk factor is selected for the covariate. This could be A, B, or C and is independent of when the diseases occurred in the baseline period. As these risk factors are calculated at different time periods and reflect different encounters, the covariate vector represents the progression of diseases within different body systems.
Source of data
The Department of Veterans Affairs Informatics and Computing Infrastructure (VINCI) is a research database designed to provide investigators with data and statistical tools needed to complete research studies in the Veterans Affairs (VA) population. 14 VINCI houses data from all Veterans Health Administration's medical centers nationwide, representing the most complete repository of administrative and medical records in the United States. Using these data, we examined a retrospective cohort over an 11-year timeframe (January 1, 2004–August 12, 2015). This study was approved by the Washington, D.C. Veteran Affairs Medical Center Institutional Review Board.
Inclusion criteria
Subjects were included if they had at least 1 year of encounters within the VA healthcare system, and who were born after 1915, before 1974, and were alive in 2003. The total number of patients who met these criteria was 9.7 million. We selected the patients who had at least 1 year of follow-up, which reduced the number of patients to 5,392,267. Out of those with at least 1 year of follow-up, 1,103,533 had at least one diagnosis of anemia.
Dependent variable
The dependent variable was the number of anemia-free days starting from the first report of any hospitalization or outpatient diagnosis. Subjects were identified as having anemia by the ICD 9 codes listed in Appendix 1. Causes of anemia included iron, folate, and B12 deficiencies, renal insufficiency, anemia of chronic inflammation (formerly termed anemia of chronic disease), and unexplained anemia. The independent variables were diagnoses either in the hospital or in an ambulatory setting. These independent variables were used to stage progression of risk of anemia.
Censored data
For patients who did not have a diagnosis of anemia, the number of anemia-free days was censored by either death or date of last reported visit.
Risk factors/covariates
In this article we rely on patients' diagnoses and age to anticipate future occurrences of anemia. In version 9 of the ICDs, there are more than 14,000 classifications, creating a high number of variables to use in predicting the emergence of anemia. Investigators usually reduce the number of variables before constructing predictive models by using ridge or other similar statistical methods. 15 These statistical methods of dimension reduction focus on variables that are both prevalent and predictive of the targeted disease. Thus, they ignore variables that are rare but also predictive. To include rare predictors, we take a different approach and do not reduce the number of variables. Instead, we examine the hazard of anemia for all patients' diagnoses, and report these within different body systems.
For each patient, the baseline point b (Fig. 1) is randomly selected in time between the starting point of the data and the diagnosis of anemia at a or the end of the data if there is no anemia diagnosis. This selection occurs once for each patient. The average length of the follow-up period was 2,574.28 days (standard deviation of 1309.03 days). For simplicity, all risk factors that occur before the baseline point b are assumed to occur at b. For example, if a patient has risk factor R1 at time r1 and risk factor R2 at time r2, both of which occur before the selected baseline b (as in Fig. 1), then, for the purpose of estimating the anemia hazard rate given one of the risk factors, the anemia-free time is the difference between the time of diagnosis of anemia and the baseline, that is, a − b. Any risk factor occurring after the baseline point b is ignored. For example, in Figure 1, the risk factor occurring at time r3 is ignored.
The hazard rate associated with a risk factor is assumed to be constant in time. As shown in Figure 1, this assumption may not be reasonable when the baseline period is a long interval or when early and late risk factors are not averaged across patients to be approximately occurring at the same time. Diseases that occurred less than 30 times in the database were ignored as accurate estimates could not be made for these diseases. We calculate the discrete hazard rate, that is, the daily probability of anemia, based on the inverse of the average number of days until the first anemia diagnosis:
This method of calculation is computationally faster and, under the assumption of constant hazard over time, provides the same estimates as repeatedly counting the number of patients who have anemia for the first time after each time period (Appendix 2).
Progression of risk within diagnostic categories
The diagnoses were further classified into diagnostic categories. The Agency for Healthcare Research and Quality has organized diagnoses into major diagnostic categories. 11 The categories are formed by dividing all possible diagnoses into 25 mutually exclusive areas, so that each area corresponds to a single organ system or etiology. These smaller clinically meaningful categories are more useful statistically for the purposes of the development of this model than are individual ICD-9 codes. The 25 major diagnostic categories include diseases and disorders of the nervous system; eye; ear, nose, and throat; respiratory system; circulatory system; digestive system; hepatobiliary system and pancreas; musculoskeletal system and connective tissue; skin, subcutaneous tissue, and breast; endocrine, nutritional and metabolic diseases and disorders; kidney and urinary tract; male reproductive system; female reproductive system; pregnancy, childbirth and the puerperium; newborns and other neonates; diseases and disorders of the blood, blood-forming organs, immunological disorders; myeloproliferative diseases and disorders; infectious and parasitic diseases; mental diseases and disorders; alcohol/drug use; injuries, poisoning, and toxic effects of drugs; burns; multiple significant trauma; and human immunodeficiency virus infections. Agency for Healthcare Research and Quality has classified miscellaneous diagnoses into “other” or “factors influencing health status” categories. The health status category refers to visits that affect the health of patients but are not treatment for diagnosis or injury. For example, visits for donating organs, visits for discussing homelessness, or visits for immunization. Within each category, diagnoses were arranged from least to highest hazard rate for the development of anemia. As there were no cases in the database under the major diagnostic category of multiple significant traumas, this category did not contribute to the model.
Repeated diagnoses were recognized as separate events and were included in the relevant diagnostic category. Often, patients are seen multiple times for the same diagnosis. In the hospital setting, these diagnoses may indicate a treatment-resistant illness. For example, a patient repeatedly admitted for cancer unresponsive to treatment. Sometimes, repeated diagnoses are used to indicate continued treatment for the same diagnosis; for example, repeated visits for chemotherapy. In an outpatient setting, repeated diagnoses may signal follow-up on a diagnosis. For example, consider a patient who is repeatedly seen for diabetes.
To report progression of risk within the diagnostic category, the hazard rates were normalized from 0.0 to 1.0 and for each 10% progression toward a maximum risk of 1.0 within each body system. Since patients with no diagnosis within a body system were assumed to have a 0 score, the normalization was performed by dividing the hazard associated with the disease with the maximum hazard within the body system.
Overall risk of anemia
The risk for anemia was calculated by regressing the number of anemia-free days on the standardized scores within each body system. The higher the number of predicted days to anemia, the less is the risk for anemia. The lower the number of predicted days to anemia the higher is the risk for anemia.
Results
Table 1 describes the demographic characteristics of the patients included. As expected in the veteran population, patients are mostly male.
To give the reader a sense of how daily hazard rates for each diagnosis were calculated, Table 2 provides the top 10 diagnoses that had the shortest number of days to first reported anemia. For these 10 diagnoses, the number of days from first diagnosis listed until a diagnosis of anemia is relatively short (82–179 days).
Table 3 is exemplary of how hazards associated with different diagnoses were arranged within major diagnostic categories. To make the table easy to understand, we report only three major diagnostic categories, and within these categories we report select diagnoses. The columns in Table 3 show the various diagnostic categories (e.g., diseases in the circulatory system). The first column reports the standardized score; this represents increasing hazard rates of anemia, normalized between 0.0 and 1.0. For example, in the circulatory system, “2nd cardiogenic shock” is assigned a score of 1.0, because it corresponds to the worst-case daily hazard rate (0.0074) for anemia among all diagnoses within the circulatory system. Similarly, “1st ruptured abdominal aortic aneurysm” is assigned a score of 0.4, representing a hazard rate that is ∼40% of that for cardiogenic shock. When a patient presents with multiple diagnoses within the same diagnostic category, the hazard rate is assumed to be the score associated with the worst diagnosis. For example, within the cardiovascular system, a patient may present with first and second “metabolic cardiomyopathy,” in which case the score for second occasion of the disease is used.
Repeated hospitalizations for the same diagnosis are scored separately.
The combined impact of diagnostic categories in predicting anemia-free days is represented in Table 4. Age and nearly all diagnostic categories have a statistically significant relationship on number of anemia-free days. The negative coefficient in most variables confirms that progression within various body systems brings about shorter days to anemia. The variables with positive coefficients suggest that these variables increase time to anemia beyond what is reported for the intercept. The magnitude of the coefficients for each body system is presented. Age has a large impact (coefficient,
Significance codes: 0 “***”.
Residual standard error: 1027 on 809033 degrees of freedom.
Multiple R squared: 0.1971, Adjusted R squared: 0.1971, F statistic 7640 on 26 and 809033 degrees of freedom p value <2.2e-16.
The accuracy of the model was tested on a single holdout set consisting of 20% of the data specifically set aside for validation testing. The area under the receiver operating characteristic (ROC; Fig. 2) curve for the prediction of the development of anemia is 0.751 (confidence interval [CI] 74.95%–75.26%). This was calculated as follows: For each patient, the estimated number of anemia-free days was estimated from the regression model. The actual number was obtained from the data. The ROC curve was generated by varying the threshold for predicted time to onset of anemia. A given threshold T corresponds to a single point on the curve, where the x-axis denotes the false positive rate (fraction of patients who are predicted to get anemia within T days but do not have anemia at this point) and the y-axis denotes the true positive rate (fraction of patients who are predicted to get anemia within T days and do so).

ROC curve for the predictive index.
Use of the anemia risk index
To use the index to predict the number of days to the development of anemia for a specific patient, first score the single attributes associated with the patients' age, gender, and major disease categories and then use the additive or the multiplicative parameters to obtain one overall score for the patient. For example, consider a 70-year-old patient with “streptococcal septicemia” and “secondary malignant neoplasm of liver.” Age 70 corresponds to a standardized score of 0.5 and male gender corresponds to a score of 1. Streptococcal septicemia corresponds to a score of 0.4 in the major disease category of infectious and parasitic diseases. Secondary malignant neoplasm of liver corresponds to a score of 0.7 in the hepatobiliary and pancreas categories. All other body systems have no relevant diagnoses, so these are scored as 0 and can be ignored. The overall number of days that this patient's anemia is hastened is
For this patient, we are predicting that anemia will occur in 955 days from baseline, where patient's medical history was assessed. The smaller the number, the more likely that anemia will occur. If regression predictions are negative, then the prediction is that anemia has already occurred before the baseline diagnoses.
Discussion
We created a prediction model for the development of anemia using a very large, nationally representative database of U.S. veterans. Anemia was positively associated with age, which is consistent with findings of a higher prevalence in older adults from other large studies. 16 The etiologies associated with the quickest onset of anemia in this prediction model were respiratory, kidney, endocrine, and hepatobiliary diseases. Almost all diagnostic categories have a statistically significant relationship on the number of anemia-free days, with the exception of burns, newborns, and prenatal visits. It was surprising that so many diagnostic categories had a significant contribution to the emergence of anemia. This is likely to be because of the size of the database. 17 In massive databases, even small effect sizes could be statistically significant. Age, health status, and diseases of the respiratory, kidney, endocrine, and hepatobiliary systems all had large effect sizes.
Few studies have looked at the time to development of anemia, but all diagnoses have biological plausibility in their contributions to the development of anemia.18–20 The differential in time courses for the development of anemia for the various disease states may be reflective of different or multiple mechanisms, including blood loss, dampening of hormonally trophic environments as with erythropoietin or thyroid hormone deficiency, 21 hypoxia-sensing abnormalities,22,23 increased inflammatory markers and hepcidin levels, 24 and nutritional deficiencies. 25
This article provides a method for early detection of anemia. The model's area under the ROC curve was 0.751 (CI 74.95%–75.26%). This accuracy level is similar to 0.79 for Centor's clinical prediction rule for streptococcal pharyngitis, 26 0.62 to 0.86 for prostate-specific antigen testing, 27 and 0.67 to 0.82 for screening mammography. 28
Early recognition of anemia is particularly important given the association between anemia and adverse health outcomes. Anemia has been linked with increased mortality, functional and cognitive decline, and hospitalization.29–32 Directing targeted treatment to the underlying pathophysiology may ameliorate these outcomes. Therefore, our study adds to the literature in that clinicians will be able to use this model to anticipate the potential development of anemia, and where appropriate, institute closer monitoring, or take preventative or therapeutic action.
Our study has a number of notable strengths. A considerable strength is the large sample size. The sample is also representative of veterans across the geographic United States. The large sample size and multiple sites improve internal data reliability. Another strength is that the model examines risk across all encounters and allows for progression of risk factors during the baseline period.
Although the index performs well at predicting anemia, the study has a number of limitations. The accuracy of the model could be improved. Some of the factors that may affect the accuracy include limitations inherent to the retrospective study design, including the use of the electronic health record. For example, it could be better if we had defined anemia using more detailed laboratory data, not available on most patients. The use of diagnostic codes to define anemia and comorbid conditions may have resulted in an underestimation of their prevalence. Previous studies have shown assignment of diseases by ICD-9 codes to have accuracy between 72% and 83% in principal and comorbid diagnosis extraction. 33 However, the key laboratory variable used for cohort definition (e.g., hemoglobin) is part of routine panels that are measured in most patients receiving healthcare, and therefore it is unlikely that a significant proportion of actively enrolled veterans would have been excluded.
Another limitation to consider when using data from electronic health records is the possible confounding that occurs. In particular, we used data obtained during the course of clinical practice (without randomization) and, therefore, selection bias is possible. The regression adjusts for a significant number of potential confounders, but we cannot rule out the presence of residual confounding.
The study population consisted mostly of male patients; hence, the results may not apply to female patients. For instance, there were insufficient cases in the database to add female reproductive disorders as a major diagnostic category to the overall prediction model. Salive et al. found that age was significantly associated with anemia, with a stronger effect in men than in women, suggesting an interaction between age and gender. 34 In patients with myocardial infarction, Tsujita et al. found that mortality was significantly higher in men with versus without anemia (4.6% vs. 1.8% at 30 days, p = 0.003; 8.9% vs. 3.0% at 1 year, p < 0.0001), but not in women (5.3% vs. 3.6% at 30 days, p = 0.42; 7.5% vs. 5.9% at 1 year, p = 0.54). 35 Therefore, our model may not accurately predict onset of anemia in female patients.
Conclusions
This article proposes a two-step model for predictive medicine. In the first step, the risk factors are assessed using maximum risk during the baseline period within each diagnostic category. In the second step, the hazard associated with each risk factor is assessed. Despite the limitations noted, we have shown that this two-step model has a relatively high cross-validated accuracy. The similarity of the accuracy of the proposed approach to screening tools currently in clinical practice suggests that the model may be used to predict the development of anemia within electronic health records. Future studies are needed to verify the accuracy of the prognostic index in a prospective design and in clinical settings.
Footnotes
Acknowledgment
This material is the result of work supported with resources and the use of facilities at the Veterans Affairs Medical Center in Washington, DC.
Author Disclosure Statement
M.G.T., F.A., J.F.S., and C.H. have no real or potential commercial associations that might create a conflict of interest in connection with this article.
Abbreviations Used
Appendix 1
The following International Classification of Diseases 9 codes were used to identify anemia in the data.
249.00 250.00 250.01 790.2 790.21 790.22 790.29 791.5 791.6 V45.85 V53.91 V65.46 249.01 249.10 249.11 249.20 249.21 249.30 249.31 249.40 249.41 249.50 249.51 249.60 249.61 249.70 249.71 249.80 249.81 249.90 249.91 250.02 250.03 250.10 250.11 250.12 250.13 250.20 250.21 250.22 250.23 250.30 250.31 250.32 250.33 250.40 250.41 250.42 250.43 250.50 250.51 250.52 250.53 250.60 250.61 250.62 250.63 250.70 250.71 250.72 250.73 250.80 250.81 250.82 250.83 250.90 250.91 250.92 250.93
Appendix 2
To help with understanding of our method of calculating discrete hazard rates, note the example in Table 5. The data are right censored, which can occur if a patient dies before onset of anemia or the last recorded doctor visit occurs before first anemia.
In this example, patient 1 was diagnosed with anemia 5 days after first occurrence of hypertension. Similarly, patient 3 was diagnosed with anemia 3 days after first report of hypertension. Patient 2's last visit occurred before a diagnosis of anemia—either because the patient died or the recorded doctor visits end. Patient 2 has 8 days (0 to 7) of recorded data without getting anemia starting from the first day of diagnosis with hypertension. Similarly, patient n has 6 days of recorded data without a diagnosis of anemia.
To define notation, let mi be the index of the last day of data for patient i. If the patient is diagnosed with anemia, then mi is the number of days until a diagnosis of anemia (e.g., m1 = 5 in the example); otherwise mi is the index of the last day of data (e.g., m2 = 7 in the example). Let xij ≡ 1 if patient i is first diagnosed with anemia on day j and 0 otherwise, where j = 0, 1, 2, …, mi. Note that xij = 0 for j = 0, 1, …, mi−1 and xij can be either 1 or 0 for j = mi. That is, each row contains all 0's except for the last element, which can be either 0 or 1. Let
That is, yi = 1 if patient i is diagnosed with anemia, and 0 otherwise.
From these data, the daily hazard rate can be estimated. Let h(j) be the hazard rate of an anemia diagnosis on day j—that is, the probability that a patient is diagnosed with anemia on day j, given that the patient is alive on day j and has not yet been diagnosed with anemia on day j−1 (in this discussion, “day j” refers to the jth day since the first diagnosis of hypertension for a particular patient). An estimate for h(j) is the number of 1's in column j divided by the number of elements in column j. This can be quantified as follows. The number of elements in column j is
where 1{mi ≥ j} is an indicator function equal to 1 if mi ≥ j and equal to 0 otherwise. An estimate for h(j) is then
where it is assumed that xij = 0 for j > mi; that is, the gray boxes in Table 5 count as 0's in the sum.
Now, if we make the additional assumption that the hazard rate is constant as a function of time, h(j) = h, a constant, for all j, then an estimate for the constant hazard rate is the total number of 1's in the data divided by the total number of data points. The total hazard rate can be computed in two ways—either by summing the data elements row wise or by summing column wise. Using a row-wise sum, an estimate for the hazard rate is
In the previous example, using the data for patients 1–3, the numerator is 2 (the number of patients who are diagnosed with anemia) and the denominator is 6 + 8 + 4 = 18 (the sum of the number of data points in each row). Alternatively, the hazard rate can be estimated by summing column wise:
where T is the maximum column index over all the rows (T = max i {mi}). In the example given in Table 5 (using only data for patients 1–3), the numerator is 2 and the denominator is 3 + 3 + 3 + 3 + 2 + 2 + 1 + 1 = 18.