
Abstract
Abstract
Studies found that a small portion of the population spent the majority of health care resources, and they highlighted the importance of predicting high-cost users in the health care management and policy. Most prior research on high-cost user prediction models are based on diagnosis data with additional cost and health care utilization data to improve prediction accuracy. To further improve the prediction of high-cost users, researchers have been testing various new data sources such as self-reported health status data. In this study, we use three categories of medical check-up data, laboratory tests, self-reported medical history, and self-reported health behavior data to build high-cost user prediction models, and to assess the medical check-up features as predictors of high-cost users. Using three data-mining models, logistic regression, random forest, and neural network models, we show that under the diagnosis-based approach, medical check-up data marginally improve diagnosis-based prediction models. Under the cost-based approach, we find that medical check-up data improve cost-based prediction models marginally and medical check-up data can be a viable alternate data source to diagnosis data in predicting high-cost users.
Introduction
Fast-growing national health care expenditure is a problem faced by both developed and developing countries. According to the Organization for Economic Co-operation and Development (OECD) Health Statistics, the United States spent 17.2% of gross domestic product on health care in 2016. In South Korea (hereafter, Korea), per capita health care expenditure has increased at an annual rate of 9.23% between 2000 and 2016. Studies found that a small portion of the population spent the majority of health care resources; they highlighted the importance of predicting high-cost users by recognizing characteristics and patterns of their health care utilization, as well as proactively managing their utilization.1–3 This finding of a high concentration of health care spending in a fraction of the population is consistent in the subcategories of health care such as primary care and prescription drugs.4,5
There have been efforts to contain health care expenditures at a sustainable level and to assure the quality of care at the same time through third-party payment reforms. The core concepts of payment reforms are to expand the scope of payment units from per service and per diem to per case and per population and to shift the basis from cost-based to value-based payments. The Accountable Care Organization (ACO) experimented by the U.S. Center for Medicare and Medicaid Services (CMS) is the showcase of such efforts. Providers are forced to take the risk of high cost of care in this type of payment arrangement and they become interested in identifying a segment of the population with high risks of high health care cost and managing their health in the continuum of care. Thus, proactively identifying high-cost health care users with accuracy and managing their care is a significant first step in improving quality and reducing population health costs.3,6 Actively exploring data sources available for their identification and prediction, and gaining knowledge about the performance of analytical models and methods are significant endeavors in achieving these goals in the era of big data and analytics as well.
Since the 1980s, there has been research on the predictive modeling based on diagnosis data by using classical regression models to predict total health care costs, or logistic regression models to identify high-risk users. 6 More recent studies in high-cost user prediction extend this traditional approach by building diagnosis and/or pharmacy-based models with health care costs, utilization, and socioeconomic features to improve prediction accuracy.3,6 On the other hand, Bertsimas et al. apply a cost-based approach where they consider cost data an efficient surrogate for medical information, and they argue that primary cost information is the most accurate predictor of true costs. 6 Their approach is different in that they do not use diagnosis data as a starting point or a base of the cost prediction models.
Even though there are two approaches—diagnosis based and cost based—the main goal of researchers is to build more accurate prediction models. One approach in an effort to improve the prediction accuracy is to find new data sources such as self-reported health status.7–9 A data source worth considering for use in the prediction is medical check-up data. Medical check-up data include a variety of tests and intends to assess health status for early detection and prevention of diseases. One advantage of using medical check-up data is that they provide valuable information on health conditions of health care users with no or insufficient past medical information. Although the purpose of medical check-ups is early detection, that is, prediction and prevention of diseases, efforts to use medical check-up information in health care cost prediction are largely lacking. In this study, we attempt to use three categories of medical check-up data, laboratory tests, self-reported previously diagnosed self- and family diseases (medical history), and self-reported health behavior, to predict high-cost health care users.
The objectives of this study are to build high-cost user prediction models by using all three categories of medical check-up data, in addition to insurance eligibility, diagnosis, and health care utilization data that are information used in previous prediction studies; to assess the performance of medical check-up features as predictors of high-cost users. We analyze the National Health Insurance Service (NHIS) medical check-up database of Korea, which contains 354,819 examinees who had requested to have biennial medical check-ups in 2011 (test data) or 2012 (validation data) by using three different classification models: logistic regression, random forest, and neural network models. We examine diagnosis-based and cost-based approaches, which are two traditional sources of information used in high-cost health care user prediction, to assess the performance and value of medical check-up data in predicting high-cost users. With the prediction models proposed in this study, potential high-cost health care users can be identified for intervention and disease management at the time when periodic medical check-up results are being evaluated. Health agencies can recommend additional tests, disease, and/or health management programs to potential high-cost users based on specific disease risks detected by medical check-up results and the scores produced by our models.
In the next section, we present a literature review on high-cost user prediction. Then, we describe the data used and the testing methodology employed. We present our results and discussion followed by our conclusion.
Prior studies of high-cost health care user prediction
Table 1 presents a summary of the review of prior studies on the high-cost health care user prediction. We start the selection of studies to be reviewed with 55 prior studies included in Wammes et al., who perform a systematic review on characteristics and health care utilization of high-cost users. 10 Of those and through an additional search on PubMed, we finalize the selection with 15 high-cost user prediction studies since 2006. The table shows the country of data source, classification method used, and brief descriptions of target and predictor variables. The sources of data used in the studies are mostly health insurance: Medicare, Medicaid, and commercial health insurance in U.S. studies as well as national/government health insurance in studies in other countries.
Prior high-cost health care user prediction studies
HNA, health needs assessment.
Logistic regression is the most commonly used classification method in these studies. Linear classification models are mainly used in studies published in medical or health services research journals where interpretation and inference are emphasized, whereas nonlinear classification models such as classification trees and neural networks are used in studies whose focus is on the model development. However, none of the reviewed studies employs both linear and nonlinear classification models and attempts to assess the performance of models.
Most of the studies use a binary target variable. Researchers define high-cost users by using various methods, although the upper 10% is the most commonly used threshold in the definition. Demographic, diagnosis, and prior health care cost and utilization data are predictor variables used in most reviewed studies. Seven studies use self-reported data as predictors: Bayliss et al. and Leininger et al. use self-reported health needs assessments collected at the time of health insurance enrollment; Shenas et al., Wherry et al., and Fleishman and Cohen use self-reported health status data in the U.S. Medical Expenditure Panel Survey (MEPS).7,8,11–13 The studies that use self-reported health data tend to have relatively small sample sizes. Wherry et al. use 6725 observations, and Shenas et al. use the final dataset of 31,704 records.
Materials and Methods
Data
We constructed the study database by merging three datasets provided by the NHIS: insurance eligibility data, medical check-up data, and claims data. The NHIS is a uniform insurance policy administrator that covers all residents of Korea except for a small portion of the population who are covered through the medical aid program funded by the general tax. The NHIS datasets represent the entire population in Korea. Therefore, they are suitable sources of information for nationwide population-based studies. 14
The NHIS provides researchers with longitudinal data that start from 2002 with a half-million enrollees, which is a 10% random sample of the total number of medical check-up participants in 2002 and 2003. We start the construction of the study database with the medical check-up dataset that contains information for examinees who were requested to have biennial (annual for some nonoffice workers) medical check-ups in 2011 or 2012. We extract their claims and eligibility information from the claims and eligibility datasets, respectively, and merge them with medical check-up information.
To conduct this study, we received an approval and written informed consent exemption from the Seoul National University Institutional Review Board (IRB No.: E1801/003-001).
Eligibility dataset
The insurance eligibility dataset contains beneficiary information as to the eligibility for insurance coverage, and it consists of four parts: demographic data, death data, type of insurance (NHIS/medical aid program), and socioeconomic data. Demographic data include information about gender, age, and residing city/province. Death data include date and cause of death for beneficiaries who died during the year. Socioeconomic data include income bracket and disability codes (type and severity).
Medical check-up dataset
The medical check-up data are generated through the National Health Screening Program (NHSP), which is a free national medical check-up program for NHIS beneficiaries who are 40 years or older. NHIS enrollees eligible for the NHSP are required to have a medical check-up biennially. The NHSP consists of a set of laboratory tests, a questionnaire for self-reported medical history, and a questionnaire for self-reported health behavior. 15 Our study sample consists of 354,819 enrollees who participated in the NHSP in 2011 or 2012 with ages from 49 to 89.
Claims dataset
The claims dataset is a collection of claims submitted by clinics (physician practices) and hospitals to receive compensation by the NHIS for medical services that they provided to beneficiaries of the NHIS and finalized for payments by the Health Insurance Review and Assessment Service (HIRA). Clinics and hospitals are reimbursed based on a fee-for-service payment model. A fee schedule is predetermined annually by the government. A claim for each outpatient and inpatient visit is submitted to the HIRA for claims review and audit; the HIRA finalizes the payment and informs the NHIS of the finalized payment. The claims dataset consists of four parts: patient identification, provider information, service description, which includes type of service (outpatient/inpatient), date of service, and diseases, and service utilization, which includes the number of inpatient days, total charges, and charges paid by the NHIS and patient.
Variables
Target variable
Various thresholds for defining “high-cost” have been used, whereas the upper 10% is the commonly used threshold.3,7 In this article, we define individuals who incur costs in the upper 10% of the subsequent year's expenditure distribution as high-cost users and attempt to build their prediction models. We use the data from 2011 (to predict high-cost users in 2012) for model training, and we use the data from 2012 (to predict high-cost users in 2013) for model validation. In 2011, the upper decile accounted for 49% of the total expenditure in our database and the average expenditure for a high-cost user was about $9000, which is 8.6 times greater than that of the rest of the users in our database.
Discretized target variables (instead of using health care expenditure amounts as a continuous variable) are mainly used in high-cost user prediction, as shown in Table 1. There are a number of data issues that lead studies to use a binary target variable in high-cost user prediction. First, health care costs cannot be negative and the distribution is right-hand skewed with long, thick right-hand tails, with some data exhibiting extremely high costs. 16 Moreover, a high proportion of health care users with no health care costs makes logarithmic transformations commonly used to decrease the skewness ineffective. 17 Second, health care costs grow each year due, in part, to cost inflation. 18 Thus, when we compare and analyze health expenditures across years, we need to make adjustments for inflation to dollars of equivalent purchasing power. However, appropriate medical cost deflators may not be readily available. Third, there are short-term (but not long-term) expenditure increases after receiving the medical check-ups due to increased medical attendance for detected conditions and prevention. 19 Hackl et al. argue that short-term increases are due to overtreatment (because of doctors' strong risk aversion) or intended screening effects. 19 However, we do not expect that overtreatment would be costly enough to move low-cost users to a high-cost user group. Therefore, discretizing health care expenditure variables would mitigate the adverse effects of the data issues, and the use of binary target variables is practically appropriate when our objective is to identify health insurance enrollees who are at risk of becoming high-cost users in the future.
Predictor variables
Variables used as predictors in the model are summarized in Table 2. There are seven variables in the insurance eligibility dataset: gender, age, income bracket, disability codes (type and severity), residing city/province, and type of insurance, and we use the models with these eligibility variables as our baseline models. A total of 60 variables (38 with laboratory test results, 12 with self-reported medical history, and 10 with self-reported health behavior) are defined with information obtained from the medical check-up dataset, as presented in Table 2.
Summary of predictor variables
CCI, Charlson comorbidity index; CMS-HCC, Center for Medicare and Medicaid Services-Hierarchical Condition Category; GOT, glutamic oxaloacetic transaminase; GPT, glutamic pyruvic transaminase; GTP, gamma-glutamyl transpeptidase; LOS, length of stay; NHSP, National Health Screening Program.
Disease information in the claims dataset, which is coded by the International Classification of Diseases-10th Revision (ICD-10) coding scheme, is converted to the Center for Medicare and Medicaid Services-Hierarchical Condition Category (CMS-HCC) numbers to reduce the number of variables to a manageable size in the prediction model. The CMS-HCC model, implemented in 2004, is a risk adjustment model used to adjust Medicare payments to health care plans for the health expenditure risk of their enrollees. The intended use of the CMS-HCC is to pay insurance plans appropriately for their expected relative costs by adjusting for the population risk to health care costs. 20 Following Farley et al., we group the diagnosis codes by using Charlson comorbidity index groups and we use the groups in the prediction model.21,22 Moreover, comorbidity counts and diagnosis counts are used as predictor variables following Perkins et al., Farley et al., Bertsimas et al., and Tamang et al.3,6,21,23
We utilize 36 cost (charge) variables based on 22 cost variables proposed in Bertsimas et al., as presented in Table 2. 6 For example, they create an acute disease cost indicator, an indicator variable found by comparing the highest monthly cost with the average monthly cost to capture the cost pattern that exhibits a “spike” pattern (i.e., a sudden increase followed by a sudden decrease in cost). We reproduce and modify these 22 cost features following Bertsimas et al. 6 Then, we create an additional 14 variables to take advantage of information uniquely available in our database. For example, the NHIS covers dental and Korean traditional medicine; we are able to include costs for dental and traditional medicine as well as costs for inpatient, outpatient, and pharmacy, which are evaluated in most other cost prediction studies. We also include ratios for each type out of total costs as predictors.
In addition, we test health care utilization patterns as predictors of high-cost users. Farley et al. show that simple count variables of health care utilization such as counts of physician visits and hospital claims are effective in predicting high-cost users. 21 We include counts of hospital claims as well as inpatient length of stay (LOS), LOS by provider type, and an emergency service indicator as predictors in our models.3,9,24,25
Analytical model
In this study, we employ three classification models, logistic regression, random forest, and artificial neural network (ANN) models, to build high-cost user prediction models. Logistic regression is a linear classifier and is the most commonly employed tool in high-cost user prediction research.6,26 However, in recent studies, researchers have begun to utilize nonlinear models such as classification trees and neural network models to build high-cost user prediction models.6,13 Random forest is an ensemble classifier that consists of many decision trees and outputs the class that is the mode of the class's output by individual trees. 27 We use random forests because they often demonstrate better performance than other standard classifiers, are easy to tune, are robust to overfitting, and give estimates of what variables are important in the classification. 28 Multi-layer feed-forward neural network models are the third model that we employ. ANNs have been utilized to model complex relationships (such as highly nonlinear relational functions) among the predictor variables and the dependent variables. 29 ANNs have been one of the most popular algorithms used in recent medical informatics studies due to their superior predictive performance. 30 Using these three different types of models, we expect to compare the predictive performance of groups of variables more objectively.
Evaluation measures
We measure the performance of our models with two performance measures: the area under the receiver operating characteristic curve (AUROC) and cost capture. The AUROC is currently considered the standard method to assess the accuracy of predictive distribution models. All the prior studies we review in Table 1 (that used binary target variables) report AUROC as an evaluation measure. The AUROC avoids the supposed subjectivity in the threshold selection process, when continuous probability-derived scores are converted to a binary presence–absence variable, by summarizing overall model performance over all possible thresholds. 31 We report the AUROC to compare our model performance with the performance of prior studies. However, given the highly skewed nature of per capita health care spending in the upper decile (i.e., a small portion of population spends on the majority of health care resources), it is important to consider relative costliness. 3 Thus, from a cost prediction perspective, it is better to correctly predict one very high-cost user than many low-level high-cost users. The main limitation of the AUROC as an evaluation metric for high-cost user prediction is that it does not impose a penalty proportional to the misclassified individual's future costliness.3,32
To compensate for the weakness of our first performance measure, we use our second performance measure called cost capture by Tamang et al.
3
Tamang et al. explain that cost capture is based on the “predictive ratio,” which is commonly used to evaluate cost-prediction models in the health risk assessment literature and in actuarial reports. We follow the steps described in Tamang et al. to compute cost capture by using our validation dataset, and the measure is defined by the ratio of predicted high-cost user expenditures to actual high-cost user expenditures, as presented next in Equation (1):
K = N/10, where N is the sample size.
Evaluation model
To achieve the study objectives, we examine four tiers of evaluation models built to answer the questions presented in Figure 1. First, we incrementally add our datasets to our models and compute two performance measures to evaluate the predictive power of the full models (Boxes A1 and A2 in Fig. 1). Demographic information is given patient characteristics, which mostly do not change over time and cannot be changed or modified by health care systems, and most risk-adjustment and health care cost prediction studies include them in baseline models.3,7,9 Therefore, we start building our model with insurance eligibility information with seven variables. Then, we add the diagnosis information with 97 variables, which is another given patient characteristic that cannot be changed or modified by health care systems. To the eligibility and diagnosis information, we add medical check-up variables (laboratory tests, self-reported medical history, and self-reported health behaviors) and build the prediction models. Our final and full models contain all the variables, including cost and utilization data.
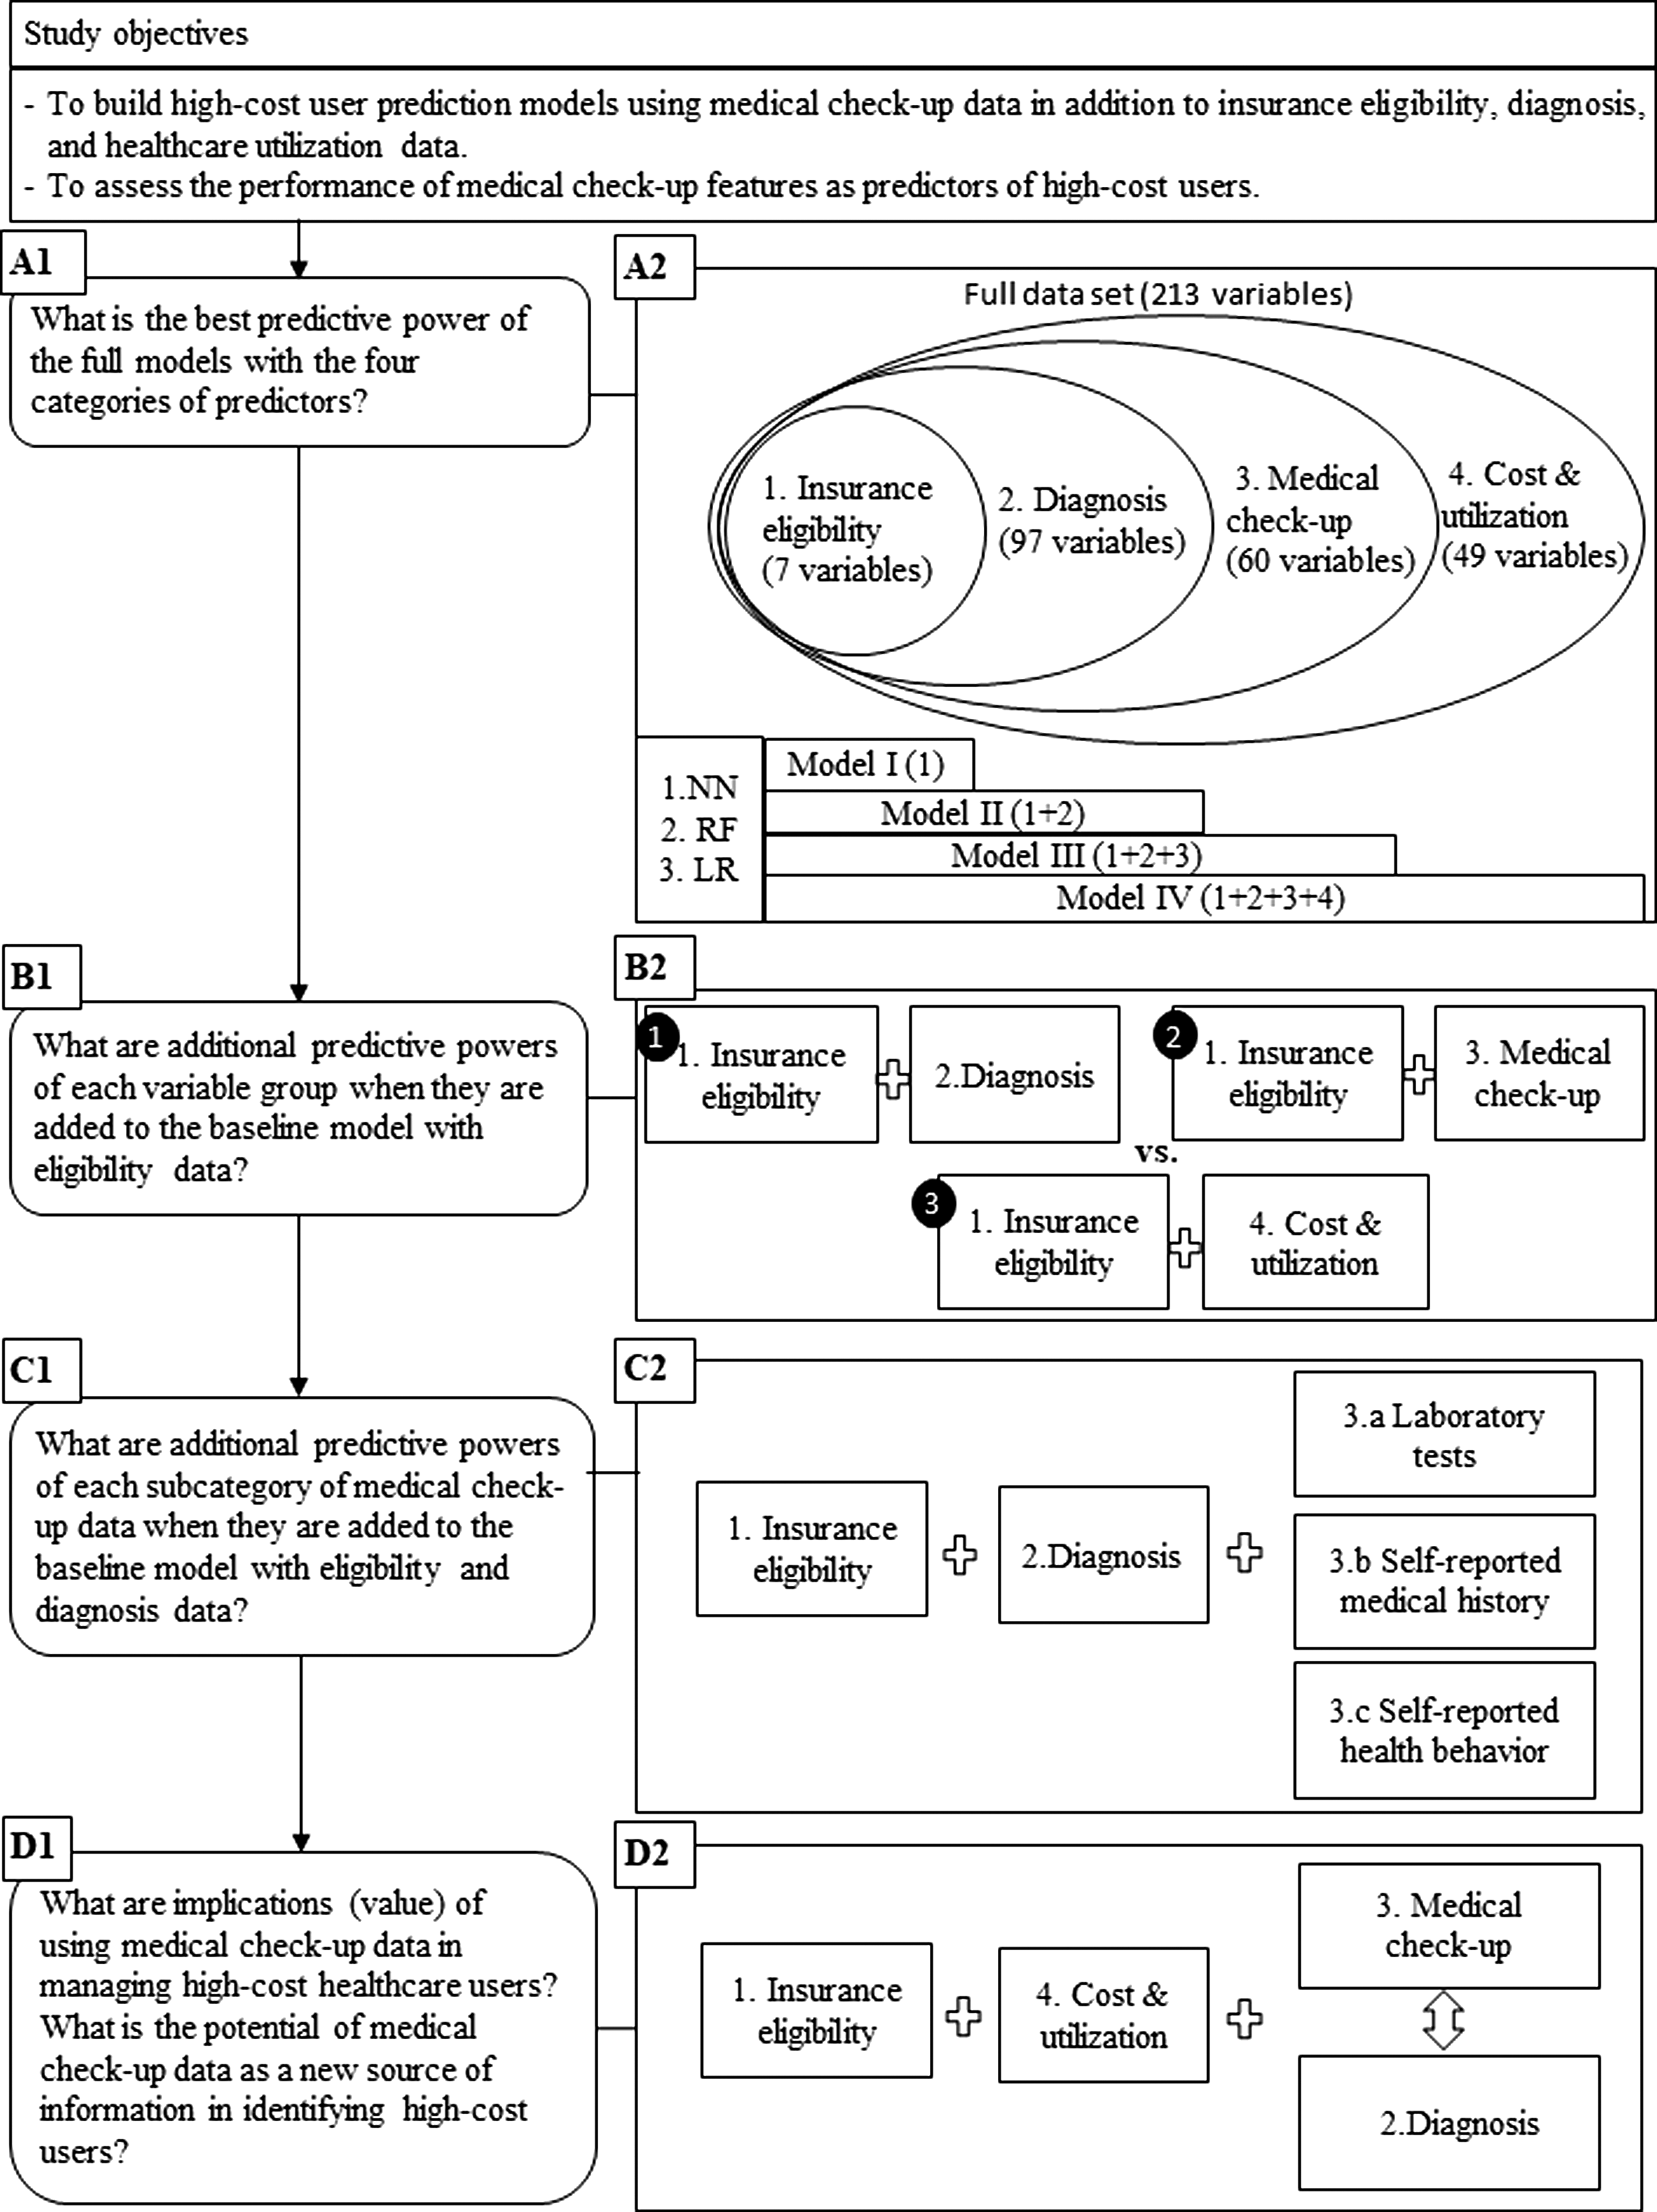
Conceptual framework of the study setup.
To assess the predictive power of variable groups generated from each dataset, we compare the additive performance of each variable group by adding them to the baseline model (Boxes B1 and B2 in Fig. 1). We also evaluate the contribution of each variable in predicting high-cost users with a normalized variable importance measure.
To assess the predictive power of medical check-up data further, we incrementally add the three categories of medical check-up data to the baseline model with eligibility and diagnosis data and compare the additive performance of its subcategory (diagnosis-based approach, Boxes C1 and C2 in Fig. 1). Diagnosis data constitute another given patient characteristic that cannot be changed or modified by health care systems. 6
To assess the value of medical check-up data in predicting and managing high-cost users, we test the data in the cost-based approaches (Boxes D1 and D2 in Fig. 1). Cost and utilization data are the most powerful predictor among the three variable groups. 6 In the cost-based approach, we first show how the cost features perform. Then, we compare the predictive power of medical check-up and diagnosis features by incrementally adding each dataset to our cost-based models (i.e., models with eligibility and cost and health care utilization data).
Results
Model performance
Table 3 shows the performance of our full models. Our prediction result improves as more data are added to the models. Our best performing model is the ANN model with the full dataset (Model 4 in Table 3), which achieves an AUROC of 0.843 and captures 66.1% of the costs attributed to high-cost users. This result is comparable to the results reported in Tamang et al., where they report an AUROC of 0.836 and 60% of cost capture; to those in Fleishman and Cohen, where they report an AUROC of 0.84 (cost capture is not reported).3,7 However, since these studies use different datasets (i.e., Tamang et al. use data from Denmark, whereas Fleishman and Cohen use MEPS from the United States) than what we use, we compare results as a reference only.
Performance of the full model
AUROC, area under the receiver operating characteristic curve.
Results from the analyses to assess the usefulness of variable groups and individual variables in the full models are presented in Tables 4 and 5, respectively. The cost and utilization data show the highest predictive power, with the best model achieving an AUROC of 0.84, and capture 65.5% of the costs attributed to high-cost users. In comparison, the best eligibility and diagnosis model (Model 2 in Table 4) achieves an AUROC of 0.806 and 55.8% of cost capture. The eligibility and check-up models perform the worst, with an AUROC of 0.75 and 46.9% of cost capture. We see a similar result in the variable importance table (with top 20 features) for the full models (Table 5). The variable with the highest variable importance is the 2-year total cost. Thirteen features of the top 20 features in Table 4 are cost and utilization features.
Evaluation of variable groups
Variable importance in the full model
Our result is consistent with the findings in prior studies. Boscardin et al. show that high health services utilization and costs in the previous year are very strong predictors for future high-cost health care users. 9 Bertsimas et al. argue that depending on the data-mining method, one can build good prediction models with cost data alone. 6 They show that diagnosis information adds to prediction accuracy when used in their clustering algorithm; whereas with classification trees, cost information alone results in similar performance.
Medical check-up data in the diagnosis-based approach
As shown in Table 6 (Model 2a, 2b and Model 3), the medical check-up data marginally improve the result. We have an increase in AUROC from 0.806 to 0.812 and a 1.4% point increase in cost capture with our ANN model. This shows that the medical check-up data provide marginal but additional predictive value. Even though improvement in the models' discrimination power is marginal, adding medical check-up features does improve the prediction results. However, adding self-reported health behavior features to the 2b model brings about only slight improvement for the ANN model and slight deterioration for the logistic regression model. Leigh et al. show a similar result, where statistically significant health behavior factors become less or not significant when diagnosis features are introduced into their health behavior factor models. 33 Consistent with the findings in Farley et al., we find that count features such as diagnosis count are the most significant variables (Table 7). 21 Ten laboratory test medical check-up features and their changes from previous medical check-ups are included in the top 20 variable importance table.
Evaluation of medical check-up variables in the diagnosis-based approach
Variable importance in the (eligibility+diagnosis+medical check-up) model
Medical check-up data in the cost-based approach
As shown in Table 8, the medical check-up data improve the prediction result marginally: We have an increase in AUROC from 0.84 to 0.842 and a 0.5% point increase in cost capture with our ANN model. We also find that our cost-based models with medical check-up data perform comparably well to the models that use cost and utilization data as well as diagnosis data with almost no difference. Even though we achieve the best result when we use all the datasets (i.e., both the medical check-up and diagnosis data, as shown in Model 4 in Table 8), our models with the medical check-up data (without diagnosis data) achieve comparably good results even when we compare them with our best models (Model 2 vs. Model 4 in Table 8). We explain this result by using the explanation presented in Bertsimas et al. 6 They argue that their algorithm is effective in predicting high-cost members when their model uses cost and diagnosis information in a hierarchical way. Specifically, their clustering algorithm first uses cost information and then uses diagnosis information in situations where diagnosis information can further discriminate between members belonging to different cost groups. They argue that cost is an efficient surrogate for medical information, except in cases where very dense medical data are available.
Evaluation of medical check-up variables in the cost-based approach
We showed earlier that the predictive value of diagnosis data is greater than that of the medical check-up data in Table 4. However, as Bertsimas et al. argue, since cost information can capture some of the information diagnosis that data provide (even in the absence of diagnosis data), the use of our medical check-up data as additional data under the cost-based approach helps to further discriminate between high-cost users and nonhigh-cost users. 6 Our result shows that the cost-based models with medical check-up data only perform equally good as the cost-based models with diagnosis data only. This shows that our medical check-up data are as effective as diagnosis data. Therefore, we argue that under the cost-based approach, medical check-up data can be a viable alternate data source to diagnosis data in predicting high-cost users when diagnosis data are not readily available.
Discussion
Our study makes two contributions. First, we use comprehensive medical check-up data to build high-cost user prediction models. To the best of our knowledge, our study is the first predictive study that employs medical check-up laboratory test results as predictors to identify high-cost users. Specifically, we build high-cost user prediction models by using all three categories of medical check-up data, laboratory tests, self-reported previously diagnosed self- and family diseases (medical history), and self-reported health behaviors, and we assess the performance of medical check-up features as predictors of high-cost users. Researchers have studied the medical check-up variables mostly in analytical settings by using a few variables or one category of data at a time to predict costs.33–35 Among the three, health behavior risks have been studied extensively. However, a few have prospectively linked individuals' risk factors to subsequent health care costs or high-cost users. 33 Thus, we fill the void in the literature by building high-cost user prediction models using medical check-up data, and we show that we can use the medical check-up data to improve prediction accuracy.
Second, we assess the value of medical check-up data as predictors in predicting high-cost users. We show how much medical check-up data improve prediction accuracy, and we compare the predictive value of medical check-up data with diagnosis and cost data by using our performance measures. To this end, we dichotomize current high-cost user prediction models into diagnosis-based or cost-based models and evaluate medical check-up variables as predictors under two different settings. Most of the prior studies in high-cost user prediction models build diagnosis-based and/or pharmacy-based models. Then, they may use cost, health care utilization, and socioeconomic variables as additional variables in their models. We call this modeling approach a diagnosis-based approach and show that medical check-up data provide marginal but additional information to diagnosis-based prediction models.
A notable study by Bertsimas et al. shows that primary cost information is the most accurate predictor of true costs. 6 They argue that one can build good prediction models with cost data alone. We call their approach a cost-based approach and show that under this method, medical check-up data can be a viable alternate data source to diagnosis data when used as an additional data source in cost-based models. This result implies that we can still build effective high-cost user prediction models when diagnosis data are not readily available. Even when diagnosis data are available, the cost-based approach can facilitate the prediction model building and operation processes with less data preprocessing requirements. We need to do some extensive data preprocessing to use diagnosis data due to a number of reasons. Diagnosis data are produced by clinicians who encode their diagnoses and procedures in terms of disease classification codes. However, they are most often completed and submitted by a separate dedicated billing operator. Because of the inevitable variations in interpretations introduced by these practices and also due to a large number of diagnosis codes in claims data, researchers always group diagnosis codes to a more manageable size by using appropriate grouping schemes (developed or chosen based on research purpose) before they use them in their prediction models. 6 In addition, disease classification codes are modified and changed over time (e.g., ICD-9 to ICD-10). This requires appropriate mappings before researchers can use diagnosis data in a longitudinal dataset. On the other hand, cost information does not require much preprocessing. Our result implies that some costs of building and operating prediction models could be reduced by adopting the cost-based approach.
Boscardin et al. argue that when we evaluate new variables in cost prediction, the cost of collecting the data must be weighed against the cost of using other readily available data sources such as administrative data. 9 The medical check-up data we propose to use in this study are already available to national health insurance agencies in Korea through government-sponsored free NHSPs. Thus, the extra collection cost is minimal. However, we believe that the utility of the medical check-up data reaches beyond predictive power alone, and we can help provide information that will facilitate intervention development and adoption at the individual beneficiary level. 9 Currently, the national health insurance agencies in Korea use the medical check-up data to detect certain diseases such as diabetes. When an insurance enrollee receives a medical check-up at a designated hospital, the result is analyzed and a screening report is sent to the enrollee within 2 weeks after screening. The screening report shows various disease risks based on the general screening results and whether there is any need for additional tests. For example, those with a fasting blood sugar or blood pressure level outside the normal ranges are offered a secondary examination at no cost to confirm a diagnosis of diabetes or hypertension. Since each enrollee's medical check-up result can be linked with his/her medical and/or cost information at the national health insurance agency in Korea, our models can be employed as an additional surveillance tool to identify those who need more medical attention and management based on the likelihood of becoming high-cost users at the time when periodic medical check-up results are being evaluated. Health agencies can allocate more resources to target and manage potential high-cost users with appropriate disease management programs to reduce long-term costs.
There are some limitations in this study. First, our findings are based on a sample of insurance enrollees whose ages are between 49 and 89 years. Since a medical check-up is recommended for an older population in the United States and elsewhere, so is the data availability.19,36 Thus, the prediction models with medical check-up data tend to target an older population. However, since the majority of high-cost users are 50 years and older in Korea and Denmark, we believe that our modeling approach is reasonable.3,37
Second, given that our medical check-up data contain self-reported data, the potential for errors in omission and response bias exist. Some previous studies have indicated the potential for response bias by using self-reported data.38,39 However, other studies have also shown that predictive models using self-report disease history perform similarly to predictive models using administrative medical records data.40,41 Boscardin et al. argue that these latter studies provide an additional case for reliability of the data, and they show that self-reported health data improve the ability of their model to identify high-cost users beyond what is possible with administrative data alone. 9
Conclusions
We develop high-cost user prediction models with data provided by the NHIS of Korea, which includes medical check-up information as well as insurance eligibility and claims information. We evaluate the performance and value of medical check-up data as predictors. First, we show that under the diagnosis-based approach, medical check-up data provide marginal but additional information to diagnosis-based prediction models. Second, under the cost-based approach, medical check-up data can be an alternate data source to diagnosis data in predicting high-cost users, especially when diagnosis data are not readily available. We expect our study to inform health care service providers and policy makers to manage the differential risks posed by the small fraction of users who account for the bulk of health care spending.
Footnotes
Author Disclosure Statement
No competing financial interests exist.