




Abstract
Abstract
To improve the accuracy of midterm power load forecasting, a forecasting model is proposed by combing kernel principal component analysis (KPCA) with back propagation neural network. First, the dimension of the input space is reduced by KPCA, then input the data set to the neural network model, optimized by particle swarm optimization. The monthly average of daily peak loads is forecasted to modify the daily forecast values and output the daily peak load in the end. Using the data provided by European Network on Intelligent Technologies to test the model, the mean absolute percent error of load forecasting model is only 1.39%. The feasibility and validity of the model have been proven.
Introduction
Load forecasting has become the basic work of many power system departments such as planning, power consumption, and dispatching. Improving the level of load forecasting has always been a hot topic both at home and abroad. 1 According to the timescale, load forecast can be roughly divided into three categories: short-term load forecast, midterm load forecast (MTLF), and long-term load forecast (LTLF). 2
Midterm load forecasting refers to the prediction of load value in the next few weeks to several months. The improvement of midterm load forecasting accuracy is convenient for planned power management, which is conducive to rationally arranging the operation mode of power system, helping to reduce power generation cost and formulating reasonable power supply construction plan.
The short-term load forecasting refers to daily load forecasting and weekly load forecasting, and power dispatchers use the recent load trend changes and the load situation in the same period of the previous year to predict the load value in the next day or week.
Long-term load forecasting is used to predict the power consumption after a long period of time in the future, generally up to 3–5 years or even longer. It is mainly used for medium- and large-scale power grid planning such as power grid capacity expansion. MTLF is usually used for planning purposes, such as adjusting midterm plans and resource allocation. 3
Over the past 50 years, dozens of different load forecasting methods have been used and recorded. However, it is evident that MTLF is usually ignored because of the error accumulation. Xia et al. 4 reported the difficulty in accurate load forecasting due to the unstable randomness of various factors such as the development of the national economy. There are many methods used for MTLF such as time sequence method,5,6 linear regression method, 7 gray model,8,9 support vector machine (SVM),10,11 and neural network.12–15
In literature, 5 Warrington et al. incorporated the time sequence reserve into the existing control scheme to adapt to the main technical and economic practices of the time series reserve in the power market. Participants were required to be able to respond to prediction errors in a predetermined manner. Their power output is corrected by scaling with the prediction error achieved during successive trading intervals while still stabilizing the grid frequency.
In literature, 6 the aim was to develop and use an evolving linear model to predict the synchronized time series, by assuming there are multiple synchronized time sequences that are related to the time series being predicted. The idea is to use the information contained in the relevant series to make predictions. While the time sequence model can describe a random process. However, the prediction effect is often not very good only by time series modeling and forecasting, as there may be autoregressive phenomena in forecasting residual without considering multiple factors.
In literature, 7 a new technology for predicting power load is proposed. This technique is based on fuzzy linear regression. The linear regression fuzzy model was developed using load impact factors such as load, population, and annual growth factors for the previous year. The results show that the average absolute error of the forecast weekly average daily load does not exceed 3.68% of the annual actual load. The linear regression method is a relatively mature algorithm. Using the model to statistically analyze the load data, the load change law can be accurately identified and a more accurate prediction can be made. However, there are many factors affecting the load, and these factors are not clearly reflected in the linear regression model.
The principle of additional prediction of the same dimension is discussed based on the gray theory in literature. 8 It only requires a smaller amount of information for easy calculation. In addition, it has higher modeling accuracy. The model is used for midterm load forecasting in a region with an error rate of around 3%. In literature, 9 a medium-term forecast was given based on the power consumption of Ningxia Autonomous Region in the next 5 years. The gray model has the characteristics of less data and less information, and it reveals the evolution of the entity. The gray model has many advantages, such as a small sample of data, without considering the distribution and trends, simple principles, convenient operation, high accuracy, and strong testability, and is widely used. However, the gray model is an exponential function and is suitable for a situation when the load is growing rapidly.
A multiple least-squares SVM-based midterm electricity market clearing price forecasting model is proposed in literature. 10 The data classification and price forecasting module is designed to preprocess input data into corresponding price regions first and then predict electricity prices. Compared with the prediction model using a single least-square SVM, the proposed model shows improved prediction accuracy on the peak price and the overall system.
In literature, 11 the cointegration technique was used to analyze the influencing factors, and the cointegration correlation formula was used to predict the medium- and long-term power load. To improve the prediction accuracy, the SVM was used to correct the prediction error of the cointegration method. Compared with the traditional prediction method, the SVM method has a great improvement, but the prediction result of the SVM method has hysteresis relative to the actual value, and the error at the inflection point is large, which affects the prediction accuracy.
In the literature, 12 two techniques for midterm load forecasting of Al-Dakhiliya distribution system based on linear regression and neural network have been developed. The models developed include historical monthly load data, temperature, humidity, and wind speed. The simulation results show that the neural network nonlinear model is superior to the traditional multiple linear regression model, and the discovery is more reasonable and satisfactory. In the literature, 13 neural network techniques and fuzzy logic were used to develop a two-stage medium-term load forecaster. The first stage consists of a neural network that trains historical data that are readily available in the supervised era. The load forecast generated in the first stage is then converted into a temperature-sensitive module in the second stage with a fuzzy logic-based module. Fuzzy logic is well suited to characterize the uncertainty that occurs in load behavior due to weather changes. Because the neural network has a strong self-learning ability and a complex nonlinear function fitting capability, it is very suitable for power load forecasting.
The back propagation neural network (BPNN) is one of the commonly used neural networks. It has the characteristics of simple structure and high fitting accuracy. The literature 14 uses wavelet analysis and BPNN to realize the midterm forecast of monthly load and obtains good prediction results. However, the initial value of the neural network weight threshold is random and easy to fall into local minimum. Since the power load is affected by various complicated factors, the input space has a large dimension and there is a strong correlation between various factors such as temperature and season. Therefore, it is necessary to decouple the input space for dimensionality reduction.
In literature, 15 the principal component analysis (PCA) algorithm is used to extract linearly independent input variables from the original input space, which effectively simplifies the structure of the model. However, the commonly used linear dimensionality reduction method has shortcomings, which is based on the premise that the subspace embedded in high-dimensional data space is linear or approximately linear.
The literature 16 proposes a method to modify the daily load forecasting value using weekly load forecasting. The mean absolute percentage error (MAPE) has been increased from 1.78% to 1.59%. The prediction accuracy has been effectively improved, but the weekly load forecasting still has an error accumulation in MTLF and LTLF, which affects the accuracy of load forecasting. The essence of BPNN is in the forward flow of the signal and the back propagation of the error, constantly adjusting the weights and thresholds of each neuron until the error satisfies the accuracy condition, and the learning result is memorized by storing the weight. So, BPNN is suitable for the application of power load forecasting. However, the initial selection of weights and thresholds in BPNN is random, so it is easy to fall into the local minimum and affect the prediction error.
It is analyzed that there are three problems about midterm power load forecasting in the existing literature, including the initial selection of weights and thresholds in BPNN is random, the input space of the neural network is too complex, and there are accumulation errors in rolling prediction. To solve these problems, a forecasting model is proposed by combing kernel principal component analysis (KPCA) with BPNN, which can improve the accuracy of MTLF. First, in midterm power load forecasting, the amount of data is very large, and the computational consumption and space storage may be unbearable, so the dimension reduction is very important.
To analyze and process large amounts of data efficiently and overcome the problem of excessive dimensionality, the complexity of the forecast model can be reduced by the dimensionality reduction of multidimensional historical data input through KPCA. The dimension-reduced historical data are then input to BPNN, which is optimized by particle swarm optimization (PSO). The monthly average of daily peak loads is forecasted to modify the daily forecast values. The daily peak loads of a month are output in the end. Based on KPCA-PSOBP, this article studies the MTLF. Thanks to the competition organized by EUNITE, the historical data provided by EUNITE are used to demonstrate the feasibility and validity of the model.
The rest of this article is organized as follows. In the BPNN Model section, the model of BPNN is presented. The proposed improvement of forecasting model is formulated in the Improvement of Forecasting Model section. In the Experiment section, a case study on the proposed model is presented. Finally, conclusions are given in the Results and Discussion section.
BPNN Model
The traditional BPNN is a three-layered feedforward network model with input layer, hidden layer, and output layer. It contains the forward propagation of the work signal and the reverse propagation of the error signal.
If the input layer contains n neurons, the hidden layer contains h neurons and the output layer contains m neurons. The input is
The weights and thresholds of the model are adjusted according to the back propagation of the error signal until the expected error or number of iterations is reached.
Improvement of Forecasting Model
Based on the forecasting model, the accuracy of model prediction has been improved in three aspects: reduction and reconstruction of input data space, optimization of BPNN algorithm, and error correction of output data.
Reduce the dimension of input space based on KPCA
The input of the neural network forecasting model should be those that have a greater impact on the results and have less influence on each other. Therefore, under the premise of ensuring effective information, it is necessary to rationally reconstruct the input space and improve the model's learning ability and generalization ability. Recently, PCA is one of the common dimensionality reduction methods. The input space is reduced according to the contribution rate of each principal component.
If Calculate the covariance matrix of the sample set:
Obtain the objective function:
Calculate the matrix eigenvalue of Calculate the set after dimension reduction:
The contribution rate of the principal component is
Because the input space of the load forecasting model does not strictly satisfy the prerequisite of linear feature extraction, the nonlinear PCA method based on kernel function is introduced into the forecasting model.
The method of KPCA based on kernel function is to map the samples in the original input space nonlinearly to the high-dimensional linear space D, and then use the PCA in the feature space.
According to the Mercer theorem, there exists a nonlinear mapping
It is difficult to solve the eigenvalues and eigenvectors of the covariance matrix directly.  can be set as the eigenvector of C, and

where
where  , then:

where  has been calculated, the eigenvalues and eigenvectors can be calculated successively as well.
Finally, determine the input space after KPCA based on the contribution rate of the principal component and the cumulative contribution rate.
Optimization of BPNN based on PSO
In general, the weights and thresholds of the BPNN are randomly selected. PSO is based on the adaptability of the algorithm to update the position and velocity of the particles to achieve the global optimal solutions. It can optimize the selection of initial value, reduce the possibility of traditional neural network into local optimum, and improve convergence speed and precision.
Suppose that in an N-dimensional target search space, there are M particles forming a community, where the m-th particle position is
It is possible to assess whether
The steps of optimizing the neural network are as follows:
Set the weight and threshold of the neural network as the initial position of PSO; set the training error of neural network as the fitness of PSO; update the particle velocity and position until the end of the iteration, looking for the individual particle optimal value and global optimal value; and finally, the global optimal value obtained by PSO is taken as the initial weight and threshold of the neural network algorithm.
Modify the daily peak load
According to the principle of near-large and small, the known load value of the day has a greater influence on the prediction accuracy of the subsequent period in the day, so usually, the load forecasting is used in the way of rolling prediction, which caused the cumulative error and affected the accuracy of the forecasting model greatly. Also, the power load has a certain periodicity. So, the method of monthly load to revise the daily load is proposed. Monthly load forecasting does not need to roll the forecast, neither cumulative error nor conclude all the forecast date, to make up for the lack of daily load forecast.
The steps of revising the daily load forecast value based on the forecasted average daily peak load of a month are as follows:
Forecast Wy based on the history value, where Wy is the average daily peak load of a month that is forecasted and obtain The correction value can be obtained:
Finally, the final daily peak load:
where
Experiment
Experimental configuration
For the realization of the model algorithm, MATLAB is used as a calculation tool, because it can directly provide analysis functions and also has unique advantages in matrix calculation and data drawing. The configuration of PC is Intel Core i5-3230, 8G RAM, and 500G hard disk.
In 2001, EUNITE organized a competition on the load forecasting. The given information includes load data for the past 2 years, temperature over the past 4 years, and holiday events. The task of competitors is to supply the prediction of maximum daily values of electrical loads for January 1999. Evaluation of submissions would mainly depend on MAPE, maximum error (ME).
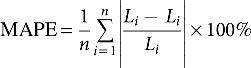

To analyze and compare the prediction results of KPCA-PSOBP, models such as BP, PSOBP, and PCA-PSOBP, as well as the model revised by the forecasted average daily peak load, are proposed.
The comparison is divided into two steps:
Step 1: The original sequence is predicted using four methods, respectively, and the prediction result is compared with the actual load data.
Step 2: The prediction error is evaluated by MAPE and ME.
Description of data
Power load is mainly affected by historical load, temperature, and type of date. If the temperature is considered, it is necessary to predict the daily temperature of the next stage (i.e., the daily temperature of the next month). The accuracy of temperature prediction is not guaranteed, and the complexity of the prediction model is improved. Considering the temperature may not improve the accuracy or even affect the stability and prediction accuracy of the model, the temperature is not taken into account in this article. The input and output of the model are shown in Table 1.
The input and output of forecasting model
The week and date types are quantified, the week is set from 1 to 7, the date in addition to Christmas and New Year's Day is set to 2, the remaining holidays set to 1, and the general day set to 0. The data set of January and February of 1997 and 1998 will be used as the training set of the model.
First, KPCA is used to reconstruct the input space. The kernel function chosen by this prediction example is the Gaussian kernel function. The contribution rate of the principal component and the cumulative contribution rate obtained by KPCA are shown in Table 2.
Contribution rates of principal components and accumulated contribution rate
The greater the contribution rate, the stronger the ability to characterize the new variable's comprehensive information. Usually it is appropriate to make the cumulative contribution rate above 85%, which can not only reduce the loss of information but also reduce the variables and simplify the problem. It can be found that the cumulative contribution rate has achieved 95% when the dimension of the input variable is 11 to replace the original input space. The network model structure is simplified under the premise of guaranteeing effective information.
The reconstructed input space is used as the input of the PSO-BP model. The initial parameters of the model are shown in Table 3.
Parameters of particle swarm optimization-back propagation model
BP, back propagation; PSO, particle swarm optimization.
The model is trained until the iteration ends or the expected error is reached. Then, the prediction sample is input into the trained prediction model, and the load forecast value is output.
Finally, the daily peak loads of the forecasted month are corrected based on the forecasted average daily peak load of a month. According to Figure 1, it can be found that the monthly load has a strong seasonal and annual periodic rule, so the input of the forecast model adopts the monthly load value of the past 3 months, and output the average daily peak load of a month. The predicted value is 756.47 MW (while the actual value is 749.26 MW). Then, Equations (11) and (12) can output the final result.
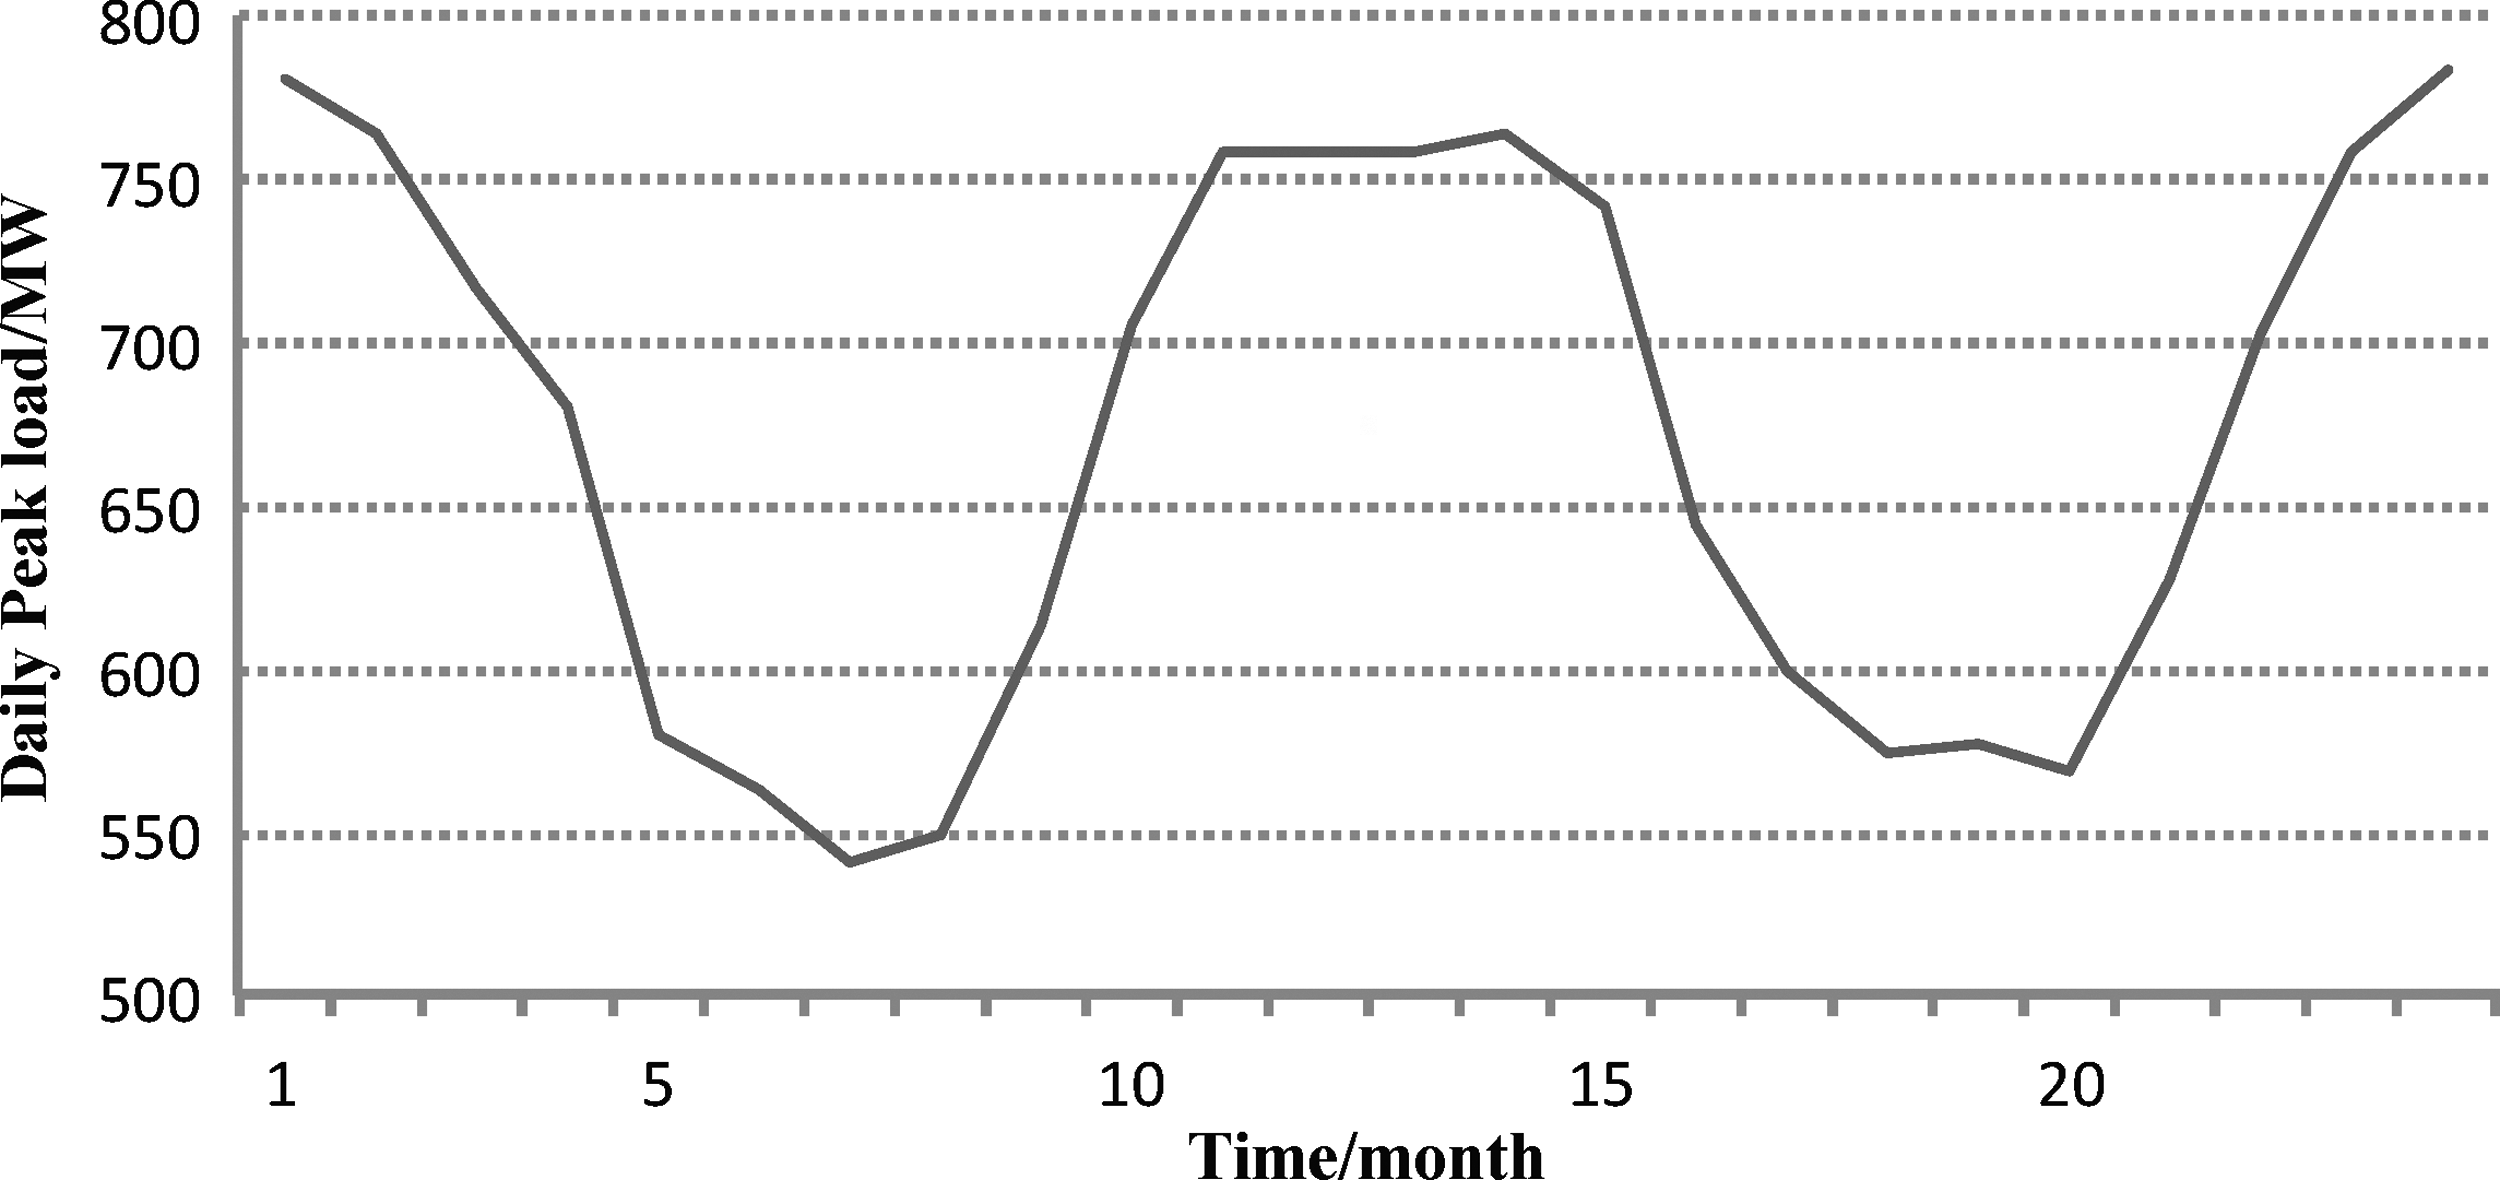
The average daily peak load in each month from the year 1997 to 1998.
Results and Discussion
The results of the daily peak load of KPCA-PSOBP model are shown in Table 4. The results of the four different models are shown in Figure 2, and the evaluation indicators are shown in Table 5.

Results of daily peak load forecasting in different models.
Results of the forecasting model
MAPE, mean absolute percentage error; ME, maximum error.
The comparison of four different forecasting models
From the results of Table 4 and Figure 2, it can be seen that the prediction results of the MTLF can reflect the actual load and prove the feasibility of the model. Compared with the BP, PSO-BP, and PCA-PSOBP, the MAPE and ME of the KPCA-PSOBP are smaller and the running time is shorter, reflecting the effectiveness of the model. PSO improves the performance of the BP. Compared with the noninput dimension reduction processing, the space dimension reduction reconstruction removes the redundancy and simplifies the prediction model. Compared with the linear dimensionality reduction, KPCA-PSOBP overcomes the shortcomings of linear dimensionality reduction and the prediction result is more accurate. In addition, it can be seen from Table 5 that the method of calculating the daily load based on the monthly load can effectively compensate the midterm prediction of the cumulative error of the daily load and the prediction accuracy has been further improved.
Since the launch of the load forecasting competition, many scholars have established different models based on the load data provided by the organizers to predict the load, such as SVM, 17 self-organizing fuzzy neural network, 18 empirical mode decomposition-PSO-SVM, 19 and fuzzy support vector machines. 20 The comparison of prediction accuracy is shown in Table 6. It can be seen from the comparison that the prediction accuracy of the proposed method is the highest and the volatility is small.
Accuracy comparison of different models
EMD, empirical mode decomposition; FSVM, fuzzy support vector machines; SOFNN, self-organizing fuzzy neural network; SVM, support vector machine.
Conclusion
The MTLF model is proposed based on the combination of KPCA and improved neural network, and it can improve the accuracy of model prediction in three aspects: reconstruction of input data space, optimization of prediction algorithm, and error correction of output data.
The KPCA method based on kernel function is introduced into MTLF. It can realize the dimensionality reconstruction of the input space, make up for the insufficiency of the linear dimension reduction method, remove the redundancy, and simplify the model structure.
The particle swarm algorithm is used to optimize the neural network algorithm, and the performance of the algorithm has been improved.
A method that the monthly average of daily peak loads is forecasted to modify the daily forecast values is proposed, which effectively reduces the cumulative error of MTLF and improves the accuracy of MTLF.
The prediction results show that the KPCA-PSOBP model can accurately predict the power load and is an effective method for MTLF.
Footnotes
Acknowledgments
The research presented in this article was supported by the National Natural Science Foundation of China, and, in part, by the Jiangsu Province Science and Technology Support Plan project. The authors acknowledge the National Natural Science Foundation of China (Grant: 51507086), the Jiangsu Province Natural Science Fund (Grant: BK20150839), and the Jiangsu Province Natural Science Fund (Grant: BK20170841).
Authors' Contributions
Z.L. is the main writer of this article. He proposed the main idea, completed the model, and analyzed the results. X.S. introduced the kernel principal component analysis method in MTLF. S.W. used the particle swarm algorithm to optimize the neural network algorithm, M.P. forecasted the monthly average of daily peak loads to modify the daily forecast values, Y.Z. used the data provided by European Network on Intelligent Technologies to test the model, and Z.J. gave some important suggestions for KPCA-PSOBP. All authors read and approved the final article.
Author Disclosure Statement
No competing financial interests exist.