
Abstract
Stock market prediction acts as a challenging area for the investors for obtaining the profits in the financial markets. A greater number of models used in stock market forecasting is not capable of providing an accurate prediction. This article proposes a stock market prediction system that effectively predicts the state of the stock market. The deep convolutional long short-term memory (Deep-ConvLSTM) model acts as the prediction module, which is trained by using the proposed Rider-based monarch butterfly optimization (Rider-MBO) algorithm. The proposed Rider-MBO algorithm is the integration of rider optimization algorithm (ROA) and MBO. Initially, the data from the live stock market are subjected to the computation of the technical indicators, representing the features from which the necessary features are obtained through clustering by using the Sparse-Fuzzy C-Means (Sparse-FCM) followed with feature selection. The robust features are given to the Deep-ConvLSTM model to perform an accurate prediction. The evaluation is based on the evaluation metrics, such as mean squared error (MSE) and root mean squared error (RMSE), by using six forms of live stock market data. The proposed stock market prediction model acquired a minimal MSE and RMSE of 7.2487 and 2.6923 that shows the effectiveness of the proposed method in stock market prediction.
Introduction
The extraction of information from the data is performed with the concept of predictive analysis, which is an area in data mining that can be used for the prediction of the behavior trend patterns. 1 The predictive analytics is defined as the prediction of each individual, organizational element with a more detailed level of granularity. 2 The working of the predictive analytics is based on observing the relationship among the predicted elements and the explanatory elements of the occurrences that happened in the past and then uses it for the prediction of the unknown outcome. The present and the past facts are analyzed for predicting the future, and the models are developed for the prediction of future behaviors and the events. Most of the models of prediction are capable of producing improved results that represent improved likelihood about the given event. The project risk management, fraud detection, marketing, customer retention, clinical decision support systems, and analytical customer relationship management are some of the applications of the predictive analysis. 3 Machine learning is a type of artificial intelligence that contains various advanced statistical methods of classification and regression that are useful in the predictive analysis. 4 Neural networks (NNs) are used in predicting, forecasting, and analysis, and the deep NN is a variant of the multilayer perceptrons used by various researchers in predictive analytics. 5 Predictive analytics acts as a highly demanding area in the field of business intelligence, and it is important in the basic growth of the organization. 6
The stock market forecasting is very tedious as compared with the other areas due to the changing behavior of the stock market. 7 The prediction of the stock market by using intelligent systems was developed to make the decision about the trade. In recent years, various hybrid intelligent systems were developed to perform complicated automation works, modeling expertise, and decision support aided with the common analytical methods to perform the analysis of the stock market. 8 The current stock data prediction acts as a major need for the research due to the presence of a number of optimization tools for the prediction of the future market. The artificial NN (ANN) 9 is considered as an efficient optimization tool for predicting the time series, and also, it predicts the hidden and the unknown records. 10 The advancements in the deep learning algorithm have produced various trading algorithms to predict the stock price changes with more accuracy. The deep learning method 11 reshapes the basics of the predictive analysis and has achieved various advantages in the fields of machine translation, 12 question answering, 13 speech recognition, 14 and in various other areas. 15 In recent years, the support vector machine (SVM), 16 which is a supervised learning method, has achieved popularity. This method makes use of its ability for learning the rule changes presently in the time series and also, it is used in the prediction of the future. 17
The statistical-time series models, such as the Kalman filter, state space, ARIMA, exponential smoothing, and the regression, are used in the analysis of the stock market. These models make use of a single point and find it difficult to fit the data in nonlinear nature. Also, the stock market is a complex system with noisy characteristics. 18 For solving these problems, the genetic algorithm, SVM, and the NN based on statistics are recommended. These methods provide better values of the forecast but are not suitable for the prediction of the fuzzy data. 19 The fuzzy models are capable of tolerating the problem of approximation, uncertainty, and imprecision. 20 The excess of information produced by using the stock market is used to improve the knowledge of the investors. 21 The prediction of the characteristics of the prices of the stock market acts as an important area for most of the financial scientists and investors. The investment in the stock market paves a way to obtain profit that requires the correct data from the stock market, trend forecasting, and stock changes. Thus, it is necessary to make the use of reliable and powerful tools to predict stock prices. 17 The efficient prediction algorithm provides a considerable benefit to traders. The accuracy of prediction models depends on the features selected, which are the input to the prediction model. Though different methods are developed for the prediction of the stock market, the feature selection from the financial news is complex. Deep learning methods can extract features from a large set of raw data, which makes it potentially attractive for stock market prediction. By considering the drawbacks in the existing stock market prediction techniques, this article introduces the stock market prediction technique to effectively predict the stock price.
The main aim of this article is to design and develop a system named Rider-monarch butterfly optimization (MBO)-based deep-convolutional long short-term memory (ConvLSTM) model, for predicting the state of the stock market. The inputs to the proposed system are the current and past status of the stock market. Initially, the input data obtained from the live stock market are fed to the feature extraction process to extract the required features based on the technical indicators, namely as double exponential moving average (DEMA), rate of change (ROCR), average true range (ATR), relative strength index (RSI), simple moving average (SMA), average directional index (ADX), commodity channel index (CCI), moving average convergence divergence (MACD), on balance volume (OBV), Parabolic SAR (SAR), exponential moving average (EMA), and triple exponential moving average (T3). The technical indicators are responsible for the provision of the data needed to predict the stock market effectively. The data features obtained from the technical indicators are clustered by using the Sparse-Fuzzy C-Means (FCM) algorithm. Then, the highly significant features are given to the proposed Rider-MBO-based Deep-ConvLSTM model, which acts as the prediction module. Here, the Deep-ConvLSTM model is trained by using the proposed Rider-MBO algorithm for predicting the stock market.
The major contributions of the article
Rider-MBO-based Deep-ConvLSTM model for predicting the stock market
The Rider-MBO-based Deep-ConvLSTM model is newly developed for predicting the future of the stock market.
Rider-MBO algorithm
The Rider-MBO algorithm is developed by integrating the rider optimization algorithm (ROA) and MBO to train the Deep-ConvLSTM model.
The organization of the article is as follows: Introduction section gives the introduction to stock market prediction. Motivation section discusses the literature survey of various existing methods of stock market prediction. Proposed Methodology: Stock Market Prediction Using Rider-MBO-based Deep-ConvLSTM Model section deals with the proposed Rider-MBO-based Deep-ConvLSTM model for stock market prediction. Results and Discussions sections appear next. Finally, Conclusion section concludes the article.
Motivation
In this section, the survey of various techniques used in stock market prediction and the challenges of the existing methods are discussed.
Literature review
The review of the eight existing methods is discussed: Weng et al. 22 used the decision trees, NNs, and SVMs for a financial expert system that was capable of improving the prediction accuracy. In addition, effective decisions on the commodity, index, or stock were made by using the intelligent decision-making tool. The drawback of this method was the exclusion of the other online data sources, and the applicability of the sources was not clear. Efendi et al. 20 designed the Improved Fuzzy Random Auto-Regression (FR-AR) model, as the forecasting accuracy of the FR-AR model was enhanced by using this method and was capable of solving the biasness among the machine and human error, but it cannot be applied to handle the nonstationary time series data of the various area. Chen et al. 23 modeled the improved fundamental analysis-based approach, which was useful for the investors to choose the optimal stocks and predict the future price trend. In addition, this system improved forecasting accuracy and helped in the enhancement of decision quality. The drawback of this system was the inability to supervise the learning process, and the failure in considering the sentence meaning of the headlines of financial news. Pang et al. 24 developed the Deep LSTM neural network, which offered improved performance in prediction for the Shanghai A-share composite index, but the expansion of the research-related datasets for checking the applicability of the models in another stock market with increased accuracy was not possible in this method.
Chandar 25 modeled the Subtractive clustering-based adaptive neuro-fuzzy approach, as this method was suitable with respect to the number of parameters, number of rules, testing error, and training error, but the problems cannot be solved individually, and as a result there was a possibility for the development of imperfect, imprecise, and vague data. Singh and Srivastava 26 designed the two-directional two-dimensional principal component analysis (2D)2PCA+Deep NN method, which enhanced the stock multimedia prediction accuracy, but the deep learning approach in case of large window size and high dimension offered only low performance. Pathak and Shetty 27 developed the combination of sentiment analysis and NN techniques for the prediction model that predicted the beneficial financial returns and the market trend with high accuracy but did not consider the refined fuzzy rules for the improvement in prediction. Zhang et al. 28 designed the Coupled matrix and tensor factorization method that was capable of predicting the changes in the stock market with the completion of the missing values of the sparse tensor, but it was not capable of considering the other data sources, such as knowledge graph information.
Challenges
The major challenges associated with the existing methods of stock market prediction are as follows:
The Coupled matrix and tensor factorization method
28
makes use of the tensor to predict the stock market. The decomposition of the tensor in the presence of event sparsity and of obtaining improved accuracy acts as a major challenge with regard to this method. The stock market is considered dynamic, volatile, complex, and chaotic, and the prediction of the stock market is one of the tedious tasks in terms of time series forecasting. The ANN methods were not capable of performing this task.
26
One of the challenging fields for investors is the stock market prediction for obtaining the profits of the financial markets. It is necessary for investors to know about the financial markets that violate the external factors.
25
The prediction of the stock market with more accuracy is a challenging task due to the presence of nonstatic stock prices and noisy nature. The macro-economic factors, such as the company's policy, political events, product price indexes, general economic conditions, the expectation of investors, and the psychological factors, affect the stock prices.
19
The commercial financial expert systems
22
were designed for the trading on the stock exchange with the limitation in the prediction accuracy due to the dependence of them in the time-series analysis of the market.
By considering the challenges of the existing stock market prediction methods as the motivation, this article develops a stock market prediction system, which tries to overcome the drawbacks of the existing methods.
Proposed Methodology: Stock Market Prediction Using Rider-MBO-based Deep-ConvLSTM Model
The primary intention of this article is to design and develop a stock market prediction system to ensure the effective prediction of the stock market. An approach is developed to predict the future market based on the past and the current status of the market. Initially, the input data are subjected to the extraction of the features based on the technical indicators, such as DEMA, ROCR, ATR, RSI, SMA, ADX, CCI, MACD, OBV, SAR, EMA, and T3. The technical indicators ensure the information of the data that significantly contributes toward predicting the stock market. The Sparse-FCM algorithm is employed for clustering the data features that are generated by using the technical indicators. The highly significant features of the data are fed to the prediction module, for which the Deep-ConvLSTM model is employed. The Deep-ConvLSTM model uses the Rider-MBO algorithm that is developed by the integration of the ROA 29 and the MBO. 30 Thus, the proposed Rider-MBO-based Deep-ConvLSTM model performs the stock market prediction with the considered technical indicators. Figure 1 depicts the block diagram of the proposed stock market prediction model.
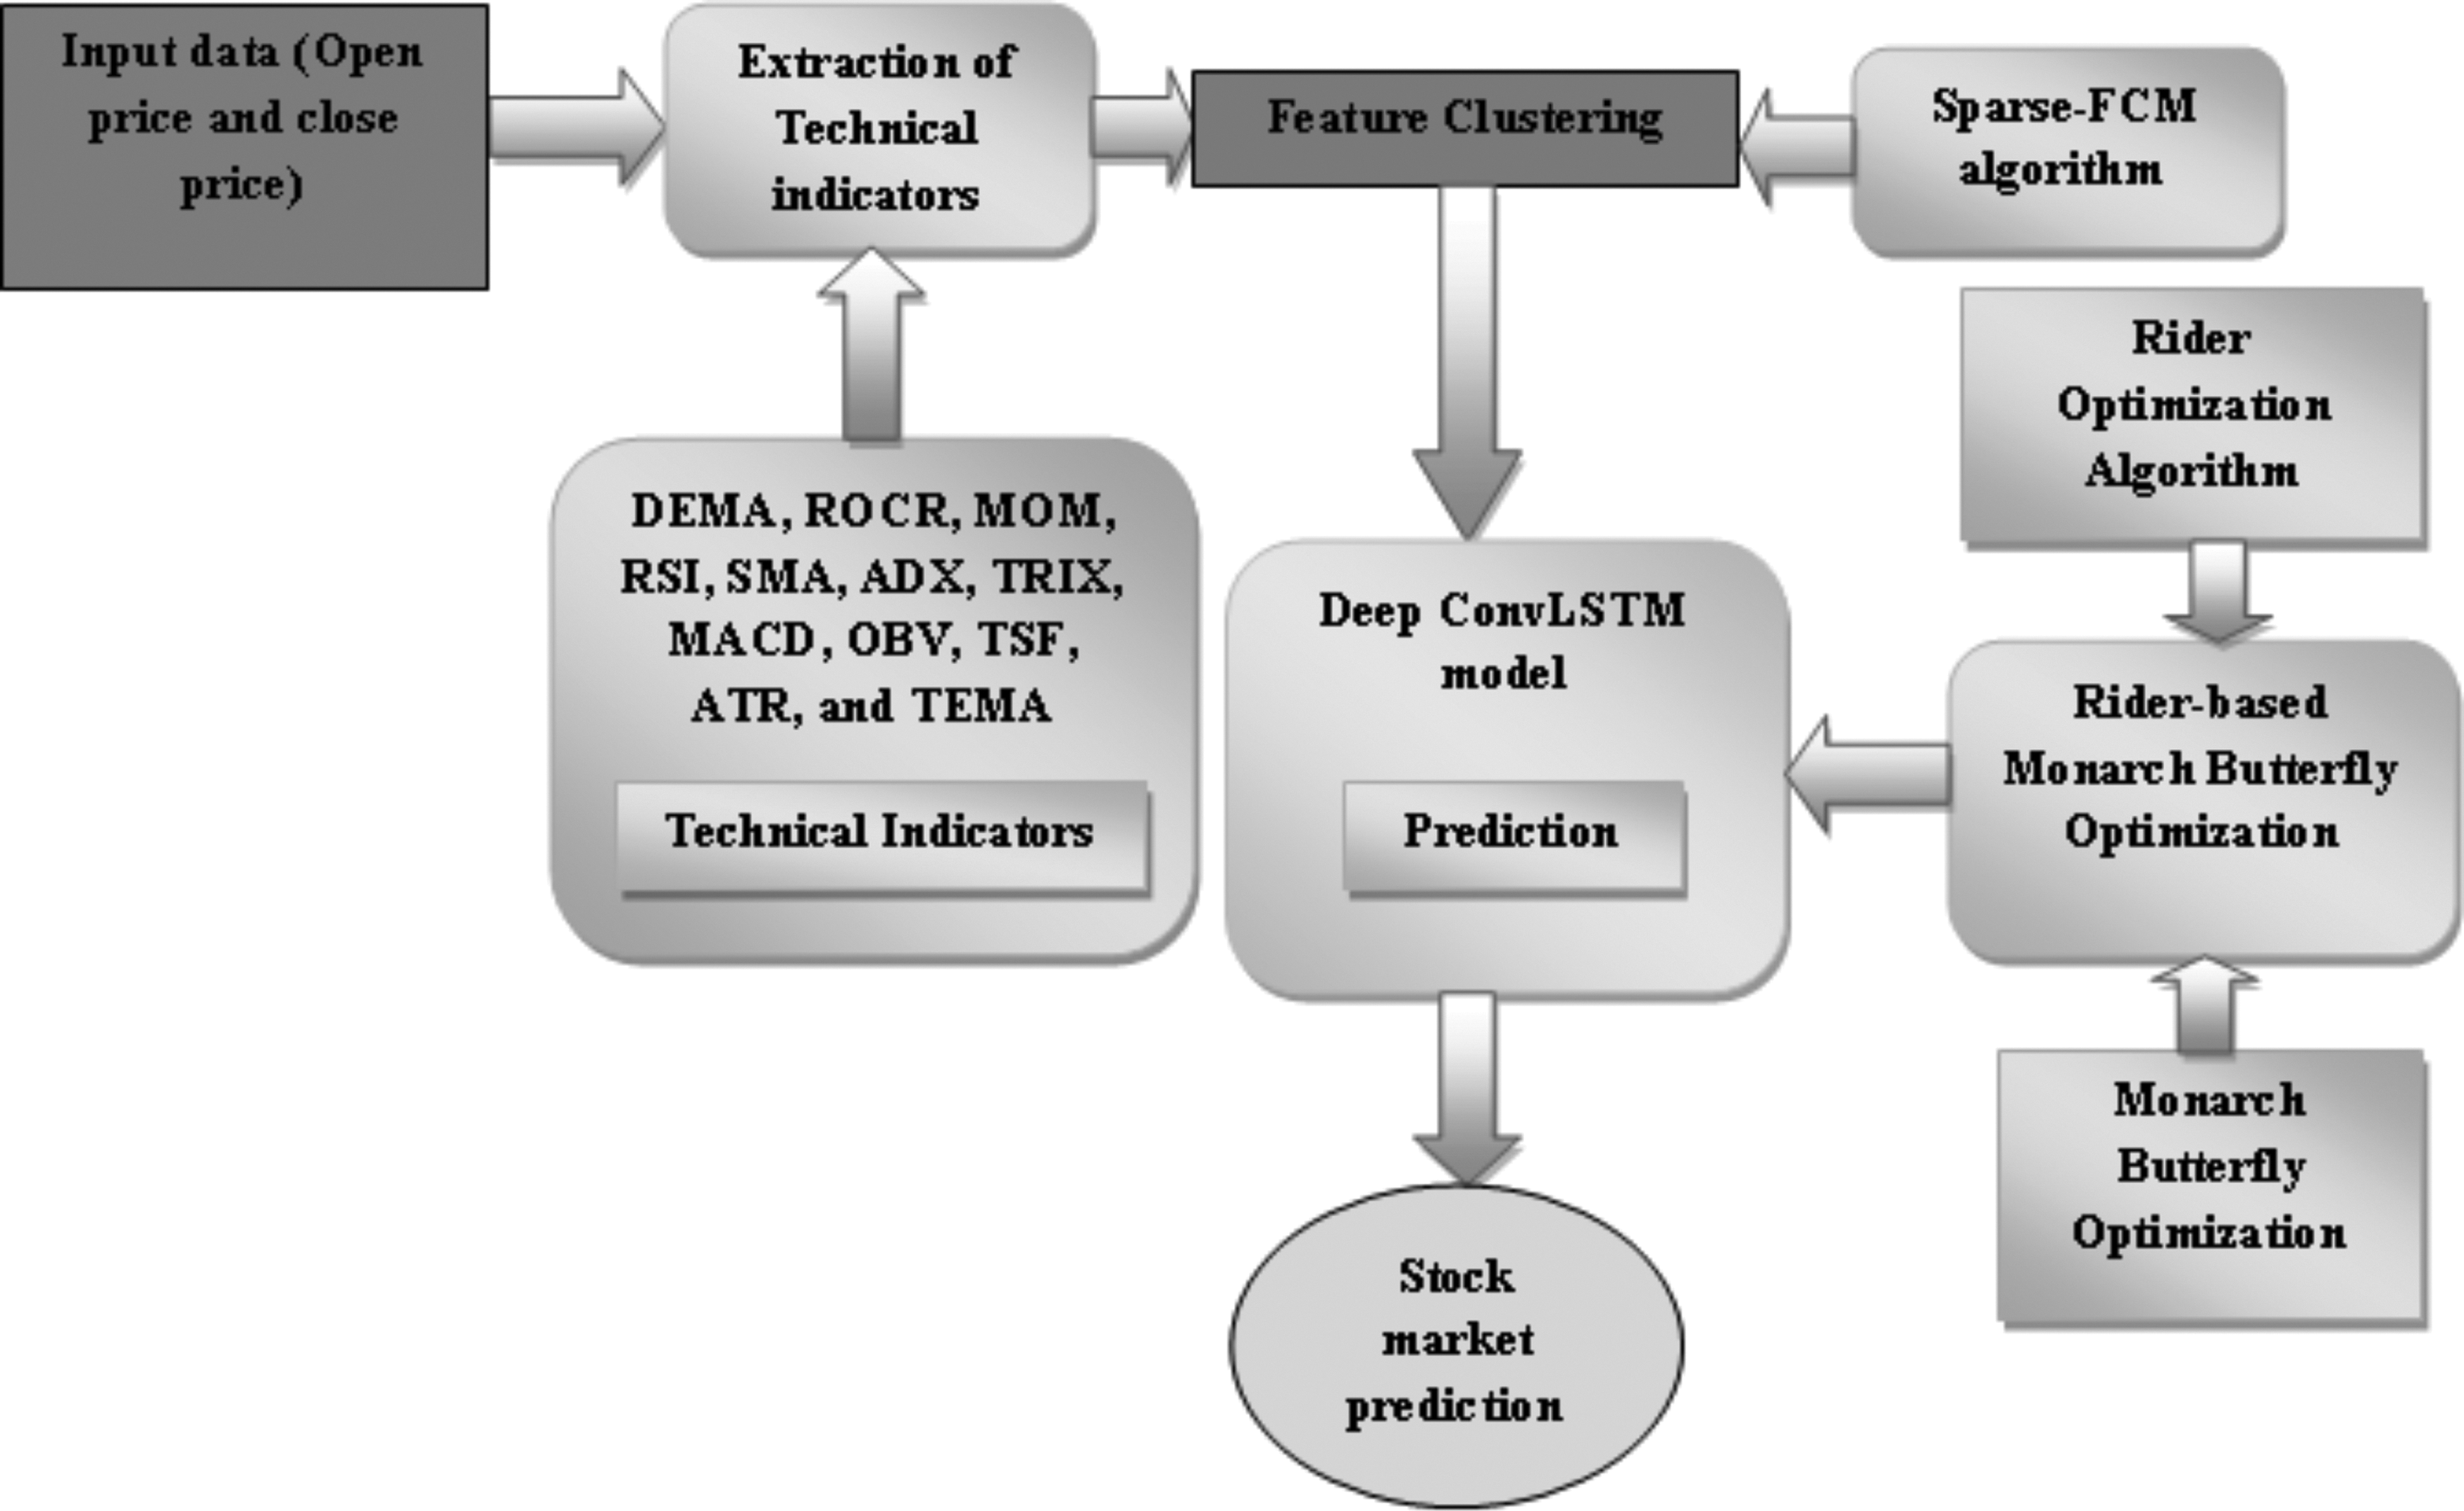
Block diagram of the proposed stock market prediction. ADX, average directional index; ATR, average true range; Deep ConvLSTM, Deep convolutional long short-term memory; DEMA, double exponential moving average; MACD, moving average convergence divergence; MOM, momentum; ROCR, rate of change; OBV, on balance volume; RSI, relative strength index; SMA, simple moving average; Sparse-FCM, Sparse-Fuzzy C-Means; TEMA, triple exponential moving average; TRIX, triple exponential moving average oscillator; TSF, time series forecast.
Data model
The input data consist of both the open and close prices of the stock market for all the days in a year. In addition to these data, the high value, low value, and the change in market cap of the stock market are available in the data model. The data model is of the size
Technical indicators
The stock market prediction is carried out through the use of the technical indicators that are focused on the historical trading information, and these indicators are simply the mathematical model depending on the open and closing prices. Through the analysis of the historical data, the future of the stock market is predicted; moreover, these technical indicators assist the long-term investors in determining the entry and exit prices. The 12 technical indicators, 31 such as DEMA, ROCR, momentum (MOM), RSI, SMA, ADX, triple exponential moving average oscillator (TRIX), MACD, OBV, time series forecast (TSF), triple exponential moving average (TEMA), and T3 are utilized in this article; these are considered the features for initiating the stock market prediction and they are grouped on the basis of their similarity.
DEMA: The DEMA is a rate of trending average price of a security that offers the most weight to the recent price data. Similar to EMA, the DEMA is more reactive to the fluctuations in price compared with that of the SMA, and it thus helps the short-term traders, who aim at attempting to pinpoint trend changes.
where D indicates the DEMA, E is the EMA, and n is the period.
ROCR: The ROCR indicator is otherwise termed as momentum indicator; it is used in the comparison of the current and the previous price for a certain number of periods, and the current price is split with the previous price.
where
ATR: The ATR is used to estimate the size of the period range, and it considers the gap from the close of the previous period.
where A is the ATR, and
RSI: The RSI is one of the momentum oscillators that measures how often the stock was bought or sold, and it assumes that stock brought or sold eventually balances out. The relationship for the RSI is expressed as,
where,
where
SMA: The SMA is the average calculation of the closing price of any security for a selected number of days. The short-term SMA uses only a small amount of days as input; on the other hand, the long-term SMA uses a larger sample of days.
where P is the price, and n is the period.
ADX: The ADX is used to measure the trend strength with the rate of price movement in a single direction. Also, the ADX is responsible for the discovery of the developing trends.
where I is the directional index.
CCI: The CCI compares the current and the average mean price for about 20 periods.
where
MACD: The MACD is the commonly used indicator for revealing the changes in direction, strength, and duration of the stock's price. In general, it is the difference between fast and slow moving average.
where
OBV: The OBV relates trading volume to the price change, and it is expressed as,
where
SAR: The SAR is used in the trailing stop points to make it usable with the short and long positions. In the case of new long positions, the
In the case of new short positions, the Ps is given as,
where
EMA: The EMA indicates the average prices, and it places more weight on the recent prices. The weighting given to the most recent price always relies on a certain period of moving average.
where
T3: The T3 is the one that tries to provide moving average with enhanced smoothing compared with that of the conventional EMA.
where z is the period, and E is the EMA.
The dimension of each technical indicator is
Clustering of features using Sparse-FCM algorithm
The process of clustering is performed to cluster the features that are obtained as the output of the technical indicators. The highly significant features are collected by using the clustering process, which is done by using the Sparse-FCM algorithm. The features with similar features are grouped into a single cluster, and thus a number of cluster groups are framed. The Sparse-FCM algorithm
32
is used for clustering the features that are obtained from the technical indicators. The features are grouped as clusters based on the similarities in the characteristics of the features. It is obvious that the prediction accuracy depends on the proper clustering for which the Sparse-FCM is used. The input of the Sparse-FCM is a feature H, which is denoted as
Step 1: Initialization: In the initial step, the weights of the features are initialized as,
Step 2: Partition matrix update: For each cluster center a and attribute weights w, the γ(P) is minimized if

where
Step 3: Update of the cluster center a: Let w and p be fixed, and
where
Step 4: Class determination: The class value is estimated with the use of the fixed clusters
Step 5: Condition for termination: The steps just provided are repeated until the stopping condition is satisfied. The stopping condition is expressed as,
The output of the Sparse-FCM comprises the clusters containing similar features, the highly essential features are chosen based on the minimal distance between the cluster, and the feature is selected to predict the stock market. The clusters obtained by using the Sparse-FCM are given as,

where
Feature selection using minimal distance match
The main aim of feature selection is to reduce the dimension of the feature vector to minimize the computational complexity associated with the prediction. The cluster groups with significant features are selected to perform the prediction process, from which the effective features are selected based on the minimum distance between the cluster and the individual feature in the cluster. The figure depicts the selection of the feature from the centroid based on minimum distance. Figure 2 depicts the selection of the feature based on minimum distance, in which a centroid with three features is considered. The distance between the centroid and each feature is calculated, and the feature possessing minimal distance is selected. The highly significant features of the data are given to the prediction module, for which the Deep-ConvLSTM model is used.
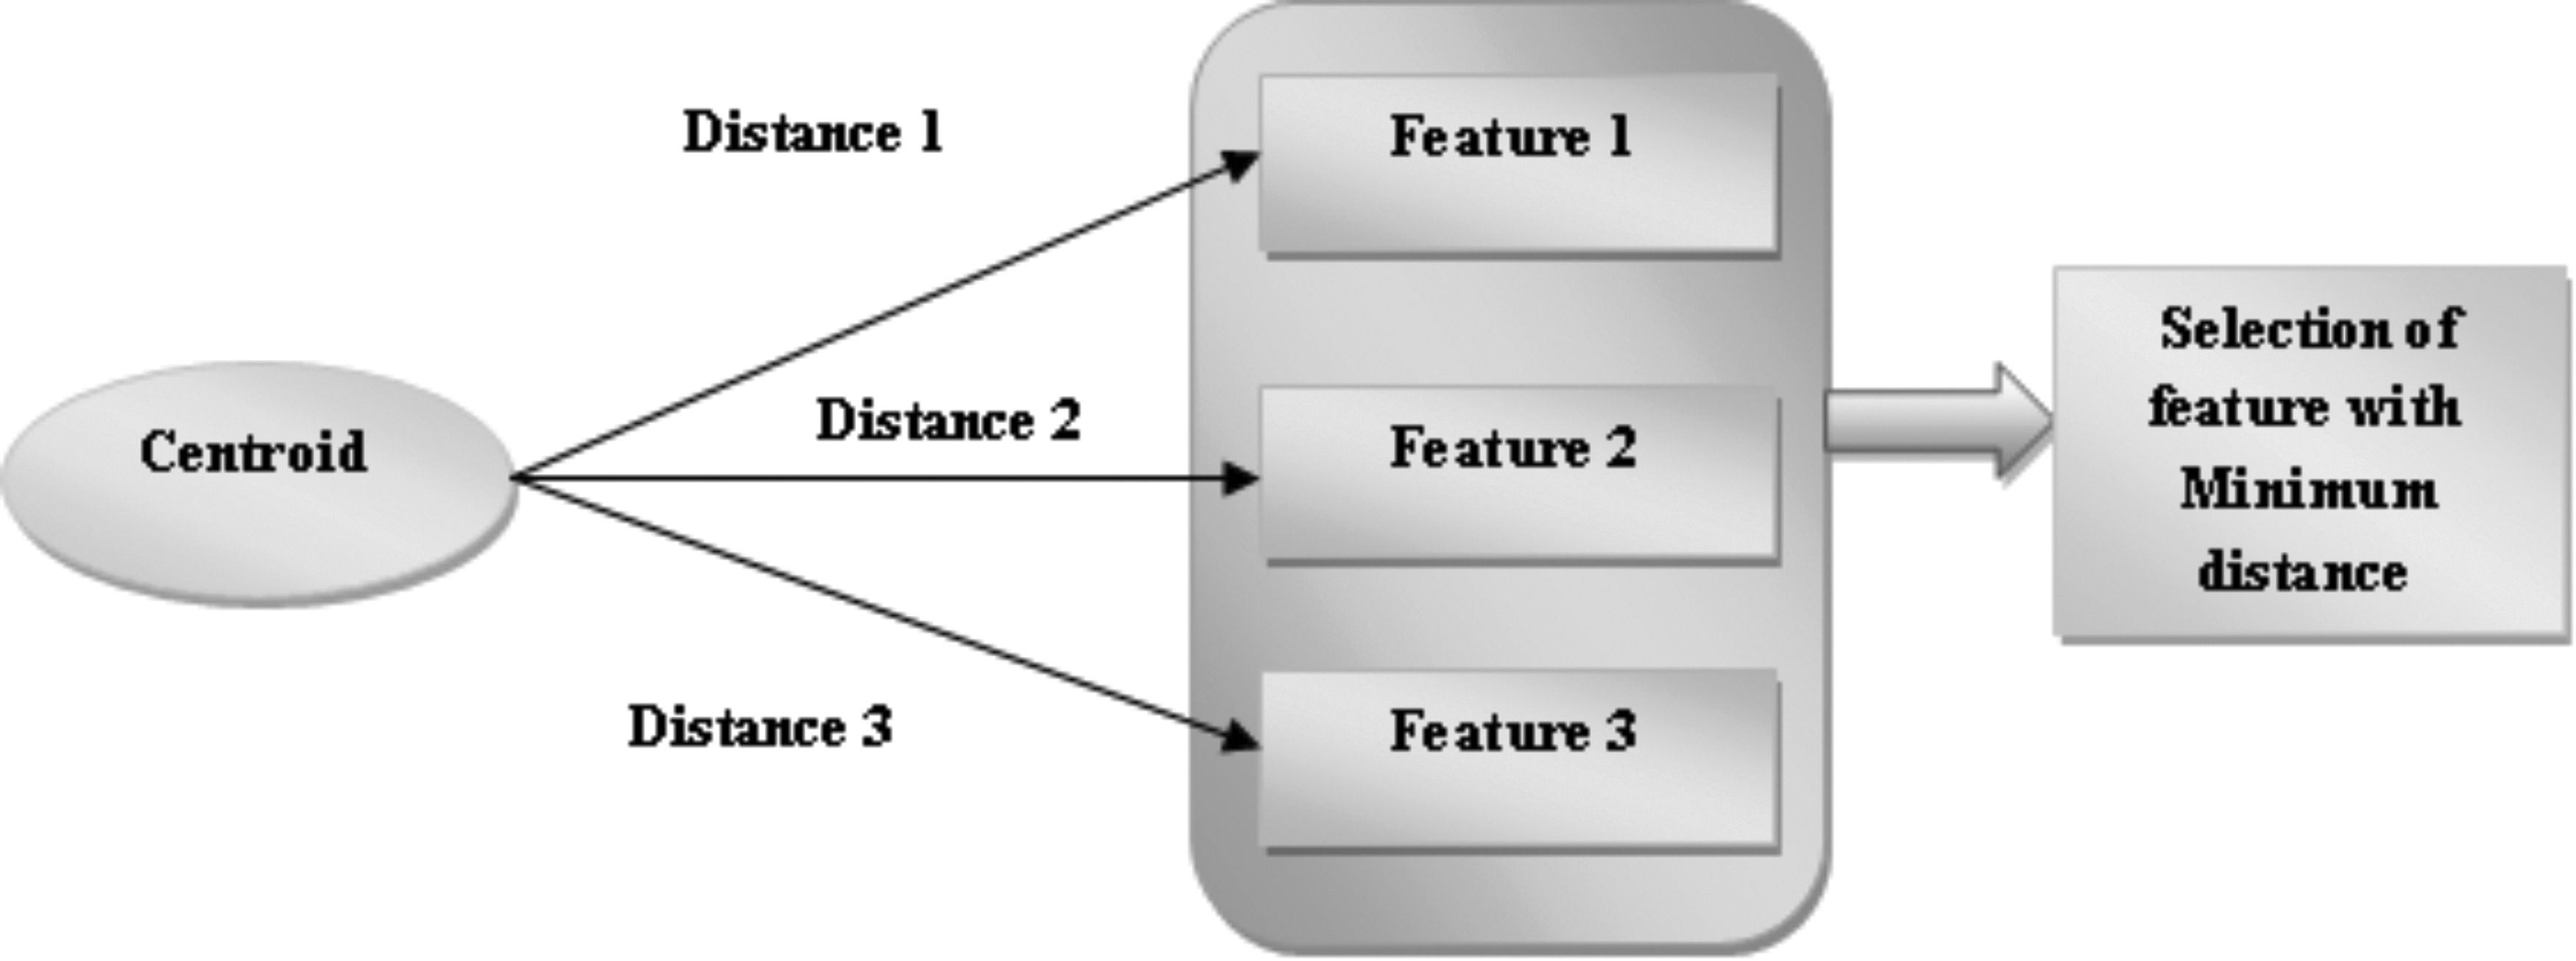
Feature selection based on minimum distance.
The selection of features from each cluster is done based on minimal distance. tc number of features are selected in such a way that
Stock market prediction using deep learning based on the optimization algorithm
The stock market prediction is carried out by using the Deep-ConvLSTM classifier, which obtains the effective features as the input. The Deep-ConvLSTM classifier is trained by using the proposed classifier, namely the Rider-MBO algorithm, which is developed by the integration of MBO and ROA.
Architecture of Deep-ConvLSTM
The ConvLSTM has various advantages as compared with those of the Fully Connected LSTM (FC-LSTM) that require unfolding the input data as the 1D vector before processing, which leads to the loss in spatial information. The ConvLSTM is grouped as 3D tensors of inputs
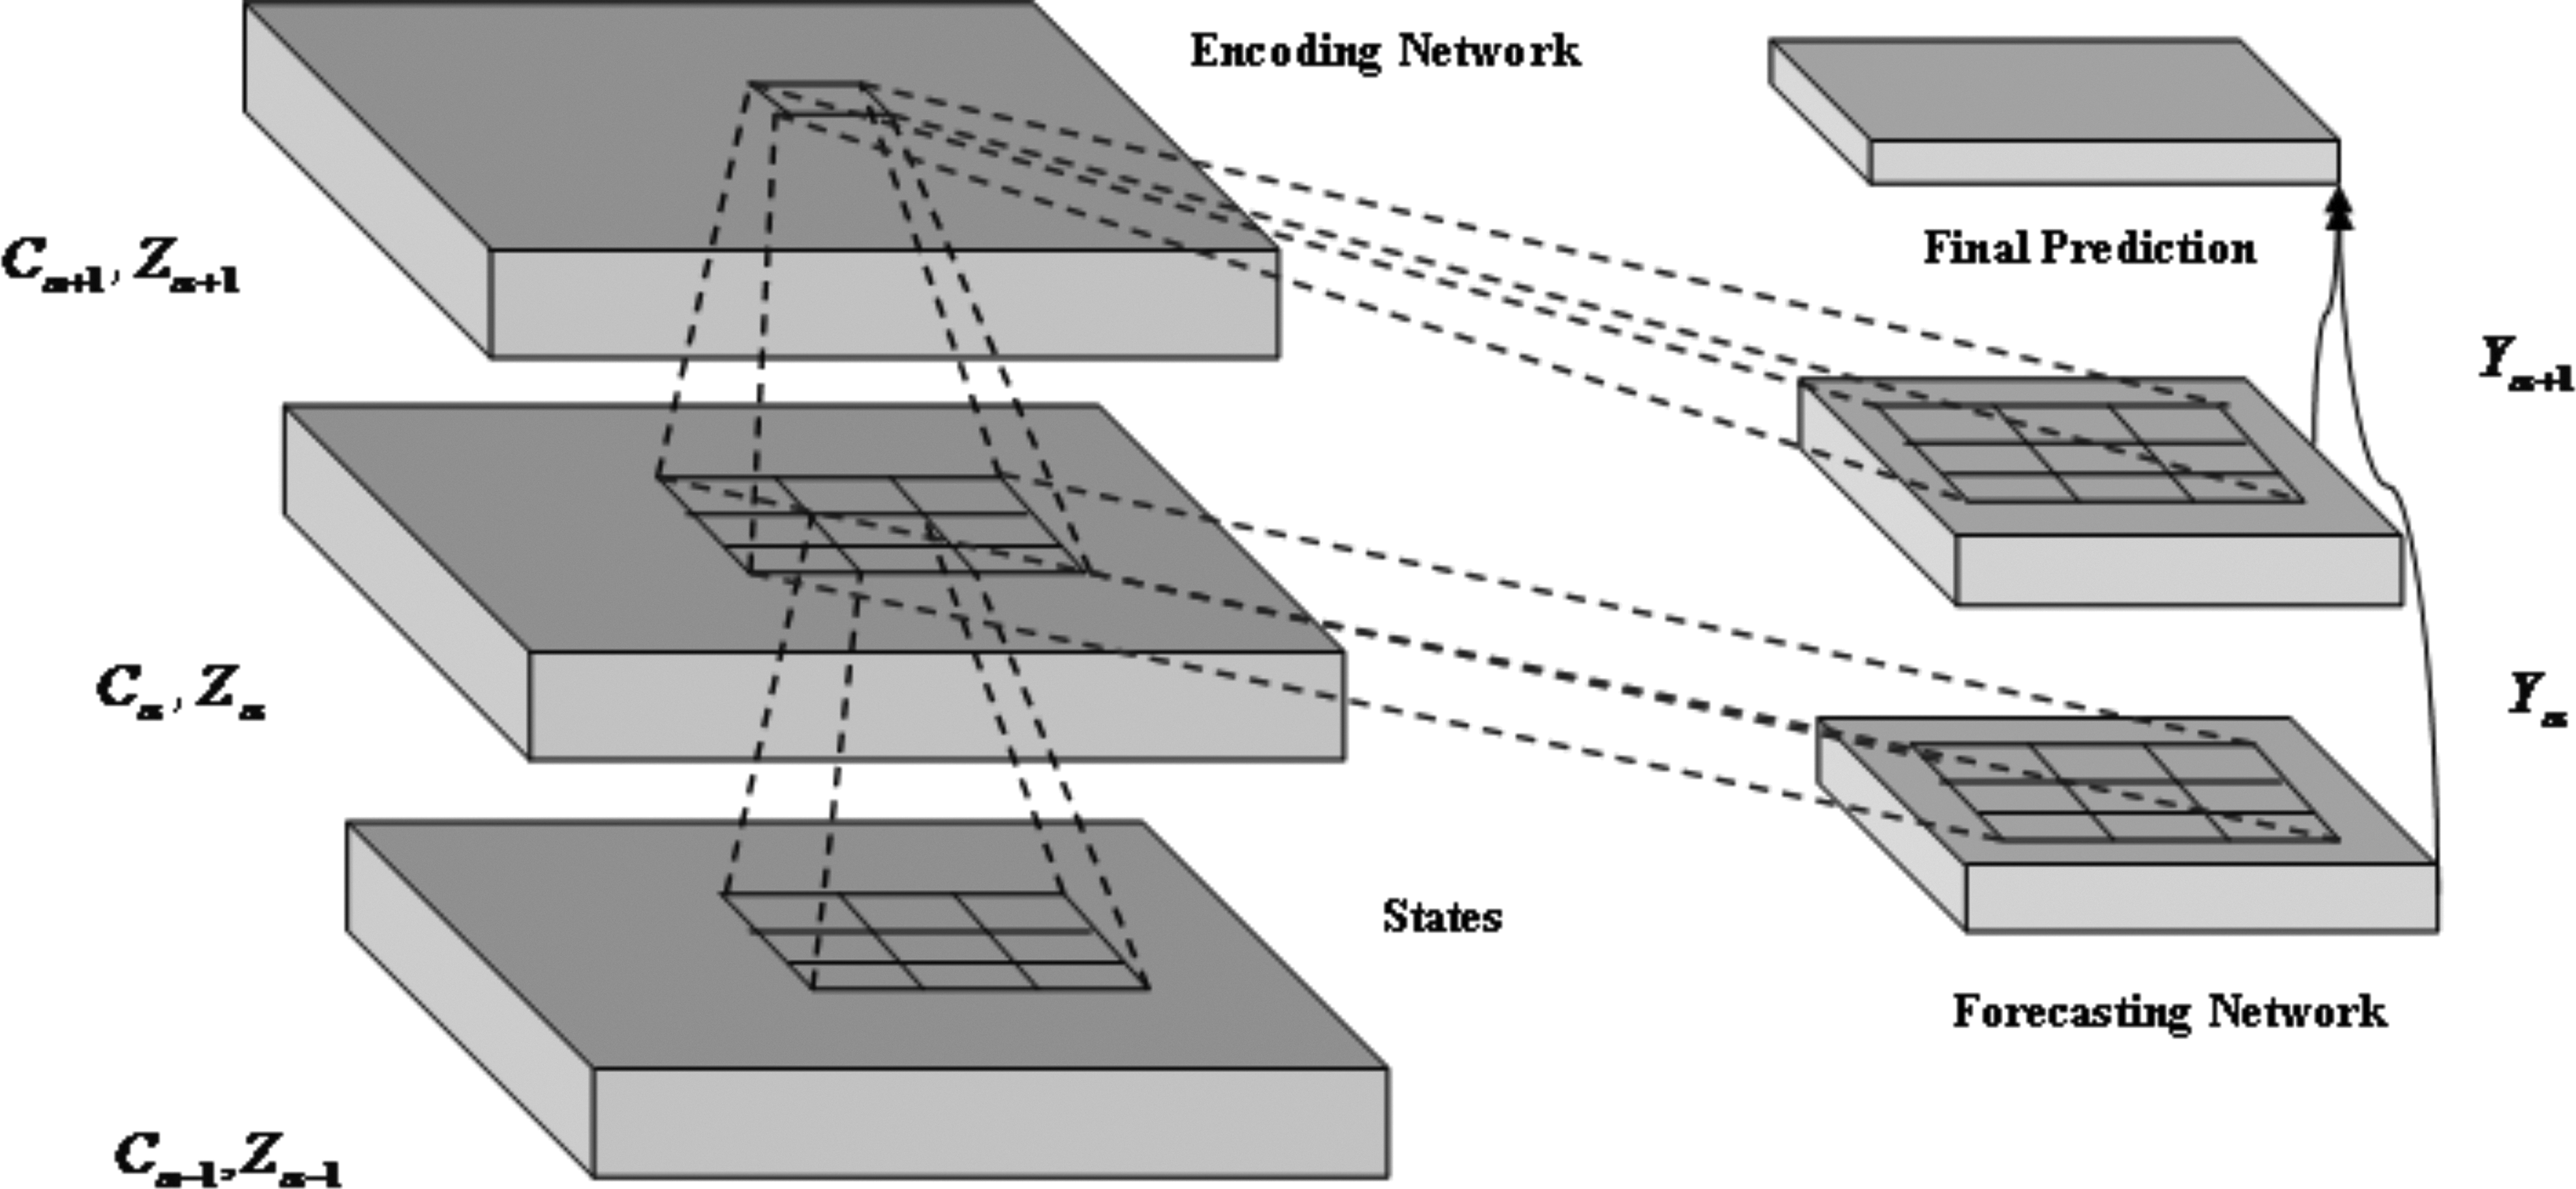
Architecture of ConvLSTM.
The encoding LSTM compresses the input inside the hidden states to forecast the final stock market prediction. The LSTM network comprises memory units that consist of gates and cell, which are depicted in Figure 3. In addition, the calculation of the output from each memory unit component is demonstrated. The memory cell and the gates control the flow of information, and also, the encoding
The change in the functioning of the ConvLSTM
8
from that of the other deep learning networks depends on the way of using the feedback loops for holding the past memory. The output of the input gate is obtained as,
where
where
where

where
The output of the cell is termed as the sum of the temporary cell state and the difference between the memory unit of the previous and the current layers that is expressed as,

The output from the memory unit is given as,
where
where
Thus, from Figure 4, it is clear that the output of the output layer is fed to the succeeding LSTM, and the copies of the output from the LSTMs in the encoding layer are given to the forecasting layer to obtain the final prediction about the stock market. Thus, the bias and the weights of the ConvLSTM are represented as
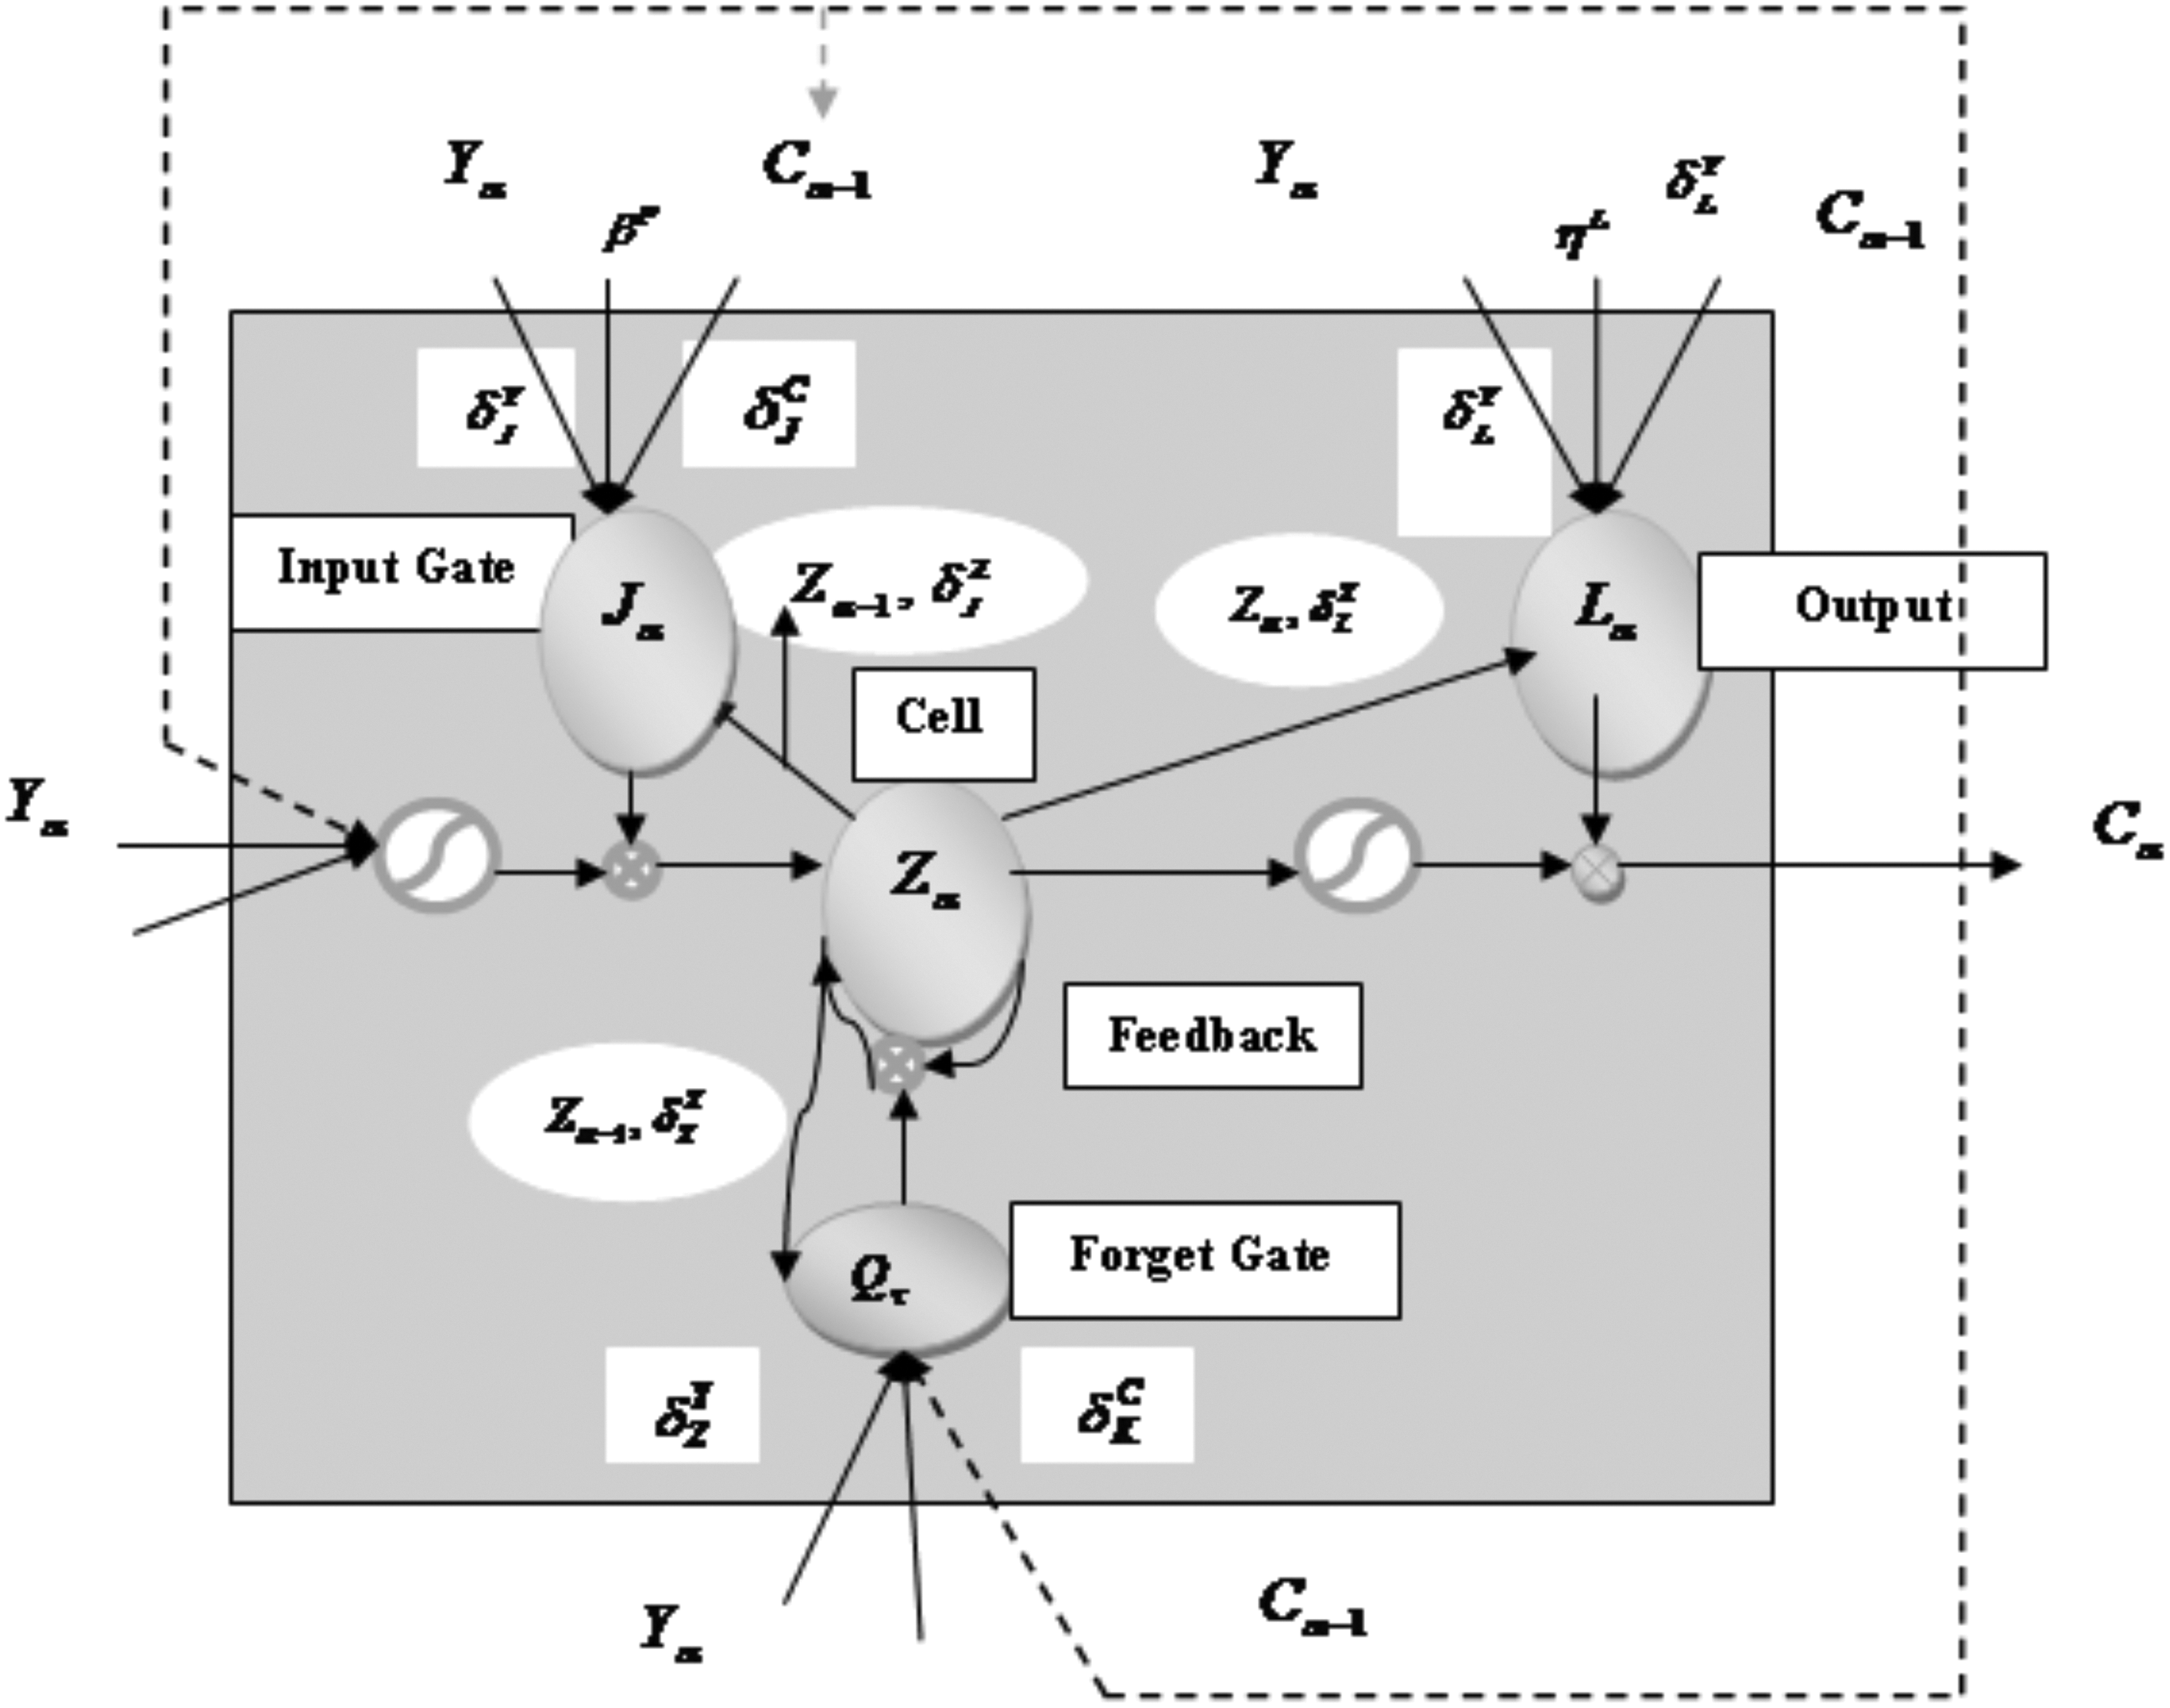
Memory unit of the ConvLSTM. MSE, mean squared error; RMSE, root mean squared error.
Generation of the weights for training the ConvLSTM using the proposed Rider-MBO algorithm
The weights of the ConvLSTM are obtained by using the proposed Rider-MBO algorithm, which is developed by the integration of MBO and ROA. The ROA algorithm follows a new approach, termed as fictional computing, which is developed to solve the optimization problems based on imaginary thoughts and ideas. This algorithm works based on the four groups of riders who try to reach the destination. Some groups of riders are formed in such a way that they travel to the same destination to become the winner. For instance, four groups are considered, and the number of riders in each group is selected from the total number of riders equally. The bypass rider, follower, overtaker, and attacker are the four groups of riders, where each group follows a unique idea to reach the destination. The bypass rider bypasses the leading path for reaching the target and does not take the leading rider in concern, whereas the follower follows the leading rider. The overtaker follows his position to reach the destination with respect to the neighboring location of the leading rider, and the attacker is the one who reaches the destination by the utilization of the maximum speed. Finally, the winner is the rider who wins the race. The algorithmic steps of the ROA are as follows:
Group and rider parameter initialization: The algorithm is initialized by the four rider groups, represented by parameter initialization (PI), whose position is initialized randomly. The initialization of the group is expressed as,
where
where BR is the number of bypass riders, FL is the number of followers,
The positions of the riders are calculated by using the relation just given. The initialization of the rider parameters, namely the steering, gear, accelerator, and the gear, is done after the initialization of the group. The steering angle at a time t is expressed as,
where
where
The gear of the vehicle in a group is expressed as,
where
The accelerator of the vehicle is expressed as,
The initial value of the accelerator is set to 0, and the value of the accelerator lies between 0 and 1.
The representation of the brake is expressed as,
The brake value lies between 0 and 1, and the initial value of the brake is set to 1.
Depending on the two boundary values in space, the speed of the vehicle is adjusted by the rider on the way of reaching the destination. Thus, the maximum speed of the vehicle at which the rider can drive the vehicle is represented as,
where
where
Calculation of success rate: The term “success rate” or otherwise the fitness measure is calculated based on the mean squared error (MSE), and it is expressed as,
where np is the number of iterations.
Determination of the leading rider: The success rate is important in determining the position of the leading rider. The rider who is nearer to the location of the target is considered as the leading rider, as he has the possibility to reach the destination at first. The rider's position changes with respect to time; the leading rider cannot be fixed; and thus based on the success rate, any rider can obtain the leading position.
Rider position update: In each set, the rider position is updated to find the leading rider, which means the rider who has the highest possibility of reaching the destination at first.
Position update of bypass rider: The update of the position of the bypass rider occurs randomly as the bypass rider uses the common path without considering the leading riders. The update equation is expressed as,
where
Position update of follower: The co-ordinate selector is responsible for the update equation of the follower and is carried out for certain values of k.
where e is the co-ordinate selector,
Position update of overtaker: The position update process of the overtaker depends on three main factors, such as direction indicator, relative success rate, and the co-ordinate selector, and the relation is expressed as,

where lt + 1(x, e) is the position of the xth rider in the eth co-ordinate, and
Position update of the attacker: The attacker follows the same procedure as that of the follower to reach the destination to be a winner. It updates all the co-ordinate values, and not only the selected values. The update equation of the attacker is expressed as,
where
Calculation of success rate: Once the update process is completed, the success rates of the riders are calculated. The rider position is updated with the new position of the rider who possesses the maximum success rate.
Parameter update for the riders: The optimal solution is obtained by updating the parameters of the rider.
Activity counter: In addition to the parameters, the activity counter is included during the position update of the rider. The value of the activity counter is 1, and in case the success rate at a particular time exceeds the previous time, the value of the activity counter is set to 0. The relation for the activity counter is expressed as,
Steering angle update: Based on the activity counter, the steering angle is updated.
Gear update: The gear of the vehicle is updated based on the activity counter and the maximum possible gear a rider can apply, and it is expressed as,
Acceleration update: The acceleration is updated based on the gear of the vehicle, and it is expressed as,
Brake value update: The brake value is updated similar to that of the accelerator being subtracted from one.
Off-time riding: The steps just cited are repeated till reaching the off-time, before which the leading rider is found.
To inherit the advantages of both the ROA and the MBO algorithms, the MBO is integrated into the ROA algorithm. The MBO is a nature-inspired metaheuristic algorithm that is generated with the mitigation characteristics associated with the butterflies. This algorithm is used, as it is effective in finding the solutions in case of continuous optimization problems. The position update of the monarch butterflies is done in two different ways, such as (i) the position update (generation of the off springs) with the use of the migration operator that can be adjusted by using the adjusting operator; (ii) the position of all the other butterflies is updated with the use of the butterfly adjusting operator. The implementation of the migration operator and the butterfly adjusting operator is done simultaneously. Hence, the MBO suits well for parallel processing, and in addition, it is capable of developing the trade-off between the diversification and the intensification that acts as an important aspect of metaheuristics. The standard equation of the MBO is given as,

where lt + 1(x, e) is the position of the monarch butterfly x in
Substituting Equation (51) in (44),


Thus, using Equation (54), the position of the rider can be updated, based on the position of the rider, direction indicator of the rider, watch distance of the monarch butterfly, and the weighting factor. The pseudocode of the proposed Rider-MBO algorithm is detailed in Algorithm 1.
Results and Discussions
The results obtained by using the proposed Rider-MBO method and the existing methods of stock market prediction are explained in this section. The performance of the proposed Rider-MBO algorithm is analyzed by using two metrics, such as MSE and root mean squared error (RMSE).
Experimental setup
The experiment is carried out by using the MATLAB tool, which offers simple and effective implementation of the proposed system.
Simulation results
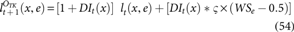
Figure 5 depicts the sample simulation results established by using the proposed method with a variation in the number of training iterations. Figure 5a shows the sample result at the training iteration of 19 among the 250 training iterations. With the increase in a number of training iterations, the accuracy of the proposed method increases in prediction. Figure 5b shows the sample result at the training iteration of 217 among the 250 training iterations. On comparing both the figures, Figure 5b provides better prediction and is observed to be close to the actual value.
Simulation results,
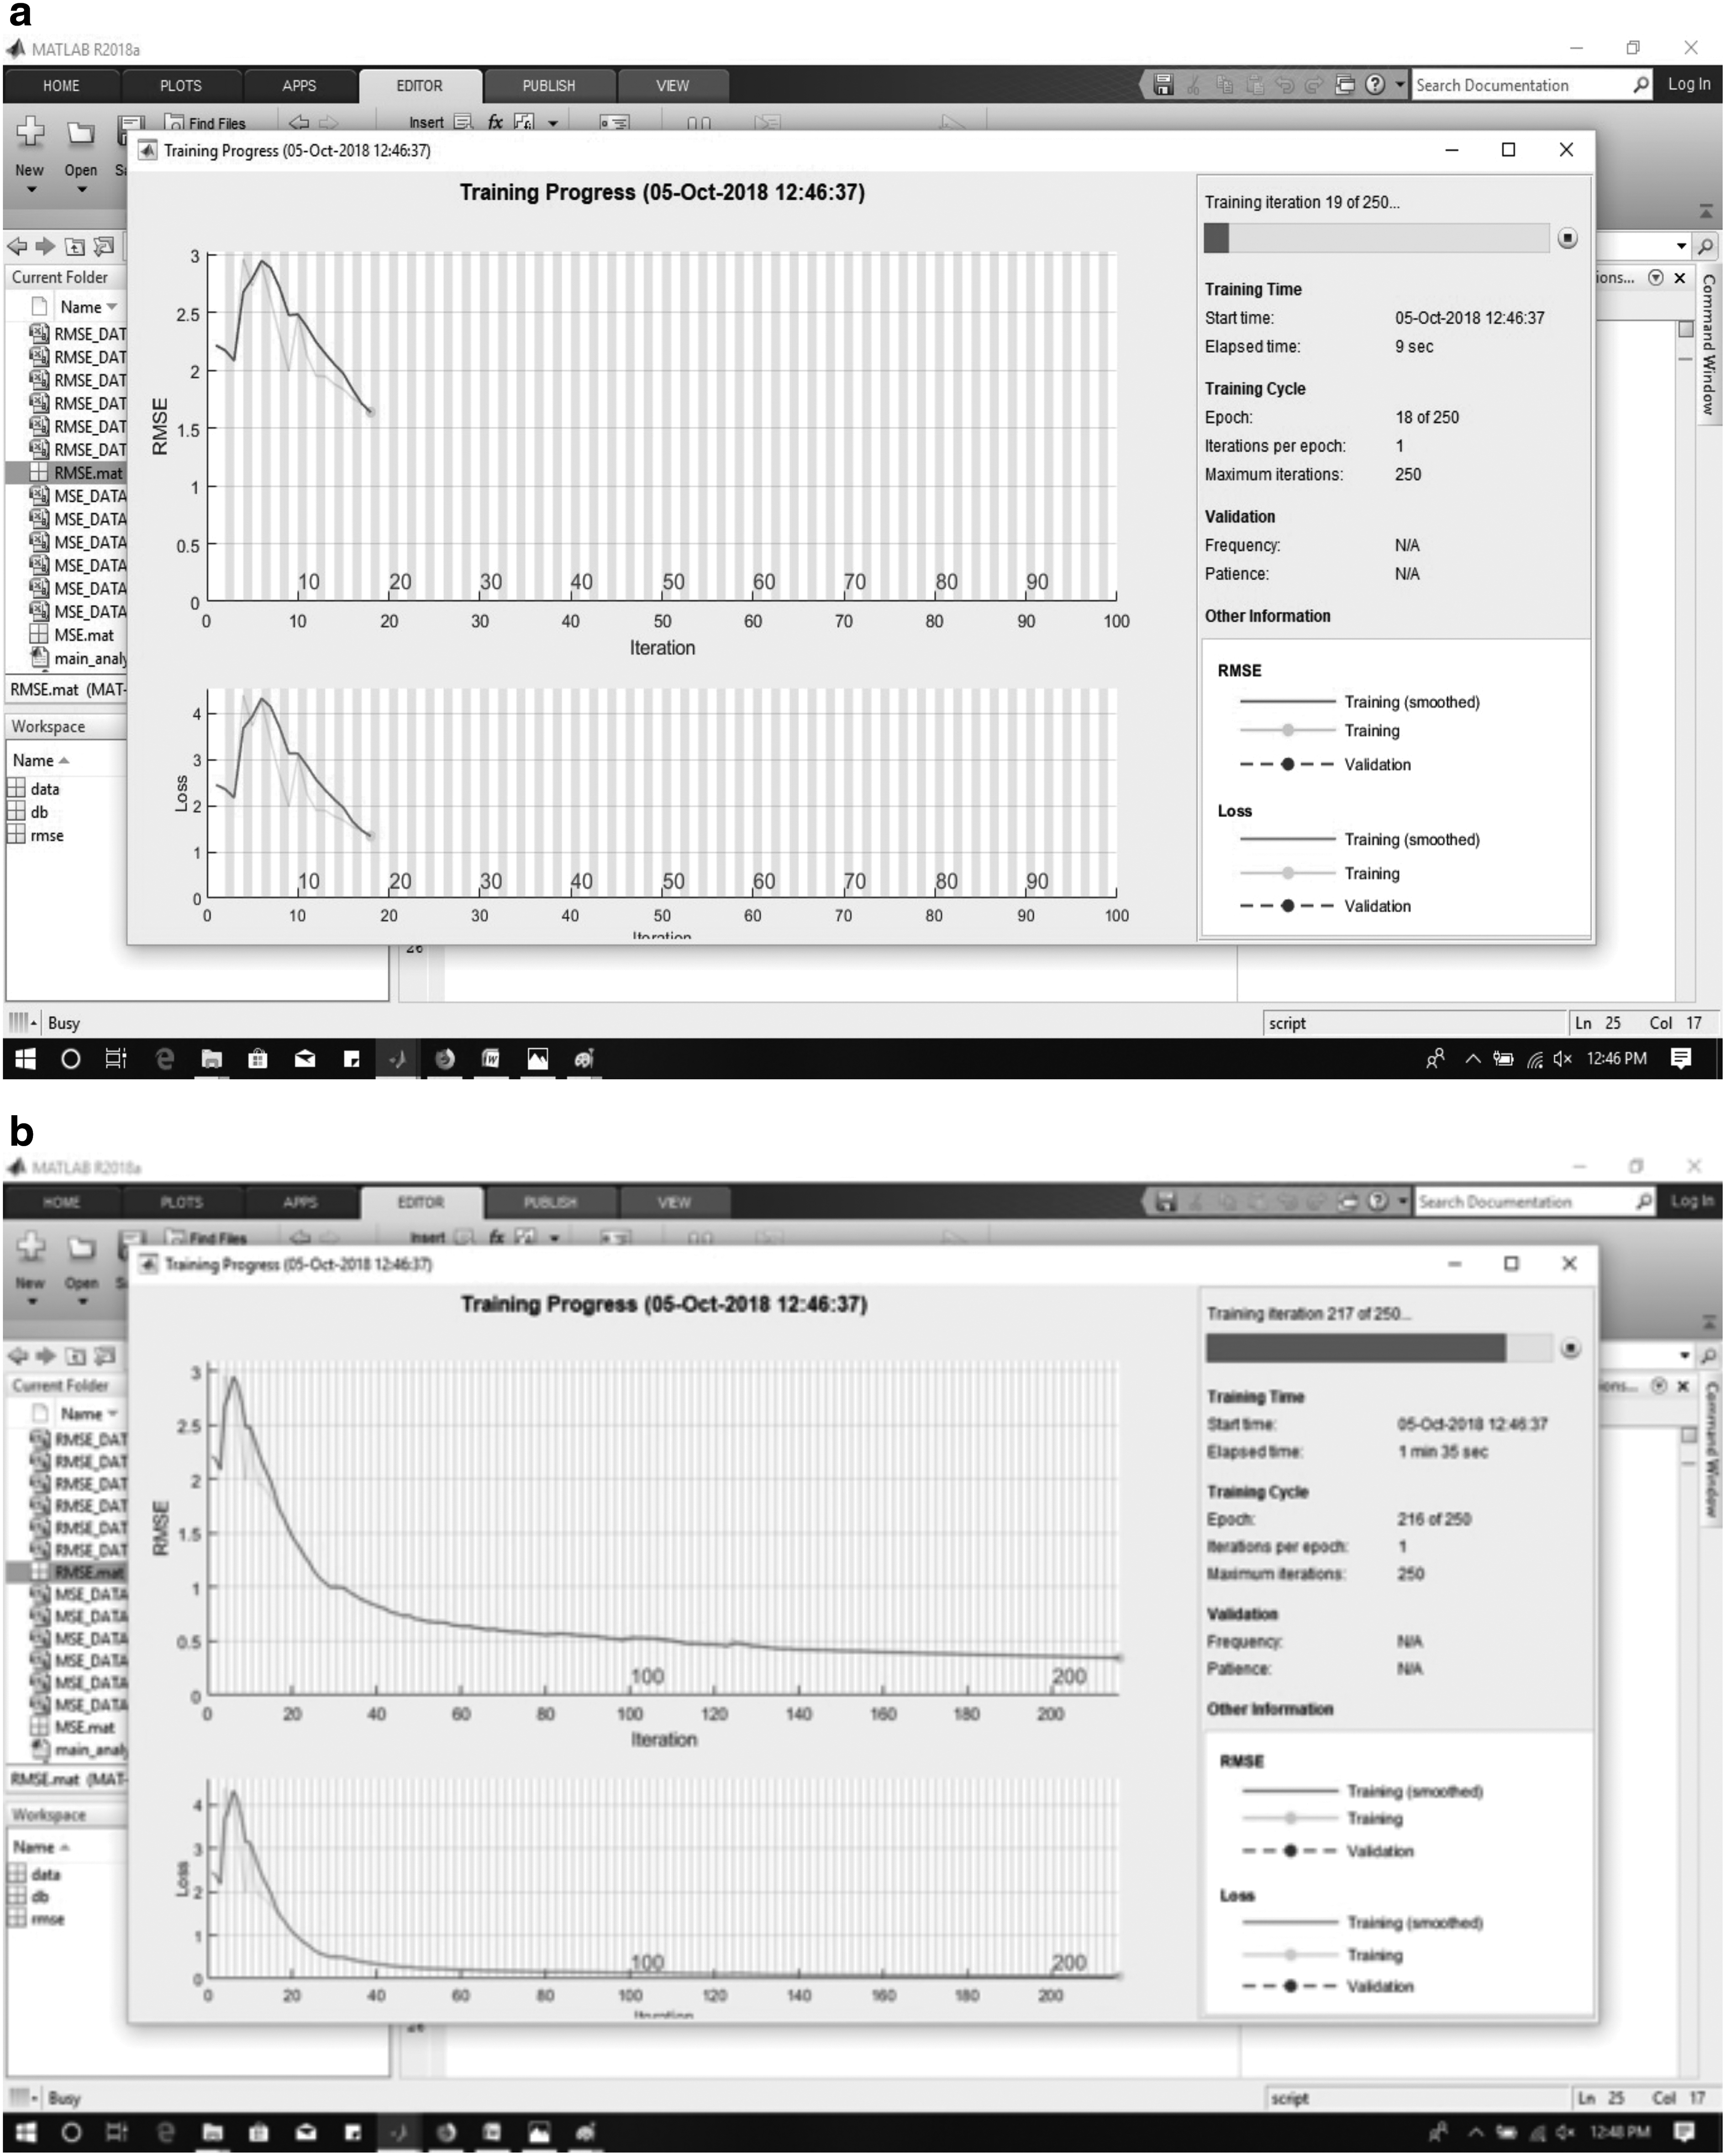
Figure 6 shows the prediction analysis of the stock market open price with the original open price for the comparative methods and the proposed method. From the figure, it is clear that the proposed Rider-MBO-based Deep-ConvLSTM provides better prediction equal to that of the original open price of the stock market as compared with that of the conventional methods.
Prediction analysis. MBO, monarch butterfly optimization; NARX, nonlinear autoregressive network with exogenous inputs.
Database description
The stock market data of six companies, 34 such as Infosys, HCL Technologies, Wipro, Bharti Infratel, Larsen & Toubro Infotech, and Siemens from January 1, 2017 to December 31, 2018, are taken as the dataset to perform the analysis of the proposed system.
Evaluation metrics
The effectiveness of the proposed stock market prediction method is analyzed with the use of two measures, such as MSE and RMSE.
MSE: The MSE is the rate of an average of the errors in squares between the actual value and the estimated value, and is always positive, but not 0 due to its randomness. The expression for the MSE is given in Equation (41).
RMSE: RMSE is nothing, but the square root of the MSE, and thus, it is an estimation of the square root of the difference between the actual value and the observed value.
Comparative methods of stock market prediction
The comparative methods involved are the proposed Rider-MBO-based Deep-ConvLSTM, and the existing methods, such as Deep learning, 27 Auto Regression model, 20 and the nonlinear autoregressive network with exogenous inputs (NARX). 35 The performance of the proposed Rider-MBO algorithm is compared with the existing methods. The proposed Rider-MBO algorithm is developed by using the integration of the existing ROA and the MBO algorithms.
Comparative analysis of the proposed method
The comparative analysis of the proposed Rider-MBO and the existing methods is described in this section based on the evaluation metrics, such as MSE and RMSE.
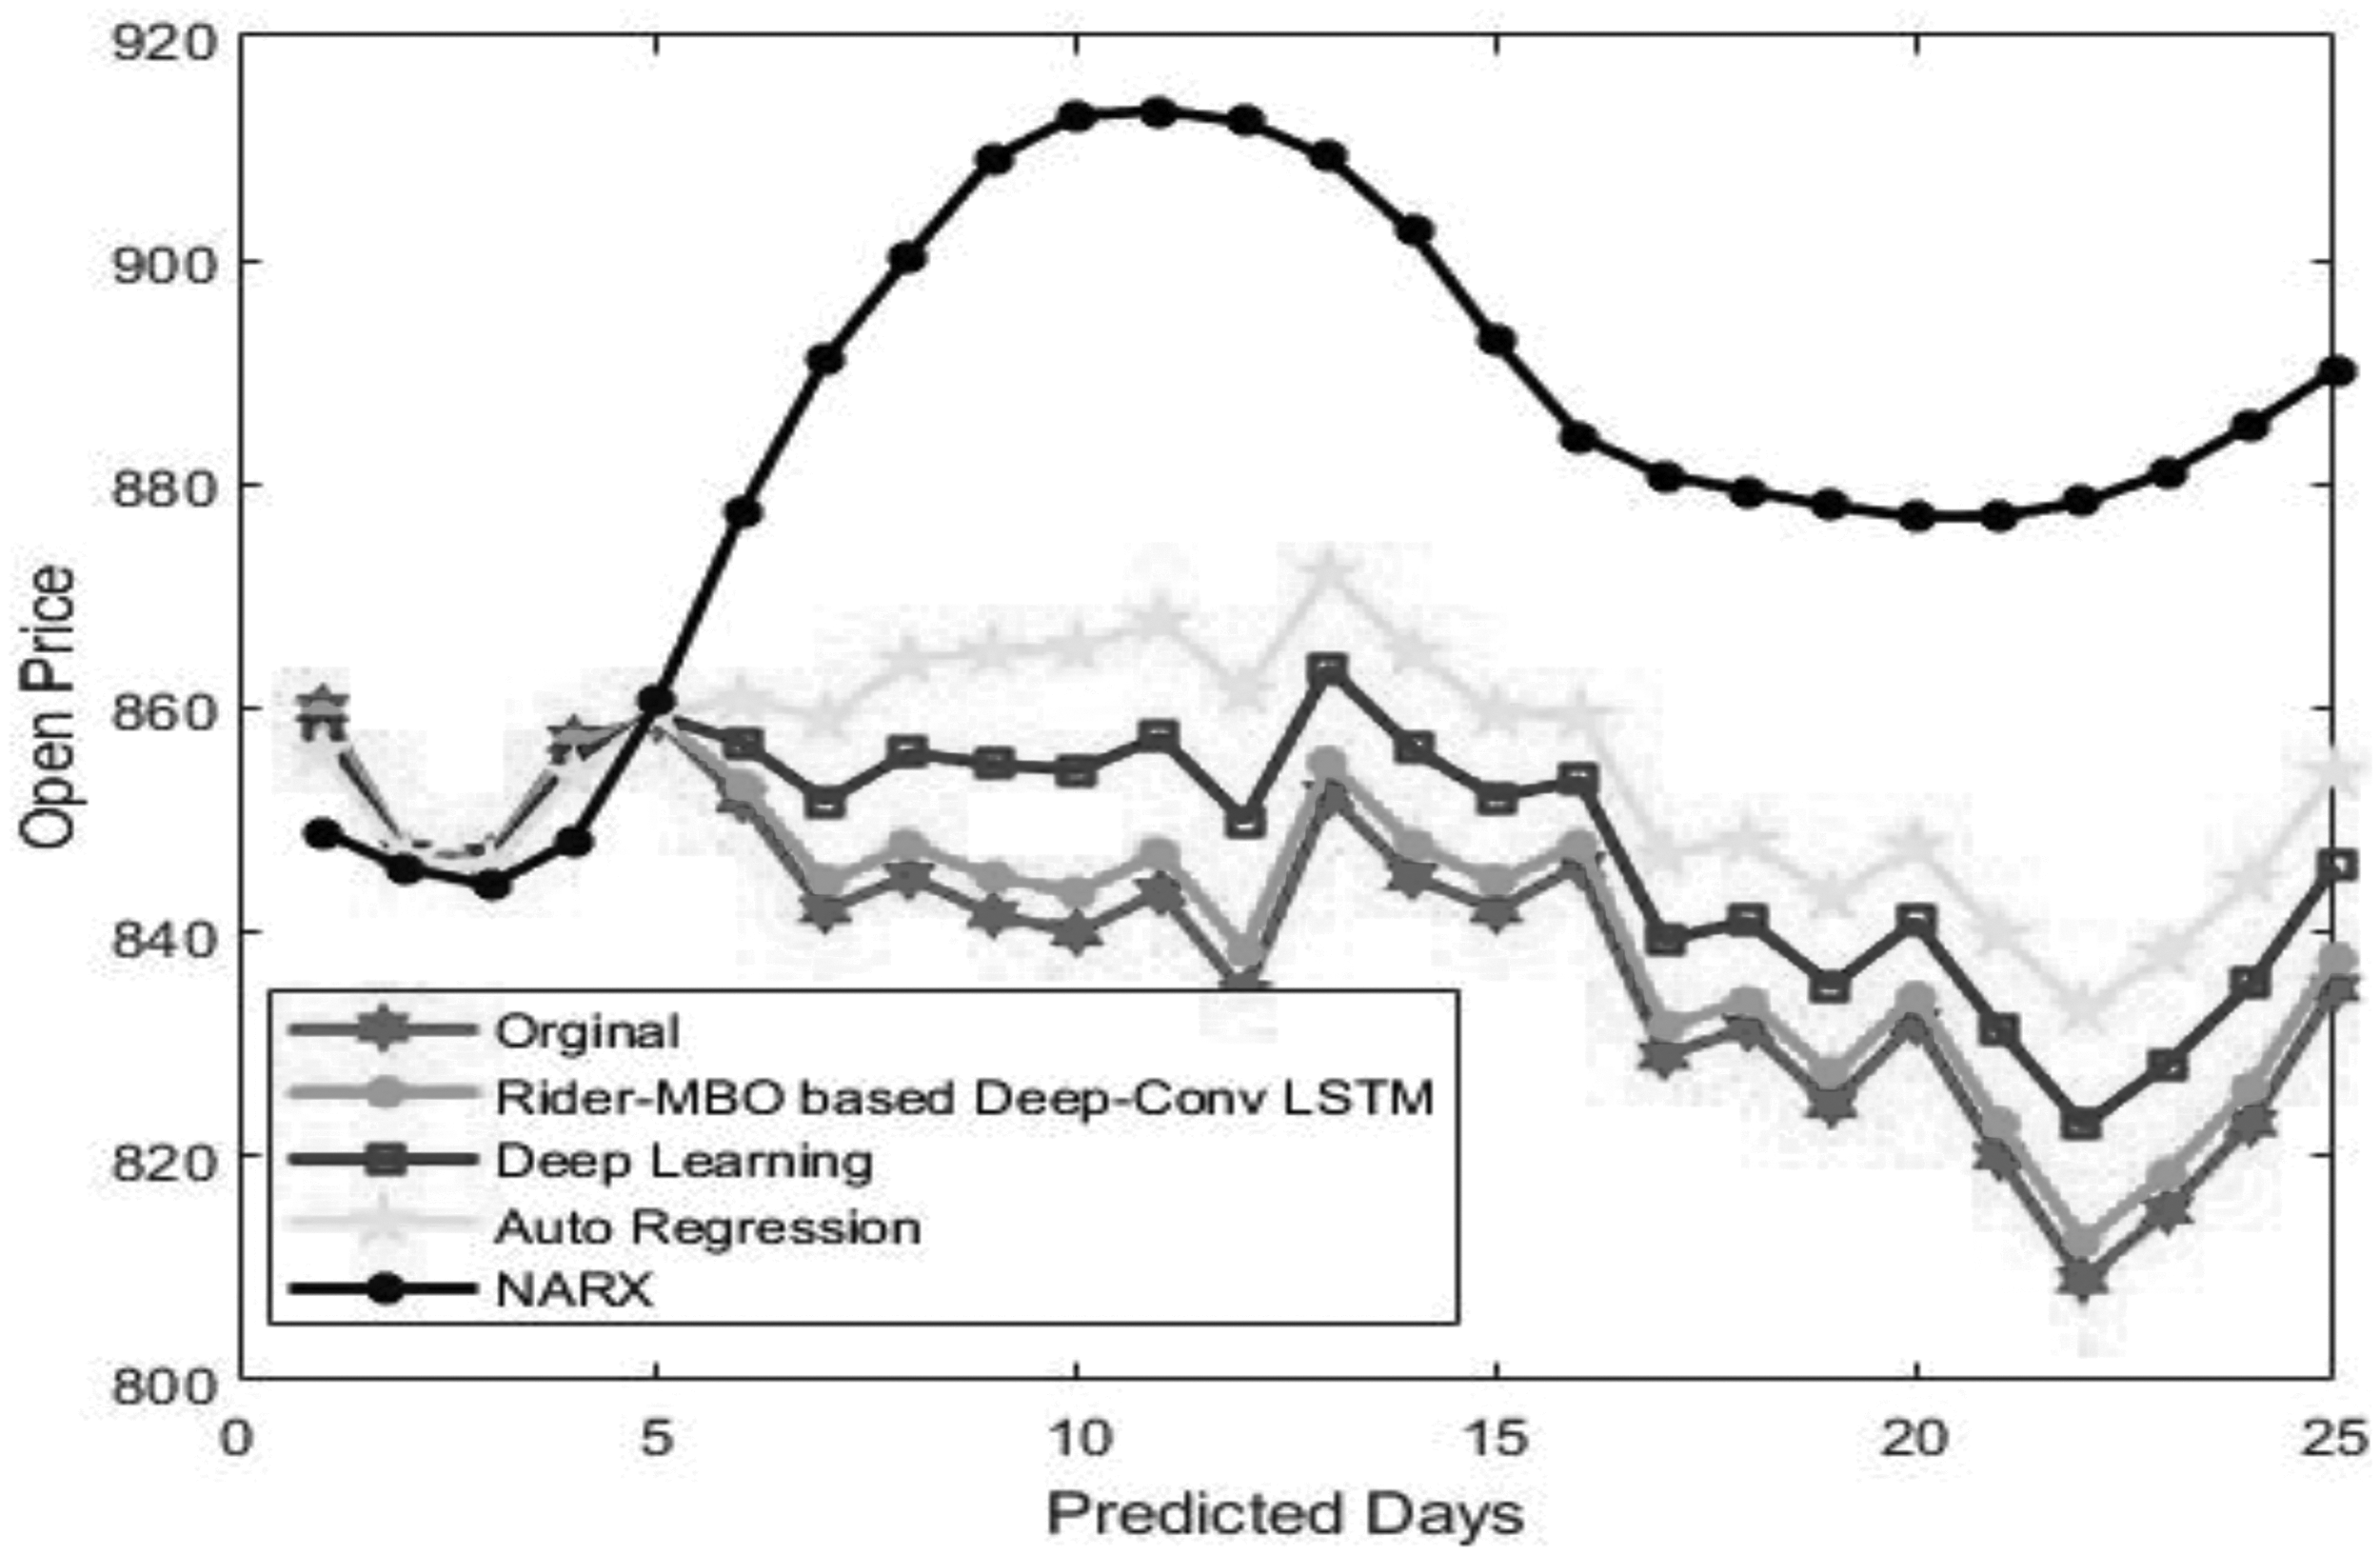
Comparative analysis based on the data of Infosys
The comparative analysis of the proposed Rider-MBO method and the existing methods of stock market prediction using the data of Infosys is shown in Figure 7. Figure 7a shows the comparative analysis based on MSE, and Figure 7b shows the comparative analysis based on RMSE. For the delay of 10 days, the MSE of the methods, such as Rider-MBO-based Deep-ConvLSTM, Deep learning, Auto Regression model, and the NARX, is 14.8181, 57.0662, 159.6425, and 184.6425, respectively. Similarly, for the delay of 10 days, the RMSE of the methods, namely Rider-MBO-based Deep-ConvLSTM, Deep learning, Auto Regression model, and the NARX, is 3.8494, 7.5542, 12.635, and 17.6350, respectively. From the figure, it is clear that with the increase in delay, the MSE and the RMSE increases.
Comparative analysis on the basis of data from Infosys,
Comparative analysis based on the data of HCL Technologies
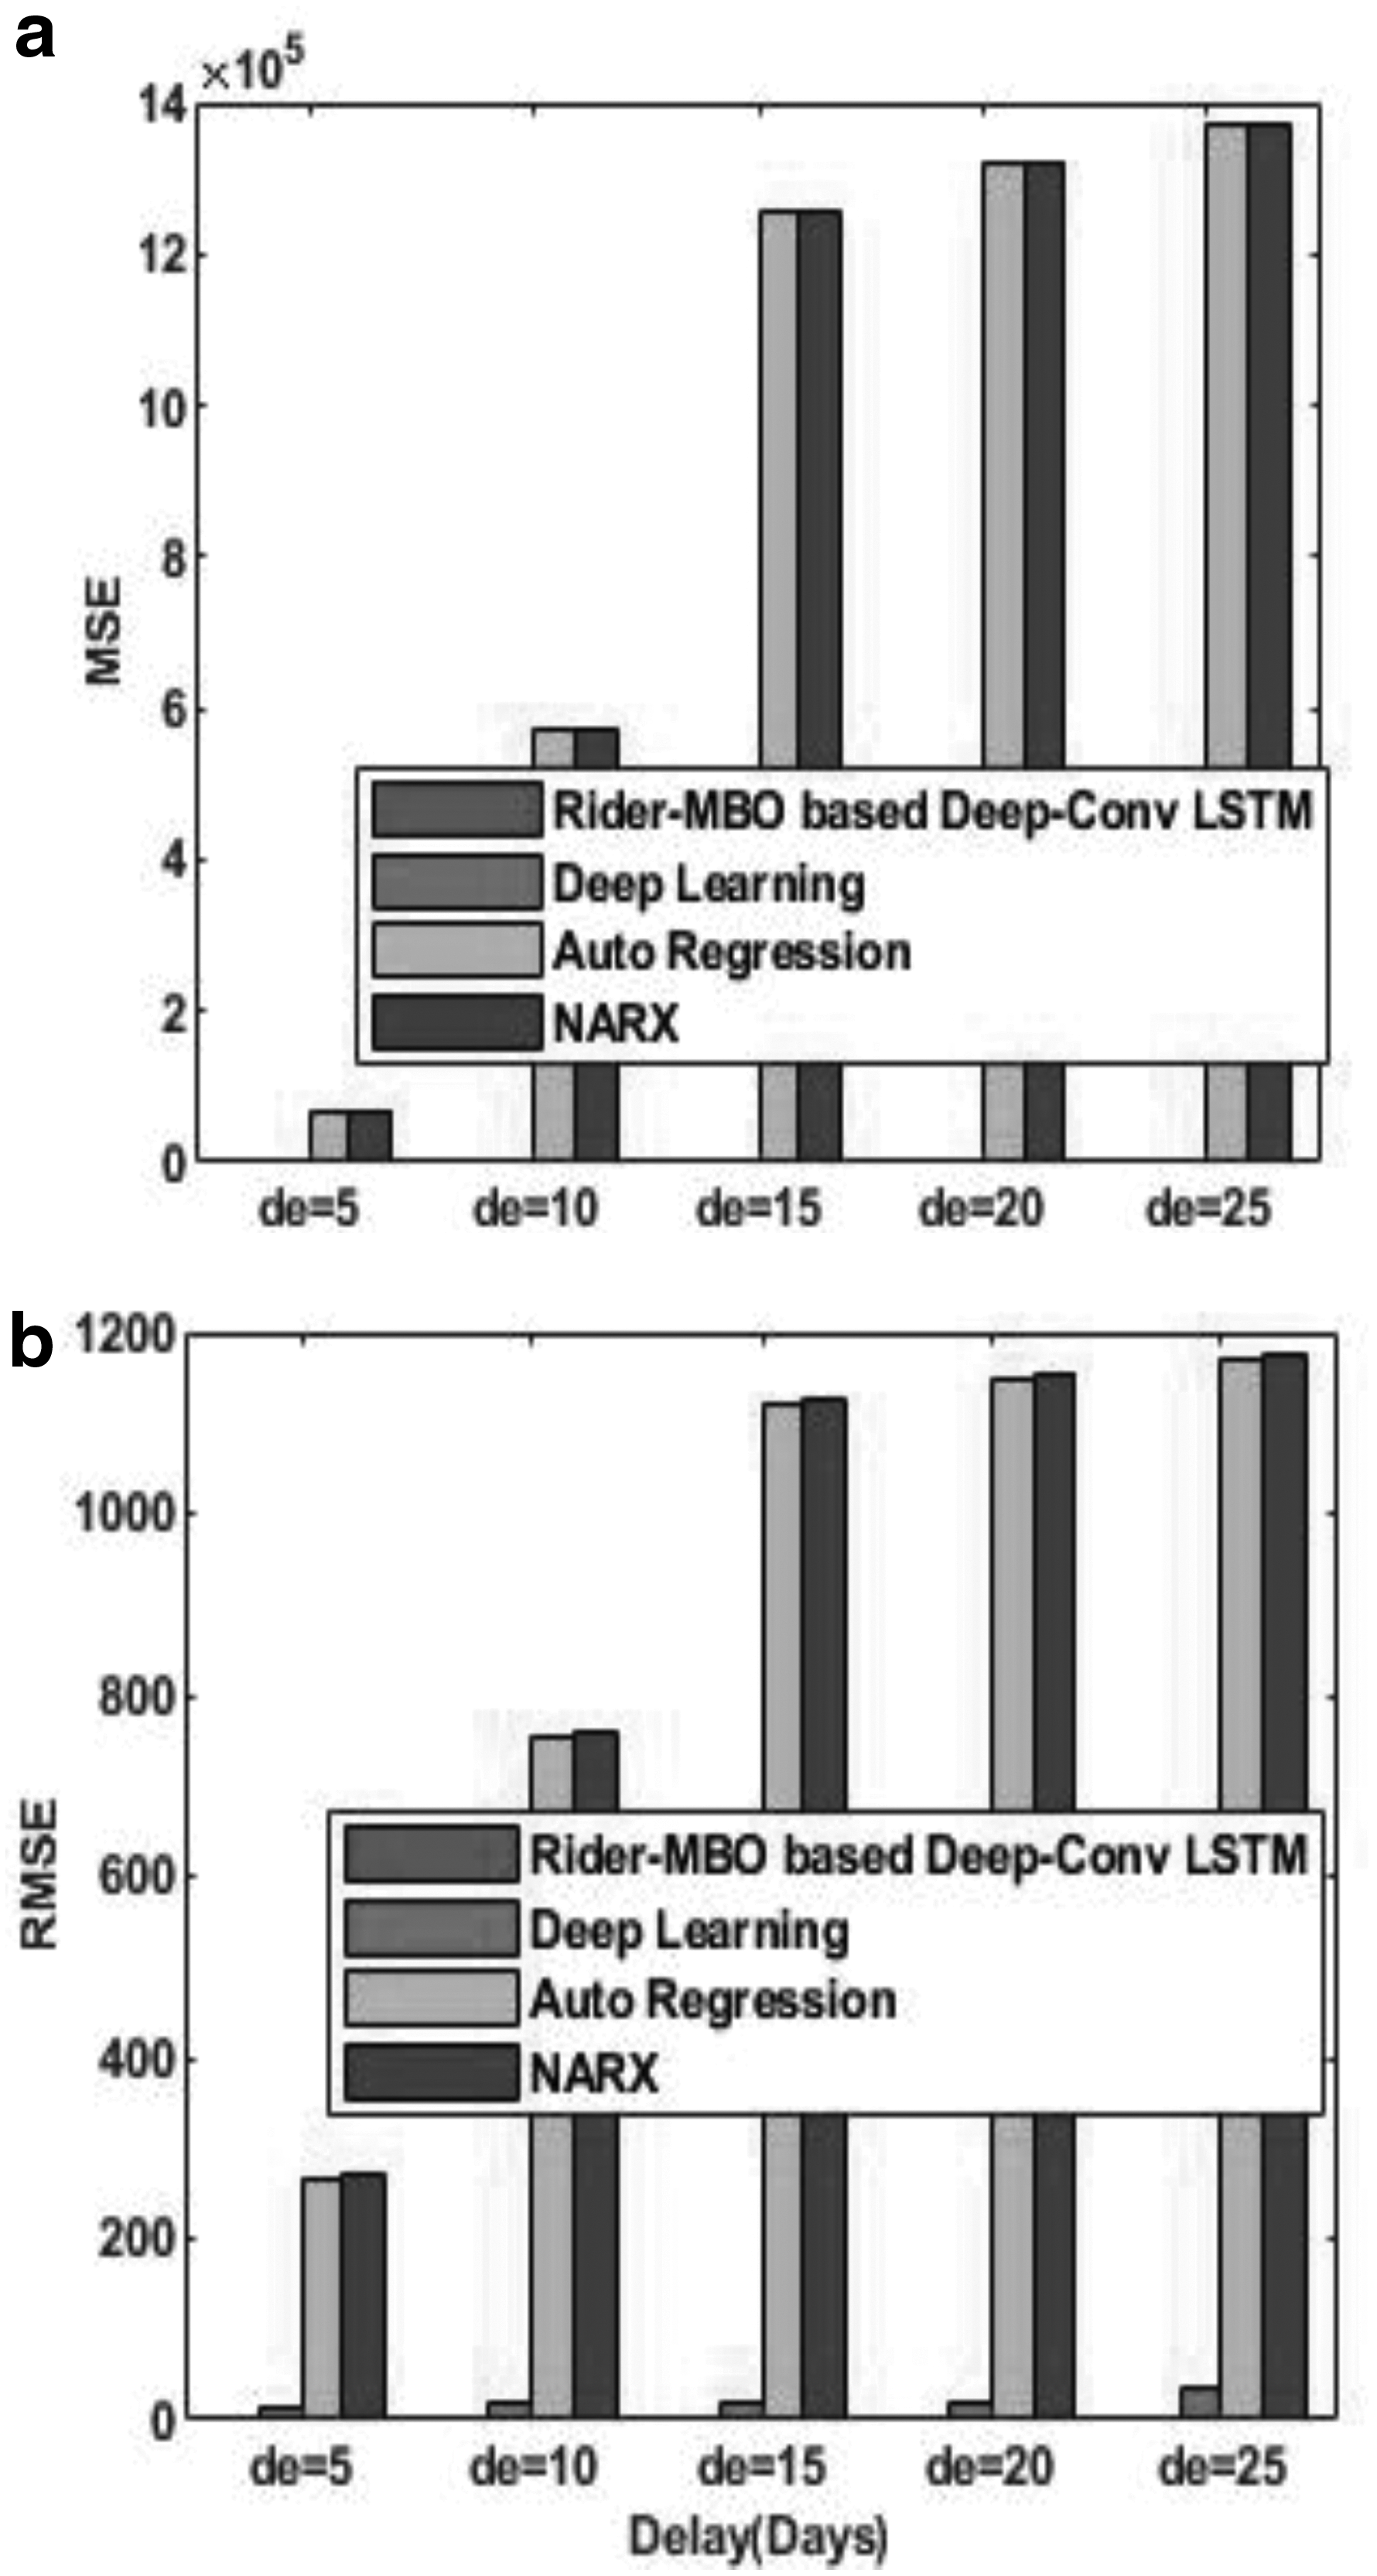
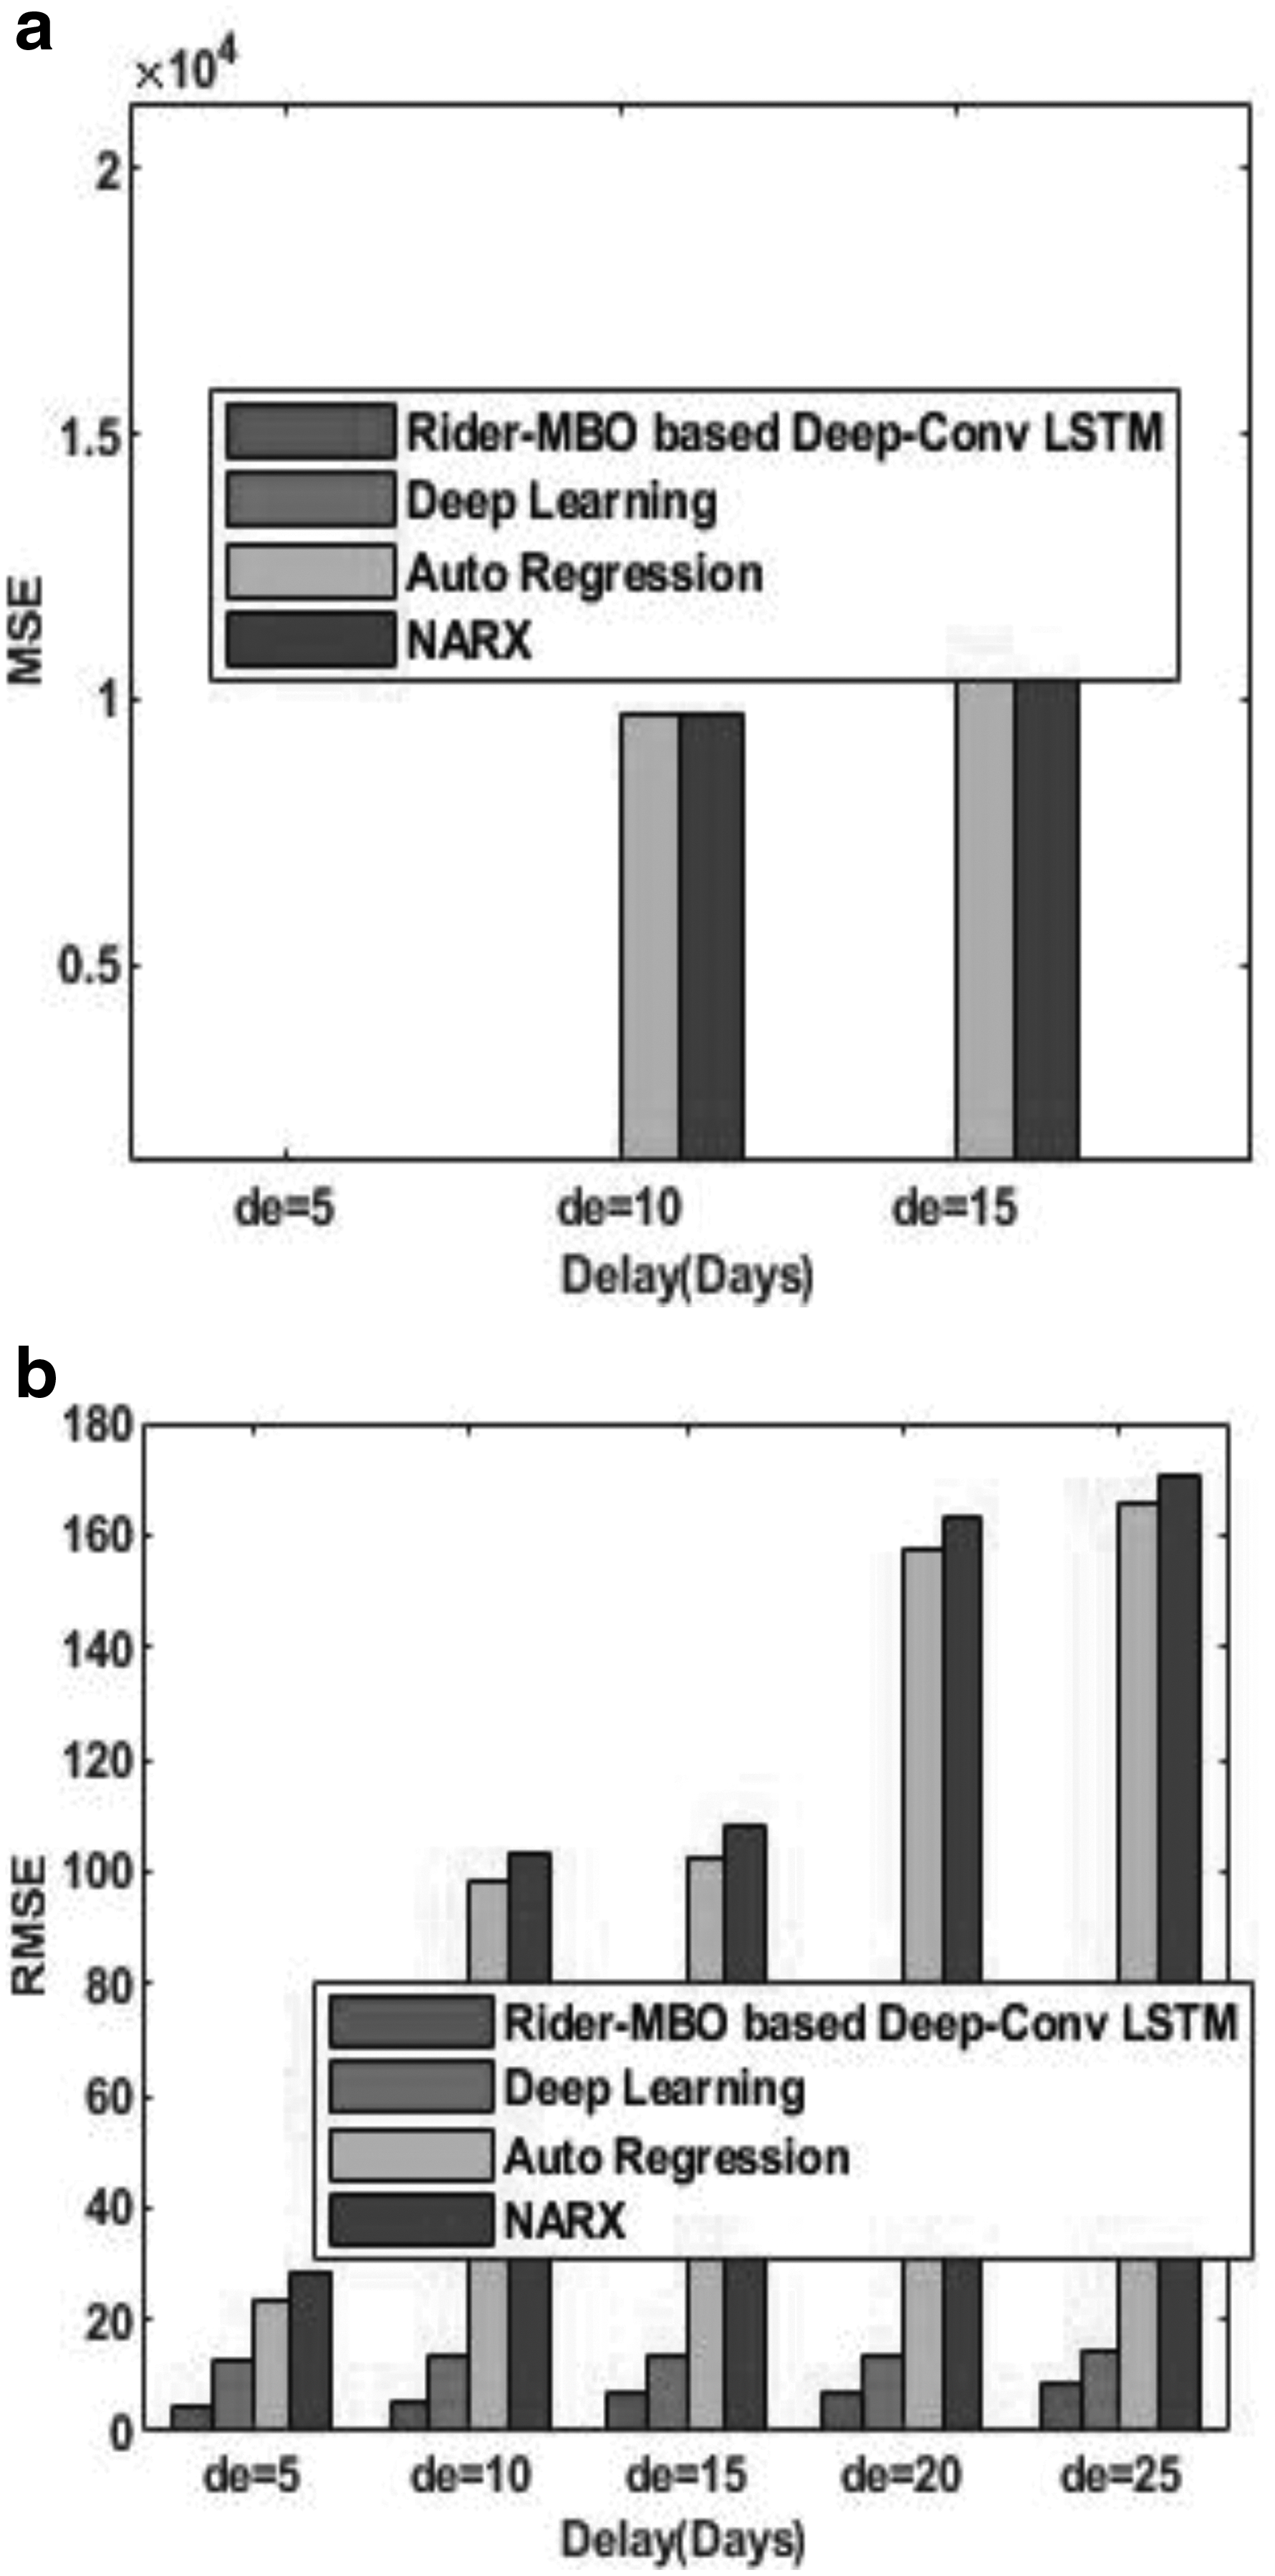
The comparative analysis of the proposed Rider-MBO method and the existing methods of stock market prediction using the data of HCL Technologies is shown in Figure 8. Figure 8a shows the comparative analysis based on MSE, and Figure 8b shows the comparative analysis based on RMSE. For the delay of 15 days, the MSE of the methods, such as Rider-MBO-based Deep-ConvLSTM, Deep learning, Auto Regression model, and the NARX, is 12.8858, 323.5855, 1256386, and 1256411, respectively. Similarly, for the delay of 15 days, the RMSE of the methods, namely Rider-MBO-based Deep-ConvLSTM, Deep learning, Auto Regression model, and the NARX, is 3.5897, 17.9885, 1120.886, and 1125.886, respectively. From the figure, it is clear that with the increase in delay, the MSE and the RMSE increases.
Comparative analysis on the basis of data from HCL Technologies,
Comparative analysis based on the data of Wipro
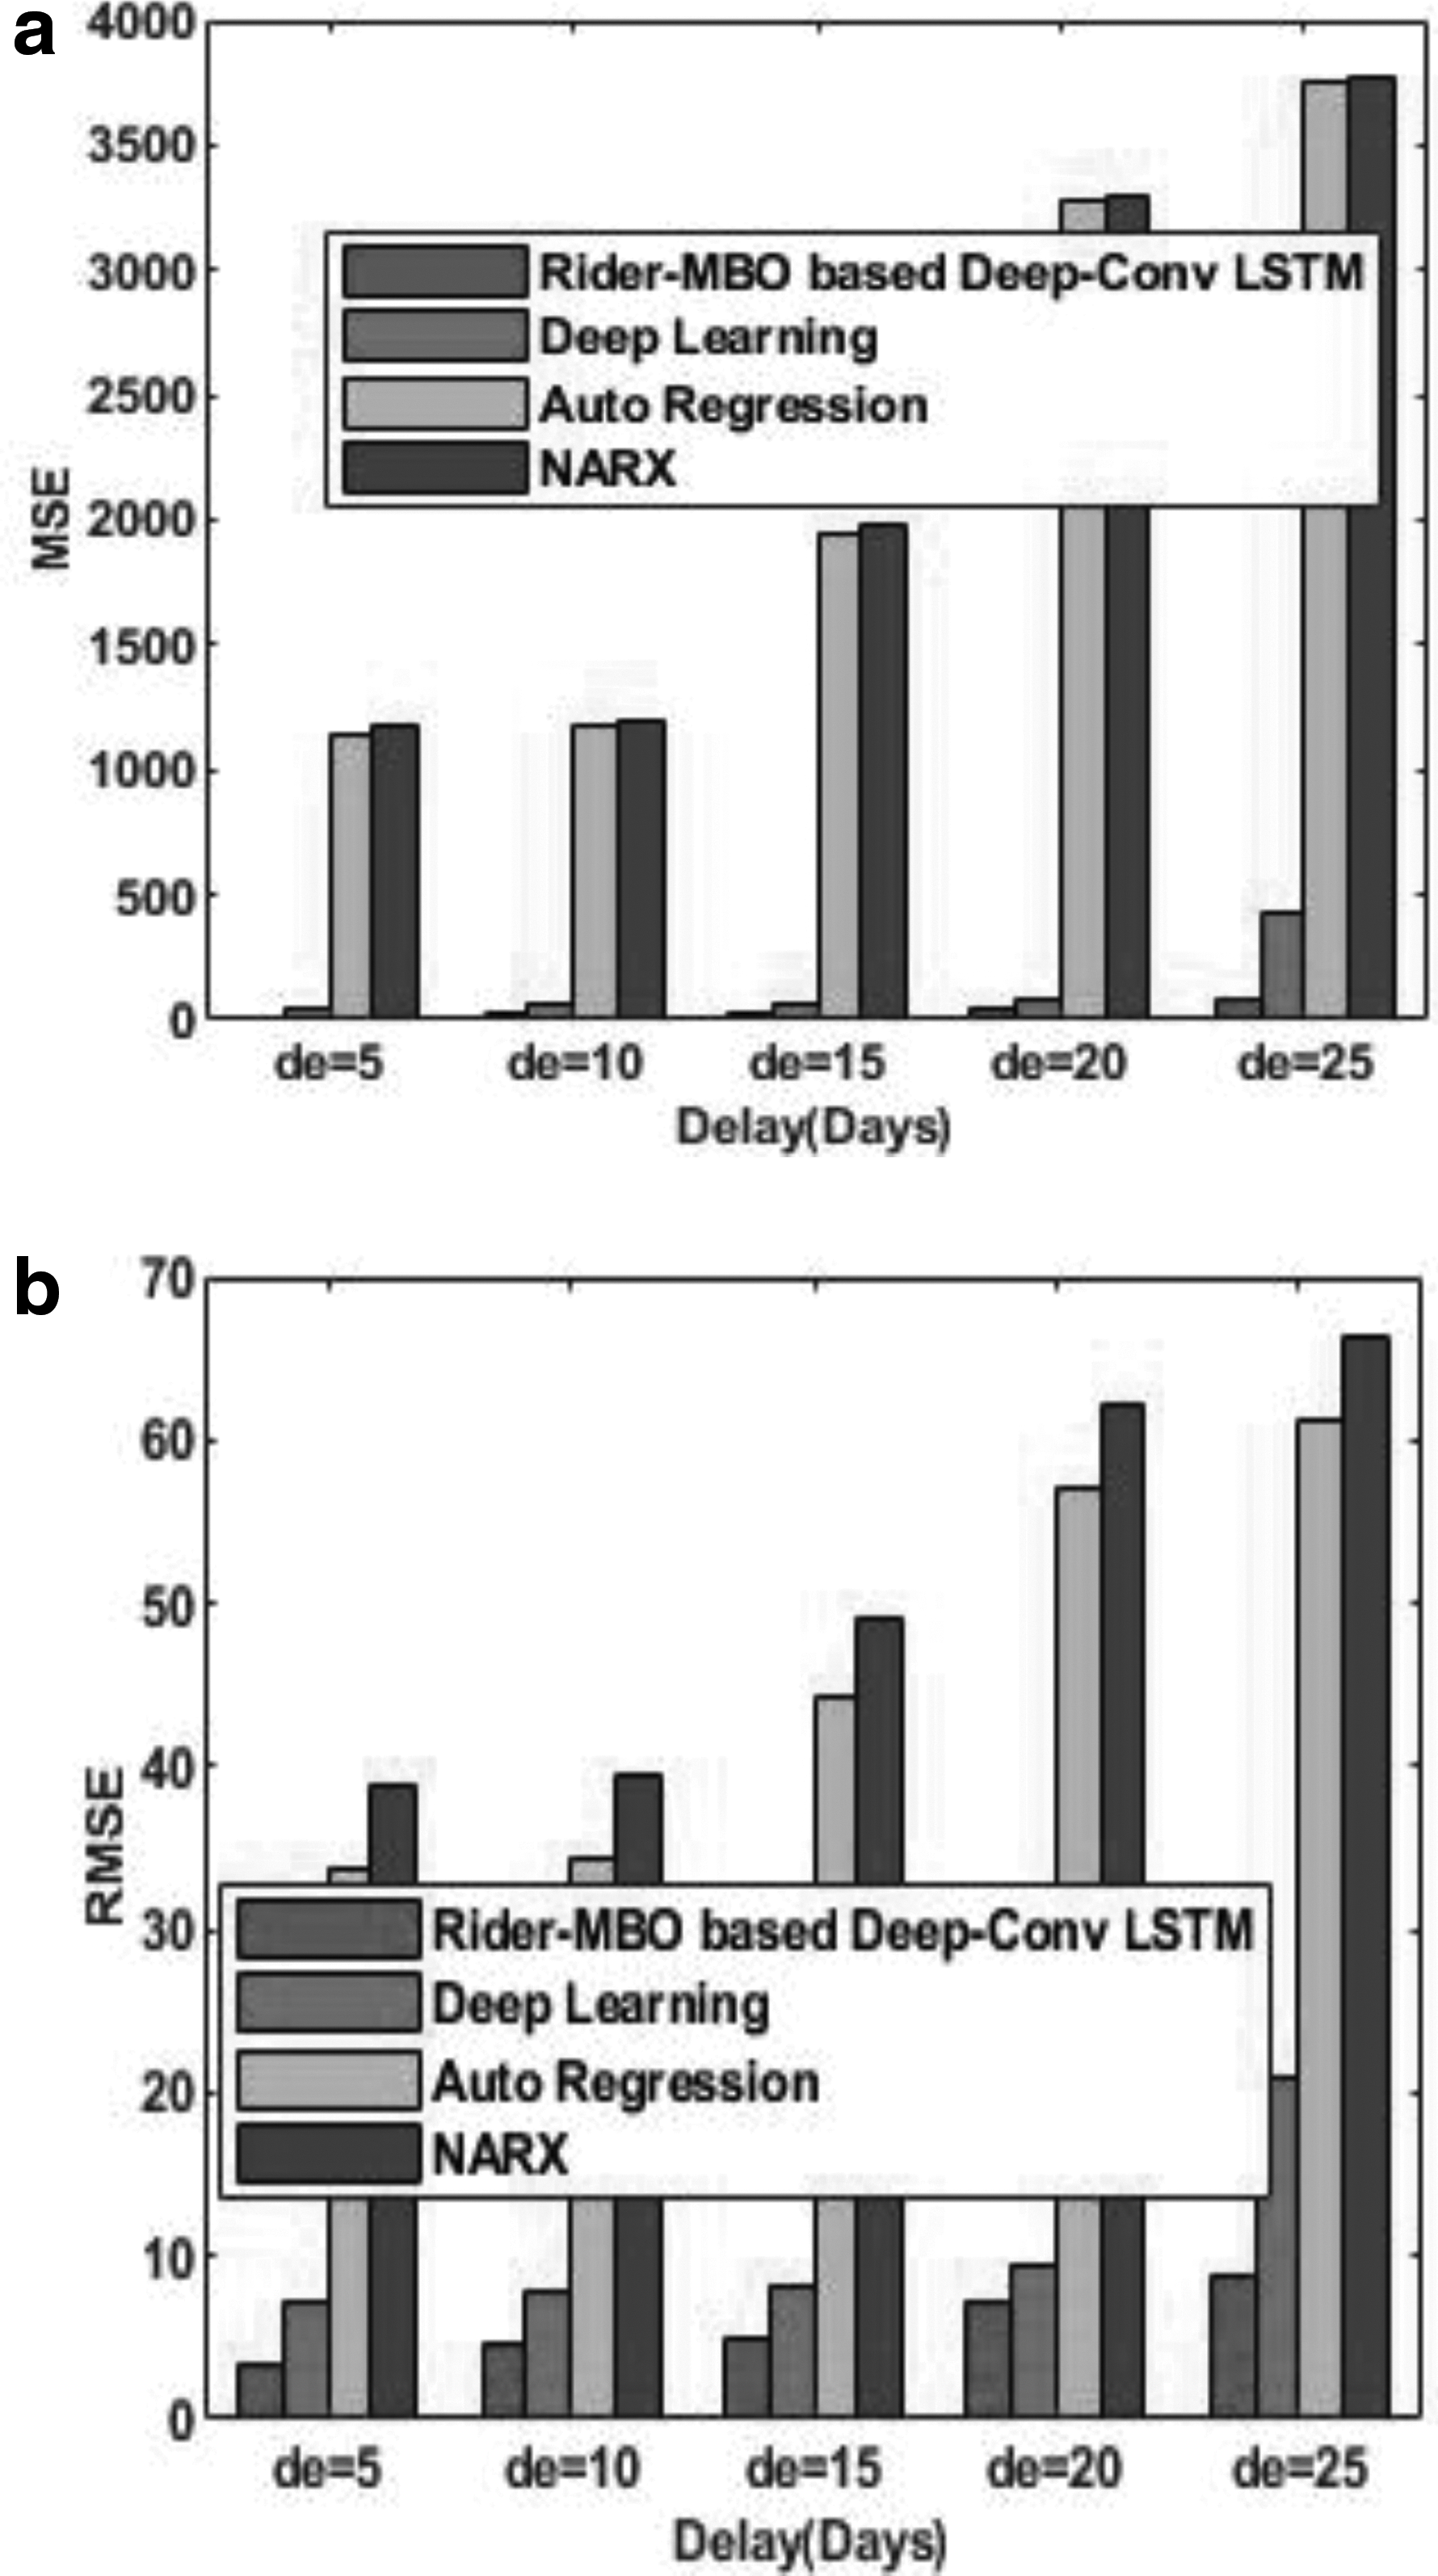
The comparative analysis of the proposed Rider-MBO method and the existing methods of stock market prediction using the data of Wipro is shown in Figure 9. Figure 9a shows the comparative analysis based on MSE, and Figure 9b shows the comparative analysis based on RMSE. For the delay of 15 days, the MSE of the methods, such as Rider-MBO-based Deep-ConvLSTM, Deep learning, Auto Regression model, and the NARX, is 23.4555, 68.1896, 1952.211, and 1977.211, respectively. Similarly, for the delay of 15 days, the RMSE of the methods, namely Rider-MBO-based Deep-ConvLSTM, Deep learning, Auto Regression model, and the NARX, is 4.8431, 8.2577, 44.1838, and 49.1838, respectively. From the figure, it is clear that with the increase in delay, the MSE and the RMSE increases.
Comparative analysis on the basis of data from Wipro,
Comparative analysis based on the data of Bharti Infratel
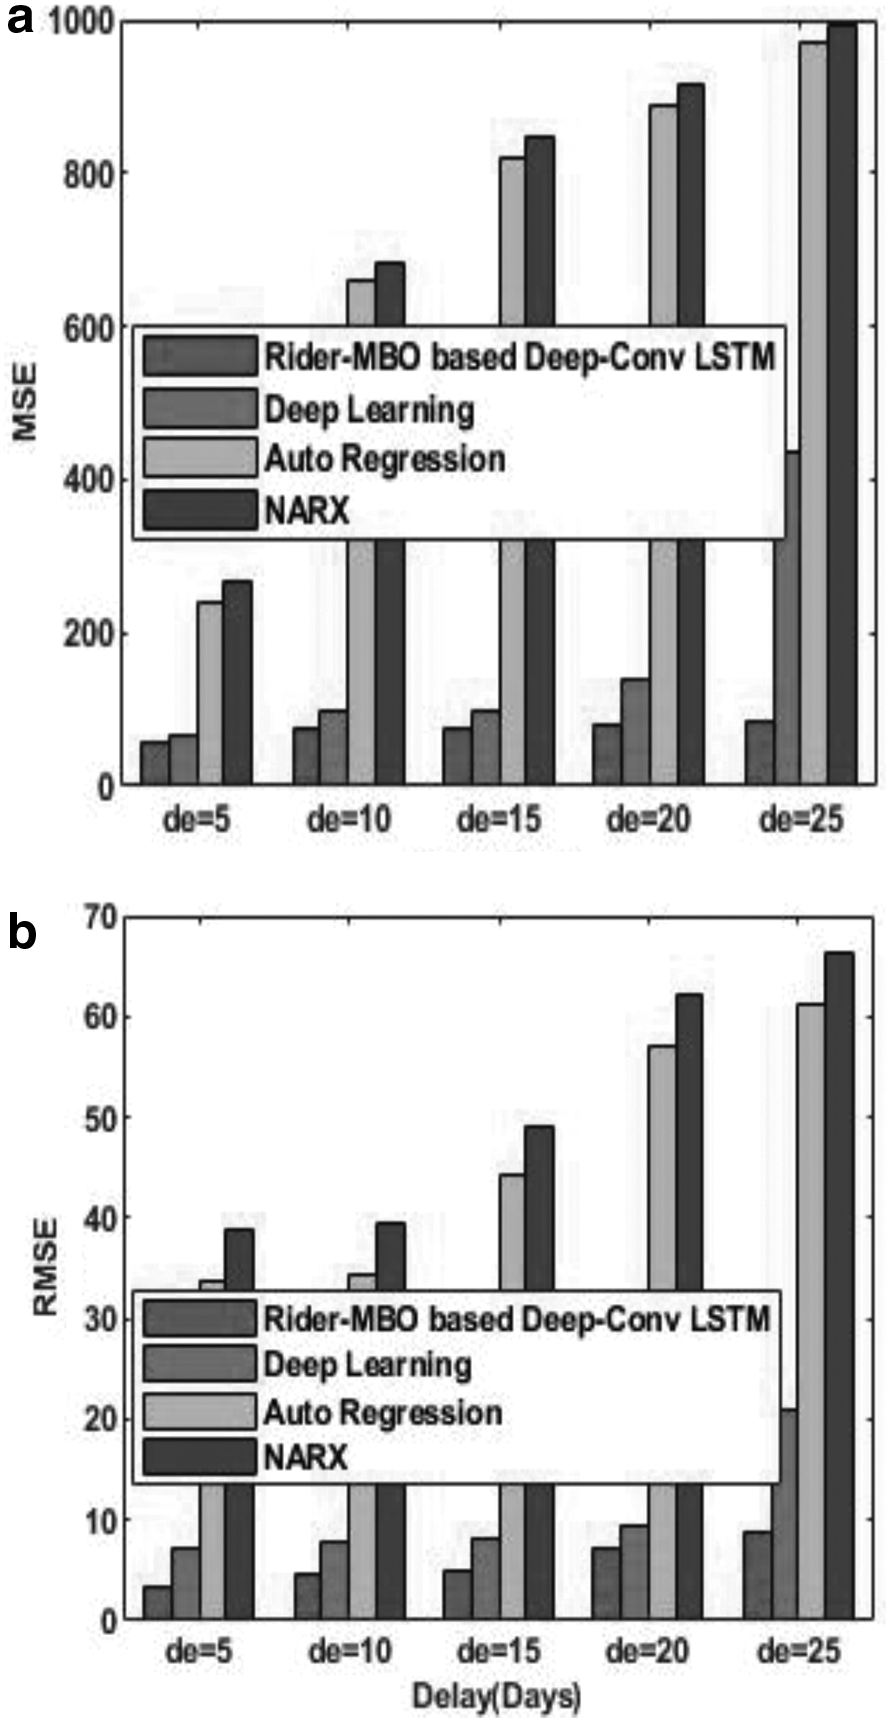
The comparative analysis of the proposed Rider-MBO method and the existing methods of stock market prediction using the data of Bharti Infratel is shown in Figure 10. Figure 10a shows the comparative analysis based on MSE, and Figure 10b shows the comparative analysis based on RMSE. For the delay of 10 days, the MSE of the methods, such as Rider-MBO-based Deep-ConvLSTM, Deep learning, Auto Regression model, and the NARX, is 74.4353, 96.2252, 658.8153, and 683.8153, respectively. Similarly, for the delay of 10 days, the RMSE of the methods, namely Rider-MBO-based Deep-ConvLSTM, Deep learning, Auto Regression model, and the NARX, is 8.6276, 9.8094, 25.6674, and 30.6674, respectively. From the figure, it is clear that with the increase in delay, the MSE and the RMSE increases.
Comparative analysis on the basis of data from Bharti Infratel,
Comparative analysis based on the data of Larsen & Toubro Infotech
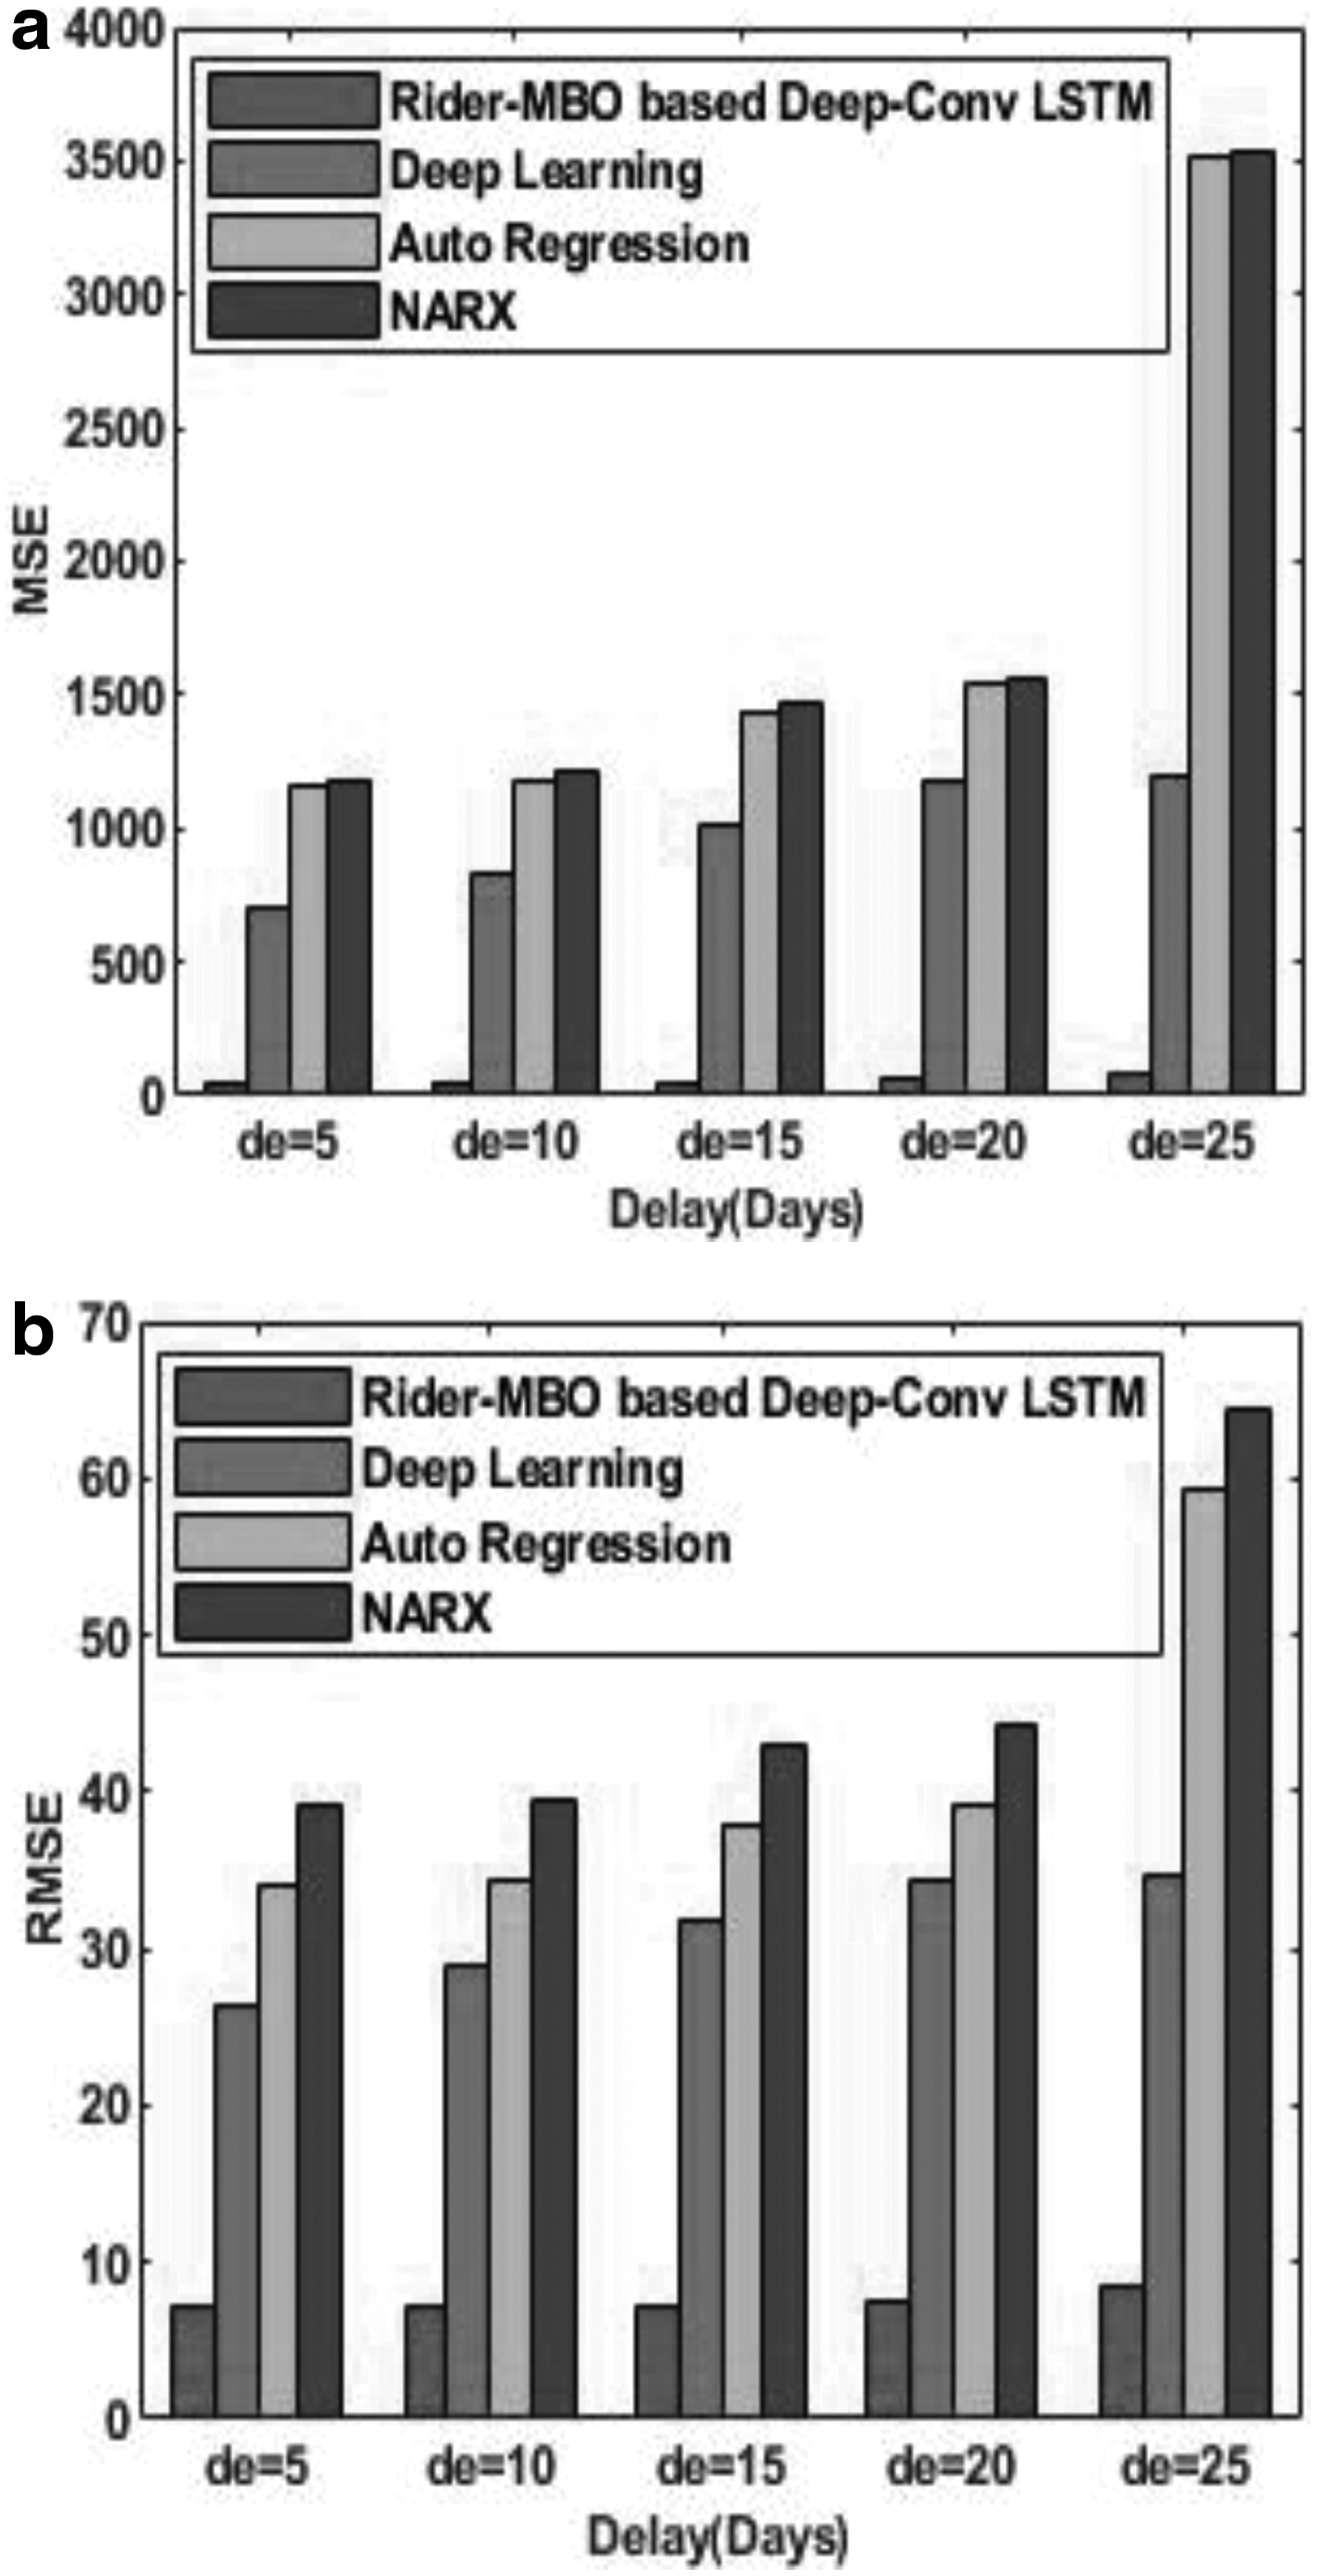
The comparative analysis of the proposed Rider-MBO method and the existing methods of stock market prediction using the data of Larsen & Toubro Infotech is shown in Figure 11. Figure 11a shows the comparative analysis based on MSE, and Figure 11b shows the comparative analysis based on RMSE. For the delay of 20 days, the MSE of the methods, such as Rider-MBO-based Deep-ConvLSTM, Deep learning, Auto Regression model, and the NARX, is 57.61, 1176.479, 1538.304, and 1563.304, respectively. Similarly, for the delay of 20 days, the RMSE of the methods, namely Rider-MBO-based Deep-ConvLSTM, Deep learning, Auto Regression model, and the NARX, is 7.5901, 34.2999, 39.2212, and 44.2212, respectively. From the figure, it is clear that with the increase in delay, the MSE and the RMSE increases.
Comparative analysis on the basis of data from Larsen & Toubro Infotech,
Comparative analysis based on the data of Siemens
The comparative analysis of the proposed Rider-MBO method and the existing methods of stock market prediction using the data of Siemens is shown in Figure 12. Figure 12a shows the comparative analysis based on MSE, and Figure 12b shows the comparative analysis based on RMSE. For the delay of 20 days, the MSE of the methods, such as Rider-MBO-based Deep-ConvLSTM, Deep learning, Auto Regression model, and the NARX, is 53.2538, 193.9928, 24884.26, and 24909.26, respectively. Similarly, for the delay of 20 days, the RMSE of the methods, namely Rider-MBO-based Deep-ConvLSTM, Deep learning, Auto Regression model, and the NARX, is 7.2975, 13.9281, 157.7475, and 162.7475, respectively. From the figure, it is clear that with the increase in delay, the MSE and the RMSE increases.
Comparative analysis on the basis of data from Siemens,
Comparative discussion
Table 1 shows the comparative analysis of the stock market prediction methods in the presence of data obtained from six live stock markets. The MSE of the methods, such as Rider-MBO-based Deep-ConvLSTM, Deep learning, Auto Regression model, and the NARX, for the data obtained from Infosys is 13.8647, 54.8042, 68.5545, and 93.5545, respectively. Similarly, the RMSE of the methods, such as Rider-MBO-based Deep-ConvLSTM, Deep learning, Auto Regression model, and the NARX, for the data obtained from Infosys is 3.7235, 7.4029, 8.2797, and 13.2797, respectively. The MSE of the methods, such as Rider-MBO-based Deep-ConvLSTM, Deep learning, Auto Regression model, and the NARX, for the data obtained from HCL Technologies is 7.2487, 173.1286, 69648.38, and 69673.38, respectively. Similarly, the RMSE of the methods, such as Rider-MBO-based Deep-ConvLSTM, Deep learning, Auto Regression model, and the NARX, for the data obtained from HCL Technologies is 2.6923, 13.1578, 263.9098, and 268.9098, respectively. The MSE of the methods, such as Rider-MBO-based Deep-ConvLSTM, Deep learning, Auto Regression model, and the NARX, for the data obtained from Wipro is 11.4972, 52.7737, 1144.569, and 1169.569, respectively. Similarly, the RMSE of the methods, such as Rider-MBO-based Deep-ConvLSTM, Deep learning, Auto Regression model, and the NARX, for the data obtained from Wipro is 3.3908, 7.2646, 33.8315, and 38.8315, respectively.
Comparative analysis of stock market prediction methods
MBO, monarch butterfly optimization; MSE, mean squared error; NARX, nonlinear autoregressive network with exogenous inputs; RMSE, root mean squared error.
The MSE of the methods, such as Rider-MBO-based Deep-ConvLSTM, Deep learning, Auto Regression model, and the NARX, for the data obtained from Bharti Infratel is 58.2697, 65.98136, 240.0854, and 265.0854, respectively. Similarly, the RMSE of the methods, such as Rider-MBO-based Deep-ConvLSTM, Deep learning, Auto Regression model, and the NARX, for the data obtained from Bharti Infratel is 7.6335, 8.1229, 15.4947, and 20.4947, respectively. The MSE of the methods, such as Rider-MBO-based Deep-ConvLSTM, Deep learning, Auto Regression model, and the NARX, for the data obtained from Larsen & Toubro Infotech is 52.1032, 695.9763, 1159.382, and 1184.382, respectively. Similarly, the RMSE of the methods, such as Rider-MBO-based Deep-ConvLSTM, Deep learning, Auto Regression model, and the NARX, for the data obtained from Larsen & Toubro Infotech is 7.2182, 26.3813, 34.0496, and 39.0496, respectively. The MSE of the methods, such as Rider-MBO-based Deep-ConvLSTM, Deep learning, Auto Regression model, and the NARX, for the data obtained from Siemens is 19.5524, 169.7411, 554.5325, and 579.5325, respectively. Similarly, the RMSE of the methods, such as Rider-MBO-based Deep-ConvLSTM, Deep learning, Auto Regression model, and the NARX, for the data obtained from Siemens is 4.4218, 13.0284, 23.5485, and 28.5485, respectively.
Conclusion
The accurate stock market prediction is performed by using the proposed Rider-MBO-based Deep-ConvLSTM model. Initially, the data that are obtained from the live stock market are subjected to the feature extraction process, from which the required features needed in the prediction of the stock market are extracted. The features are extracted based on the technical indicators, which is responsible for the provision of the data required in the prediction of the stock market. The effective features are fed to the Deep-ConvLSTM model that is trained by using the proposed Rider-MBO algorithm, which is developed from the integration of the ROA and the MBO. The experimentation of the proposed method is carried out by using the metrics, such as MSE and RMSE, in the presence of the data collected from six live stock markets. The proposed method produces the minimum MSE of 7.2487 and RMSE of 2.6923 and proves the superiority of the method in effective stock market prediction as compared with that of the existing methods. The proposed method of stock market prediction helps to invest cleverly to make good profits. Also, it helps to earn good profit.
Footnotes
Author Disclosure Statement
No competing financial interests exist.
Funding Information
No funding was received for this article.