
Abstract
Community detection problem is a projection of data clustering where the network's topological properties are only considered for measuring similarities among nodes. Also, finding communities' kernel nodes and expanding a community from kernel will certainly help us to find optimal communities. Among the existing community detection approaches, the affinity propagation (AP)-based method has been showing promising results and does not require any predefined information such as the number of clusters (communities). AP is an exemplar-based clustering method that defines the negative real-valued similarity measure sim(i, k) between data point i and exemplar k as the probability of k being the exemplar of data point i. According to our intuition, the value of sim(i, k) should not be identical to sim(k, i). In this study, a new version of AP using an adaptive similarity matrix, namely affinity propagation with adaptive similarity (APAS) matrix, is proposed, which could efficiently show the leadership probabilities between data points. APAS can adaptively transform the symmetric similarity matrix into an asymmetric one. It outperforms AP method in terms of accuracy. Extensive experiments conducted on artificial and real-world networks demonstrate the effectiveness of our approach.
Introduction
Analyzing various kinds of networks, especially social networks, has attracted a lot of attention in recent years due to the structural properties distinguishing these networks from the random ones. One of these distinguishing properties is the community structure. 1 As a primary definition, a community in a network is a set of nodes that the edges (or links) inside this set are much more than the edges between the set and outside of it. Generally, the nodes belonging to the same community have common features and play similar roles in the network. Detecting communities of a network reveals beneficial information about the structure and nature of the network.2,3 Social networks as a major part of the complex networks present community structure, as well. A node in a social network can be an individual, a group or an organization. These nodes are connected by edges indicating social relationships. There are lots of methods dealing with the problem of community detection in social networks. Among the clustering-based community detection methods, the affinity propagation (AP) one has been used in various approaches.4,5 Despite other clustering-based methods, AP does not require any predefined information about the under process network. It just takes the similarity matrix between data points as input and efficiently clusters the network in a relatively short time. AP is an exemplar-based clustering method. It defines one representative for each cluster, so that the clusters are recognized by their representatives. When the representative of a cluster is chosen among the real data belonging to that cluster, it is called an “Exemplar.”
Algorithm 1 highlights the major steps of AP. There are two kinds of messages exchanged in each iteration of the AP algorithm: Responsibility and Availability. The responsibility message
The similarity
The responsibility and availability of all the pairs are initially set to zero. In each iteration, the responsibility matrix is primarily updated using the availability matrix of the previous iteration. Then the availability matrix is updated. Finally, the exemplar index for each node is determined by the following rule:
Termination condition of the algorithm could be set to the determined maximum iteration number, or no changing on exemplar indices for a defined number of iterations. To overcome the numerical oscillations during matrix calculations, update rules can be modified using a damping factor as follows:
As a clustering algorithm, AP needs the pairwise similarities between all nodes to put the most similar nodes in the same clusters. Each node is assigned to the most similar representative. However, AP gives the similarity matrix a more comprehensive functionality. It uses the pairwise similarities in each iteration to compute availability and responsibility matrices, and finally, to determine cluster exemplars. Therefore, the similarity matrix has a direct influence on choosing the cluster exemplars. AP defines the negative real-valued similarity
The rest of the article is organized as follows. The Related Works section reviews current studies on AP-based community detection methods. In the Affinity Propagation with Adaptive Similarity Approach section, we describe our approach in detail. The Experiments section consists of the experimental results conducted on real-world and artificial networks. Finally, conclusions are discussed in the Conclusions section.
Related Works
There have been various approaches applying AP for community detection task since it was proposed by Frey and Dueck. 4 Most of them try to reach more accurate clustering results using different similarity metrics. In Jia et al. 8 and Lai and Lu, 11 authors claim that the measures based on the number of common neighbors do not consider the topological structure of the whole network. Accordingly, they exploit the similarity of regular equivalence (RE) proposed by Leicht et al. 15 RE uses the global information, which considers different roles of short and long paths. Wang et al. proposed an improved AP algorithm named semi-supervised hierarchical optimization-based AP. 16 This algorithm introduces the idea of semisupervision by setting a certain proportion of label data and using the AP for clustering purpose, then establishes the supervision and nonsupervision information matrix to optimize, and combines the result of AP algorithm. Liu introduced three useful similarity measures such as diffusion kernel (DK) feature matrix, shortest path-based similarity, and adjacency matrix-based similarity. 10 These similarity measures are then applied to the AP algorithm and the clustering results are compared with each other. In Lai et al., 13 authors exploited random walk to accomplish a community membership-based node to node similarity. In Liu et al., 9 authors applied a number of traditional similarity measures that are based on the number of common neighbors. Ding et al. used a similarity based on commute-time kernel. 12 They first mapped the nodes of graph into another feature space. Then, the similarity is computed easily. Wang et al. proposed a new approach for clustering the social network's graph by considering the content and link information of the social network. 17 Furthermore, they analyzed the centrality of the detected communities in a real social network class as a case study and they found that the detected communities could significantly help to improve the quality of the teaching and learning based on each community's properties. In Guo and Zhang, 18 authors only calculated the responsibilities and availabilities between each node and its neighbors. Here, a recursive method is proposed: the clusters found in the last iteration of AP are treated as the new nodes and partitioned recursively until the clustering results no longer change. Zhu et al. proposed a new method to measure the similarities between data points and transfer the messages only among pairs with similarity values >0. 14 Jia et al. 19 proposed a fast version of AP in two stages. In the first stage, the message passing occurs only between each node and its k most similar nodes. Then, the exemplars from the first stage are considered the candidates for final exemplars and a new graph structure is constructed.
There are some other researches improving AP to exploit it in different fields. For example, Wang et al. developed a method based on the propagation of affinity and domain architecture to predict protein functions in the format of Gene Ontology (GO) terms. 20 In their method, the AP was used to cluster GO-directed acyclic graph after a preprocessing step. The K-AP method was proposed to generate specified K clusters using AP. 21 Luo et al. proposed a local community detection method using a dynamic membership function. 22 Guo and Zhang proposed a new local AP algorithm to discover communities in social networks by propagating affinity messages among members in a localized manner. 23 The affinity between any two members was computed by the gray relational analysis method. The authors in Zhu et al. 14 proposed a semisupervised clustering scheme based on AP. It defines a new measure of similarity for the case there is prior knowledge about the membership of some of the nodes in the network. This similarity is then applied to the AP algorithm. In Lai et al.13, and Wang et al., 24 a new schema of preference setting for AP method was applied. In Guo and Zhang, 25 authors combined AP with modularity maximization to obtain an efficient clustering of network. It constructs a dissimilarity distance matrix for the network in hand. This matrix is then applied to the AP algorithm to obtain a candidate set of exemplars. This incremental manner continues until no more exemplar remains in the candidate set. The final community of the network is the partitioning with maximum value of modularity. Shang et al. proposed a multiobjective evolutionary algorithm using the AP algorithm to find the communities with higher efficiency than other compared community detection algorithms. 26 In their method, AP is initially used to partition the network, and then, to reach a fast convergence, the multiobjective evolutionary algorithm selects the nondominated solutions from the preliminary partitioning results of AP as its initial population.
All the mentioned AP-based methods apply a symmetric similarity matrix into AP, where the value of sim(i,k) is identical to the value of sim(k,i). AP defines the negative real-valued similarity sim(i,k) between data point i and exemplar k as the probability, indicating how well the data point with index k is suited to be the exemplar for data point i. According to our intuition, this value is not necessarily identical to the value of sim(k,i). In the next section, a new approach of AP, applying an asymmetric similarity matrix, is proposed.
There are also many popular community detection algorithms such as label propagation algorithm (LPA), 27 Louvain, 28 and fast Newman. 29 In the LPA algorithm every node is initialized with a unique label and at each step of the procedure iteration, each node adopts the label that most of its neighbors currently have. In this iterative process, densely connected groups of nodes form a consensus on a unique label to form the communities. LPA requires neither optimization of a predefined objective function nor prior information about the communities. Louvain 28 is another heuristic method based on modularity maximization. The algorithm consists of two phases. In the first phase, each node is considered a different community. For each node i, the change of modularity by removing i from its community and moving it into a neighboring community is computed. The node i is then moved to the community with the maximum modularity increment. This process is repeated until no more increment in modularity is possible. In the second phase, all the communities obtained in the first phase are treated as new nodes of the network and a merging process is applied on the new nodes. Louvain is fast when applying to the large-scale real-world networks. It is easy to implement. In Newman, 29 Newman proposed a greedy optimization method for the modularity maximization problem. In this method, each node is supposed to be a different community with one member. Afterward, the pair of communities with the largest increase in modularity merges repeatedly until all the nodes are merged together in a sole community. This Newman method proved to be a very fast algorithm for the modularity maximization problem.
Stepping community detection algorithm based on label propagation and similarity (stepping LPA-S) is a new label propagation-based algorithm, in which labels are propagated using the resource allocation similarity index. It updates the label of a node according to the most similar label of its neighbors and then initial communities with high similarity are merged. In Berahmand and Bouyer, 1 a new extended LPA-based algorithm was proposed to improve the stability and accuracy of the traditional LPA by defining two concepts—nodes and link strength based on semilocal similarity. Zhang et al. proposed a new label propagation algorithm based on node ability (NALPA) to discover communities in complex networks. 31 NALPA used four factor as node abilities, including propagation ability, attraction ability, launch ability, and acceptance ability. Wang et al. proposed a new algorithm based on the location of community structural centers detection and expanding (LCCD) algorithm for detecting communities. 32 This algorithm initially finds central nodes of communities based on the structural centrality that uses local density and distances between nodes to calculate it. After identifying central nodes, it expands the local community from inner central nodes to outer nodes. Node's label influence policy for label propagation algorithm was another LPA-based algorithm for detecting community structures using link strength value for edges and nodes' label influence value for nodes. 33 It used this measure to select core nodes and label updating. It mostly removed tiebreak state of traditional LPA. A robust two-stage local community detection algorithm (RTLCD) is a local community detection based on core detection and community expanding from these cores. It has near-linear time complexity but low accuracy. 34 Community detection based on expanding core nodes using extended similarity (ECES) algorithm is a new local method based on detecting and expanding the core nodes. 35 A centrality criterion is used that gives high scores to central nodes with a high degree of embeddedness. First, the weights between edges are calculated using a similarity index. Next, the core dominance of the kernel node is calculated to select central nodes. The next step is to expand the central nodes using a membership function. At that time, the merging phase is used to form final communities. Tasgin and Bingol proposed the community detection algorithm based on boundary nodes at group level common neighbors (G-CN) algorithm as a local community detection method that considers a label propagation process such as LPA. 36 However, G-CN only updates the labels for boundary nodes at each iteration to reduce the execution time. It has two weaknesses: resolution limit and low accuracy problem. 37 To overcome these problems, a hybrid algorithm based on node scoring and synchronous label updating of boundary nodes along with disabling random label updating at group level common neighbors was proposed that uses a hybrid node scoring and synchronous label updating of boundary nodes, along with disabling random label updating in initial updates. For this purpose, it updates the label of boundary nodes in a synchronous manner using a new node scoring measure. 37
Affinity Propagation with Adaptive Similarity Approach
AP takes a network as an input and clusters it based on the pairwise similarities between its nodes. According to our intuition, these similarities should not be symmetric as they determine the leadership probability of a node over another one. Furthermore, AP is an iterative method and the exemplar indices. However, AP only utilizes the information of the last iteration, and the information gained in previous iterations is wasted. Besides these facts, we claim that the exemplar of a cluster is a node with the highest centrality in that cluster. Considering these intuitions, a new approach of AP is proposed, in which the similarity matrix used in every iteration of AP is not a constant one, but it is adapted according to the information obtained in each iteration. The adapted similarity matrix is used as an input for the next iteration. Therefore, in the second iteration of AP, the similarity matrix returns the symmetric mode and gets more accurate values as the algorithm continues. To this end, we need to utilize the information obtained in each iteration of AP. At the end of each iteration, after the exemplar indices for all the nodes are computed, the centrality values of the exemplars in their clusters are calculated. An exemplar should have the highest centrality value in its cluster. If exemplar k in cluster C, idx(k) = C, has the highest centrality value, then k is an appropriate exemplar for the nodes in C, and the similarities between the nodes in C and exemplar k, sim(i,k)i∈C, should increase. This increment is done using the following formula:
where Incentrality(k) is the centrality value of exemplar k in cluster C. There are a number of centrality metrics that can be used here. As the utilized metric does not have much impact on the result our experiments, in this study, “degree centrality” is used to measure centrality values. This centrality metric is very simple and has a low time complexity. The degree centrality value of exemplar k in cluster C is the number of direct neighbors of k in cluster C divided by the cardinality of C. As the similarity sim(i,k) is negative and Incentrality(k) takes value in the interval [0,1], the Eq. (8) changes as follows:
Similarly, if exemplar k in cluster C, idx(k) = C, does not have the highest centrality value, then k is not an appropriate exemplar for the nodes in C, and the similarities between the nodes in C and exemplar k, sim(i,k)i∈C, should be decreased. This decrement is done using the following formula:
Finally, the preference values need to be updated using the new similarity matrix:
where sim(:,k) is a vector demonstrating the similarity values between all nodes of the network and k. Algorithm 2 represents the similarity updating process of the affinity propagation with adaptive similarity (APAS) approach.
Refinement of the idx vector
At the end of each iteration of AP, idx vector is obtained. This vector does not require any refinement process, since it is not used in the next iteration of AP. On the contrary, APAS refines idx vector before updating similarity matrix due to the fundamental role of the idx vector in the updating process. Refinement of the idx vector is needed when there is a conflict in the exemplar index of an exemplar. AP requires that the exemplar of a cluster is chosen among the data belonging to that cluster. When an exemplar does not choose itself as exemplar, idx(k) ≠ k, the idx vector needs to be refined before being transferred to the similarity update function. The refinement is done in two conditional steps as follows:
1. If there exist some nodes choosing k as their exemplars in this iteration, but k has not chosen itself as exemplar, then all the nodes choosing k will be joint to the k's selected exemplar:
2. If there exist some nodes choosing k as their exemplars in this iteration, but k has chosen another node named j as its exemplar, and j has chosen k as its exemplar, from k and j, the exemplar with fewer number of followers (along with its followers) will join to another one:
Algorithm 3 presents the procedure of proposed APAS approach.
Experiments
APAS takes a similarity matrix between data points as an input. To measure the similarity in this study, we utilize metrics used in Liu,
38
and Jia and Yu
39
since they have proven to be efficient when applying to the AP algorithm,
38
apply three different similarity measures to AP. One of these measures, called “Diffusion Kernel,”
40
is a feature matrix that is commonly used in different fields. Given the graph of a social network, the (opposite) Laplacian of the network is defined as follows:
where i–j means that nodes i and j are connected by an edge, and di is the degree of node i. The exponential of the matrix L is defined as follows:
where β is a positive constant to control the degree of diffusion, and exp(L) represents the matrix exponential of the Laplacian matrix L. We set β to be 0.4 in our experiments. Finally, the non-negative similarity matrix DK is defined by normalizing the kernel matrix K:
The method in Jia and Yu
39
exploits the similarity of RE proposed by Leicht and Newman.
41
RE uses the global information, which considers different roles of short and long paths. The idea is that two nodes are similar if they are connected to other similar nodes. The similarity matrix RE is obtained in an iterative method using the following equation:
where T(i) is a temporal matrix variable used for calculating similarity at ith iteration. Parameter α is a convergence factor controlling the weights of short and long paths. In real-world social networks, the parameter α usually takes values in the range of 0.90–0.99 (in this study, we set α to be 0.9). λ1 is the largest eigenvalue of the adjacent matrix A of the network. Initializing T to 0, that is, T(0) = 0, the elements of the similarity matrix RE will converge to non-negative values in a very short time.
As stated before, the similarity matrix used in AP must have negative real-valued elements. Therefore, we turn the non-negative values of DK and RE matrices into negative ones using the following assignment:
where M is the maximum value of the similarity matrix sim. In the following, APAS is compared with two abovementioned qualified approaches applying the original AP method. For simplicity, we name these two approaches as AP-DK and AP-RE. In all the experiments, we have set the damping factor λ to 0.9, the maximum number of iteration maxits to 3000, and the termination parameter convits to 100.
Evaluation metrics
There are several metrics to evaluate a clustering of a network. Here, we apply the two most common metrics in community detection: “NMI” and “Modularity.” Normalized mutual information (NMI)
42
compares two partitions of a network and is beneficial when the natural clustering of the network is available. Given X = (X1,X2,…,Xnx) with nx number of clusters and Y = (Y1,Y2,…,Yny) with ny number of clusters as two different partitions of a network, NMI is defined as follows:
NMI equals 1 when two partitions are identical.
Modularity
43
is another evaluation metric currently very often used in community detection. Modularity of the partition P is defined as follows:
where e(c) is the fraction of internal edges of cluster c, and a(c) is the fraction of edges with at least an endpoint in cluster c.
Experiments for NMI measure on real-world networks
In this section, four popular real-world networks with ground-truth, including Zachary karate club, bottlenose dolphins, Football and Political books are used to examine the NMI measure of our proposed APAS approach. The results of the AP and APAS methods using DK and RE similarities on real-world networks are separately shown in Tables 1 and 2.
Normalized mutual information values of affinity propagation diffusion kernel and affinity propagation with adaptive similarity on four real-world networks using negative diffusion kernel similarity
Bold value indicates the best result in the table.
AP, affinity propagation; APAS, affinity propagation with adaptive similarity; DK, diffusion kernel.
Normalized mutual information values of affinity propagation diffusion kernel and affinity propagation with adaptive similarity on four real-world networks using negative regular equivalence similarity
Bold values indicate the best results in the table.
RE, regular equivalence.
As we can see, APAS outperforms AP when applying to the real-world networks whether using DK or RE similarity matrices. APAS achieves more accurate results due to utilizing the information obtained in all the iterations. Therefore, the elements of similarity matrix used in APAS get more accurate values compared with the original AP algorithm. In both methods, the final number of communities is simultaneously determined by user-defined preferences and message passing procedure. Data points with high values of preference are more likely to be chosen as exemplar. In most cases, there is no information about the leadership probability of data points. Hence, usually the preference values are set to a common value. Selecting this value is of great importance. It is hard to know which value of preference would give the most optimal communities. A large value of preference will result in a large number of small communities and vice versa. There are many methods presented to select an optimum value for the preference. Most of these methods search the optimal number of clusters to set the best preference value. Anyway, it is not an important issue here as we utilize the same method for setting the preference value in both AP and APAS methods. The preferences are set to a common value of median of the whole similarity matrix both in AP and APAS methods. Therefore, the way that is used to set the preferences does not influence the final result of comparison between these two methods.
On the contrary, we also compared the APAS algorithm with other well-known, newly proposed, and none AP-based methods such as the method of Clauset, Newman, and Moore (CNM), Infomap, LCCD, ECES, NALPA, Stepping LPA-S, RTLCD, and Louvain. Table 3 shows the experimental results on four ground-truth networks based on NMI measure. It is obvious that APAS (RE) has the best performance in all data sets, except the Football data set. In the Karate data set, both APAS (RE) and APAS (DK) along with NALPA and RTLCD have the best NMI equal to 1. In the Dolphins data set, only APAS (RE) has NMI = 1. Stepping LPA-S has the second-best NMI. In the Polbooks data set, APAS (RE) and APAS (DK) are the first- and second-best algorithms, respectively. NALPA has the third rank among the compared algorithms. However, in Football data sets, APAS (DK) has the best and APAS (RE) has the second-best performance. Besides performance, another advantage of APAS is its reliability in finding communities in comparison with other methods. In several runnings, it has reliable performance and NMI measure.
Normalized mutual information results obtained from experiments on small real-world networks with ground truth
Bold values indicate the best results in the table.
CNM, the method of Clauset, Newman, and Moore; ECES, expanding core nodes using extended similarity; LPA-S, label propagation and similarity; LCCD, location of community structural centers detection and expanding; NALPA, label propagation algorithm based on node ability; RTLCD, robust two-stage local community detection.
Experiments on computer-generated networks
Computer-generated networks are the other type of benchmarks that are commonly used in community detection field. In these benchmarks, the built-in cluster structure can be arbitrarily designed. Here, we use two classes of the computer-generated networks. The first, introduced by Girvan and Newman, 44 is a group of networks with 128 nodes divided into four communities of 32 nodes. These networks are known as the “GN” benchmark networks. Each node in a GN network has on average an internal degree of Zin and an external degree of Zout where Zin + Zout = 16. We made several networks for the particular values of Zout and compared the APAS approach with AP-DK and AP-RE methods on these networks. Figures 1 and 2 show the result of each method on GN networks.
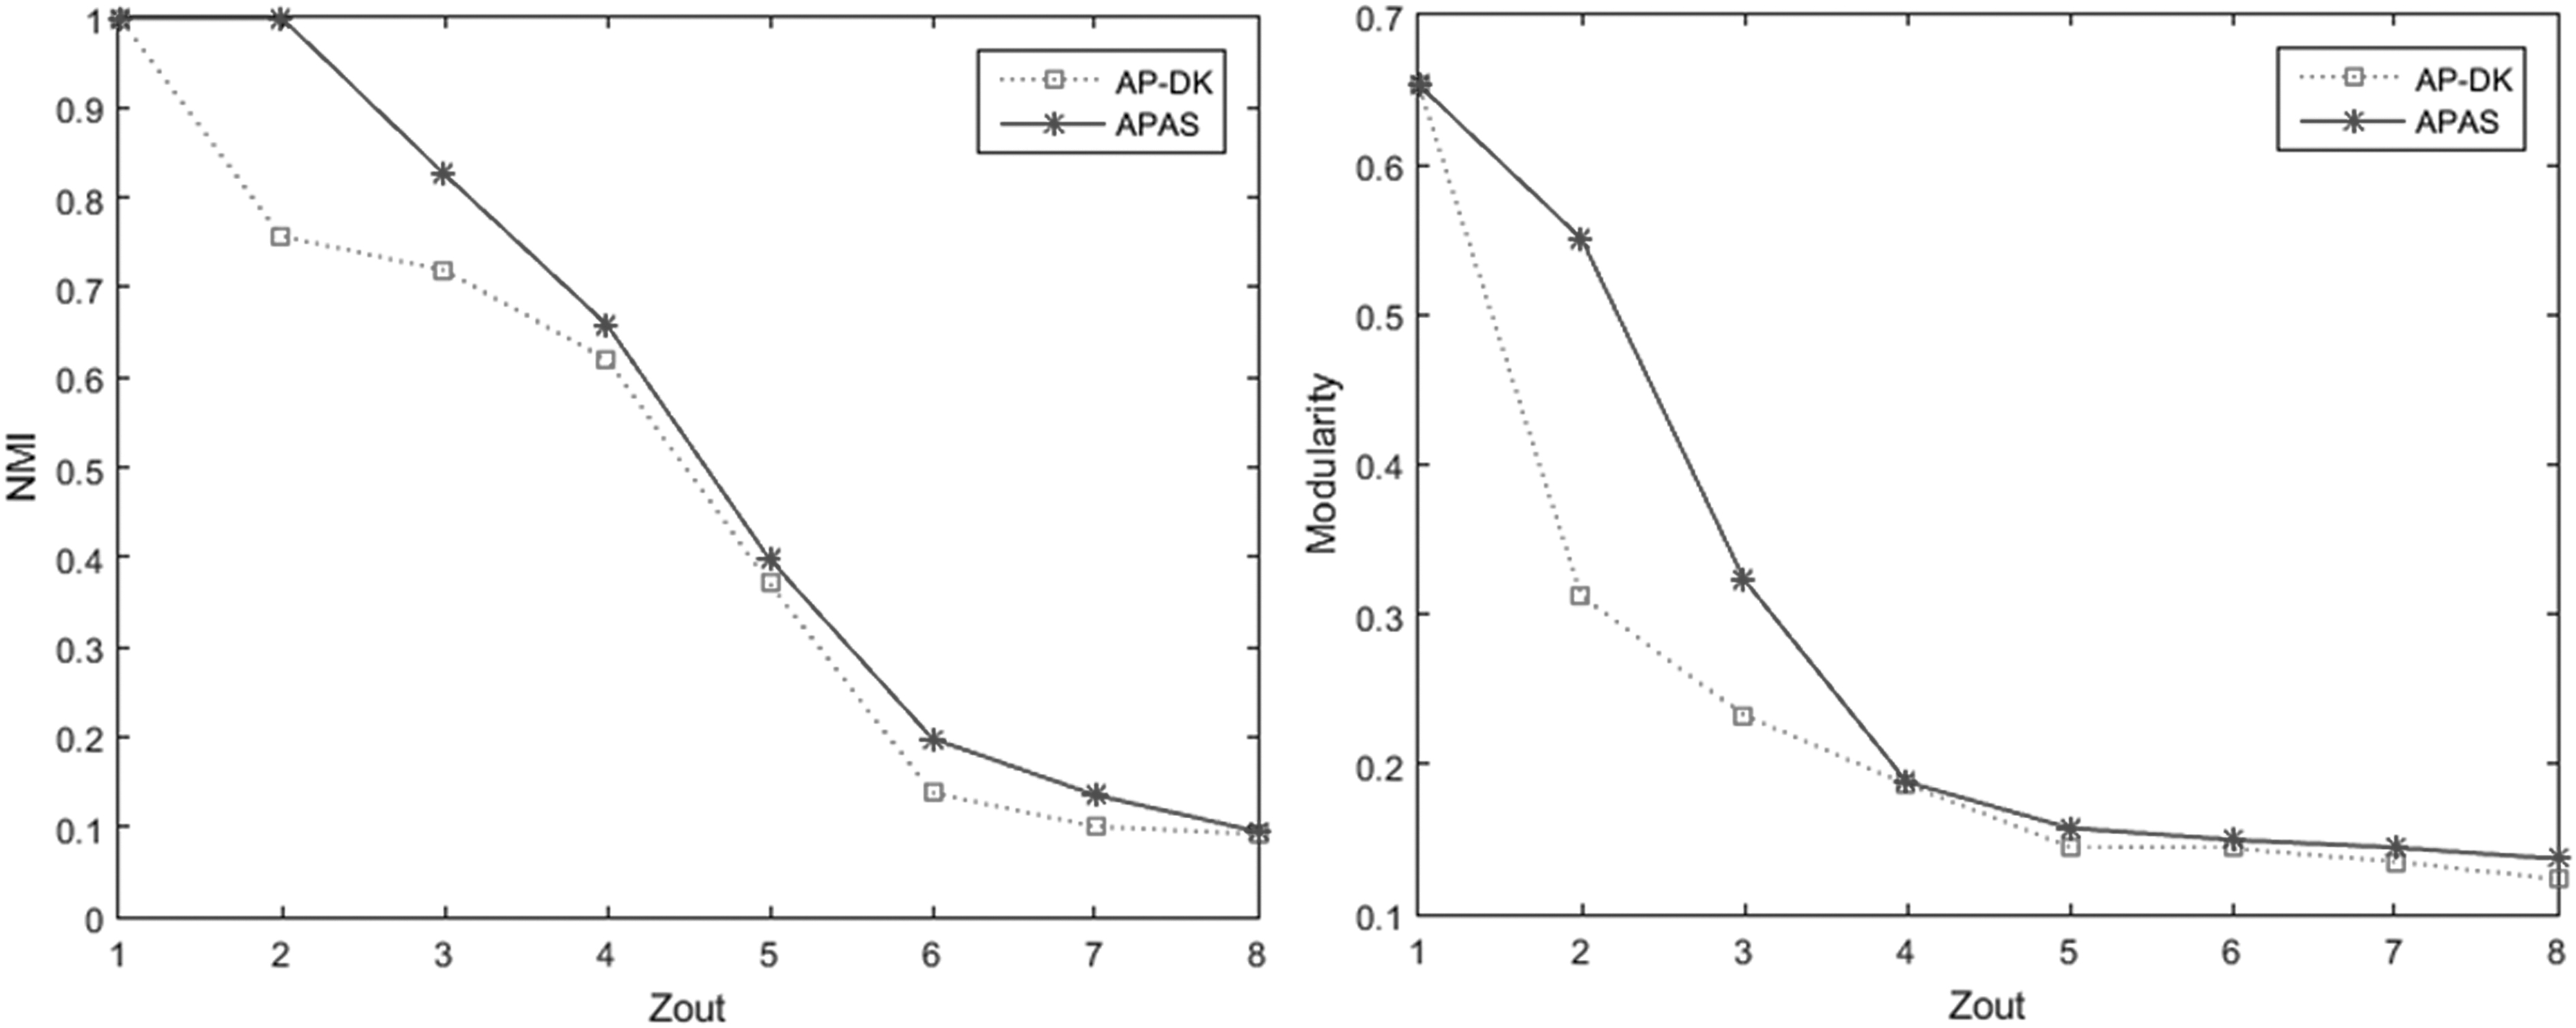
NMI and modularity values of AP-DK and APAS (DK) methods on GN networks using negative DK similarity matrix. AP, affinity propagation; APAS, affinity propagation with adaptive similarity; DK, diffusion kernel; GN, Girvan and Newman network; NMI, normalized mutual information.

NMI and modularity values of AP-RE and APAS (RE) methods on GN networks using negative RE similarity matrix. RE, regular equivalence.
As shown in Figures 1 and 2, APAS has a higher performance even when the community structure of the GN network is not clear. It outperforms AP-DK and AP-RE in terms of NMI and modularity when applying to GN benchmark networks. The second class of computer-generated networks proposed by Lancichinetti and Radicchi is “LFR” benchmark. 45 In these networks, the degree distribution and community size follow power law distribution. Changing Lancichinetti–Fortunato–Radicchi (LFR) benchmark parameters, one can build different networks with arbitrarily built-in cluster structures. Some of these parameters are the network size N, average degree of nodes k, maximum degree of nodes maxk, minimum community size minc, maximum community size maxc, and mixing parameter μ. Each node shares a fraction 1-μ of its edges with the nodes of its community and a fraction μ with the nodes of the other communities. Table 4 shows the parameters of the LFR networks used in this study.
Parameters of the Lancichinetti–Fortunato–Radicchi networks used in this study
Mixing parameter is varied from 0.1 to 0.9 to obtain networks with different community structures. Figures 3 and 4 show the results of the methods on the obtained LFR networks.
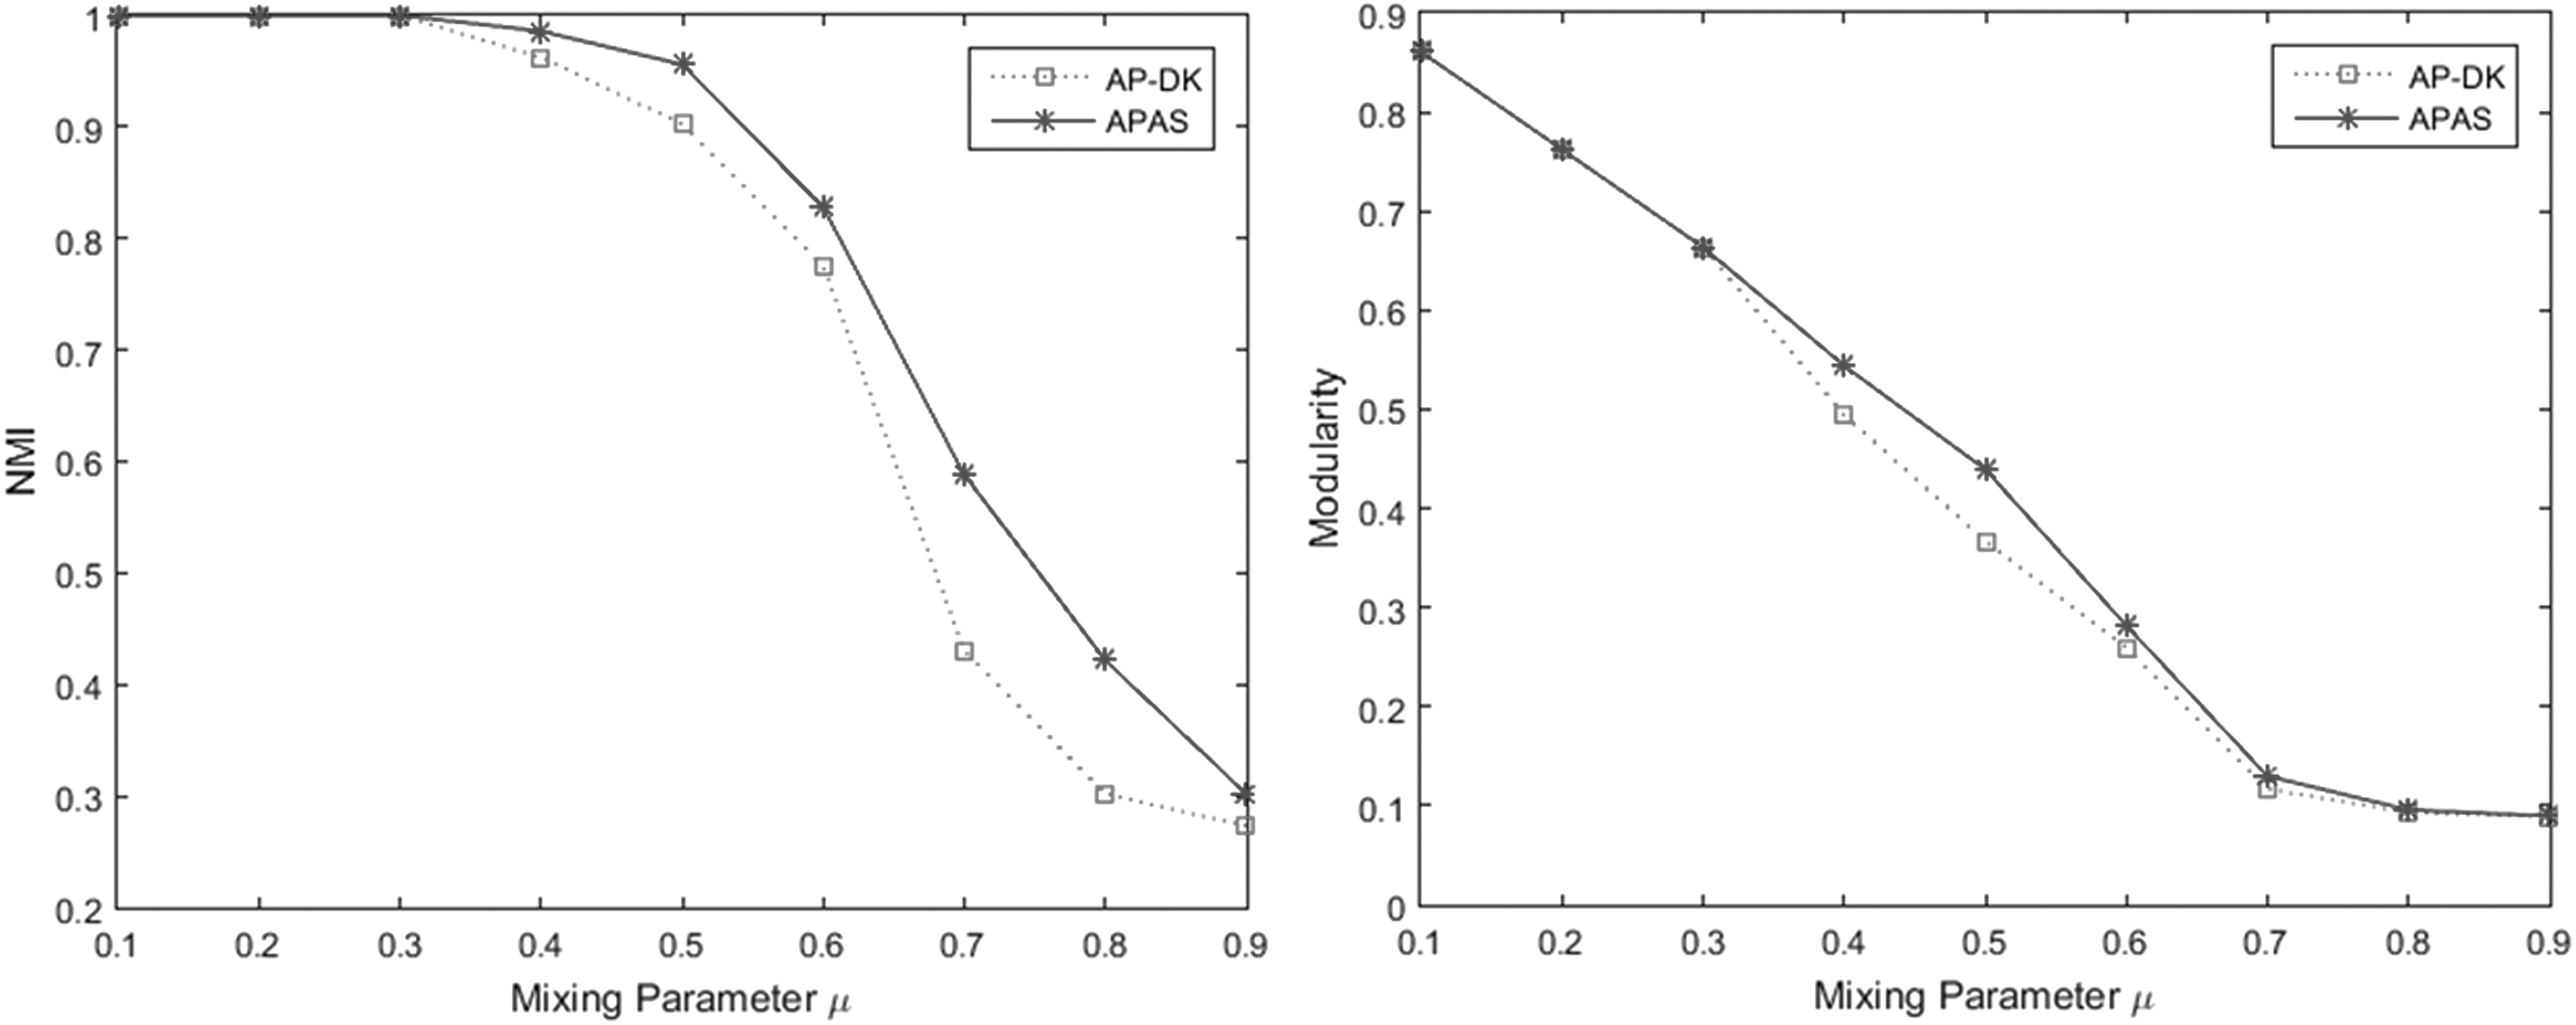
NMI and modularity values of AP-DK and APAS (DK) methods on LFR network using negative DK similarity matrix. LFR, Lancichinetti–Fortunato–Radicchi.
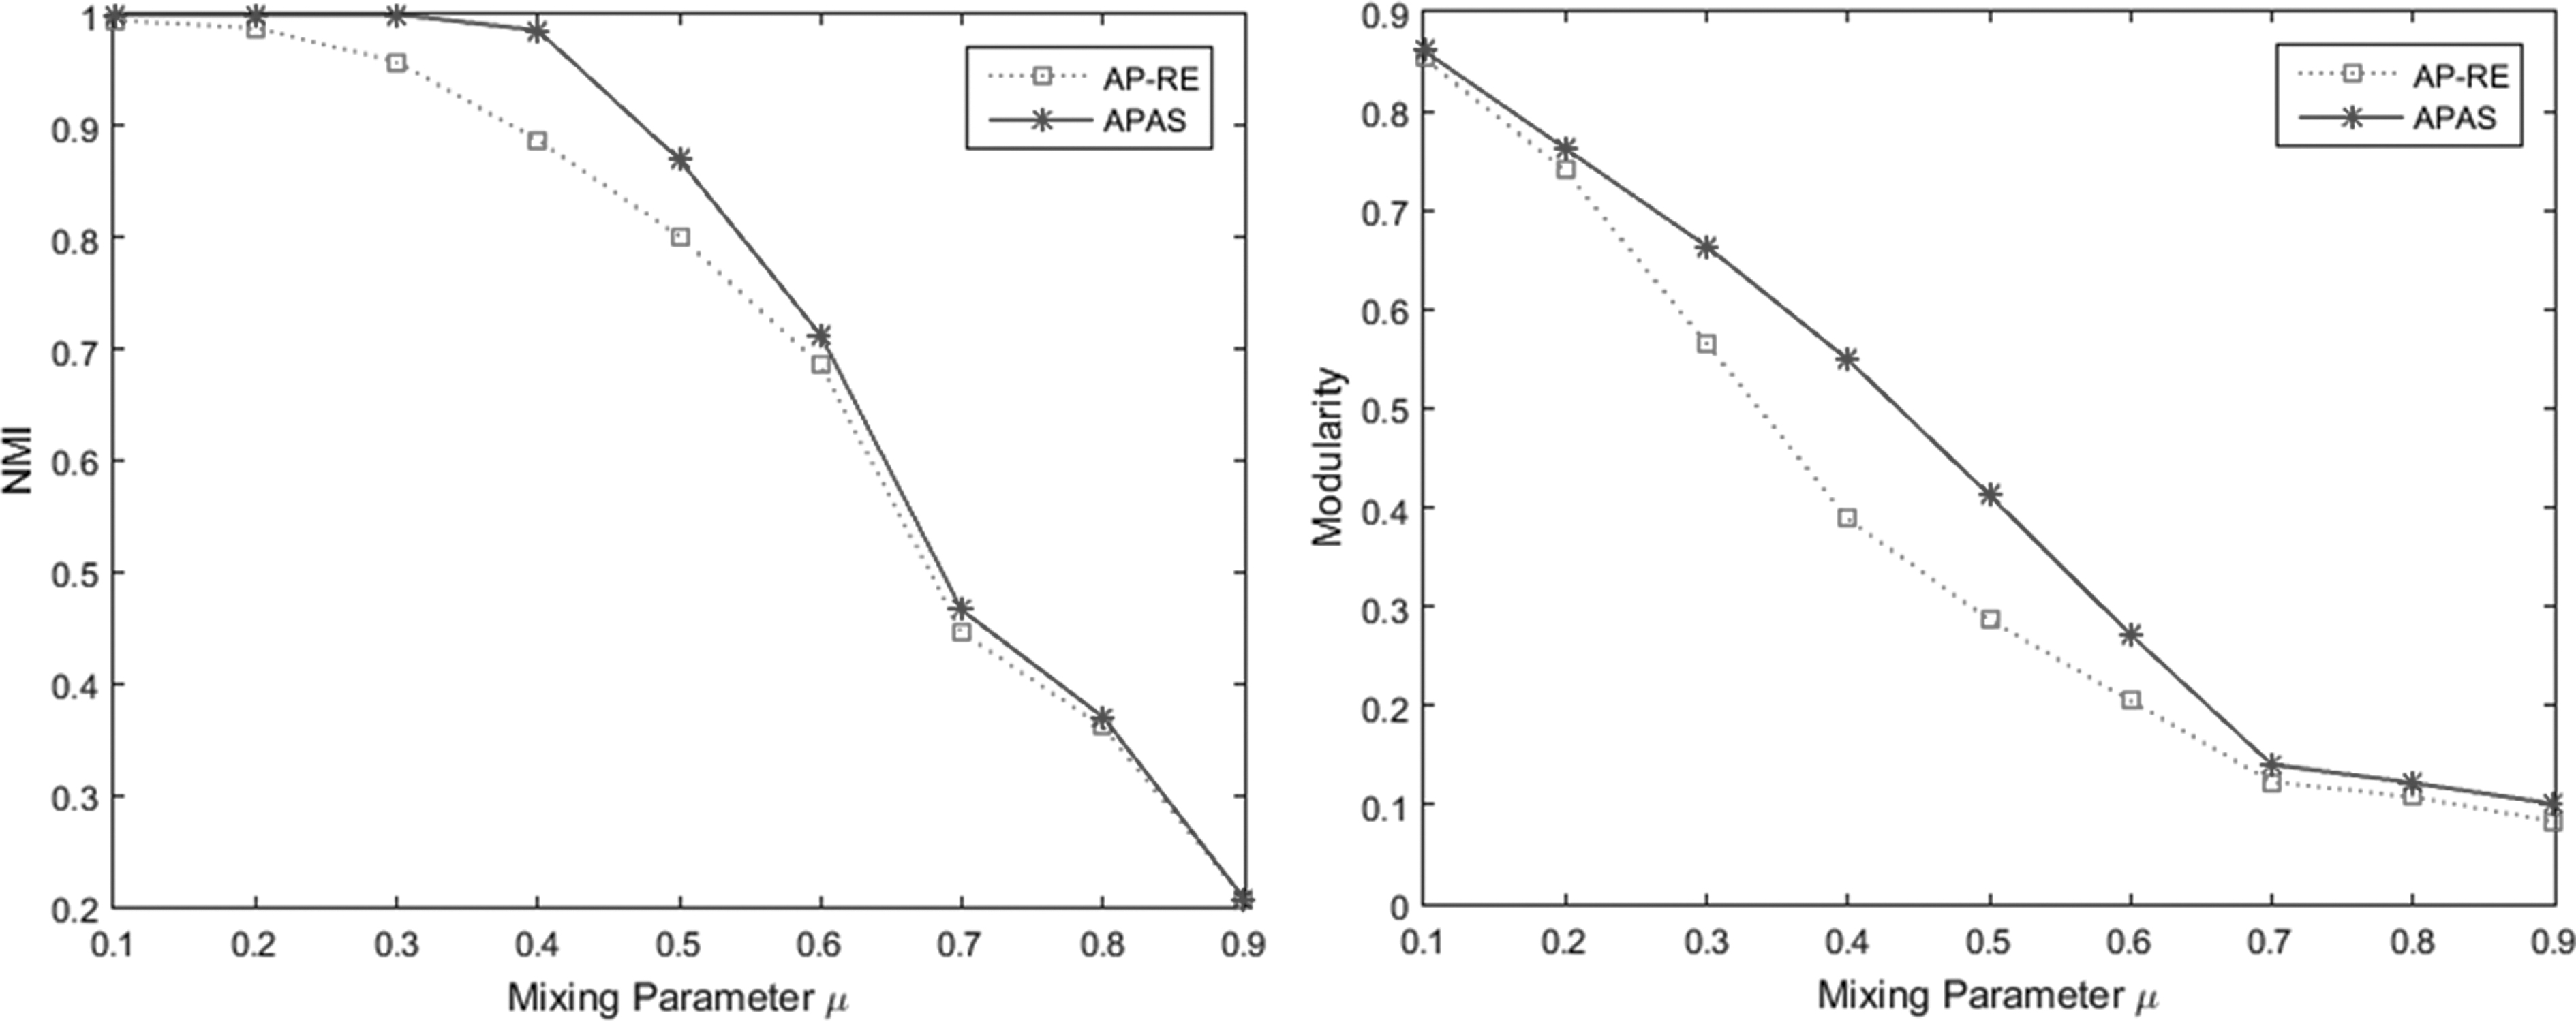
NMI and modularity values of AP-RE and APAS (RE) methods on LFR network using negative RE similarity matrix.
When the community structure of the LFR network is strong, APAS performs as accurately as the AP-DK method. As the community structure becomes weak (mixing parameters >0.3), both methods start to weaken, however, APAS manages to have better results than AP-DK. In Figure 4, negative RE similarity metric is used to measure the similarities between nodes of the LFR networks. APAS outperforms AP-RE both in weak and strong community structures.
Experimental results for modularity measure on real-world networks
In this section, the APAS method is compared with other state-of-the-art community detection algorithms on real-world data sets such as Zachary's Karate Club, 46 Dolphins, 47 U.S. political books, 48 Football, 49 E-mail, 50 NetScience, 51 Power grid, 52 Condmat-2005, 53 E-mail-Enron, 54 and pretty-good-privacy (PGP). 55 Table 5 shows the results of testing the modularity measure on eight real-world data sets. In this table, Q denotes the modularity value and Num shows the number of detected communities. According to the results, in the Karate, Dolphin, and Polbooks data sets, the highest modularity value belongs to Infomap. However, a higher modularity is not an advantage in many data sets such as Karate, Dolphin, Polbooks, and Football. To prove this, if we analyze the result in Tables 1 and 2, it is found that APAS has the best NMI value for Karate and Dolphins. Both APAS (RE) and APAS (DK) do not have any wrong detection in the Karate data set. In this case, the best modularity value is 0.371 for Karate (with two real communities) that belongs to APAS (RE) and APAS (DK). In addition, in the Dolphin data set, APAS (RE) has NMI value 1, and the second-best NMI value is obtained by APAS (DK). In Dolphin, our method has the best number of detected communities with the best real modularity value (Q = 0378). Other compared methods have weak performance in these data sets. In the Polbooks data set, APAS (RE) has the best performance with lower error and real modularity (Q = 0.495). In the Football data set, APAS (DK) has the highest modularity value and best NMI value. In Lesmis, E-mail, NetScience, and Power grid networks, APAS (DK) has the highest modularity among AP-based methods.
Results of modularity (Q) and the number of communities (n) obtained on algorithms on real-world data sets
Bold values indicate the best results in the table.
On the contrary, we have compared the proposed APAS method with other none AP-based methods on several real-world data sets in Table 6. It is obvious that the best measure for evaluating methods on ground-truth data sets is NMI. Although modularity is not an exact and reliable measure in most data sets, however, the only acceptable criterion for data sets without ground truth is the modularity criterion. The higher the modularity value the better the quality of detected communities. For example, the real modularity for Karate and Dolphin data sets, respectively, is 0.371 and 0.378 in case of 100% correct community detection (CN = 2). However, the modularity of other compared algorithms is higher than real values due to incorrect detections. In the Polbooks data set, Infomap with Q = 0.525 has the highest modularity value. However, the real modularity based on ground truth is Q = 0.4149 with CN = 3. However, APAS (RE) with best accuracy has a lower modularity than Infomap. Hence, it proves that modularity is not a suitable measure in Karate, Dolphin, and Polbooks data sets. In the Football data set, APAS (DK) method has the highest modularity (Q = 0.627) and also the best accuracy in this data set. Besides, APAS is also evaluated on several data sets without ground-truth based on modularity measure. APAS (DK) only has the highest modularity values on NetScience and Condmat-2005 data sets. APAS (RE) only has the best modularity in PGP data set. In most of these data sets, Louvain, CNM, and Infomap have higher modularity than other methods.
Comparing the results of modularity (Q) of affinity propagation with adaptive similarity with other none affinity propagation-based methods for some real-world networks with unknown communities
PGP, pretty-good-privacy.
Figure 5 shows the result of APAS (RE), AP-DK, AP-RE, LPA, Louvain, and Fast Newman algorithms on an LFR network with 1000 nodes. Negative DK is used as the similarity metric for APAS method. The figure shows the NMI values of six community detection algorithms. The value of μ is varied in the range of 0.1–0.9 to build networks with different levels of fuzziness of community structure. According to the obtained results, we can claim that the APAS method has considerably high performance in community detection of social networks.
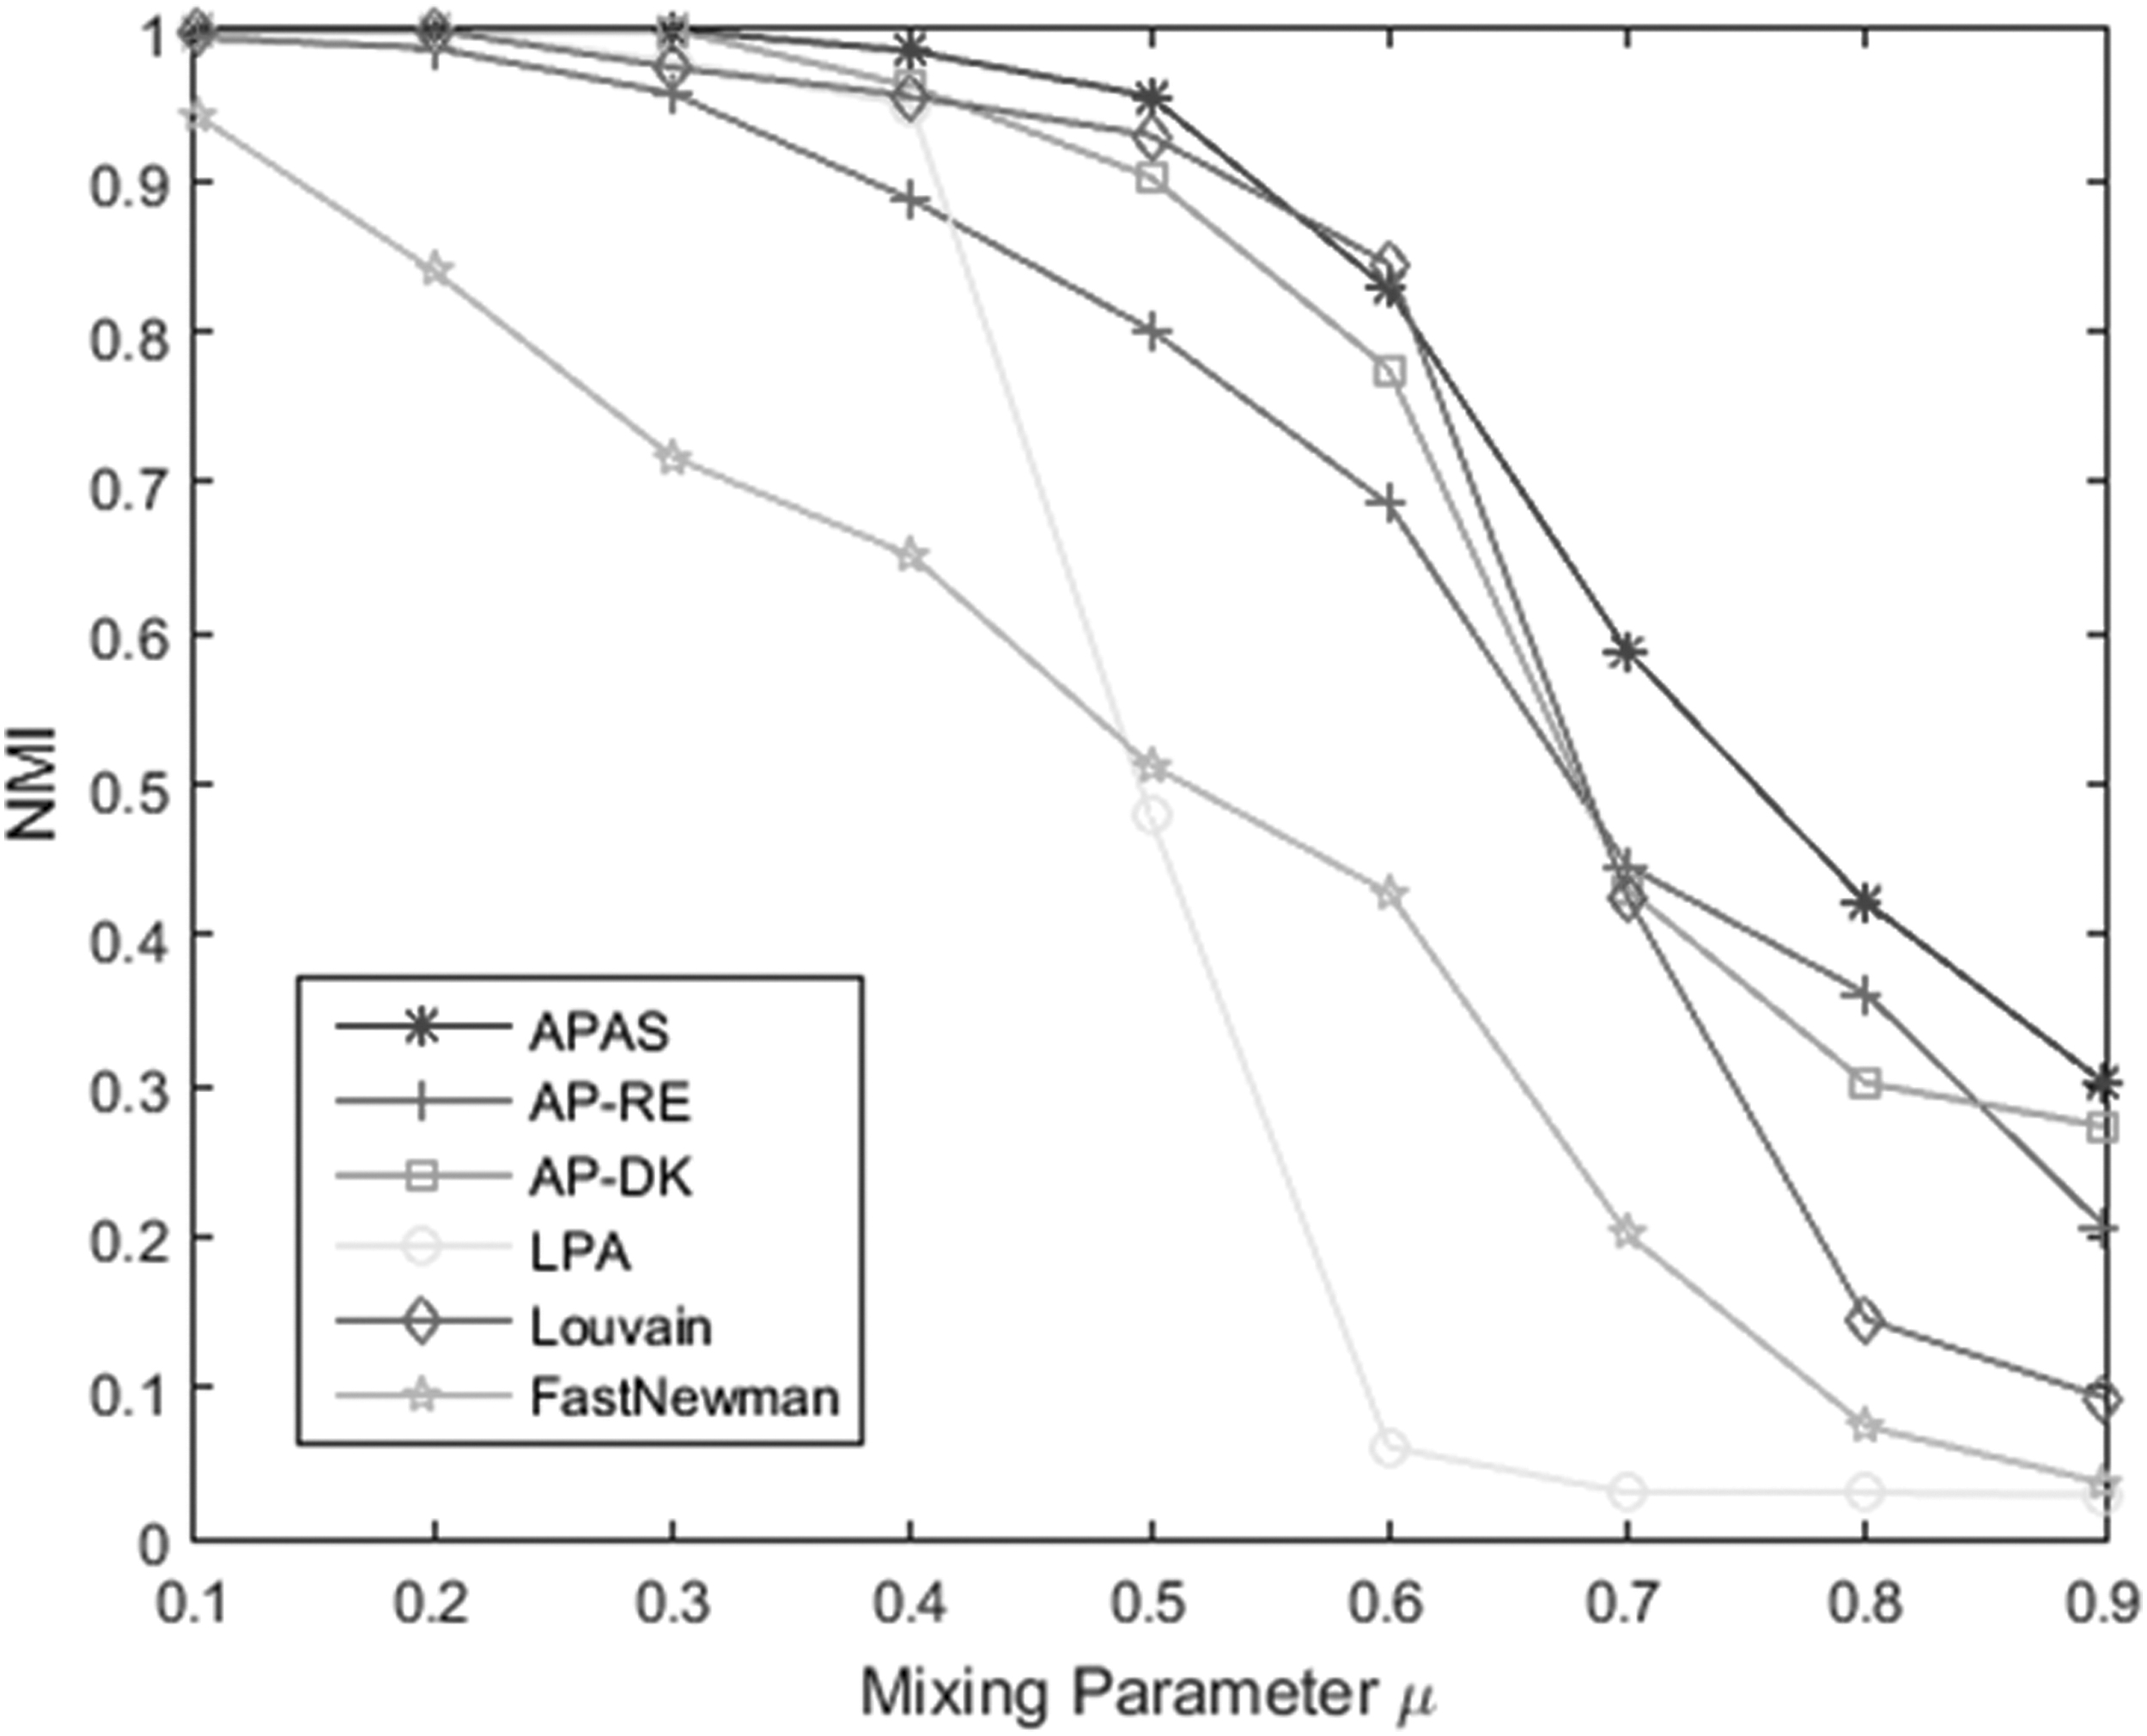
NMI values of APAS (RE), AP-RE, AP-DK, LPA, Louvain, and Fast Newman methods on an LFR network with 1000 nodes. LPA, label propagation algorithm.
Selecting similarity measures
APAS takes as input the pairwise similarities between data points. In this method, the obtained result strongly depends on the utilized similarity measure. Using an inappropriate measure can affect badly the outcome communities. Here, we have applied two efficient similarity measures named as “Diffusion Kernel” and “Regular Equivalence.” Figure 6 shows the result of APAS on an LFR network with 1000 nodes utilizing six different similarity measures: DK, RE, Cosine similarity, SimRank, shortest path-based similarity (10), and hamming distance similarity (10). Cosine similarity is a structural similarity measure based on the idea that two nodes in a social network are supposed to be similar if they have many neighbors in common. Denoting Ni as the neighbors of the node i, cosine similarity is defined as follows:
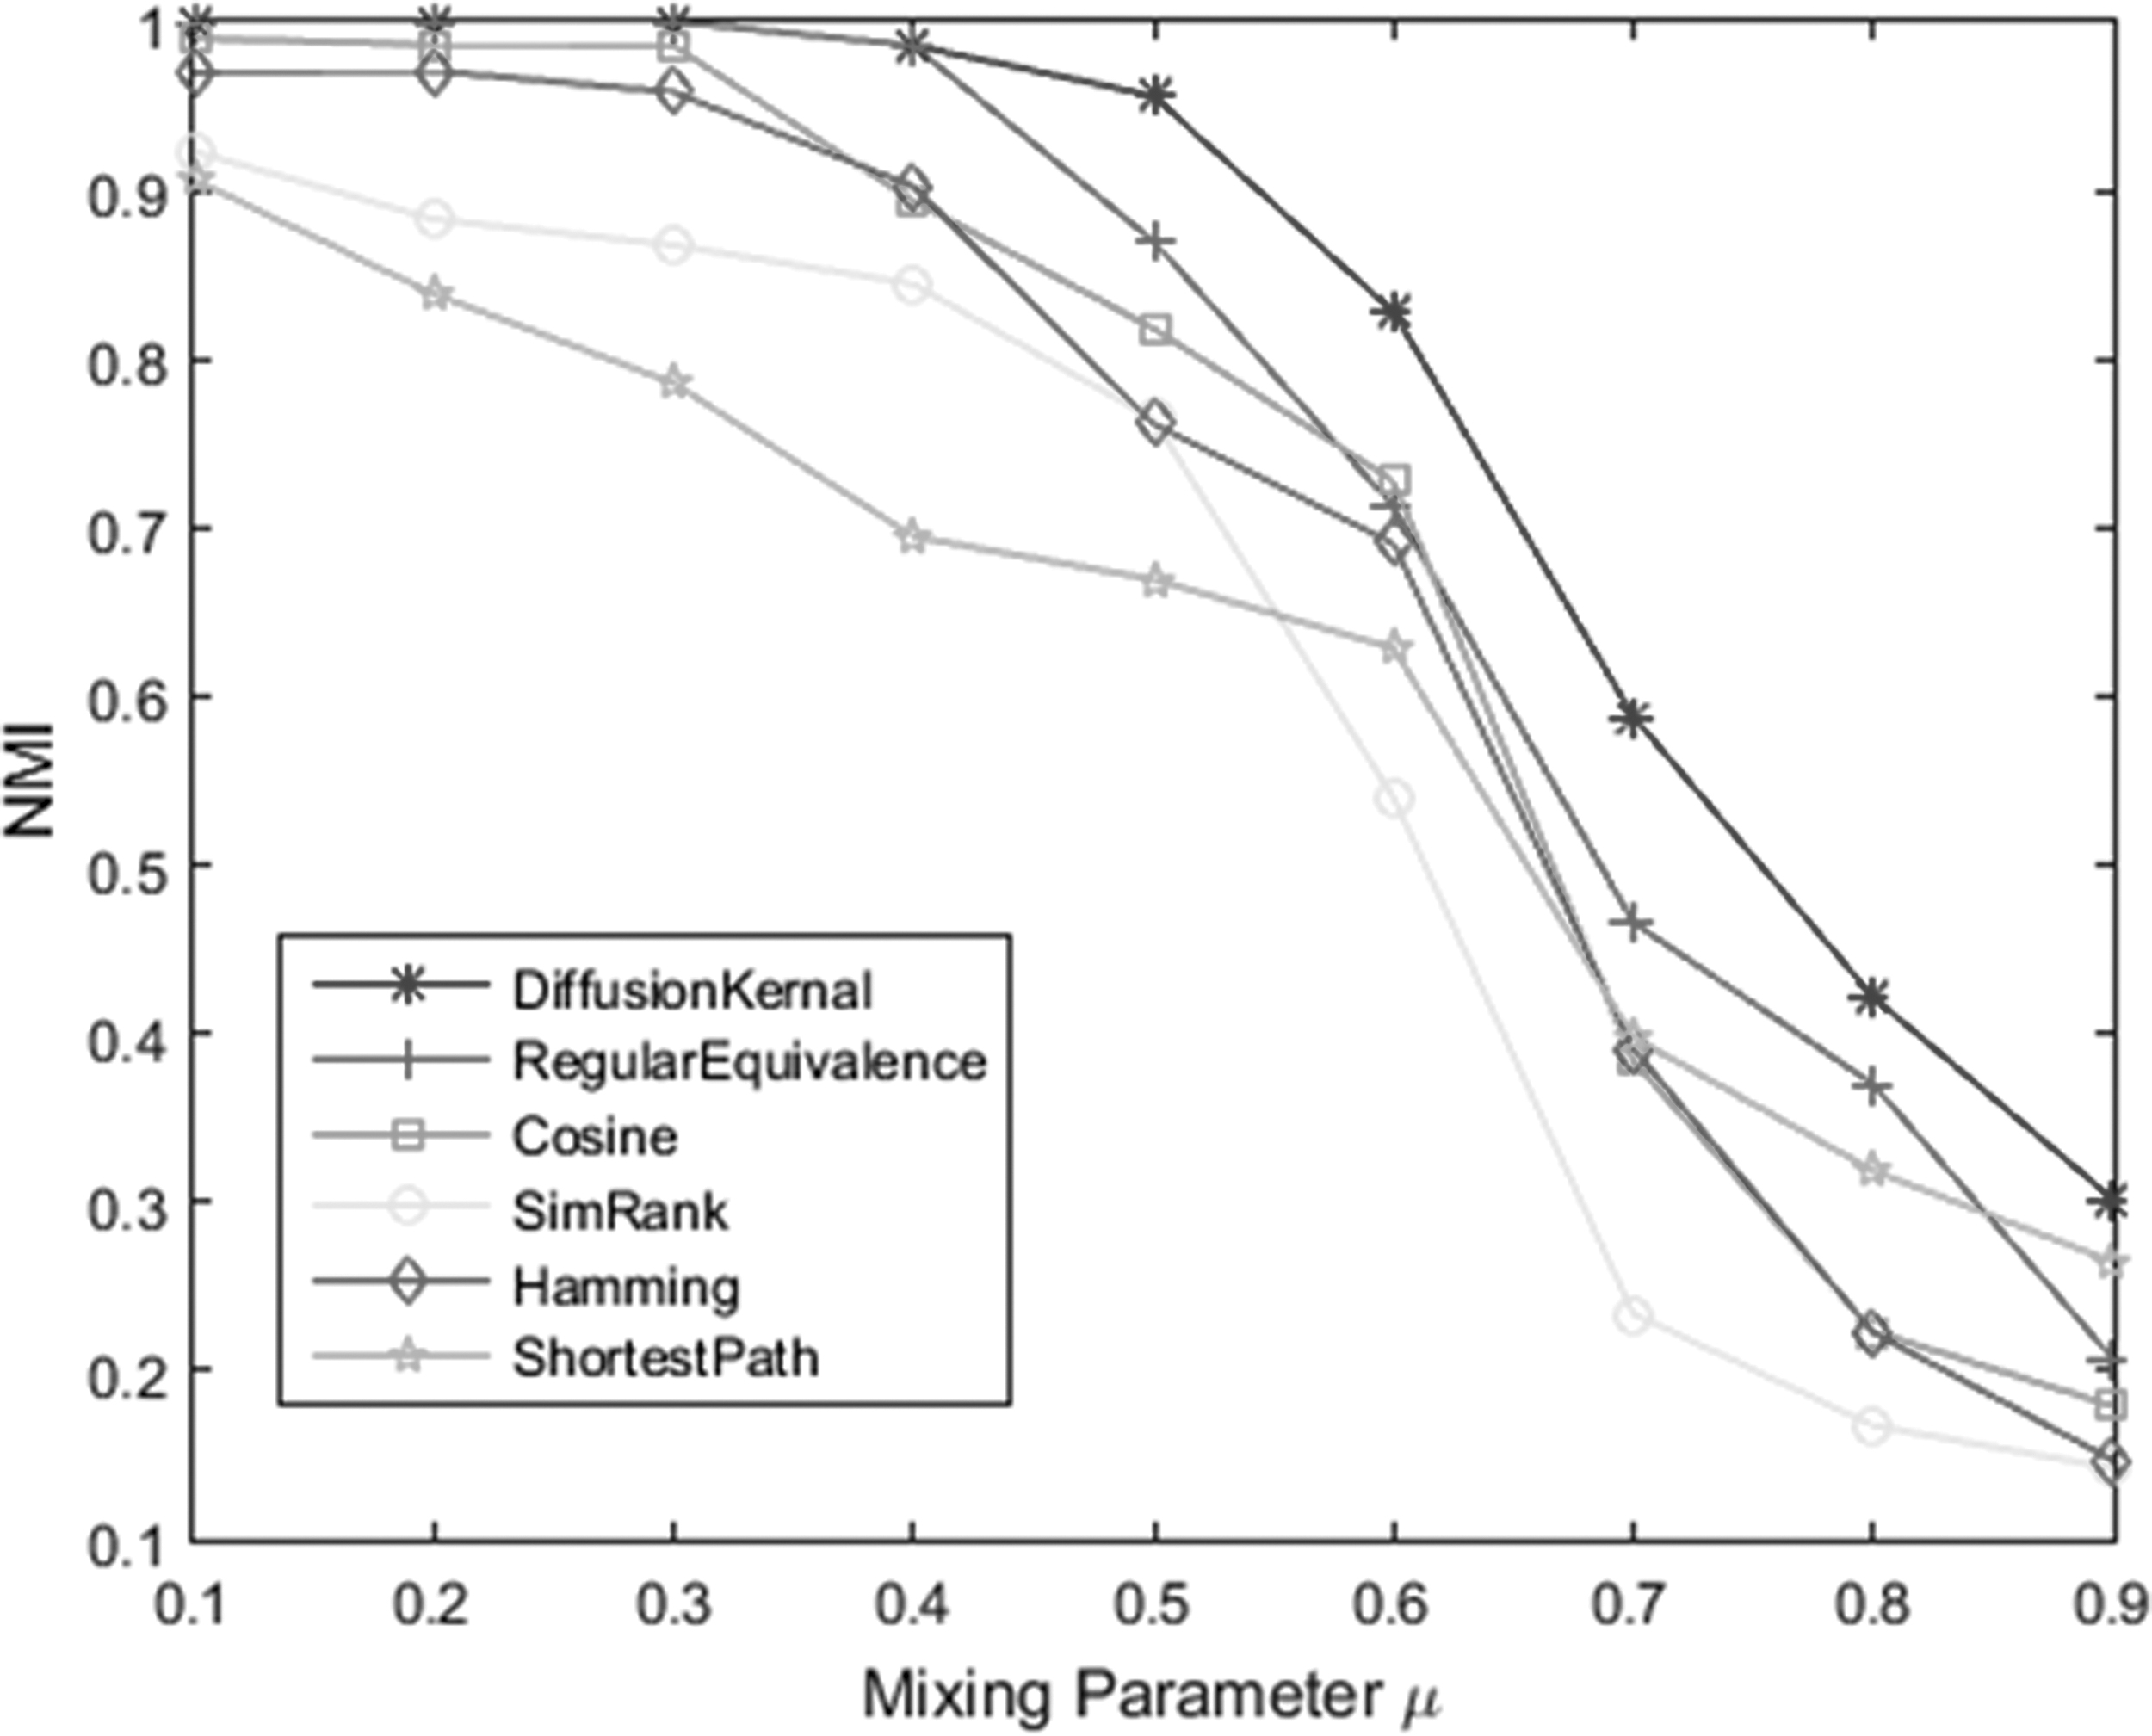
NMI values of the APAS method on an LFR network with 1000 nodes utilizing six different similarity measures.
SimRank is another useful similarity measure that says two nodes are similar if they connect to similar nodes. SimRank similarity Sim between two nodes a and b is defined as follows:
where C is a constant between 0 and 1.
Assuming the length of the shortest path between two nodes i and j as dij, the shortest path similarity is defined as follows:
Finally, hamming distance similarity is an adjacency matrix-based similarity defined as below:
where HamDis(Ai,Aj) is the hamming distance between vectors Ai (the ith row of the adjacency matrix A) and Aj, and dj is the degree of node j.
As we can see, DK and RE measures have the best performance when applying to the APAS method.
Conclusions
In this study, we proposed the APAS method, that is, a new approach of APAS matrix. APAS updates the similarity matrix using the information obtained in each iteration and achieves an asymmetric similarity matrix with the elements indicating the leadership probability of one node over another. This enables APAS to get more accurate clustering results compared with the original AP method. To evaluate the performance of APAS, we applied our proposed method to eight popular real-world networks and two classes of computer-generated networks. The experimental results demonstrate that APAS can effectively detect the community structure of networks. However, there exist some limitations and weaknesses inherited from the AP method. The main weakness of the APAS method is the problem of high time and space complexity when dealing with large social networks. Several scholars have been proposed to solve this problem.14,18,19 These proposed solutions could be applied to APAS to make it an efficient community detection method in very large networks. Furthermore, along with the AP method, APAS also strongly depends on the utilized similarity measure. Using an inappropriate measure can badly affect the outcome communities. Selecting the best values for the preferences is another challenge in AP. Preferences influence the final number of communities. It is hard to know which values of preferences would give the most optimal communities. In this study, the preferences are set to a common value of median of the whole similarity matrix. Numerical oscillations are the last limitations of the AP method. They may occur when the exchanged messages are getting optimized. These oscillations prevent the algorithm from converging. AP cannot automatically eliminate the oscillations. One solution is to increase the damping factor manually and run AP until the algorithm converges. The other choice is to use a big damping factor close to 1. In this study, we have set the damping factor λ to 0.9 and the value is increased by 0.01 whenever oscillations occur.
Footnotes
Author Disclosure Statement
No competing financial interests exist.
Funding Information
This research did not receive any specific grant from funding agencies in the public, commercial, or not-for-profit sectors.