
Abstract
Recommending a retail business given a particular location of interest is nontrivial. Such a recommendation process requires careful study of demographics, trade area characteristics, sales performance, traffic, and environmental features. It is not only human effort taxing but often introduces inconsistency due to subjectivity in expert opinions. The process becomes more challenging when no sales data can be used to make a recommendation. As an attempt to overcome the challenges, this study used the machine learning approach that utilizes similarity measures to perform the recommendation. However, two challenges required careful attention when using the machine learning approach: (1) how to prepare a feature set that can commonly represent different types of retail business and (2) which similarity measure approach produces optimal recommendation accuracy? The data sets used in this study consist of points of interest, population, property, job type, and education level. Empirical studies were conducted to investigate (1) the overall accuracy of proposed similarity measure approaches to the retail business recommendation, and (2) whether the proposed approaches have a bias toward certain retail categories. In summary, the findings suggested that the proposed similarity-based techniques elicited an accuracy of above 70% and demonstrated higher accuracy when the recommendation was made within a set of similar retail businesses.
Introduction
Geospatial analytics has widely been used to address site selection challenges in retail businesses,1–13 mainly for the following reasons: (1) to determine the next site for business expansion, (2) to estimate the monthly sales, (3) to investigate the coexistence between two or more business types, and (4) to reallocate existing nonprofitable retail outlets. A good retail site has always been the key to a store's success because it attracts consumers by offering them easy accessibility to products or services, which significantly influences market share and profitability.3,14–16 To optimize business site selection outcomes, location theorists have proposed three methods, namely analogue, regression, and gravity. 17 In addition to the theoretical approaches, retailers have also applied the Geographic Information System (GIS) that provides a visual way to analyze different sources of data on a map. To ease the process of site selection, researchers have also attempted the Analytic Hierarchy Process that integrates human knowledge into automatic decision-making.5,14,18–22 The above literature has shown that the existing works on retail site selection would either require active intervention from human experts or the existence of sales data, before a recommendation could be made.
While site selection for retail business is itself a difficult problem, recommending the right retail business given a location presents a greater challenge. The challenge stemmed largely because there is no formula on how to determine a retail business given any location. Besides, it is a challenge to acquire sales data for every retail business because of privacy and confidential issue. The sales data, however, is an important criterion to infer the suitability of a retail business at that particular location. Without sales data, no inference process could be performed and all other estimation methods could resort to unmanageable risk. In this light, this study proposed an approach where recommendation of retail business does not require sales data of any retail business. That is, the suitability of retail business at a particular location can be perceived as a function of location characteristics, including the demographic information, retail businesses, traffic flow, and road characteristics (e.g., facing main road junctions). In this study, the research work had the following two main objectives:
To construct an analytics data set from different raw data sets suitable for recommending retail businesses. To propose algorithms for retail business recommendation through the computation of similarity scores between locations.
In this research work, three fundamental assumptions formed the basis for analytics work discussed in the Proposed Methods for Retail Recommendation section.
The next section discusses the techniques proposed in this research work to address the challenges, taking the above assumptions as a basis for predictive modeling work. The discussion begins with the preparation of analytics data set and subsequently with identifying the appropriate similarity measures for similarity scoring purpose. In this research work, the design and development of retail recommendation system rely on similarity measures. Therefore, before the detailed design of the entire recommendation system is discussed in the Proposed Methods for Retail Recommendation section, the next section provides an overview of different similarity measure techniques commonly applied by researchers.
Similarity and Distance Measures
There are a variety of studies comparing similarity measure techniques in different domains and knowledge areas. The main objective of the similarity measures is to determine the likeness or dissimilarity in a given set of objects (items). For continuous data, Shirkhorshidi et al. 23 conducted a comparison study to investigate the characteristics of low- and high-dimensional data for different similarity or distance measures. They compared and benchmarked 15 publicly available data sets with 12 distance measures such as Euclidean distance, average distance, chord distance, cosine measure, Mahalanobis distance, Manhattan distance, mean character difference, index of association, Canberra metric, Czekanowski coefficient, coefficient if divergence, and Pearson coefficient. The research gave an overall conclusion that the average distance is the most accurate and fastest distance measures among all the clustering algorithms. On the contrary, for categorical data, Boriah et al. 24 carried out a comparison study on similarity measures and reviewed, compared, and benchmarked the categorical data based on binary-based similarity measures. For a specific knowledge area, for instance, genetic interaction data sets, Deshpande et al. 25 concluded that the dot product is consistent among the best measures in different circumstances. In another research, Kanza et al. 26 discussed four traditional distance measures, namely, Hausdorff distance, center of mass distance, link distance/Earth Mover's distance, and nearest-neighbor distance, and proposed two novel distance measures, that is, mutually nearest distance and quad-tree distance to detect the geosocial similarity based on the locations of the users' online activities. The study showed the two novel distance measures were outperforming than the existing distance measure.
Similarity measure techniques were investigated to tackle the challenges and assumptions in this research work. In this work, only four widely used distance measure methods were considered, namely Euclidean Distance, Manhattan Distance, Hamming Distance, and Gower Distance.
Euclidean distance
The distance,
Euclidean is a special case of the Minkowski distance.27,28 Euclidean distance performs well when deployed to data sets that include compact or isolated clusters. This method can only be applied to numeric data. Therefore in this work, only sales data was fed into this equation.
Manhattan distance
The distance is calculated as the absolute value of the sum of differences between the two observations. Unlike Euclidean, Manhattan only considers the horizontal and vertical distances. Manhattan Distance is also known as city block distance or taxicab metric.
Jaccard distance
Such distance measure method has been widely used to calculate the distance between categorical variables. A contingency table is created to calculate the number of mismatches among the observations.
Gower distance
When the measurements are mixed (numeric, categorical) variables, the similarity coefficient suggested by Gower can be applied. It computes the distance between the observations weighted by its variable type before taking the mean of the variables. The scaling of each variable to a [0,1] is performed.
where
For continuous variables:
For binary variables:
When variables are binary,
Analytical Data Set Construction
This section discusses the proposed solution to tackle the first challenge in this research work: “How to construct an analytics data set for retail businesses suitable for similarity and distance measures?” It first discusses the structures and components of five raw data sets used in this study. Subsequently, it highlights the data aggregation and transformation process needed to form an analytics data set, a requirement for use of different similarity measure techniques.
Raw data set
Table 1 presents the five data sets and the corresponding variables used in this study. Let
Feature list in each data set
The second data set is the Malaysian population data set (
The third data set,
The fifth data set,
In this study, all five data sets are linked together via
Extracting surrounding location features
Before any recommendation of a retail business can be performed, the retail business recommender requires several inputs for data preprocessing. The first input is that given a retail business, a list of surrounding businesses within a certain distance (e.g., 100 m) must be supplied. Algorithm 1 shows the steps in extracting surrounding retail business given a list of retail businesses of interest. For simplicity in explanation, three retail business of interest (i.e., A, B, and C) serve as the input to Algorithm 1. The output of the algorithm is the three-most frequently found surrounding retail businesses corresponding to the retail businesses of interest. A feature set, F, can be defined as a list of surrounding retail businesses given that particular retail of interest at a certain location.
To further elaborate the purpose of Algorithm 1, for instance, in Figure 1, all retail businesses within 100 m radius from business A will be extracted. If business A has outlets at other locations, then the surrounding retail businesses for all other outlets will also be extracted and stored as FA. Subsequently, the frequency of each feature stored in FA is calculated and only the top 15 features are considered important and stored as
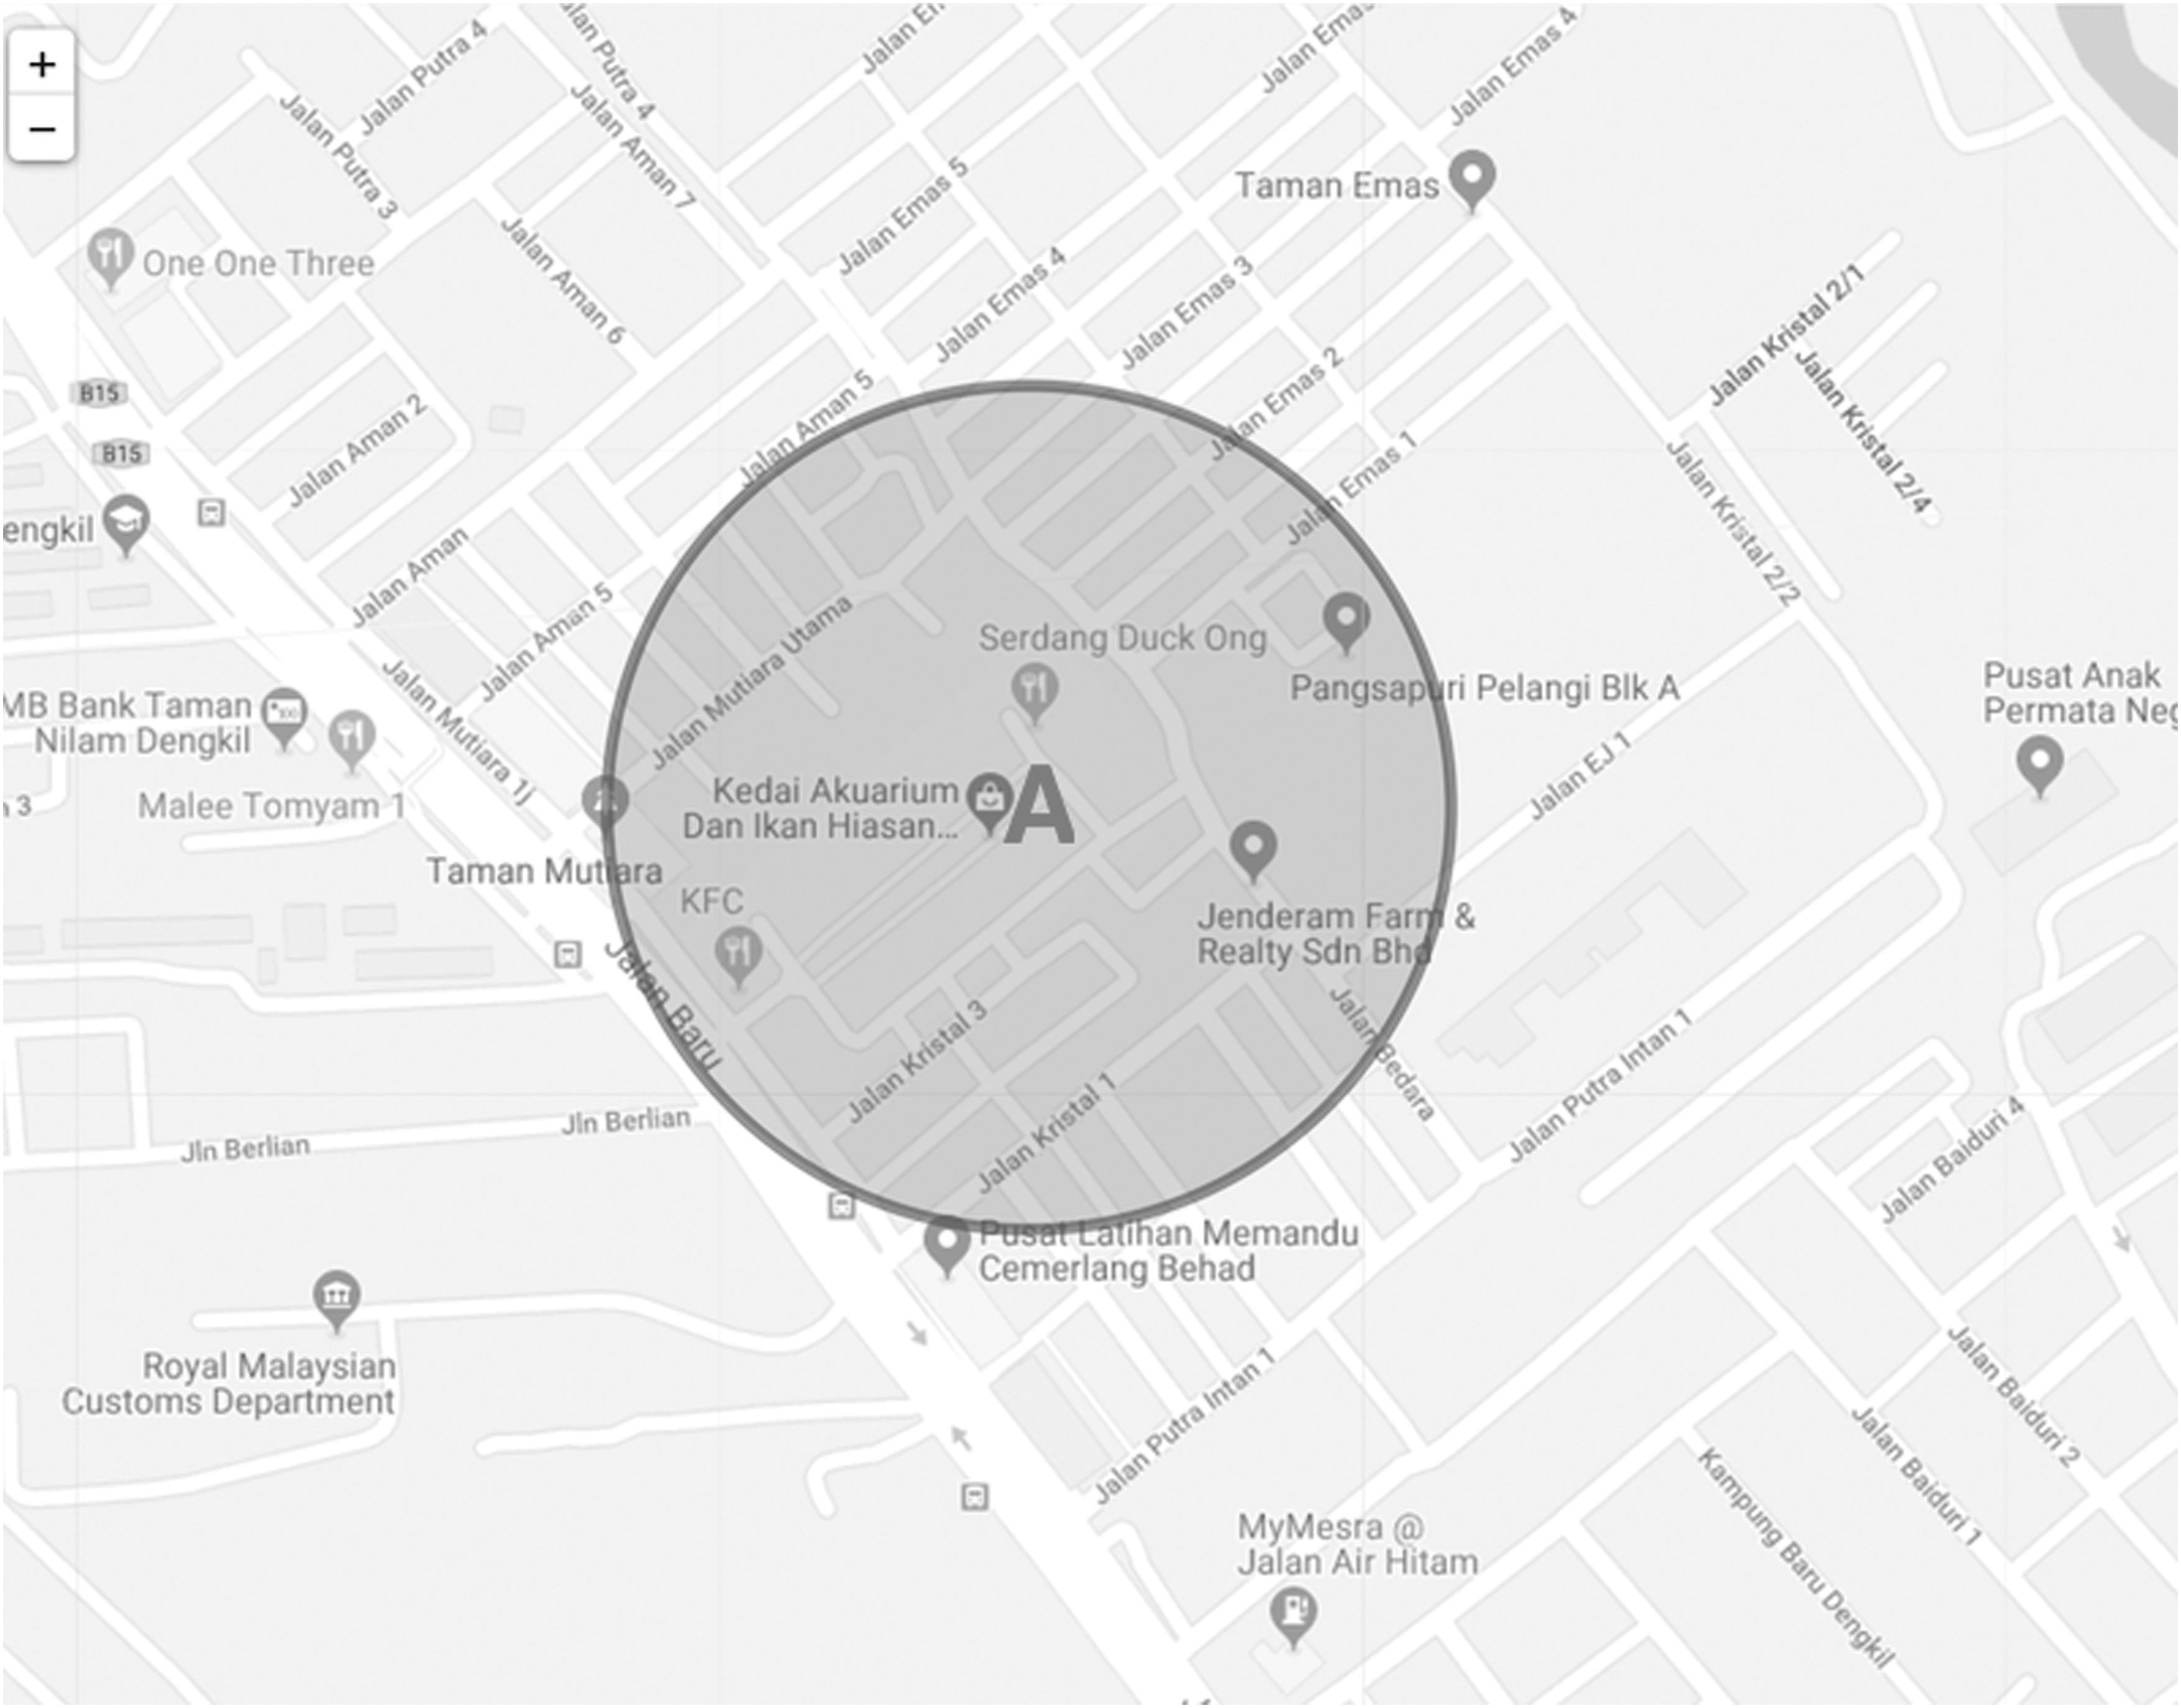
Sample location profile extraction.
Transforming raw to analytics data set
The raw data set obtained in the previous section cannot be used directly. It was transformed into an analytics data set before subsequent analytics tasks can be performed. To be specific, the feature sets (i.e.,
The next process is to construct a matrix,
Sample analytics data set
Proposed Methods for Retail Recommendation
In this section, three proposed methods for retail location matching are discussed. Given any new location, the first method (Algorithm 3) scans through all the geospatial features of the three retail businesses of interest (i.e., A, B, C) and determines the retail business that exhibits the highest geospatial similarity with that new location. The second method (Algorithm 4), however, gets the average geospatial similarity index for each retail business. The matched retail business is the one with the highest average similarity index. The third method (Algorithm 5) uses cluster centers to perform the calculation of similarity index. Each retail business is a cluster, and it has two cluster centers. The highest similarity index can be determined by the smallest mean distance between the location of interest and the cluster centers. The retail from which the smallest distance is obtained will be the optimal retail business for that new location.
Let
The second proposed method in this study to retail recommendation,
The design of
Evaluation approach
In this study, the proposed three approaches for retail recommendation were validated by randomly selecting three retail businesses from three different retail categories (Table 3). The three categories are Beverage, Food and Beverage, and Food. As shown in Table 4, there were nine experiments conducted with overlapping retail categories. The purpose was to assess the performance of proposed algorithms in handling different similar categories of retails.
Retail stores' count
Categories and retails
In the evaluation phase, 10 sets of experiment with 80%–20% split of
nmatched denotes the matched prediction between the predicted retail and actual retail from the testing data set.
Results and Discussion
In this study, a total of nine experiments were conducted to investigate the performances of proposed methods for retail recommendation. Three retail businesses selected for each experiment are shown in Table 4. The three businesses can comprise the same business type or different types (Table 5). This study had focused on three different business type combinations, namely, Beverages only, Food only, and Food and Beverage. The three proposed methods were assessed in each set of experiment.
Experimental results for retail recommendation
Table 5 shows the mean accuracy of the different proposed methods used. For the Beverages category, the highest mean accuracy of 67.72% was obtained through
In this study, further statistical analysis was conducted to investigate the performance of proposed distance measure methods. t-Test was conducted to study whether performance of distance measure methods could be affected by business category. The t-test result showed that t = −3.0612, df = 13.579, p = 0.008716; the null hypothesis that stated the true difference in means equals 0, rejected at α = 0.05, thus suggesting that there was a significant difference in mean accuracy among the business categories. That is, the proposed distance measure methods performed better within the same business category (i.e., Beverages = 75.65% and Food = 74.78%) as opposed to a mixture of business categories (i.e., Food and Beverages = 61.65%).
In addition, one-way ANOVA (analysis of variance) was conducted to investigate the differences between the business categories. In ANOVA test, p = 0.0129, there is a significant difference in the three business categories (Table 6). Moreover, Tukey's honest significant difference was performed to investigate the pairwise comparison between the means of the categories (Table 7). With α = 0.05, in conjunction with the adjusted p-value, there was a significant difference between the group of Beverage and Food compared with the Beverages group or Food group alone. However, there was no significant difference between the Food category and the Beverages group. The mean accuracy of Beverages (75.7%) is the highest, and the mean accuracy of Food (73.9%) is higher than the combination of Beverage and Food (61.6%). The mean accuracy obtained by the same category of businesses was above 70%, while the mean accuracy obtained by the different business categories was slightly exceeding 60%.
Analysis of variance results for category
5% significance (0.01≤ p < 0.05)
Tukey multiple comparisons of means
In this study, ANOVA was also used to investigate the difference between the three proposed methods. It was observed that p-value was 0.422, concluding that null hypothesis was not rejected at α = 0.05 (Table 8). Such finding concluded that no significant difference existed between the methods used.
Analysis of variance results for method used
Conclusion
Recommending a suitable retail business based on a location is not a trivial task. Not only that, there are many different layers with a large amount of variables to be considered, but more challenging is the absence of sales data, a crucial reference when site selecting. 29 However, getting the sales data for retail businesses is not possible due to private and confidentiality issues. These challenges often resort to relying on human knowledge and experiences in retail business recommendation. Some would use the GIS to extract insights and patterns about the profiles of a location. GIS, however, has its limitations when there exist too many layers. The visual representation and inspection can be very taxing and misleading when there are several overlapping layers. More importantly, the GIS approach to represent geospatial information is taxing in defining important variables from each layer needed for retail business recommendation. In this light, the work presented in this article attempted the challenge in retail recommendation, particularly in the absent of sales data.
There are two main contributions in this research work. The first contribution discusses how different data sets can be structured to form an analytics data set suitable for retail business recommendation. The second contribution centers around using a similarity measure method for recommending the most appropriate retail business. There were nine sets of experiment conducted on three proposed methods. The findings suggested that the third proposed similarity measure method (
While the findings discussed in this study have shown the positive impact of leveraging machine learning approach to retail recommendation, there are still some limitations. First, the current work applies only on the recommendation for retail outlets at landed trade areas. No recommendation can be performed within shopping malls with multiple storeys. Second, the recommendation engine does not apply to a closed specialized compound such as within an academic institution or a school. This is because most academic institutions have regulations on the selection of retail outlets. Third, the recommendation system does not apply on new residential areas. That is, no recommendation can be made where there is too little population and very few adjacent retail outlets. This is because currently the recommendation system requires adjacent retails for correlation analysis.
Footnotes
Author Disclosure Statement
No competing financial interests exist.
Funding Information
No funding was received.