
Abstract
Limit order books (LOBs) have been widely adopted as a trading mechanism in global securities markets, and the degree of LOB transparency is one of the most studied topics in market design. In the past, this issue was mainly researched through the comparison of LOB transparency in a market before and after a policy change, although such instances were rare and occurred decades ago. This article analyzes the importance of broker identities (IDs) in the LOB with respect to price movement predictability by proposing a different approach. By analyzing raw LOB data, an enormous dataset of selected Hong Kong stocks is divided into two parts, namely the prices and order volumes (anonymous LOBs), and a list of broker IDs in the bid and ask queues. A deep learning model is then employed to predict the mid-price movement after 20 ticks. Our result indicates that the best F1 scores of the anonymous LOB and broker ID models are fairly high, ranging from 57.63% to 68.70% and from 53.70% to 59.39%, respectively. When comparing the performance of both datasets, surprisingly, the overall F1 prediction performance based solely on the broker ID dataset can reach, on average, 85.13% that of the anonymous LOB dataset. The contributions of this study are twofold. First, a machine learning-based tool for finance researchers is proposed to quantitatively measure the price predictability of LOB features, and the results of the impact of LOB transparency on traders' profitability are novel as this study is empirical. Second, the empirical result strongly suggests that the broker ID queues in the LOB consist of significant information content for price prediction, and thus, the study provides insights for regulators to determine the appropriate degree of LOB transparency to guarantee a fair market for all investors.
Introduction
Limit order books (LOBs) enable a centralized, order-driven trading mechanism, and they have been widely adopted in global securities markets. A limit order is an order to buy or sell a security at a specified price, and LOBs are records of outstanding limit orders maintained by the stock exchange. The degree of LOB transparency greatly affects market efficiency and is one of the most studied topics in market design. Paddrik et al. 1 classified the degree of LOB information disclosure into six levels. Specifically, levels 1 and 2 include market data freely available to public, such as the current bid and ask prices. Levels 3 and 4 include the market data that can be obtained for a charge, such as the LOB status with the broker list in the bid and ask queues at a particular time. Levels 5 and 6 comprise private information that is not revealed but is in possession of the regulators for the purpose of market rule compliance verification. Various levels of pre-trade and post-trade LOB information provide different trading insights for investors, and thus, regulators are concerned as to what degree of transparency is best suited for the market.
Although equity markets around the world are increasingly migrating from transparent LOBs (levels 3 and 4) to anonymous LOBs (levels 1 and 2), whether such a move is beneficial for overall market quality is still very much under debate.2,3 For instance, Frino et al. 4 reported that broker identity (ID) can convey advantageous information with regard to predicting stock price movements. They suggested that LOB transparency enhances information efficiency and promotes fairness. Duong et al. 5 referred to the Australian Securities Exchange and also reported that broker IDs contain significant information content. However, other empirical studies showed that both broker ID and LOB transparency increase bid–ask spreads 6 and may, thus, lower liquidity.
Stock market designers and regulators need to consider all of these aspects holistically 7 to construct an ideal market structure that can strike a balance among several aspects of market quality, such as market liquidity, price recovery, volatility, and trading profitability. In the past, research efforts were mostly dedicated to the first three aspects, whereas studies of trading profitability were/are relatively scarce. The impact of market design on trading profitability was usually examined through hypothesis testing, in which only the statistical significance of the hypothesis was reported. 8 These methods do not allow the quantification of the impacts of different LOB transparency disclosure policies on trading profitability. A research tool designated for quantifying trading profitability is desperately needed for designing a fairer market structure and will also be valuable to regulators.
In addition, market quality is mostly studied through empirical investigations of events.3,9 For example, to explore the impact of LOB transparency on market quality, researchers need to examine the market data around a particular instance of policy change (e.g., the New York Stock Exchange moving from an opaque to a transparent market in 2002), and then statistically compare the differences in market quality before and after the event. Such an empirical approach, nevertheless, suffers from two severe limitations. First, the market data are collected in a specific time span around the instance, but the number of relevant events is often scarce. Restricted data can seriously affect the validity of the results' generalization. Second, technology improvements impact the efficiency of the existing market structure. The market data may rapidly become obsolete in the ever-changing stock market.
The second limitation demands increasing attention, given the recent advent of high-frequency trading (HFT), which greatly reduces the decision time frame of a trader from minutes to fractions of a second. The HFT has profoundly altered the landscape of the stock market by largely replacing human traders with automated algorithmic traders, and LOBs have become increasingly important as they are the main source of information used by HFT algorithms to arrive at trading decisions. 10 The proliferation of HFT poses new research issues in market microstructures, and thus, an efficient and effective method is required for processing and analyzing the enormous amount of market data. 10
This study attempts to partially address the two aforementioned limitations by proposing a research instrument that can quantify the price predictabilities for various degrees of LOB transparency. By analyzing a recent and high-frequency LOB dataset, this study empirically measures the impact of two LOB features (i.e., the bid and ask prices with order volumes versus broker IDs in bid and ask queues) on price predictability, and it may provide useful insights for designing HFT strategies. We advocate the use of a deep learning framework, a popular machine-learning technique that mimics human brains to solve complex problems, for evaluating the information content of broker IDs in the LOB. Our result indicates that the best F1 scores of the anonymous LOB and broker ID models are fairly high, ranging from 57.63% to 68.70% and from 53.70% to 59.39%, respectively. It is also surprising that the overall F1 prediction performance solely based on the broker ID dataset can reach, on average, 85.13% that of the LOB dataset with bid–ask prices and order volumes.
Research Methodology
This study examines the information content of the LOB data of the Hong Kong stock exchange. The data are available to the public in near real-time at a subscription cost. The Hong Kong stock market is an ideal platform for the investigation of market transparency for two reasons. First, Hong Kong is one of the largest stock markets in the world. As of December 2019, Hong Kong was ranked fifth among all member stock exchanges of the World Federation of Exchanges and second in Asia in terms of market capitalization. A global financial centre, Hong Kong is one of the few stock exchanges in the world that still provides transparent LOB market data. Second, the composition of stock investors in Hong Kong is diverse, and the total turnover in the volume of institutional investors is about 64%. 11
Unlike the Australian Securities Exchange, the Hong Kong stock market does not provide transaction records with complete broker information. It would be extremely difficult, if not impossible, to identify the initiator of a trade based solely on the real-time LOB data line. In addition, the collected LOB data are inevitably noisy, since some data ticks are typically skipped or duplicated depending on network traffic or data server conditions. Based on the market data classification proposed by Paddrik et al., 1 the dataset considered in this study lies between levels 3 and 5. In particular, two LOB features extracted from the dataset, namely a list of bid and ask prices with order volumes (level 3 market data), and the bid and ask broker ID queues in the LOBs (partially classified as level 5 market data), are compared in terms of the price movement predictability.
We evaluate the importance of the LOB features just cited by using a deep learning model. By comparing the price prediction accuracy of each feature application, one can quantify the importance of both LOB features. It should be, however, noted that the prediction accuracy from the proposed deep learning model reflects only the least possible value (or lower bound) of the LOB feature rather than its actual potential value. The prediction performance could increase if a more suitable learning model can be identified and adopted for the LOB dataset. In this study, intra-day LOB data of the price, volume, and broker IDs of 40 Hong Kong stocks are collected over 6 months (from September 2018 to February 2019). Among the 10,000 valid broker ID tokens, the LOB data show, at most, the first 20 broker IDs in the bid and ask queues. However, the LOB data do not provide the actual bid–ask price and order volume of each broker in the bid–ask queue, as seen in the snapshot of sample LOB data with broker IDs (Fig. 1).
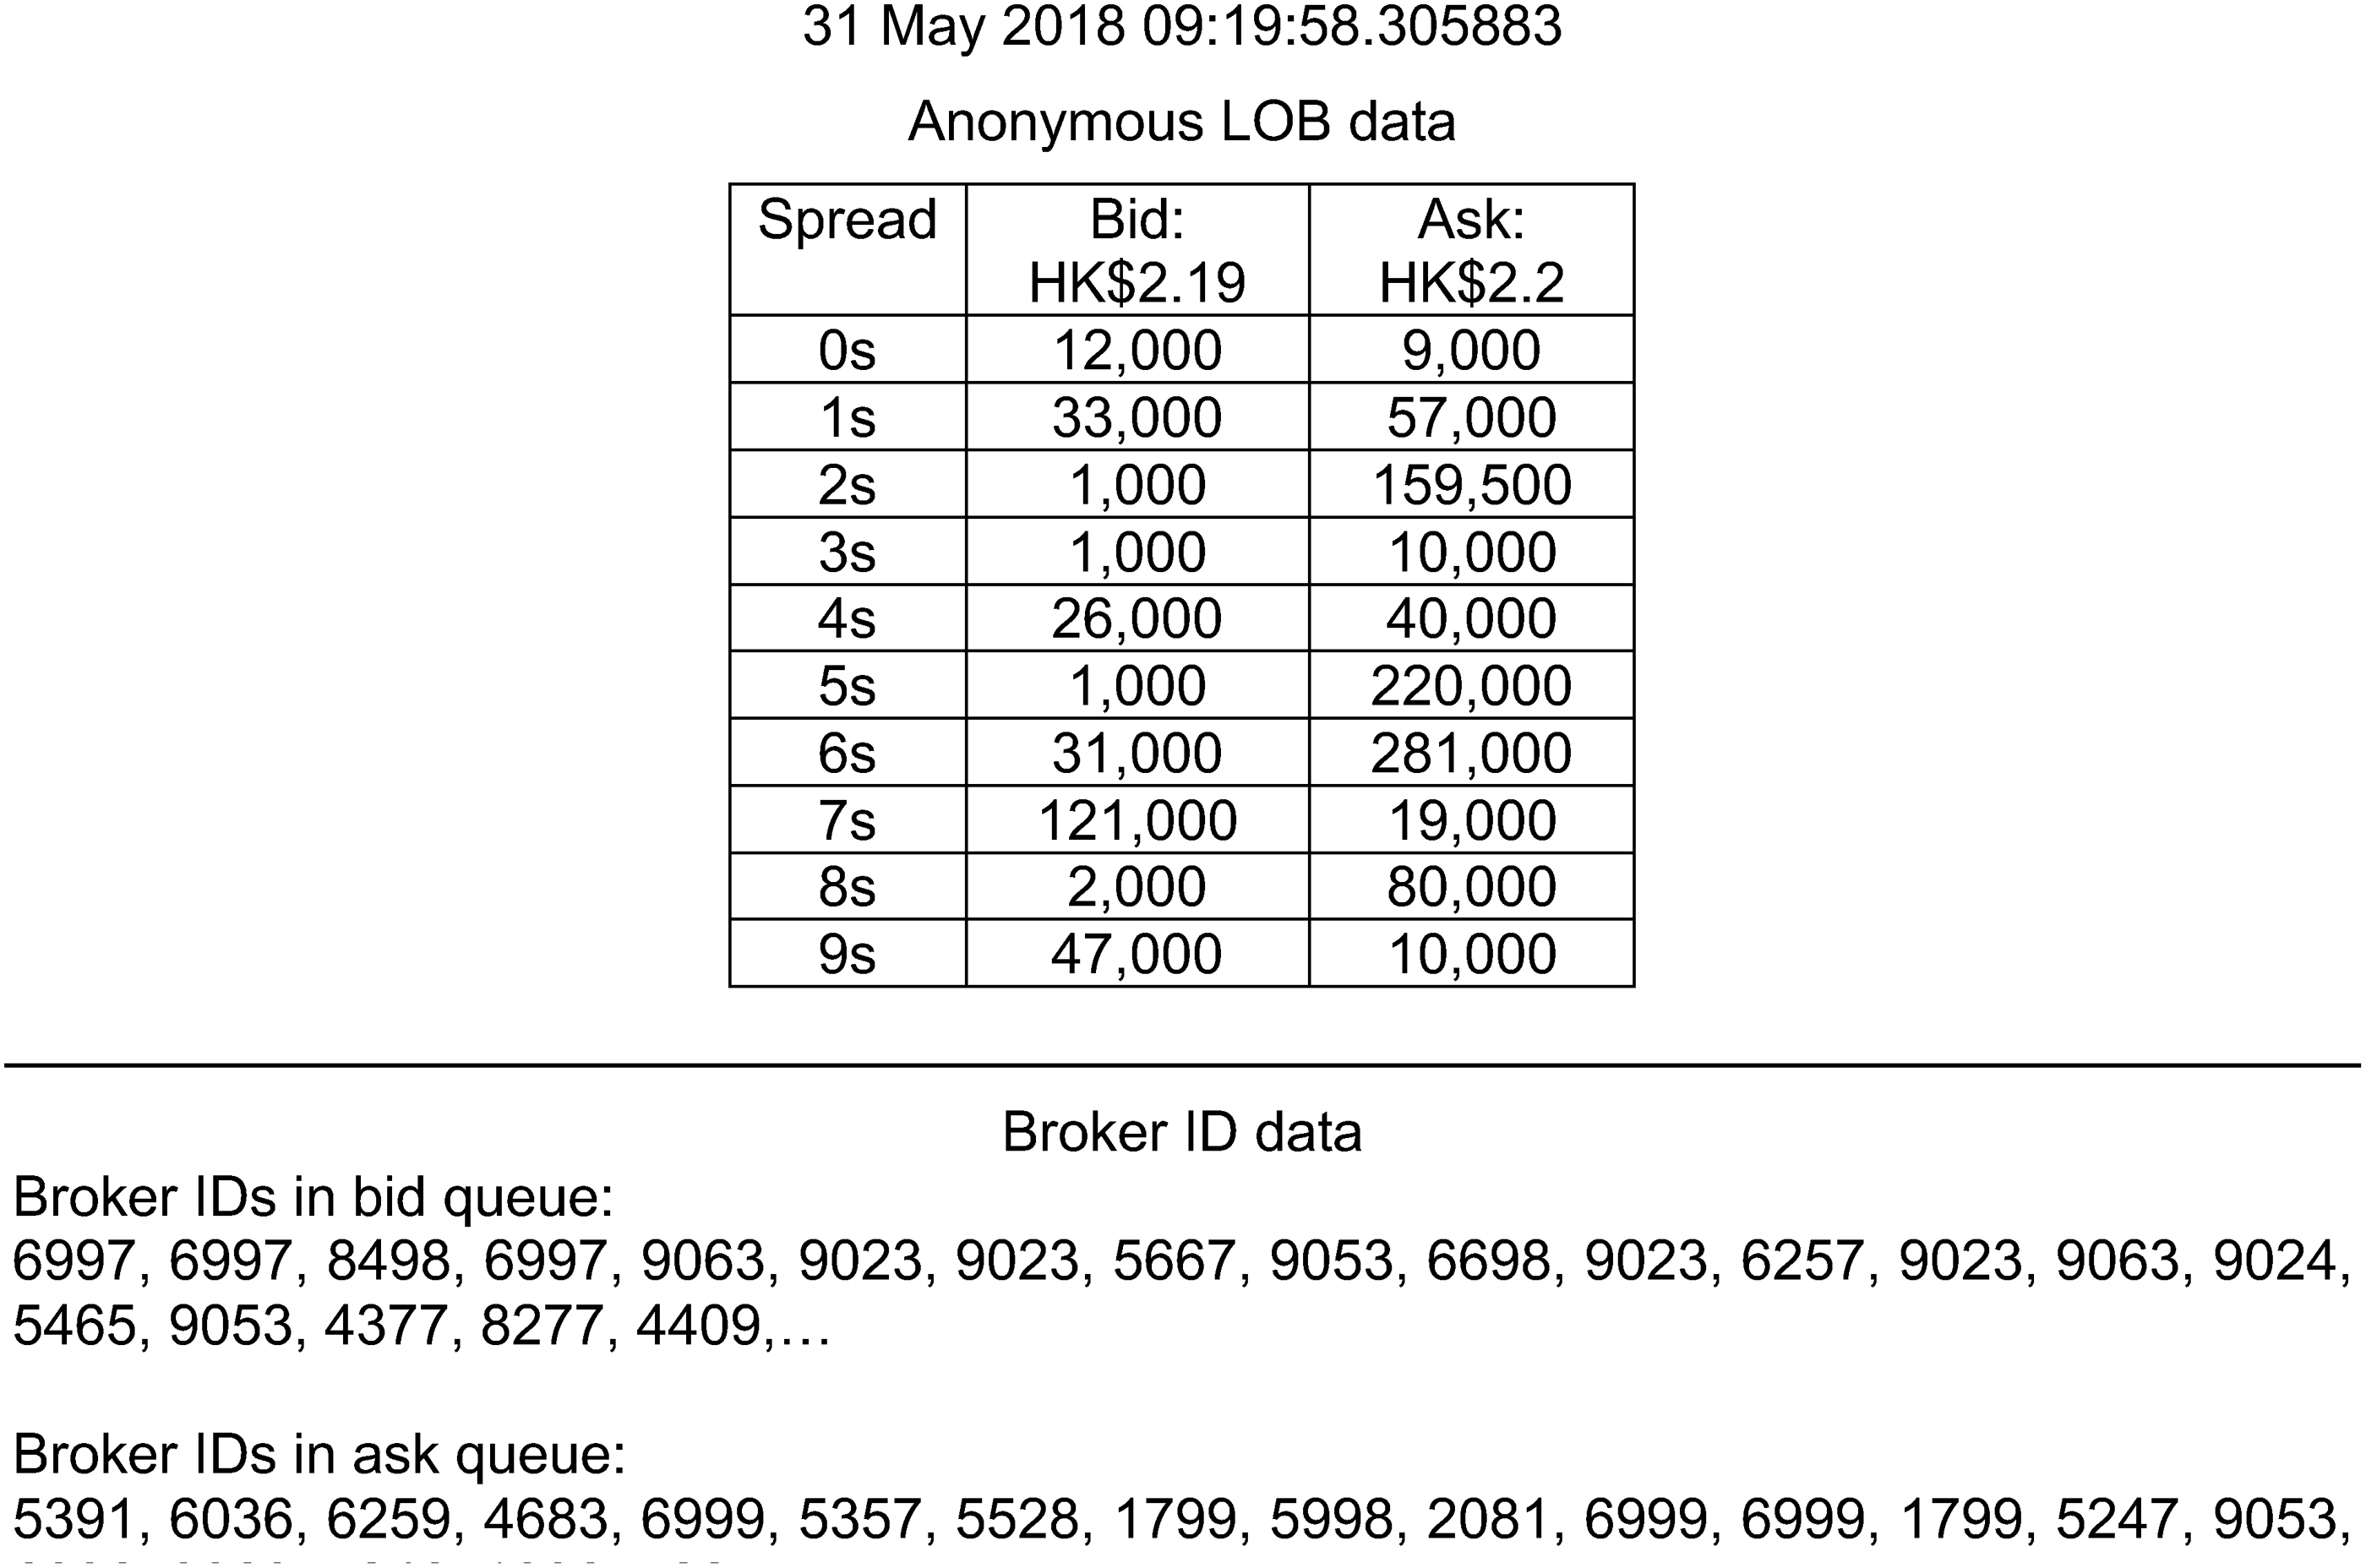
A snapshot of sample LOB data with broker IDs. ID, identity; LOB, limit order book.
In our experiment, we first divide the LOB dataset into two parts, namely the anonymous LOB (the upper part of Fig. 1) and the broker IDs in the bid and ask queues (the lower part of Fig. 1). We then employ the deep learning models to evaluate the price movement predictability of both datasets. Note that the anonymous LOB dataset contains the current 10 prices and volumes in the bid–ask queue, whereas the broker ID dataset comprises only the first 20 broker IDs in the bid and ask queues without prices and volumes attached. The prediction performance of the AnonymousLOB and BrokerID models is then compared to determine the effectiveness of using broker ID queues alone as a feature. The LOB data collected from the trading days between September 2018 and January 2019 are used as training data, whereas those gathered between February 1 and 10 and the remainder of February are used as test data and validation data, respectively. As shown in Table 1, we first start with the eight most representative and sufficiently liquid stocks from the Hang Seng Index constituent stocks as a pilot. We do this so that their prediction performance can be clearly shown and discussed in detail. We then verify the performance consistency with less liquid stocks from different industry sectors based on the classification provided by AA stocks.
Basic information about the eight selected Hang Seng Index constituent stocks
ID, identity; LOB, limit order book.
Deep Learning Model Architecture
Deep learning is a subfield of artificial intelligence. It simulates the functioning of the human brain through machine-learning algorithms to solve complex problems. In recent years, deep learning has been widely adopted in various business applications, 12 and it is an ideal tool for our study due to its capability to cope with a huge amount of noisy LOB data. Unlike other approaches that often require domain experts to handcraft essential features, deep learning can automatically extract useful features from the data. DeepLOB 13 is a deep learning model for forecasting mid-price movements of LOBs, and it surpasses all of the currently known algorithms in prediction accuracy on the benchmark LOB dataset. The stable performance of this model has also been verified by using market data of the London Stock Exchange. Due to its superior performance in utilizing LOB features, variants of DeepLOB are employed to measure the information contents in the LOBs and bid–ask queues in this work. As shown in this study, deep learning is flexible for handling both anonymous LOB and broker ID data. Further, deep learning enables a fast response time and is thus well suited for HFT.
Our proposed deep learning models are enhanced versions of DeepLOB, and they comprise an embedding layer, a series of convolutional layers, a long short-term memory (LSTM) layer, and a dense layer to project a probability for each label. The model automatically extracts the key features from the raw LOB data without human expert intervention. The following sections explain how these layers work in detail.
Embedding layer
An embedding layer is used to reduce the data size required to represent the large number of brokers. It transforms a sparse representation of tokens into a dense vector representation. Embedding techniques are often used in natural language processing tasks in which sparse one-hot encoded vectors, such as English words, are transformed into a dense vector representation.14,15 This transformation can substantially decrease the computation cost by reducing sparsity. 16 In other words, far fewer computations are required to represent the tokens, namely the BrokerID model in this research work. In addition, the embedding is continuously updated while training the neural network. As such, the similarity of the tokens (i.e., broker IDs) is evident in the multidimensional space, and this may be utilized as a feature input for other models. In this study, the 10,000-dimension BrokerID vector is transformed into a 64-dimensional vector. We use the embedding layer as the input layer of our BrokerID convolution model and train it with the model.
Convolution layer
The convolution layer is used to weigh the LOB data at different levels into a consolidated input. Convolutional neural networks extract features and representations by using a series of filter windows. 16 These networks have been proven effective in different applications, including image classification, 17 sentence classification, 18 and face recognition. 19 Similar to processing pixels in an image, our models adopt a series of convolutional layers to reduce noise and extract signals from the LOB data.
Inception module
The inception module captures the nonlinear properties of the LOB data. Following Zhang et al., 13 all filters in a standard convolutional layer are set to a fixed size; in other words, only fixed time steps of features can be extracted each time. To capture dynamic behaviors over multiple timescales, an inception module is used to warp multiple convolutional layers with different windows. A 3 × 1 convolution window, a 5 × 1 convolution window, and a 3 × 1 max pooling layer are used to capture features in different timescales (Fig. 2).
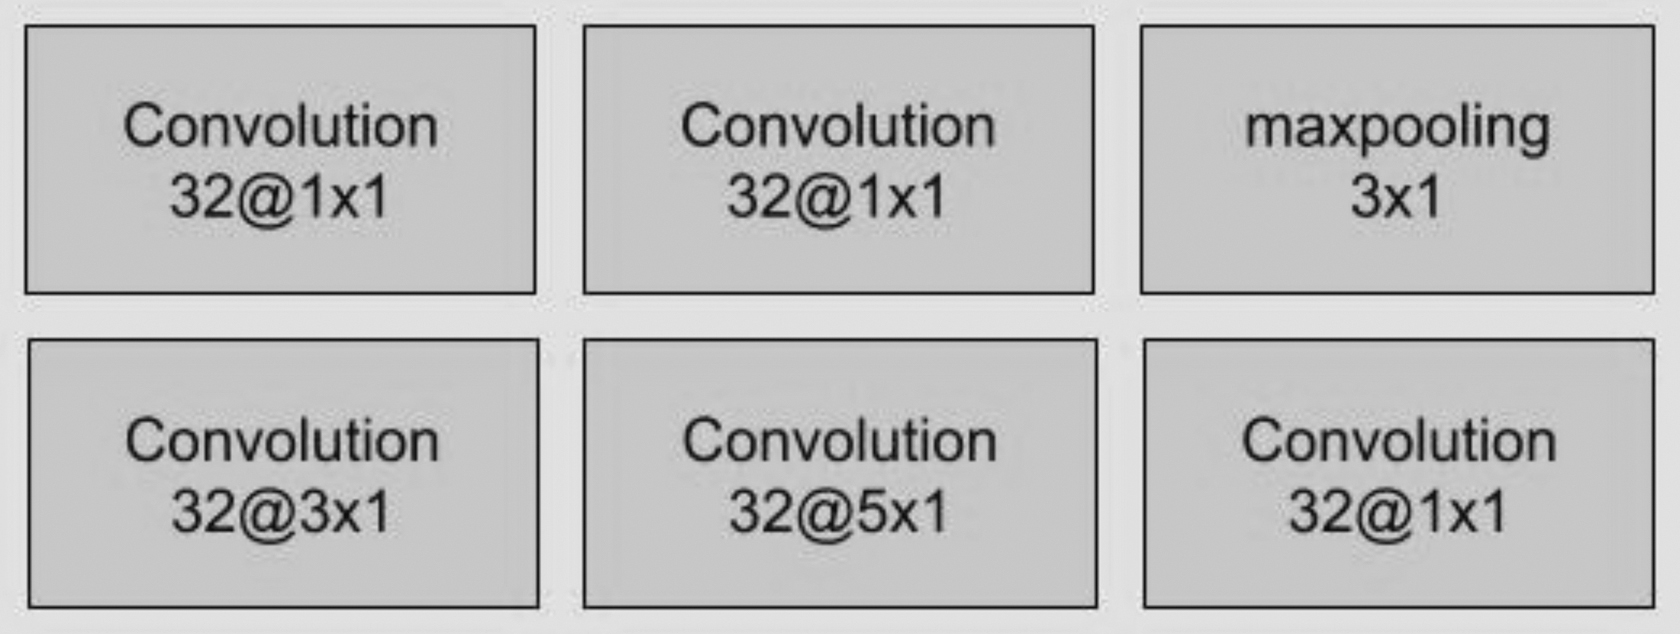
Inception module of enhanced DeepLOB.
Long short-term memory
An LSTM layer is employed at the end of the model to capture the temporal dependencies of the anonymous LOB and broker ID data. The LSTM networks were originally designed to solve the vanishing gradient problem commonly encountered in long-term dependency 20 by using an update gate and a forget gate to “remember” features. 21 In this research, an LSTM network is used to capture the convoluted features of the LOBs or IDs, and to monitor features in the earlier time steps.
The output layer is a fully connected layer of neurons, and it utilizes a softmax activation function to represent the probability of each price movement in each time step.
Model Architecture
For the LOB prediction model, we use a 2D convolutional layer with 16 filters of 4 × 40 windows to translate the entire LOB into a single-vector representation with 4 neighbor time steps. Subsequently, we use a convolution layer with 16 filters of 1 × 1 windows (as in Lin et al. 22 ) to help capture the nonlinear property in our dataset. The next part, the inception module, acts as a different moving average window. For every convolution layer, including that in the inception module, a leaky rectified linear unit (Leaky_relu) is adopted as the activation function. Then, the outputs are fed from the inception module to the LSTM layer to further capture the temporal dependency of the LOBs and reduce the number of parameters. Finally, a dense layer with three neurons is employed to project the predictions. In summary, the AnonymousLOB and BrokerID models are constructed (as depicted in Fig. 3).

Model architecture for the AnonymousLOB and BrokerID models.
The model architecture for AnonymousLOB is similar to that of DeepLOB, 13 barring a major difference in the convolutional layer. In particular, AnonymousLOB adopts the approach proposed by Tsantekidis et al., 23 namely directly convolution of the entire LOB dataset and its neighbor time step using a 4 × 40 kernel instead of breaking it down to the order level using 1 × 2 kernel, and convoluting it with 4 × 1 kernel. The AnonymousLOB model treats the LOB dataset as a whole sequence, whereas DeepLOB focuses to a greater extent on the interactions of individual orders. Moreover, this approach requires fewer parameters—DeepLOB has 9392 trainable parameters before the inception module as opposed to 3888 for AnonymousLOB. As such, the training time for AnonymousLOB is substantially reduced whereas the prediction performance is on par with that of DeepLOB.
The BrokerID model employs a structure similar to that of AnonymousLOB, but an embedding layer is added before the convolutional layer. The embedding layer translates the broker IDs into 32-dimensional vectors, namely as dense representations. Compared with using a one-hot encoded vector, this arrangement requires fewer computational resources, and the dimension is reduced from 100 × 20 × 10,000 to 100 × 20 × 32 before feeding into the convolution model.
To facilitate deep learning, all order prices and volumes placed in the bid and ask queues are normalized by z-score transformation using the previous trading day's mean and standard deviation.
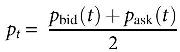
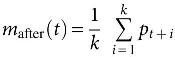
The direction of the virtual mid-price changes is used as the prediction target. The virtual mid-price is defined as the mean of the best bid price and best ask price by using the following equation:
where
where
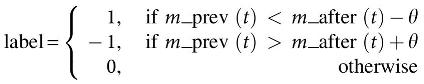
where
The model is implemented in Keras by using Tensorflow 1.13 backend with a fixed random seed. Both models are trained by using Intel XEON E5-2630V4 with 64 GB RAM and a GPU NVIDIA 2080, and they are optimized by using ADAM 24 with a learning rate and batch size obtained by the grid search. The AnonymousLOB and BrokerID models are trained for 50 and 30 epochs, respectively, and the prediction performance using out-sample test data is reported with respect to the best precision, recall, and F1 score.
Prediction accuracy is defined as the ratio of the number of correct predictions to the total number of observations. Although it is the most natural performance measure for model evaluation, prediction accuracy can be misleading under certain circumstances, as explained by Ortiz-Catalan et al. 25 Hence, precision, recall, and F1 score are typically used as performance metrics. Specifically, precision is defined as the ratio of true positive predictions to the total number of positive predictions.
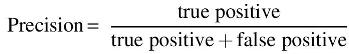
In other words, precision describes how precise or accurate a model is in terms of the number of actual positives as compared with the total predicted positives. As such, precision would be considered as a better measure when a high cost is associated with false positives.
“Recall” is defined as the percentage of correctly classified total relevant results, as seen in the following formula:
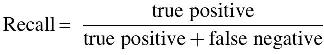
The recall formula computes the number of the actual positives a model captures by labeling them as positives (true positives). Applying the same logic as described earlier, recall should be adopted as the performance metric for model selection when the cost of false negatives is high.
The F1 score, also known as the overall performance, is the harmonic mean of precision and recall, as defined later:
It should be noted that the F1 score attempts to strike a balance between precision and recall. It would be a more suitable measure to choose if both precision and recall are considered to be equally important and the class distribution is uneven (e.g., a large number of actual negatives exist).
Experimental Results
Table 2 reports the prediction performance after 20 ticks (i.e., horizon k = 20) of AnonymousLOB and BrokerID, and the performance ratio between the two models in terms of the best precision, recall, and F1 scores. To allow a fair comparison, the best F1 scores are often considered for unbalanced data. As shown in the table, the best F1 scores of AnonymousLOB and BrokerID range from 57.63% to 68.70% and from 53.70% to 59.39%, respectively. Although the result shows that the AnonymousLOB model consistently outperforms the BrokerID model in all three measures, it should be noted that, overall, the prediction performance solely based on broker ID queues equals 87.65% on average, and it can reach 79.49% to 96.13% that of AnonymousLOB (Table 2). Considering that the input of the BrokerID model only consists of 20 broker ID numbers in the bid and ask queues (without the prices and order volumes), it is rather surprising that using merely the broker ID queues in the LOBs for price movement prediction can achieve a performance rather close to that obtained by using the anonymous LOB information.
Comparison of prediction performance of AnonymousLOB and BrokerID with horizon k = 20
The best and worst ratios between the two models are in italics and bold, respectively.
To further analyze the prediction performance, the confusion matrices of prediction performance for both models and all eight stocks are provided in Tables 3 and 4. Note that the posterior probabilities, P(Actual | Prediction), are shown in parentheses.
Confusion matrix for the AnonymousLOB model with all eight stocks (k = 20)
The italic values indicate the correct trade decisions resulting in monetary rewards, while the bold values represent the incorrect trade decisions leading to monetary losses.
Confusion matrix for the BrokerID model with all eight stocks (k = 20)
The italic values indicate the correct trade decisions resulting in monetary rewards, while the bold values represent the incorrect trade decisions leading to monetary losses.
Tables 3 and 4 illustrate that the AnonymousLOB model provides 71.64% correct predictions on average (the percentage on the left diagonal), whereas the BrokerID model achieves 60.62% precision on average. From the practical trading perspective, however, the values in the four corners of the confusion matrix are considered as the most important measures. Specifically, the upper left and lower right corners (in italics) indicate the correct trade decisions resulting in monetary rewards, whereas the upper right and lower left corners (in bold) represent the incorrect trade decisions leading to monetary losses. Table 5 summarizes the performance of the two models for trade decisions. The average ratios of correct trade decisions by the AnonymousLOB and BrokerID models are, respectively, 73.94% and 58.89%, whereas the corresponding values of the incorrect trade decisions are only 12.92% and 17.14%. Since the average correct trade decisions are much higher than the incorrect ones for both models, traders utilizing LOB information in HFT have a higher chance of profit-making.
Performance of trade decisions with AnonymousLOB and BrokerID models with all 8 stocks (k = 20)
In addition to k = 20, the performance of DeepLOB has been examined for longer prediction horizons (k = 50 and k = 100), and the model performance reportedly declines for such prediction horizons (Zhang et al., 2019). Next, we examine the impact of prediction horizon k on the prediction performance of both AnonymousLOB and BrokerID. Tables 6 and 7 illustrate the comparison of price predictability on both datasets when horizon k is set to 50 and 100, respectively. Table 8 summarizes the ranges of the prediction performance of both models under different horizons (k = 20, 50, and 100).
Comparison of prediction performance of AnonymousLOB and BrokerID with horizon k = 50
The bold values indicate respectively the highest and lowest comparative performances between BrokerID and AnonymousLOB.
Comparison of prediction performance of AnonymousLOB and BrokerID with horizon k = 100
The bold value indicates the lowest comparative performance between BrokerID and AnonymousLOB.
Summary of prediction performance of AnonymousLOB and BrokerID for horizons k = 20, 50, and 100
Table 8 shows that when horizon k increases, the prediction performance of both models decreases with regard to best precision, best recall, and best F1 score. However, the differences in the correct predictions between BrokerID and AnonymousLOB decrease when the prediction horizon increases. When k = 50, the AnonymousLOB model still surpasses the BrokerID model in all three measures for most stocks. However, for two stocks (27 and 388), the BrokerID model outperforms the AnonymousLOB model. Table 6 indicates that the prediction performance of BrokerID reaches 87.89% to 106.84% of that of AnonymousLOB. When the prediction horizon increases to 100, the BrokerID model achieves essentially the same performance as that of the AnonymousLOB model (92.96% or above), as shown in Table 7.
To confirm our findings, a total of 40 less liquid stocks from 10 industry sectors are selected via convenient sampling for further comparison with k = 20. The result in Table 9 indicates that the prediction performance solely based on the broker ID queues can achieve, on average, 85.13% that of the anonymous LOBs, and this ratio is quite consistent among different industry sectors.
Comparison of prediction performance of AnonymousLOB and BrokerID in various industry sectors with horizon k = 20
Conclusion and Future Work
This study proposes adopting deep learning as a new instrument to measure the information content of broker ID queues in LOBs. Deep learning makes it feasible to quantitatively evaluate the effect of anonymity by comparing the prediction accuracy of price movement using LOB data with and without broker IDs.
Analysis of a huge Hong Kong stock LOB empirical dataset indicates that using only the broker ID queues in the LOBs can achieve, on average, 85.13% overall prediction accuracy compared with using anonymous LOB information for prediction horizon k = 20. However, the performance differences diminish as k increases, and both models perform quite similarly when k = 100. This outcome is unintuitive since the broker ID dataset contains no information related to price, volume, institutional brokers, and retail brokers. It implies that the broker ID queues in the LOBs contain significant information content that is valuable to traders. Our study also provides a measurable value of the broker information in the bid–ask queues for the market data provider to determine an appropriate price for level 2 data. It should also be noted that the prediction accuracy reflects only the lower bound rather than the actual value of the LOB feature for a given learning model. The prediction performance could increase if a more suitable learning model can be identified and adopted for the LOB dataset.
The contributions of this study are twofold. First, we propose a machine learning-based instrument for finance researchers to quantitatively measure the price predictability of LOB features, and we conduct an empirical study on the impact of LOB transparency on traders' profitability. Regulators can use the proposed instrument to determine the appropriate level of LOB transparency so as to maintain a balance among several aspects of market quality, such as market liquidity, price recovery, volatility, and trading profitability. Specifically, the level of LOB data disclosure and subscription fee can be adjusted based on the price movement predictability. Second, our empirical result strongly suggests that the broker ID queues in the LOB consist of significant information content for price prediction, and it provides insights for regulators to determine the appropriate degree of LOB transparency so as to enable a fair market design for all investors.
Nevertheless, several research questions remain to be answered. For instance, how can broker ID sequences capture the price movement characteristics? Do institutional brokers or retail brokers in LOB offer more significant information with respect to the short-term price movement under different market trends? Can investors benefit in terms of trading profitability with more LOB information?
For the first and second questions, further investigation is required to identify the exact information that broker IDs can contribute toward increasing prediction accuracy. We conjecture that the broker IDs appearing in the LOBs provide sufficient evidence to distinguish among various categories of brokers, such as institutional and retail brokers. In addition, a change in the broker sequence in the LOB may indicate short-term momentum of a stock. For the last question, it would be interesting to explore whether the prediction performance can be boosted with the complete LOB dataset (i.e., levels 1–4 of data). In theory, more information should yield better prediction performance. However, our pilot study (not reported here) shows that a straightforward mixture of the anonymous LOBs and broker IDs for the deep learning model just cited does not yield any significant improvement in the prediction accuracy. In fact, the prediction performance using both bid–ask prices and broker IDs results in roughly 2%–3% worse accuracy when normalizing broker IDs with occurrence frequency. There are two main reasons for this unsatisfactory result. First, the collected LOB data are incomplete; they contain only an aggregated order volume for a specific price instead of an order for each individual broker. Second, broker IDs and bid–ask prices are two distinctive data types (the former is categorical, whereas the latter is numerical), and thus directly combining both in one model results in disappointing performance. A new model architecture is required to judiciously combine the anonymous LOBs and broker IDs to achieve better prediction results. Our future investigations will be directed toward these topics.
Footnotes
Acknowledgment
The authors are grateful to CASH Algo Finance Group Limited for providing the stock data for their research.
Author Disclosure Statement
No competing financial interests exist.
Funding Information
The work described in this article was fully supported by a grant from the Research Grants Council of the Hong Kong Special Administrative Region, China (UGC/FDS16/B10/17).