
Abstract
Firms face challenging analytical tasks at the advent of a growing amount of unstructured big data (BD). These data lead to radical shifts in their analytical strategies and market insights. Yet, the particular types of analytical methods remain in the literature still loosely scattered. This work stresses the unstructured BD analytics, first by capturing their unique characteristics and then by proposing a model for diagnosis of the analytical methods related to unstructured data (UD) inside the firms. We focus on five interrelated research aspects, by: explaining the essence of UD with the firms' environment; identifying and classifying the most important analytical methods in organizations to better understand UD; developing a conceptual model along with measures; and diagnosing the extent to which the unstructured analytical methods, beside the structured analytics, relate with firm performance (FP). Finally, this model is investigated from perspective of the two-communities theory in reference to data scientists and marketing researchers within the organizational environment. A model is tested on the basis of complementary analytical strategies: confirmatory and multigroup factor analyses and structural equation modeling, for which data (N = 356) were collected from international online survey. Results confirm a high level of adequacy of the conceptual model and superiority of unstructured over the structured analytics leading to FP, while the scalar invariance testing proves minor differences between groups in reference to two of the analytical methods.
Introduction
The debate over the values of big data (BD), and simultaneously its risks, future impacts, and challenges for societies, worldwide and local economies, and businesses is still being and appears to be endless.1–3 In particular, firms 4 seem to be strongly occupied with explaining these issues, for the BD naturally combines with the vivid interests of their existence and progress in the market, leading to specific effects in business. Indeed, the BD trends are presently creating almost immeasurable amounts of potentially valuable information to be used in multiple areas of business and marketing.1,5–8 BD have even been considered to be a breakthrough technological development within recent years 9 but have also been viewed through the lens of trust, or the lack thereof.10,11 The truth is also that many new opportunities and risks, which have appeared so far for firms, were mainly due to significant increases of the unstructured data (UD) formats.12,13 According to an IDC report, 14 UD will account for nearly 90% of all data created in the next decade, which must lead to radical changes in firms' analytical strategies and the data processing methods they select. 15 As Park and Song put it, 16 only 20% of the data available will be structured and stored in relational databases, the rest, 80% will be UD.
Interestingly, given all above fact, the UD17–21 represent still a relatively untapped source of insights in theory of BD, management and marketing, despite the fact that they create plenty of potential opportunities for business organizations.22,23 In particular, a theory22–24 is deprived of the empirical knowledge, that is, instrument to measure the unstructured BD analytics in business context. Note that, as far as the UD are concerned, they allow to detect important relationships or classifications about the market and its consumers, which were previously considered difficult or impossible to determine with the structured data.2,25 Moreover, in the literature, there appears domination of studies focused on structured data, although as estimated, these data form only a small subset of BD. 23 There is also little known about to what extent, the UD have come to consume firms' valuable resources, in both the human and technical context, 26 as well as how the UD influence firm performance (FP).27,28 An issue of the management of UD also remains unsolved. Finally, as Blumberg and Atre 18 as well as Howatson 29 argued, although some of the analytical methods that have proved to be successful in the course of transformation of structured data into actionable marketing information and knowledge, they not always meet the criteria of effective analysis within the area of the UD, 30 and consequently, new analytical approaches and conceptual models are necessary.
The current work contributes to development of the BD, management and marketing theoretical studies by tackling the following interrelated issues. First, we explain the origins and dimensional specificity of BD to better account for the essence of UD. Concurrently, we review the literature sources pertaining to various UD data types22–24 and conduct on their basis a unified synthesis over the particular analytical methods, along with their selectively presented applications, within a business organizational framework. This stage allows us to gain in-depth insights on the dynamic nature of UD methods and reveal their theoretical and practical richness. Next, we develop a conceptual model along with the measurement procedure of identifying analytical methods related to UD (i.e., the text, audio, video, image, and geospatial data formats). This model is then put to empirical test, while its in-depth diagnosis based on predictive and discriminant validity shows the extent to which the unstructured BD analytical methods, beside the structured analytics, impact the FP.27,28 Finally, we conduct a post hoc analysis from the perspective of the two-communities theory 31 in reference to data scientists and marketing researchers. In the course of analysis, we test their levels of perception of the analytical unstructured methods, as well identify the most likely analytical methods (i.e., data processing strategies) linked with UD formats in firms.
Related Work
The origins and dimensionality of BD
When discussing the nature of the UD, we first need to explain three general sources for BD origin, as they bear responsibility for data generation in a business environment. These sources are 32 : (1) effects of human interaction with the data; (2) machine-to-machine data interactions, and (3) machine–transactional data interactions. The first of the mentioned sources reflects primarily significant changes in the modern communication channels, which people use in their daily life and can range from posted e-mail and SMS messages to various text documents or files uploaded online, including images, movies, and sound recordings. 33 The second source is created due to the dynamic growth of computer network infrastructure, through which data can be transmitted or recorded. 34 The examples in this case may include35,36: servers, routers, telecommunications devices, satellites, transmitters, and receivers. Finally, the third source is responsible for connections between humans via devices that provide access to specific services based on various transaction systems (e.g., online stores, mobile services, and other systems 37 ), which in turn allow firms to monitor consumers' emotions, locations, and physical activities, as well numerous kinds of interactions with other people and/or devices. 38
The above variety of sources naturally has led to broad, but also often very misleading, conceptualizations of BD in the literature, 39 not to mention misunderstandings of the meaning and essence of UD,12,22 so the question which now begs to be answered is, “what is Big Data?” Note that the term “Big Data” in itself remains unclear because it has various theoretical connotations. In fact, BD definitions have created serious confusion in academia, industry, and among various stakeholders. 40 For instance, the word “Big” may imply significance, complexity, and challenge, as well invite scholars to use quantification phrases. 3 Therein lies the difficulty in furnishing or comprehending this definition. 41 However, the second term of BD, being reflected in the word “data,” may denote nearly anything, ranging from issues associated with types of data, data specificity, or sources—to aspects associated with data storage and analysis, advanced processes involving higher technologies, and computer powers, the latest discoveries in machine learning and artificial intelligence, to be applied to massive and complex sets of data to detect meaningful information from the data. 42
Also, a broad scale of interpretations of the dimensionality of BD does not help.1,43 As a consequence, we can talk not only about 3V dimensional structure of BD (i.e., volume, velocity, and variety) but also about 4V (volume, velocity, variety, and variability) or 6V configurations: volume, velocity, variety, veracity, variability, and value. For instance, when we regard to volume aspect, we typically mean the multitude of data. An apt example is Facebook that collects and processes up to 1 million photographs per second and stores 260 billion photos using a storage system measuring more than 20 petabytes. 44 In contrast, the velocity reflects something quite opposite, that is, the rate at which the data are generated and analyzed. For instance, WalMart processes data sets, which include more than 1 million transactions per hour. 45 This capability, expressed in the speed of data collection and processing, increases the firms' chances of conducting real-time analysis23,46 but concurrently leads to large-scale data variability, which after all causes a confusion within the proper data understanding. 47 The other yet aspects of BD are the veracity and value,48,49 which explain that companies, which truly want to succeed with BD, need first to find desirable attributes in the data in specific contexts. Thus, the veracity and value of BD usually pertain to specific planned market actions and important decision-making processes undertaken inside the organization.26,46,50 In other words, value extraction from BD initiatives is needed for a sound business direction. 51 Finally, the last of BDs dimensions, which bear a greater significance for the subject of this study, regards data variety and the structural heterogeneity of BD, which may range from completely structured forms, to semi-structured, to virtually unstructured types of data. Although to a greater extent, this facet is attributed to UD due to the present availability of multiple formats (text, image, video–audio, and geospatial data12,52). The specificity of these data and the configuration of data types are discussed in the subsequent sections.
On the essence and specificity of unstructured data
The BD, as already noticed, split into three general types: (1) structured, (2) semi-structured, and (3) unstructured. Losee, 53 when explaining about the structured data, argued that they are organized in a highly regular way (e.g., tables and relations), where the regularities apply to all the data in a particular data set. However, semi-structured data contain the same characteristics of information, but instead of having regular structures, applying to all items in the data set, data might be interpreted with structural information supplied as tags (e.g., name = “Bob,” city = “Chapel Hill,” state = “North Carolina”). In contrast, the UD such as text and images contain information but no explicit structuring information, such as tags. These tags may be, however, assigned by market analyst using manual or automatic techniques, for converting UD to semi-structured data. Subramaniyaswamy et al. 20 even stressed that UD first need to undergo a process of structuration to perform any further analytical operations. But even with imposing this solution, it may still be extremely difficult to understand the UD objectively, 20 as the UD are deprived of a natural sense of numbers and natural measurement units—not to mention a process of defining and referencing the meaning of UD. 32 The fact is that UD represent records which are likely to be completely different from one another in content and structure, even if they are of the same kind such as e-mail messages, warranty claims, and corporate contracts. 54 Moreover, UD lack a “primary identifier” that can be used to match them to “similar or related data in the structured environment.” 46 However, due to the repeating nature of unstructured records, one can at least try to match “the unstructured record environment and the structured or semi-structured environment.” Note that in this case, nearly all structured data are relevant or potentially relevant thanks to its metadata, which facilitates the deriving of value; whereas UD are hardly relevant, and finding any value is mostly “a process of filtering and winnowing data” rather than “looking for lots of different types of data.” 55
Given above, to understand the essence of UD and find anything useful within the UD, 46 one always needs additional information, metadata, or descriptive characteristics of its primary source, which makes up the point of reference and allows one to explain the specificity of the units of measurement applied. 56 In particular, one needs prior information about how particular strands of UD were collected, the aspects of the relationships between numbers, and the objects to which the numbers refer. 50 Metadata can be used to describe a topic, fact, or relation and may be produced from combining the individual metadata items assigned to specific features. Furthermore, metadata may be arranged in a number of ways to represent the given topic. Although the final goal is to extract meaningful information from UD (e.g., the raw text, audio–video data, images, or geospatial data), a challenging task remains as to how to relate numbers with UD, as well provide proper meanings for the UD, which reflect free forms of human expression and are based on subjective interpretations. 57 In other words, with UD, the problem is not even a mathematical “translation” of these data into specific language of numbers (process of “representation”) but rather their subsequent interpretation and the whole process of drawing valid conclusions, compared with structured data (being part of numerical data), which provide more direct and immediate links to the studied phenomena than, for example, words. 58 Numbers come directly from the things being studied, whereas words are filtered by a human brain. Thus, in many situations, the UD do not appear to produce numerical data directly. 59
Overall, the UD contain no explicit structuring information,18,60 as they can be perceived on the grounds of multiple informational facets. However, these multiple facets paradoxically offer firms' unique information. For instance, UD maintain the concurrent representation of information, which means the single data unit may deliver different informational values. 19 Indeed, each of the single data can provide unique information, allowing to diagnose different phenomena at the same time, while firms can investigate diverse aspects with a single highly UD unit, which in the end makes the UD even more attractive source of information within various market research projects, compared with structured or semi-structured data. 29 However, this complexity of UD also indicates how problematic analytics can be, as far as the UD data applications are concerned in business environment. These issues are just discussed next.
Identification, classification, and applications of analytics related to UD
According to statistics published by the U.S. Patent Office, there appears yearly an increasing rate of patents of new analytical methods based on UD.61,62 These statistics not only indicate a practical significance of the unstructured analytical methods for business environments but also point at growing level of interest in advanced market research projects (e.g., focusing on “tracking” online and offline consumers' behavior). In this section, we identify and classify, on the ground of literature review, the unstructured analytical methods according to following general types of data sources distinguished in theory22–24 : text, audio–voice, video, image, and geospatial. Concurrently, we present their applications in the context of firms' environment and market research projects. However, given the breadth of the analytical applications, their exhaustive list is beyond the scope of a single work. Thus, we focus on the most relevant examples of unstructured BD analytics, derived from practice. Note that to comprehensively understand the essence and framework of the unstructured analytical methods, adhered to respective data types, as well as to ensure that conceptualized model (see next section) comprises every relevant aspect associated with UD analytics, we reviewed first those theoretical works (Balducci and Marinova, 22 Gandomi and Haider, 23 Wedel and Kannan 24 ), which pointed at broader conceptual distinction, configuration, and defining of different data types. An issue was that knowledge on UD types and analytics (specifically analytical methods) in these works remains either scattered or is mostly of theoretical background. In consequence, we put them together into single framework, according to which we presented own, elaborated identification and classification of the unstructured analytics, followed again by the literature review. By undertaking these actions, we could present a much more coherent view over the UD and further classify as well discuss them within range of respective analytical methods (Fig. 1). Thus, we managed not only to identify missing links in theory but also to understand specific roles of the unstructured analytical methods, being so far loosely scattered across various research works. In the end, by comprehending these methods, we could propose measurement model that was put to test (see Fig. 2 and Conceptualization of Model Exploring the Unstructured BD Analytical Methods section).
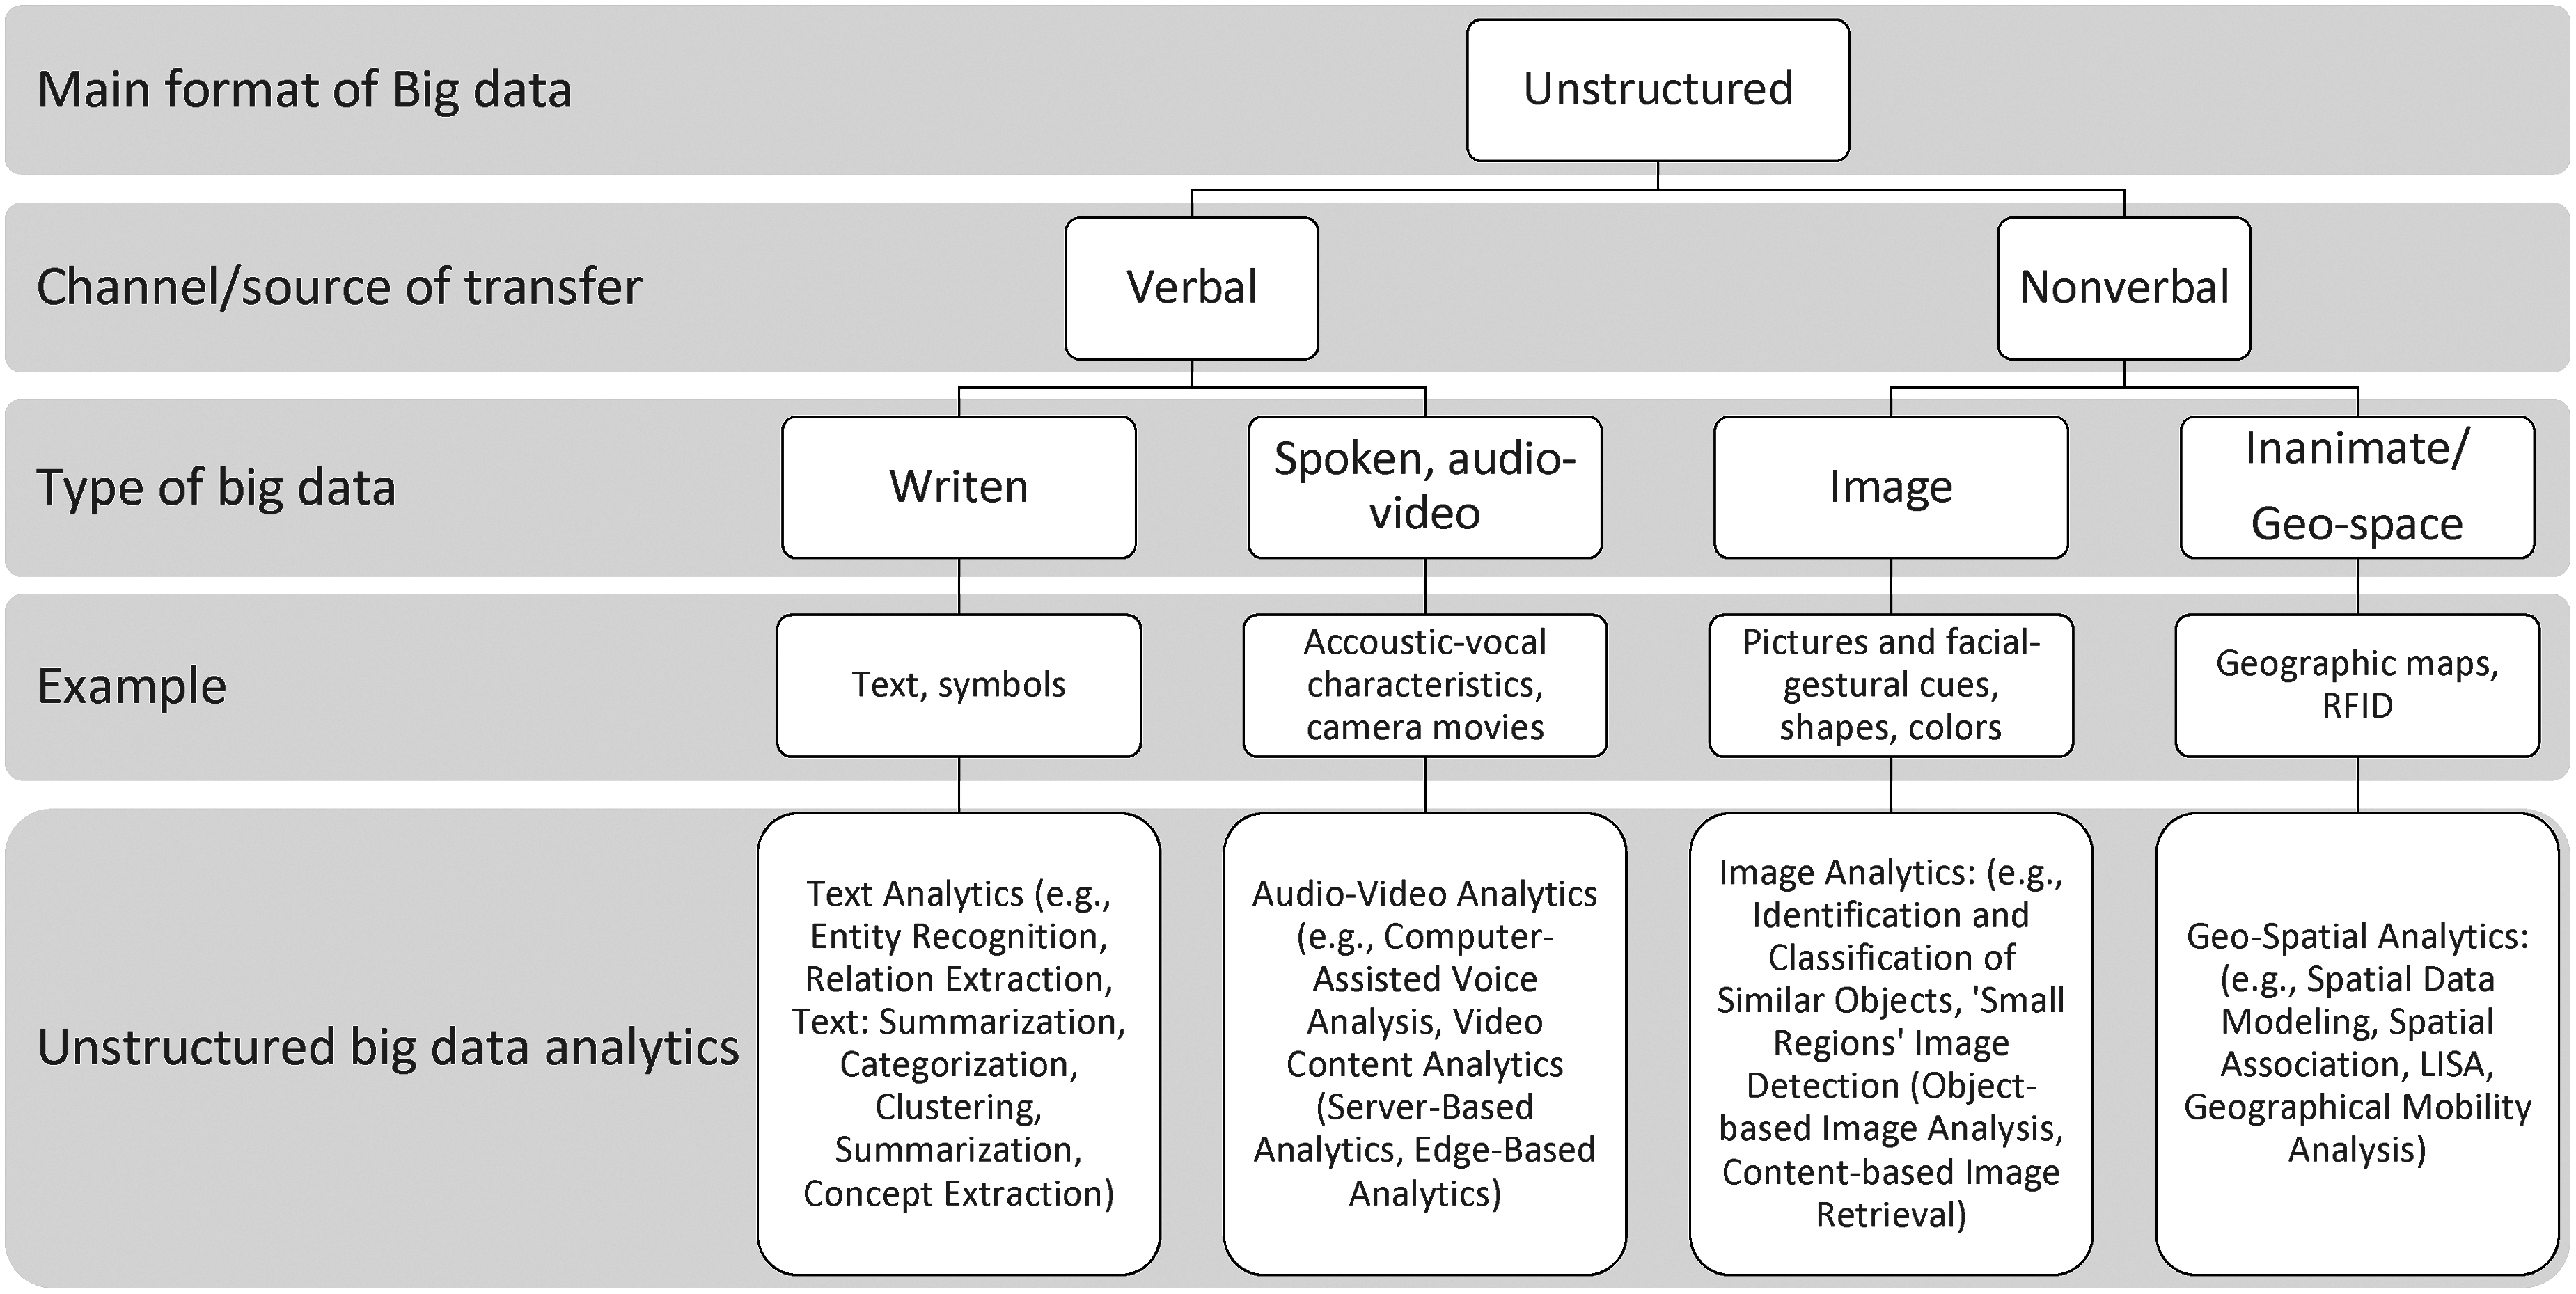
Model presenting analytical methods related to unstructured format of big data.
Text analytics
Most of the sources in the relevant literature 63 distinguish the analytical methods that relate to textual analysis regarding two general analytical approaches: named-entity recognition (NER) and relation extraction (RE). The NER strategy allows to identify atomic elements within text and classifies them according to predefined categories, for example, names, places, locations, and dates,64,65 whereas the RE finds and extracts semantic relationships between various entities in the text (e.g., consumers, shopping items, online comments, and advertisements). 66 Between these two methods, we can yet find a sort of “analytical binder” called Text Summarization, which produces a succinct summary of single or multiple text documents with the resulting summaries usually conveying key information from the original text.67–69 Note that by referring to textual analysis, we should mean the process of deriving meaning from text data through analytical tasks such as text categorization, clustering, summarization, and concept extraction. The examples of such analytics in business and marketing research areas can be numerous.70,71 For instance, Yuan et al. 72 tested an analytical solution for quick detection of the most important text messages—posts released by users on a social media network (e.g., via Twitter), what has proved to be particularly attractive in the analysis of large-scale “User-Generated Contents”—disseminated by consumers. 73 Firms can also use the UD to capture marketing insights by considering not only what consumers post but also how they interact with preexisting text content. 74 For instance, text analytics can show that, consumers' reviews with explicit endorsements (e.g., overt product recommendations), as opposed to implicit recommendations (e.g., stating that the product has high quality), are more likely to result in purchase compliance. 75
The other yet examples of applications of unstructured (textual) data and analytical methods by firms in the areas of marketing can be as follows. For instance, firms can investigate their return on investment levels associated with online search advertising in the context of the most effective keywords used by consumers. 76 They can also diagnose their brand position 77 by exploring the content, content–user fit, and the user influence on a social media platform, 78 as well as the extent of social tags via online content, which are indirectly informative of the brand value and brand performance. 79 Companies can also use the UD to reveal how consumers extract information from specific brand attributes, which means that they can determine which attributes of the brand/product create value for them. 80 However, firms can produce the aggregated consumers' preferences for product attributes, shared by them in online product reviews (including “pros and cons” of products), through the creation of a custom classification algorithm, which relies on text analysis. 81 Therefore, one avenue worthy of pursuing in the marketing is consumer profiling, or the summary of their interests and preferences revealed through online activity, 82 which may be critical for tapping the full potential of unstructured BD.
Audio–video analytics
Another type of unstructured analytical method relates to audio–video data.83–85 These data typically reflect information derived from the acoustic vocal signals, words spoken, or visual information, such as videos. As a consequence, data analysis needs to focus on various facets of providing unique information, as each of these facets conveys marketing information about the speaker and/or simultaneously viewed person (e.g., affective state, persuasiveness). For example, the video-sharing websites such as YouTube enable the uploading of various video materials, consequently allowing companies the mining of consumers' unusual behavior86,87 by analyzing their facial expressions and body movements, including smiles, gazes, pauses, and tones of voice. 88 In this variety of data, we should distinguish two general approaches in data analysis: one based on audio (voice) and the second supported by video sources—although both approaches often mix each other. Regarding the first analytical option, for example, computer-assisted voice analysis, 89 the marketing information can be extracted from speech sounds/consumer voices, whereas the analytics can investigate the nonverbal content of the speech of consumers (e.g., pitch, speech rate) in the form of prosody and source measures. 90 Consequently, the audio cues obtained on their basis can be diagnosed in different research contexts (e.g., in the ads) to test the success of marketing information transmission. Moreover, by using this type of analytics, firms can investigate on how actors' (e.g., salesperson's) voice pitch affects customers' emotional responses, 91 consequently such information can be extremely useful in the examination of the salesperson's most preferred voice pitch, influencing her/his efficacy in direct contact with the customer in the shop. 92
On the other side, video content analytics (VCA) allow firms to explore the consumers' nonverbal behavior, for example, their typical movement areas during shopping, time spent in-store and movement patterns therein, and queues in real time, including the time, which consumers spend in different parts of a given shop. 93 The VCA appear also to be of great importance in marketing campaigns conducted online (e.g., in examining consumers' reactions to ads placed online),74,94,95 where the insights provide firms knowledge and allow to select the most effective advertising designs across prospective groups of consumers. 96 The VCA plays also significant role in personal selling and direct marketing. In this regard, we should distinguish two general VCA approaches 85 : server-based analytics (SBA) and edge-based analytics (EBA). With the SBA, the UD can be captured, for example, through cameras installed in-shop and routed back to a centralized and dedicated server, which performs video data analysis. In contrast, with the EBA, UD can be analyzed at the “edge” of the system—that is, the video data analysis can be performed locally and on the raw data captured by the camera in the shop. By using such analytics, firms can develop, for example, measures of performance for the service personnel in given shop and improve their performance and communication with consumers. Indeed, they can provide sales staff specific behavioral hints (e.g., walking speed 97 ) and consequently influence the sales people's contacts with consumers in a store.
Image analytics
Next line of the unstructured analytical methods relates to image data processing98–100 and can range from the simple reading of bar-coded tags to more sophisticated identification of specific consumers' facial characteristics taken from digital pictures,101,102 assuming the perspective of the pattern recognition theory. 103 In general, the process of extracting marketing information from images, as well as recognizing meaningful patterns from images and grouping similar images, may occur through different ways. Here, we focus on the three analytical approaches, 104 where the first approach regards the condition or identification of an object or class of similar objects according to specific parameters (e.g., a consumer's face), whereas the second connects to the process of detecting the so-called “smaller regions” within the images, analyzed by more computationally demanding techniques, which produce an even more accurate interpretation of the image content. In this regard, contextual information in the images (e.g., relationship of nearby pixels) can be used for their categorization, whereas in an alternative solution, one can apply the less-granular image classification approach, using object-based image analysis (such that groups of pixels of different shapes and scales classify the images). 105 Finally, the third mentioned analytical option pertains to content-based image retrieval, and its goal is to identify similar images in a larger set of images, which have specific types of content. This analysis can be characterized in terms of the searched similarity relative to the targeted image (delivery of images with high level of similarity to given image) or in terms of criteria within the input data (e.g., delivery of images which contain only houses, which are photographed during winter, and which have no cars in front of the house).
The examples of image analytics in marketing research can be as follows. For instance, Kim and Kim, 101 by using data about social media users' characteristics (i.e., personality traits and gender), combined with information from photos taken (color features), have proved that consumers who are similar in their characteristics exhibit similar style in their uploaded social media photos. However, Bellman et al. 98 by using consumers' images compared the “genuine smiles” of consumers with their responses to advertisements. In particular, they investigated whether consumers' smile responses can be predictive of advertising success for the company. Also, Xiao and Ding, 106 in a study of print advertising, tested the facial images of consumers in the presence of advertisements of specific brands, finding that these images influence their brand attitudes and purchase intentions. Moreover, Landwehr et al. 107 examined the consumers' product (i.e., car) aesthetic preferences by calculating the mean position of different points on images taken of the cars on sale. And as they revealed, consumers prefer typical designs of cars at low exposure levels, but atypical designs at high exposure levels. Finally, the examples based on the image analytics can be related to: the impact of photos on the perceived helpfulness of an online review 87 ; nonverbal mimicry of the customer's face and its influence on the increased/decreased desire to return to the store 108 ; nonverbal cues informing shop managers of a salesperson's ultimate sales performance, or those connected with the salesperson's display of nonverbal facial and gestural cues, influencing the query handling effectiveness in given shops.
Geospatial analytics
Finally, among the unstructured methods appear those which can be related to geospatial data,109,110 although such data also reflect semi-structured formats. 32 In its essence, geospatial analysis is said to provide firms with insights as to how consumers behave in specific locations (e.g., according to extracted information involving data such as geographical splits and the saturation of colors presented on maps), as well as to enable the recognition of their intrinsic degree of uniqueness to the rest of the consumers in the spatial system.111,112 The associations among the consumers can usually be captured with various spatial statistics: spatial association, local indicators of spatial association, the G statistics,113–115 or geographically weighted regression,116,117 while artificial neural networks largely improve the robustness of spatial data modeling. 118 As a consequence, these analytics provide opportunities for companies to map the geographical mobility and activity of respective groups of consumers, including the prediction of their future locations (e.g., when business organization wants to find out whether or not to advertise a particular service in the area as well as to find out where respective groups of consumers live). Obviously, with the assistance of modern IT and the era of mobile devices with geographical information systems, a greater level of precision within such analyses is becoming much more feasible. 37 Thus, geospatial analytics provide a great level of richness for the results obtained from any spatial data set and, consequently, should be particularly useful in the areas related with marketing campaigns and promotions conducted online, including business logistics and real estates. 119 For example, Luo et al. 120 explored the effectiveness of mobile promotion by using geographic data gathered through microchips in users' mobile phones to calculate their distance from a retailer. As they found, the geographical targeting of consumers is likely to increase sales, but this relationship is contingent on temporal targeting. In other words, sending mobile promotions to consumers physically near a local firm has strong face validity, but research also notes that a local firm can avoid profit cannibalization by sending mobile promotions to consumers near a competitor firm, thereby capturing additional consumers and creating incremental sales. 121
Conceptualization of Model Exploring the Unstructured BD Analytical Methods
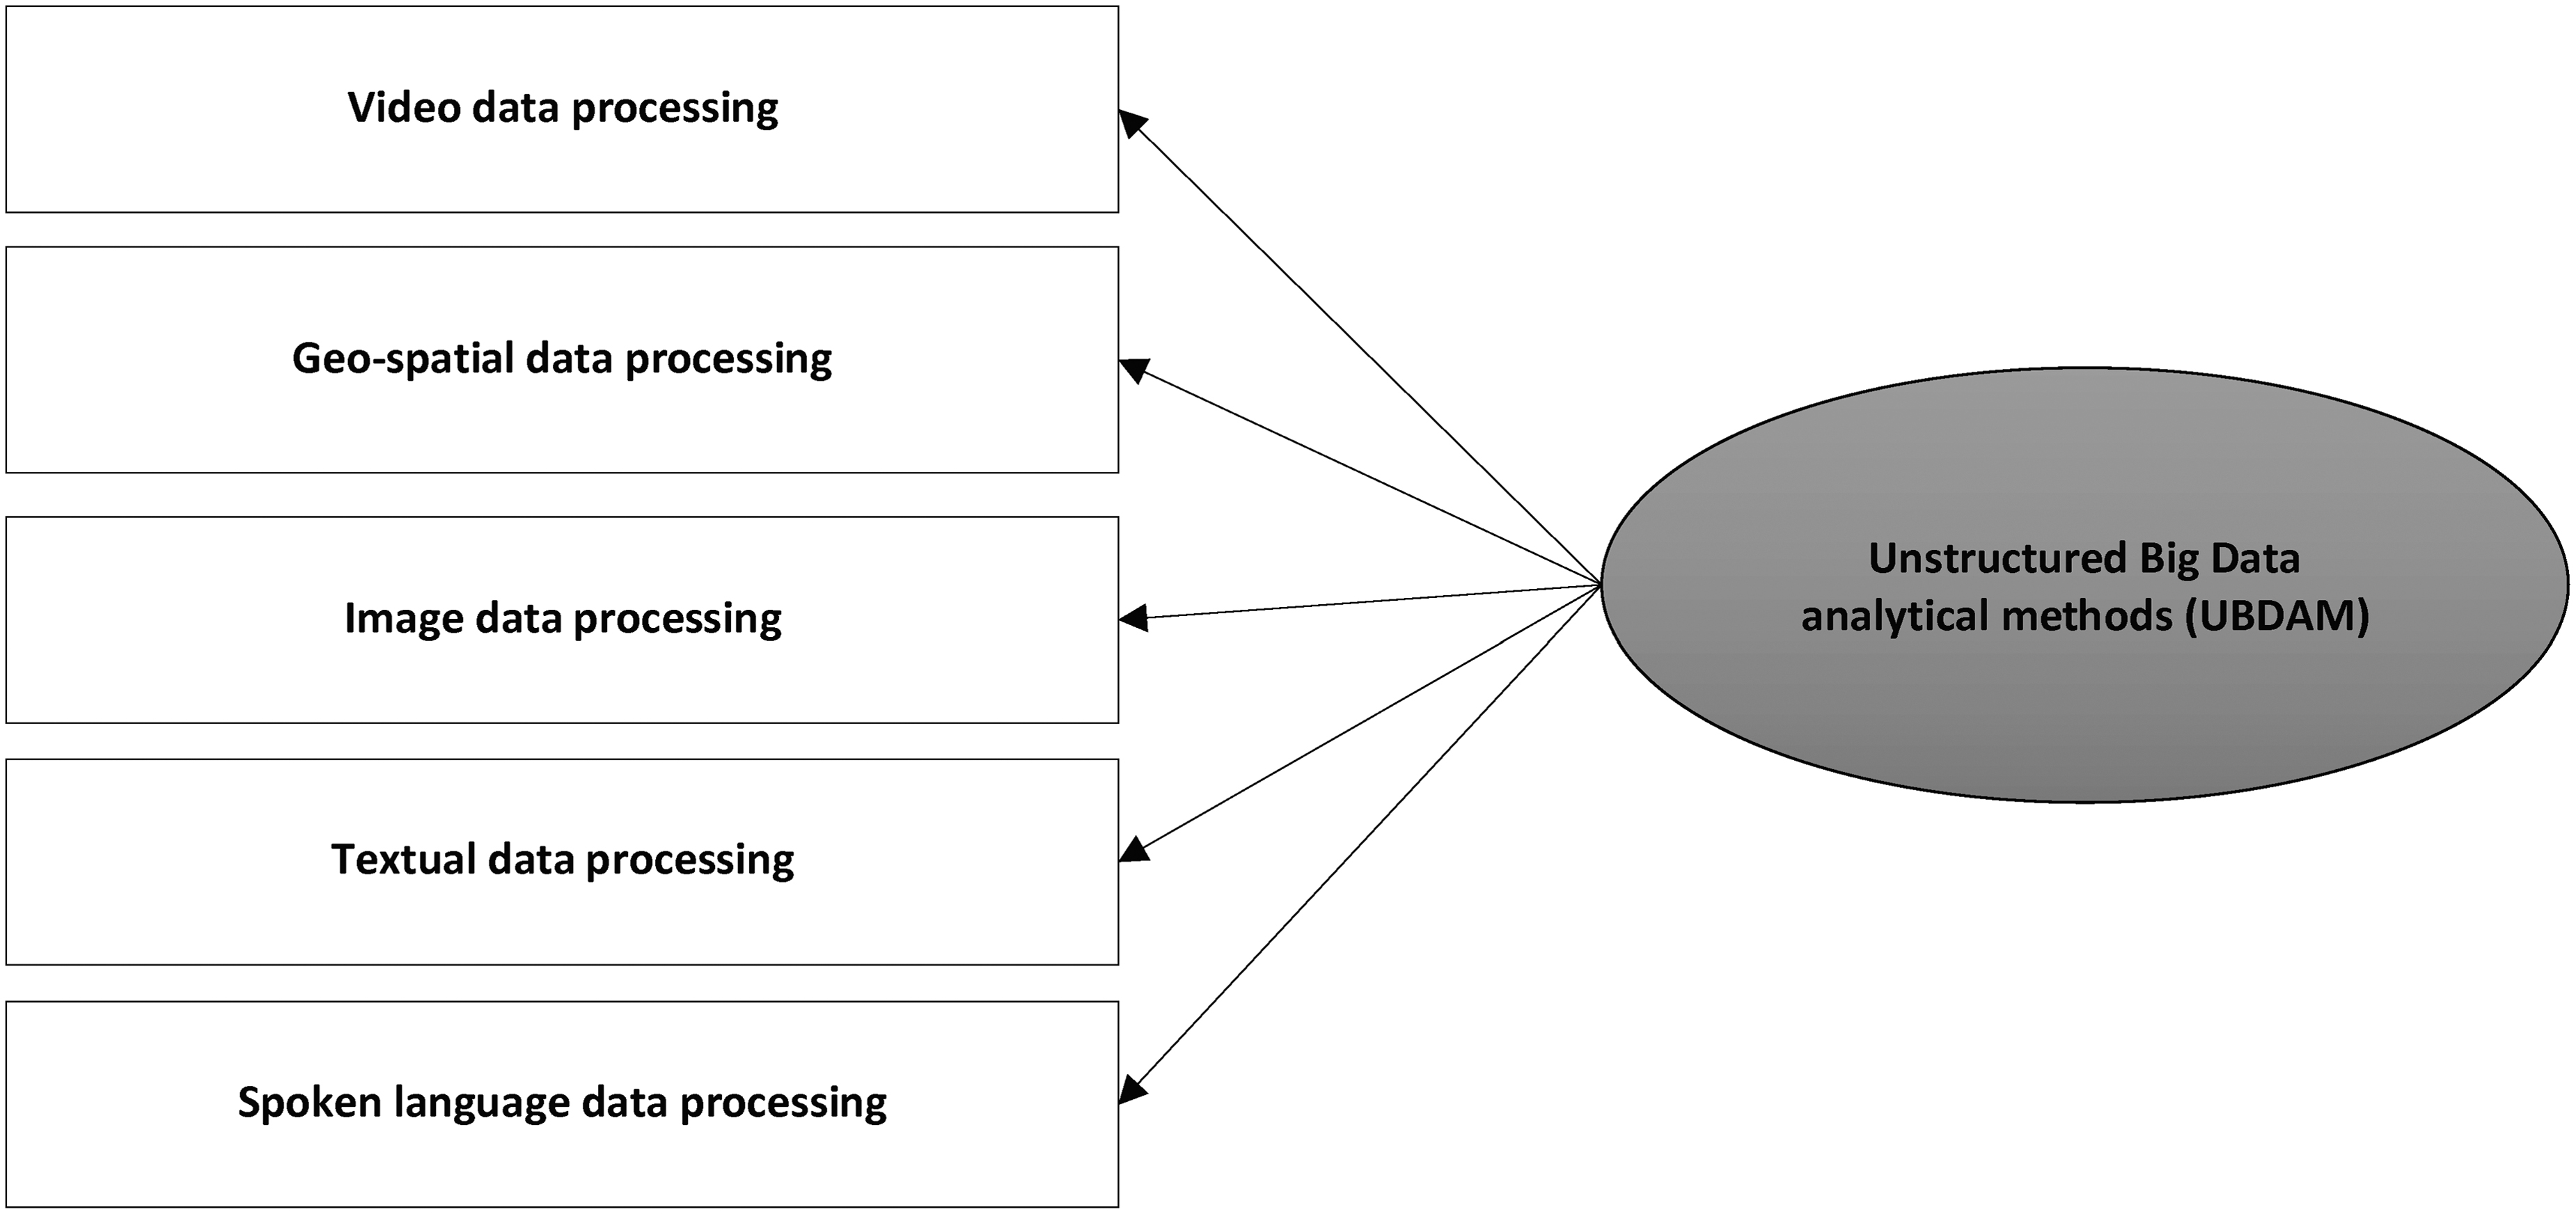
Given the theoretical and unquestionable practical importance of the UD,25,29,50,55 in this section, we present the conceptual configuration of model, that is, the construct that empirically measures “the analytical methods related with processing the unstructured data” in firms.25,50,122 The reason is that prior research focused so far only on random and very general attempts12,18,19,123 as well as selective, mostly theoretical, approaches to the substantive understanding of the unstructured analytical methods related to BD.22–24 Indeed, most of these researches have not comprised a complete picture of UD, that is, the holistic conceptualization and classification of these methods on the basis of a measurement model developed (Fig. 2) that would be tested empirically among representatives of firms.20,124 Although we have study of Gandomi and Haider, 23 which distinguished three general types of unstructured analytical methods (based on text, audio, and video data), this work omitted the other relevant types of analytics. However, works of Balducci and Marinova 22 or Wedel and Kannan 24 comprised solely of a literature review without yielding empirical evidence (i.e., measurable instrument) of the “existence” of UD and their related analytics within firm. Thereby, in this work, we propose not only coherent theoretical conceptualization and identification of UD analytics, but what is more important, the empirical test and measurement of these methods. In particular, we extend prior theoretical line of analytical methods discussed by Gandomi and Haider, 23 by adding two significant analytical strategies based on image- and geospatial data, as already mentioned in theoretical work of Balducci and Marinova. 22 As such, we generate a comprehensive picture of UD and redefine the most important analytical methods associated with UD in companies. Note also that most of the previous data processing analytical strategies, defined in the literature, concentrated largely on structured formats, 18 and although the structured data analytics proved to be successful in business intelligence,49,125 these analytics simply do not work well when it comes to UD.16,18,19,29,55 To prove the usefulness of model of unstructured analytics in business context, we investigate the extent to which the unstructured analytical methods (beside the structured analytics) contribute to the FP. Thus, we contribute to the resource-based theory of the firm, which previously focused on the relatedness of FP and BD analytics capability.27,28
Overall, our study combines prior, loosely scattered works in the literature, as well as provides empirical evidence on new analytical approaches, being implemented in firms. The conducted study broadens not only theoretical horizons but also advances on the ground of conducted empirical diagnosis, practical understanding of the UD analytics within firms. By redefining specific characteristics of the UD analytics and developing measurement model, we believe that the results will be useful in discovery of new research directions in the future, as well in exploration of various business and marketing activities. As Moorman and Day explained, “the present scientific knowledge and practice of research embraces more and more digital, social, and mobile data. Consequently, the nature of data/information use needs reconsideration in order to determine whether traditional data/information can be successfully replaced by more sensitive process measures.”6, p.7
Finally, by assuming the substantive contribution of this work to theory, we state the following research question: which of the advanced analytical methods, according to postulated conceptual model (Fig. 1), will relate to the UD to a greater extent? In this regard, we follow the arguments of Fan et al.1, p.293 who claimed that: “there may appear unique computational and statistical challenges in BD analytics, but the question is, are they all equivalent in the unstructured data analysis?” In this context, by configuring model comprising five general analytical methods (the processing strategies), based on five data types as video, image, text, audio, and geospatial, we put it to test in terms of the level of structural convergence and consistency, accordingly to the latent variable theory: 126 confirmatory factor analysis (CFA) and multigroup confirmatory factor analysis (MCFA).
Post hoc Diagnosis of Model Based on Two-Communities Theory
The postulated general model was also diagnosed (via MCFA) from the perspective of the two-communities theory 31 within the framework of firms, that is, data scientists and marketing researchers, with regard to their perception of the analytical methods related to processing UD formats. The first community (data scientists) perceives themselves as strong individualists and experts in processing mainly quantitative data, with quantitative-oriented competences, whereas the latter (marketing researchers) considers themselves as experts from the qualitative data field, focused on research processes and methods of extracting meaningful information from data in various managerial and marketing contexts. In general, by referencing data scientists, we refer to the community which has emerged in response to trends in BD.2,127 Although a definition of this group is still formally insufficient, it is suggested that128–130 data scientists are capable of handling all analytical challenges that are novel to firms, which means that they can be perceived as experts from proficient implementation of quantitative and qualitative methods, which solve relevant problems for organizations.43,131 Their role is to sketch, orchestrate, and control the discovery process of data, while the leading paradigm in these processes is to identify information, which meets certain needs of the organization. 132 However, marketing researchers are deemed the experts within the methodological works,30,133–136 and consequently, they focus on selected or specific parts of the methodological market research processes. 137 Data scientists, as opposed to marketing researchers, combine information knowledge, computer science, or strict mathematical competences, including analytical and quantitative skills, with specific knowledge within domains in which organization carries specific market operations. As Costa and Santos argued138, p.726: “data scientists extract value from data and create state-of-the-art data artifacts that generate even more increased value. Thus, a significant part of the knowledge base and skills set of data scientists are related with ICT competences/skills, including programming, machine learning and databases. The data scientist is simply seen as a multi-disciplinary profile, combining contributes from different areas, such as computer science, statistics and mathematics.”
Given the above, we argue that both organizational communities may slightly differ in perception of the analytical methods related to processing of the UD, despite the fact that works/duties of each group are in practice interrelated, and marketing researchers and data scientists often interact, within the range of the same market projects.43,128,133,138 Data scientists due to held positions within organizations and mainly technical knowledge of BD analytics 132 may expose a more coherent perception of the analytical methods processing UD than marketing researchers. Although, in this work, we do not put the efforts and commitments of marketing researchers in question, they play their own specific role in acquiring important information for the companies134,139 by using traditional research methods, channels of data collection, and information generation. To verify all these assumptions, we conducted multigroup invariance analysis (MCFA). The next sections present research methods and development processes of the measurement model, as well data collection and the results of conducted empirical analysis.
Research Process and Methods
The conceptual approach to theoretical construct measuring “the analytical methods related with processing of the unstructured data,” including the research process, was based on positivistic foundations theory, according to which we assumed that the world of investigated phenomenon must be expressed in terms of high quality of measurement to reach its objective level of reality, both in reference to the process of model development and empirical data collection.140–142 With these assumptions in mind and having prior literature review, we conceptualized the model first, developed general list of survey items next, and then tested measurement model, implementing analytical strategies based on CFA and MCFA as well as structural equation modeling (SEM). In other words, the entire research process consisted of the following interrelated stages: desk research (literature review), preliminary development of a list of items (examined in-depth by highly experienced data analysts and marketing researchers in firms, and academics), and the main quantitative study. Details of the survey and measures (items) used in the model are described next.
Measures within postulated model
Since the literature lacks precise information about the empirical contents of particular measures, which could prospectively be used in research pertaining to unstructured analytical methods, in this study, we propose a completely new list of measurement items. Note that to ensure the comprehensiveness of the items within the range of proposed model, we conducted first a literature review on the types of unstructured BD and related analytical methods; they were classified and briefly characterized in previous sections. After that, we conducted qualitative in-depth interviews with business organizational representatives, as well as academics and examined the conceptualization and item contents presented initially in model. “Candidate items” for the survey were “screened” by 10 professionals (5 marketing researchers and 5 data scientists), as well as by 10 academics who focused on the evaluation of their content validity. Among the selected experts, only those who had experience in the areas of BD, business analytics, statistics, database and IT infrastructure development, and marketing research methodology were invited to review the list of items. Note also that experts were first asked to define the UD and provide a list of related analytical methods. Based on this, we obtained in-depth guidelines for necessary modifications of the survey items. Furthermore, the updated survey items were reviewed once again by the same group of people—but this time, we conducted focus group interviews. Based on their judgment, minor adjustments (e.g., the order of items, positioning in questionnaire) in the final instrument were imposed. Next, we proceeded with the main quantitative study. Note that the entire process of development of these measures/items was conducted over a 5-month period before the main quantitative study began. The rationale behind these analyses came not only from commonly accepted procedures in their development but also from the rules of securing a high quality of measurement. 143 The effect of this process was that we were able to obtain a general configuration of the model consisting of five general items (indicators) measuring analytical methods pertaining to UD (Appendix A1).
Sample and data collection (main study)
Having generated final items (measured on 7-point Likert scales), which were associated with the postulated construct and model, we then placed them in a cross-sectional international survey conducted online. Answers were collected from representatives of selected firms among the experts, such as data scientists or marketing researchers who obtained educational background in three different areas: Economics–Business, Sociology–Psychology, and Mathematics–Statistics–Computer Science. In classification of particular respondents to respective groups (data scientists or marketing researchers), we used two questions, namely: we asked first about the job position (job title) of given respondent in the company, and next, we asked about the educational background and experience. Note that in the literature, surveys are still perceived as a very effective methodological approach.144,145 Particularly, Ansolabehere and Schaffner 146 recommended applying the survey research for explanatory theory, to ensure greater confidence in the generalizability of results.
A field study was conducted between October and November 2019, and the process of choosing the appropriate respondents for the sample was conducted with the use of simple random sampling approach. Respondents were enrolled in the study via database of the LinkedIn network, which usefulness resulted from the fact that it has included in-depth personal information about each of the respondents, taking into account different occupational groups. Note that of 1250 e-mails (invitations) sent to potential respondents, 356 answered (28% response rate). Table 1 summarizes the distribution of surveyed respondents and firms in terms of their industry category and the respondent's individual position.
Respondents according to their education and held position in surveyed firms
N = 356.
Data analytical strategies
The targeted model was part of the analytical strategies selected by us, based on the latent variable theory (i.e., the EFA and CFA, SEM, and MCFA), 126 pertaining to data collected from the main quantitative study. And since these data might affect further processes of estimation, we decided first to verify all items within the proposed construct in terms of meeting the normality assumptions. 147 In particular, we investigated the level of skewness and kurtosis, dividing their unstandardized values by the corresponding standard errors. Based on this, we generated the ratios that were interpreted as the z-test of skewness or kurtosis, respectively, namely the ratios >1.96 which indicated p-values <0.05 and those >2.58 which indicated p-values <0.01, proved greater skewness or kurtosis in the data. Next, we evaluated the measurement model (i.e., its measures) in terms of reliability. In this process, we implemented three coefficients: Cronbach's alpha, composite reliability (CR 148 ), and the average variance extracted (AVE). All evaluation was performed in the total sample.
Next, we conducted exploratory factor analysis (EFA), investigating the structure of postulated model and then employed CFA to test its structure. However, to improve process of factorial testing,149,150 we used EFA and CFA separately within the range of sample, by splitting randomly the data (N = 356) into two equal in size subsamples, where the first (NEFA = 178) was applied to explore the dimensionality of construct, while the second subsample (NCFA = 178) to confirm statistical significance of the factor structure using CFA. After that, we tested yet the predictive- and discriminant validity of model, by reconfiguring it for measurement part of the structural equation model (Fig. 3). In this context, we needed to avail of additional measures derived from the questionnaire. In particular, we used two measures (Appendix A1), where the first defined FP and represented the subsequent outcome of interest in the unstructured BD analytical methods; the FP was adapted from the following works.27,28 While, the second referred to structured big data analytics (SBDAM). Consistent also with the literature on FP,27,28 the FP measure was defined as the extent to which a firm generates superior performance with respect to its competitors. When considering predictive validity of model, we examined realistic applicability of the unstructured analytics in business context (i.e., FP), whereas by including measure of the SBDAM, we tested discriminant validity. Also note that, by implementing SEM, we were able to explore and compare the levels of two relationships: UBDAM→FP and SBDAM→FP.
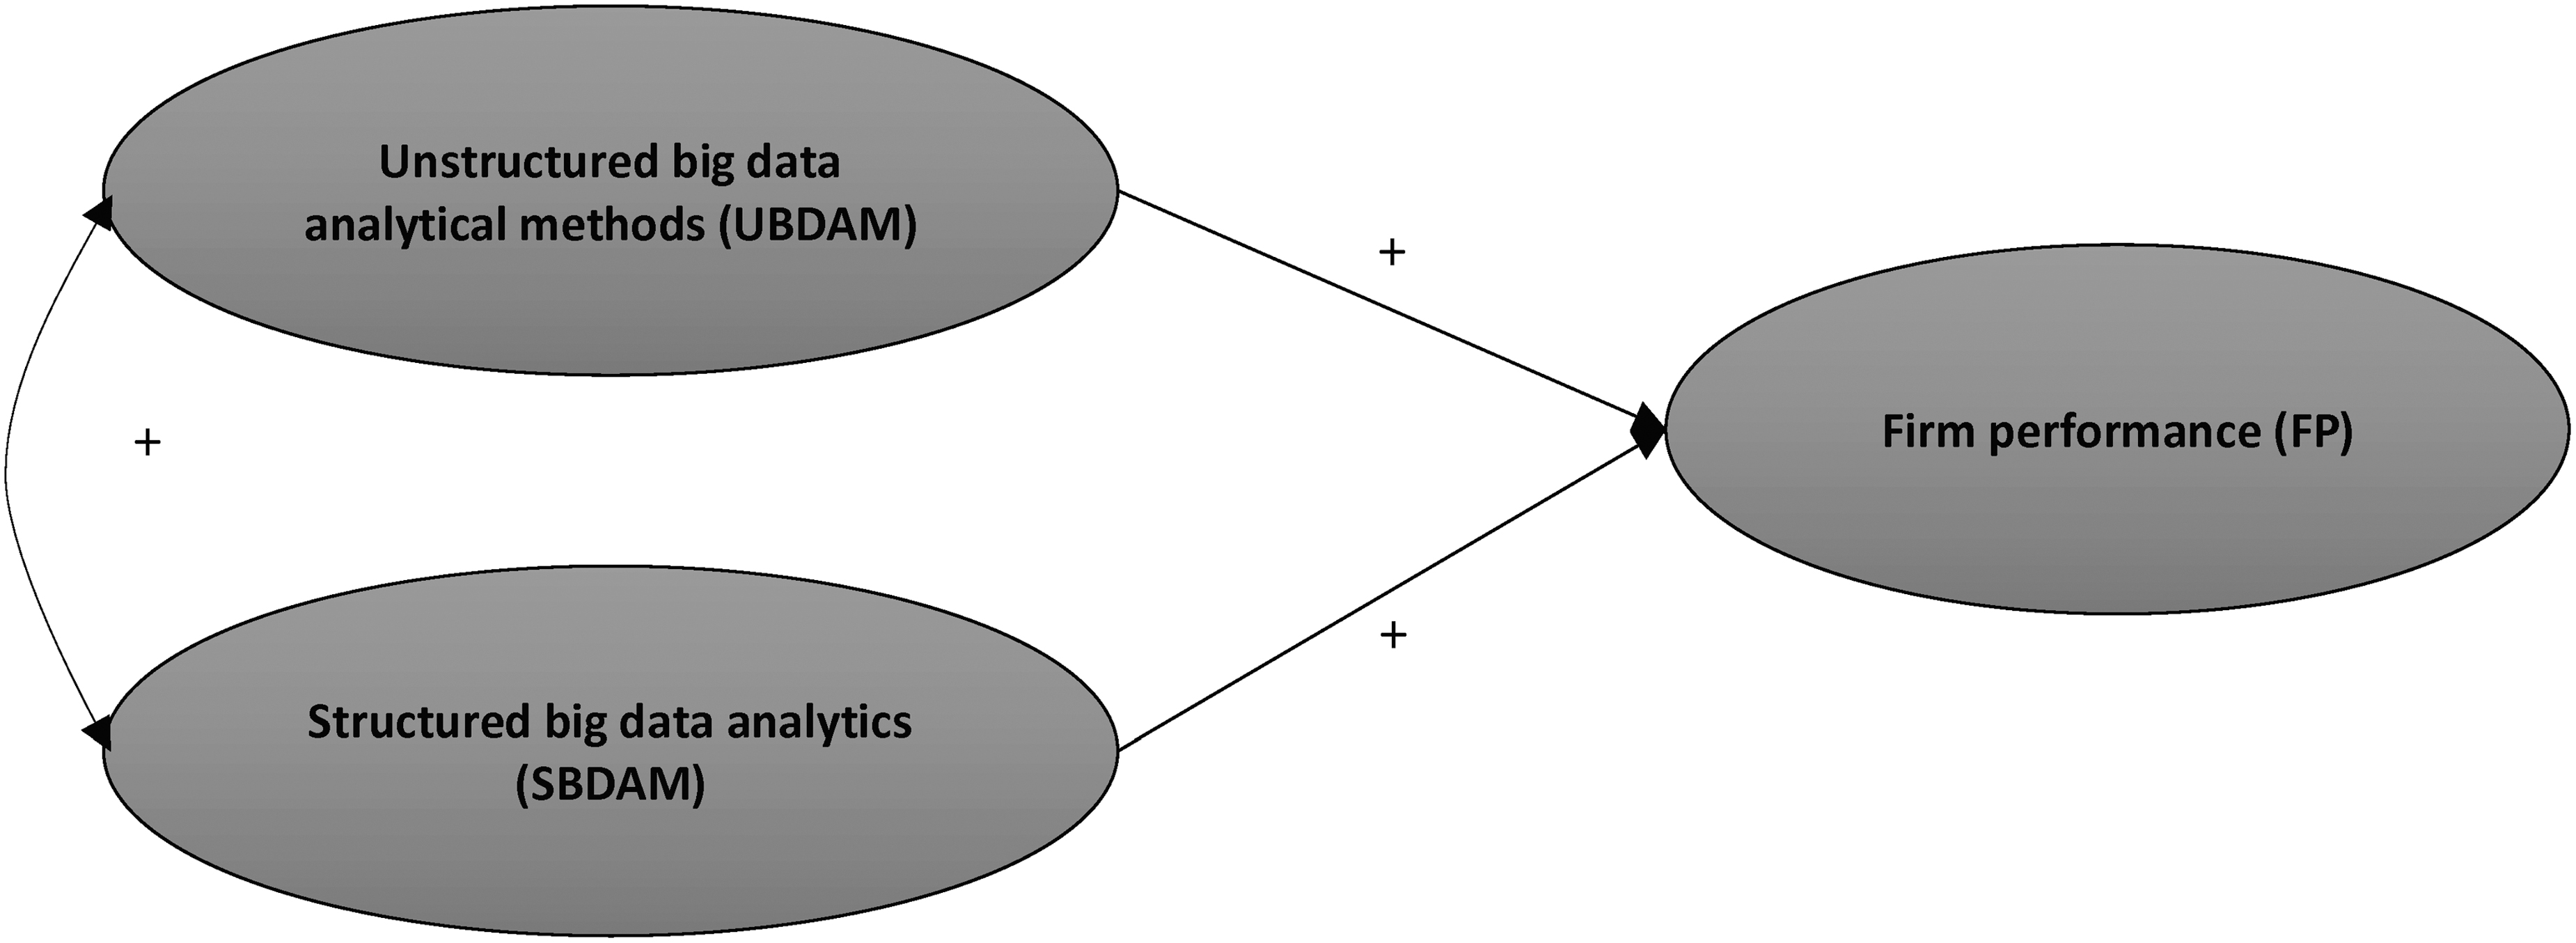
Model validation in SEM. SEM, structural equation modeling.
Finally, as ensuing post hoc analysis, the multigroup analysis (MCFA) allowed us to investigate perception of unstructured analytical methods between two organizational communities (i.e., marketing researchers and data scientists). With MCFA,151,152 we explored the model's variance between data scientists (representing Group 3) and marketing researchers (Groups 1 and 2). As such, we first investigated the configural structure of the model and then proceeded to test its metric and scalar invariance. The implemented strategy followed a stepwise procedure recommended in the relevant literature, 153 in the course of which a more restricted version of the CFA model was nested within a less restricted solution. Note that, all tests were carried out in sequence (for more technical details, see the works of Refs.154,155). All calculations were obtained in AMOS and SPSS software. They are discussed in subsequent sections.
Research Results: Phase 1 (Total Sample and Split-Sample Based)
Quality of measurement items
As observed from Table 2, all items did not exceed the critical ratio level of 1.96, and they borne acceptable range of values. Also, Mardia's coefficient 156 indicating on multivariate kurtosis, was of 0.603 with a critical ratio being equal to 0.184 was thus far below 1.96, proving the adequacy of the items under consideration in terms of the normality assumptions.
Quality of theoretical construct and particular items evaluated in study
N = 356; construct UBDAM with the following items: UBDAM1; UBDAM2; UBDAM3; UBDAM4; UBDAM5. Values obtained at the level of total sample (N = 356).
AVE, average variance extracted; CR, composite reliability; UBDAM, unstructured big data analytical methods.
Results (presented in Table 2) also indicate the adequate level of the AVE coefficient (0.527), and another coefficient (CR), for the CR indicated values exceeding the level of 0.70. The same regard the Cronbach's alpha coefficient, which exceeded the recommended threshold value of 0.70. Finally, as the indirect evidence of good quality of relationships between respective items and theoretical construct, 126 are the values of factor loadings (Fig. 2) along with their standard errors and t-values (Table 4).
Regression weights, intercepts, and variances in confirmatory factor analysis, structural equation modeling, and multigroup confirmatory factor analysis
0.001 level (two-tailed).
Subsample (n = 178) derived on the basis of random split of total sample (N = 356).
Denotes selected item that was used to identify factor.
Total sample.
E-B, Economics–Business (Marketing researchers, Group 1); M-S-CS, Mathematics–Statistics–Computer Science (Data Scientists, Group 3); RW, regression weight; S-P, Sociology–Psychology (Marketing researchers, Group 2); SRW, standardized regression weight; St.E, standard error.
CFA, confirmatory factor analysis; FP, firm performance; MCFA, multigroup confirmatory factor analysis; SBDAM, structured big data analytics; SEM, structural equation modeling.
Dimensionality and testing of model
Next, when we investigated the dimensionality of postulated model on the basis of EFA (with principal axis factoring and varimax rotation, to be precise) according to the first, randomly extracted sample (NEFA = 178) from total sample (N = 356), we noticed that model has proved to be of unidimensional structure for all considered items (see Table 3 with respective factor loadings), while its general statistical fit to data, being tested with the second random sample (NCFA = 178) through CFA, has yielded satisfying results:
Factor loadings derived from exploratory factor analysis
Subsample for EFA (n = 178) derived on the basis of random split of total sample (N = 356).
EFA, exploratory factor analysis.
Goodness-of-fit statistics for tests in confirmatory factor analysis, structural equation modeling, and multigroup confirmatory factor analysis
Subsample (n = 178) derived on the basis of random split of total sample (N = 356).
Total sample.
AIC, Akaike Information Criterion; BIC, Bayesian Information Criterion; RMSEA, root mean square error of approximation.
Model validation
The result of SEM has yielded satisfying results:
Finally, to check discriminant validity of model, a correlation between UBDAM and SBDAM was estimated via SEM. Note that according to Mikalef et al. 159 business analytic methods, whether they relate to the structured or the unstructured BD, are not mutually exclusive; both approaches are intertwining (i.e., support each other) in business applications. We consider this assumption as true, however, given different nature of the structured- versus unstructured data, as well the specificity of algorithms and processing strategies applied within particular analytical methods (see past sections), both analytical approaches should display conceptual distinctiveness, and conversely, in terms of business applications, they should expose relatedness proved by the minimum level of correlation. Thereby, the UBDAM↔SBDAM coefficient is expected to be lower, but still significant, what confirms SEM, 0.267 (Table 4).
Research Results: Phase 2 (Post hoc Diagnosis on Groups)
The confirmed adequacy of the configuration of items within the postulated model, allowed us to conduct post hoc analysis across three distinguished groups (respondents with educational background in Economics and Business, representing Group 1 = E-B; in Sociology and Psychology, Group 2 = S-P; and in Mathematics–Statistics–Computer Science, Group 3 = M-S-CS). The obtained results (Table 5) for each separate group show the following model fit indices: G1:
Next, we proceeded with the second phase of testing: metric invariance, assuming the equality of factor loadings across the three distinguished groups, while the intercepts were still allowed to differ. In particular, we were interested in whether or not all groups attributed the same or different meaning to the theoretical construct. Results indicated that the model was still a good fit [
Having been assured of the configural and metric invariance, we proceeded to test the assumption of a strong-scalar invariance (i.e., equality of item means), but here we faced small contrasting results regarding the goodness-of-fit statistics of the model. Indeed, when comparing the
Discussion of Empirical Results
Given all empirical results and phases of testing the CFA model in this study, we can now assume that the general pattern of fixed and free parameters was adequate. We confirm the configuration of postulated model and simultaneously claim that analytical methods related to UD formats, as observed in firms, are indeed composed of the data processing strategies based on data types such as video, geospace, image, text, and spoken language. The perception (i.e., based on estimated configural and metric invariance) regarding the construct measuring “the analytical methods related with processing the unstructured data” along with its initial factorial structure, is also similar across the groups being distinguished in the study; with a minor discrepancy regarding the equality of two item means (intercepts) of the measurement model, associated with UBDAM2 = “methods of geo-spatial data processing” and UBDAM3 = “methods of processing image data.” We inferred this fact from statistics explaining the goodness of fit of MCFA model. Besides that, theoretical model indicates high validity, as demonstrated by additional measures such as “firm performance” and “structured big data analytics,” which were used in further stage of investigation based on SEM.
Overall, theoretical construct has passed tests of configural and metric invariance based on assumptions of equal factor loadings and in terms of respondents' general understanding of the correctness of items placed in the model; it obtained adequate level of fit to the empirical data according to the specification and number of parameters selected in this study. Whereas in regarding to scalar invariance we can be less confident, but simultaneously cannot deny fact, that all respondents clearly comprehended the proposed conceptualization of model. The evidence for partial scalar invariance has yielded realistic, satisfying result, given fact, that strong scalar invariance is typically hard to achieve in most empirical research designs.153,154 As such, data scientists and marketing researchers in firms slightly differed at this point; the group of marketing researchers (with education in economics and business administration) rated items on average higher than researchers originating from sociological and psychological areas. The third group (represented by data scientists, in the following areas: Mathematics, Statistics, and Computer Science) lay somewhere in between. In sum, data scientists and marketing researchers assumed slightly varying levels in perception of UBDAM2—“methods of geo-spatial data processing,” and UBDAM3—“methods of processing image data.” As far as the other analytical methods were concerned (i.e., UBDAM1—“video data processing,” UBDAM4—“textual data processing,” UBDAM5—“spoken language processing”), all groups provided highly consistent views. Note still that all these results do not exclude the general configuration of the model postulated in this study and simultaneously theoretical construct, as the configural and metric invariance assumptions were fully met.
Implications for Theory and Practice
Theoretical context
The present work fills in the theoretical gap in the BD, management and marketing literature in terms of profounder understanding of the essence of UD and related to them, specific types of analytical methods. It advances our knowledge of the unstructured analytics, being implemented by firms in the context of the marketing researches,25,29,123 as well revises and extends the previous line of theoretical studies.22–24 Prior research focused so far only on random and very general attempts,12,18,19,53,123 as well as selective, mostly theoretical, approaches to the substantive understanding of the unstructured analytical methods related to BD.22–24 Also note that knowledge on UD types and analytics, specifically analytical methods, in the literature remained largely scattered. In consequence, the current study aimed to put them together into single framework, according to which we could present own, elaborated identification and classification of the unstructured analytics. Moreover, this work provided not only coherent theoretical conceptualization, identification, and classification of UD analytics but also the empirical test and measurement items related with these methods. In particular, it extended prior theoretical line of analytical methods discussed by Gandomi and Haider, 23 by adding two significant analytical strategies based on image and geospatial data, as already mentioned in the theoretical work of Balducci and Marinova. 22
In overall, in the present work, we tackled the following interrelated research issues. First, we explained the specificity of the UD. Concurrently, we reviewed the literature sources and conducted a unified synthesis as well provided examples of applications over the particular analytical methods within an organizational framework, what further allowed us to gain in-depth insights on the dynamic nature of UD methods and reveal their theoretical and practical richness. Next, we developed a conceptual model along with the measurement procedure of identifying analytical methods related to UD (i.e., the text, audio, video, image, and geospatial data formats). Based on this thorough identification, we conducted a series of statistical tests of model. Next, to validate model and approve its usefulness in business context, we investigated the extent to which the unstructured analytical methods, beside the structured analytics, contribute to the FP. Research proved the justified separation of the unstructured analytics from structured formats and extended our understanding of the firms' data analytical capabilities and the potential outcome. Thus, with this model, we contributed the resource-based theory of the firms, which previously focused on the relatedness of performance and overall BD analytics capability.27,28 Finally, as the post hoc analysis, we investigated the model from perspective of two-communities theory, 31 that is, the data scientists and marketing researchers according to two general distinguished job profiles10,138 in business organizational environment. 162 The general course of undertaken works was supported by the high-quality methodological process of development and testing of the model.
The postulated model has obtained a high level of adequacy in terms of measurement, specification, and number of parameters selected for the study; respondents comprehended well the proposed conceptualization of model, although it also showed some minor discrepancies (as proved by partial scalar invariance) between both communities,128,131,133 specifically in regarding two analytical methods related to geospatial and image data processing. Data scientists, due to different educational background and the possession of extensive practical and technical knowledge of unstructured analytics, held stronger perceptions than marketing researchers within organizations and therefore were more familiar with the specificity of unstructured analytical methods than marketing researchers. Note however that the latter group still showed awareness of these methods. Simply put, although researchers knew such methods exist and/or experienced their effects in organizations, due to specificity, were familiar with unstructured analytics mostly on the general ground.
To sum up, this study contributed to the interdisciplinary development of BD, management and marketing theories, based on the recently emerging organizational perspective related to research on big UD, by placing a strong emphasis on the explanation of the specificity of the UD, as well by identifying and classifying the key analytical methods implemented by firms, toward a better understanding of these data and their applications within market research context. Moreover, this work proposed a measurement model, composed of analytical methods associated with UD, which was further tested from the perspective of general sample and across two organizational communities: data scientists and marketing researchers. Thus, our research findings bring in-depth understanding of the UD. We believe that they will yield new opportunities for scholars and representatives from firms for acquiring knowledge within particular types of analytics, as UD allows for the capturing of new and relevant information that would be inaccessible with structured data.4,10 Admittedly, the UD and related analytical methods contain multiple promising characteristics. The nature of UD, for example, allows for the capturing of market phenomena that are nonnumeric. However, the multifaceted nature of UD leads to various possible combinations of conducting analytics for different research purposes. Finally, UD enable to uncover new market trends across the multiple facets of data (e.g., in understanding how they dynamically interact over time). In sum, if one moves beyond classical analyses of structured data, it appears that studies concentrating on UD offer larger benefits and informational values,1,9,55 consequently leading to greater progress in academia and solving practical issues related to the modern conception of managing firms by market information derived from UD. 5 These data, along with the carefully designed and selected analytical methods, open new research horizons for scholars, while for companies and businesses, they bring multiple added values163,164 that strongly determine their FP, operational and strategic directions such as: managing channels, personal selling and sales management, retail management, service management, connecting with consumers, brand management, product management, and design, to name a few. These practical aspects are discussed next.
Practical aspects
The issues tackled within this article bear also important practical implications for business organizations, as well as employees and managers who work for companies of all sizes.4,122,132 The development toward UD processing strategies, perceived from perspective of the BD and management as well as marketing research areas, including the companies' effective informational policy and market performance, should be viewed as a process of creating, delivering, and communicating extraordinary values and benefits5,9,90 within products and services offered by firms to consumers. The UD analytics, as related to specific market research projects conducted by firms, strongly determine the company's future, based on increased performance, competitiveness, and profits. These analytics decide whether or not companies can effectively communicate with consumers, and consequently, entail the desirable effects and market actions. In other words, the UD corresponds to a proper communication system of firms within markets, which can be expressed in terms of proper encoding and decoding the UD/information based on wisely selected analytical methods. In this regard, firms may, for example, advance their research by identifying specific vocal features of the human voice that influence the communication of value during message transmission (e.g., in advertising), consequently increasing the attention of specific groups and affecting message absorption. Moreover, by analyzing images used in mobile promotions (e.g., the level of vividness and consumer-content fit), they can elicit consumers' desirable responses, whereas by analyzing their vocal and facial cues (e.g., emotions conveyed through facial cues), firms can study to what extent the flows of nonverbal cues, conveyed in the video data, influence consumers' probability of going viral (an aspect of consumers' communication). However, in the context of personal selling and retail management, by analyzing UD such as the dynamic consumers' emotional responses (e.g., their facial cues), firms may test the salesperson's activity, that is, whether a salesperson in a shop continually monitors customers' responses and adapts accordingly. This analysis can also concentrate on the nonverbal gestural and facial cues expressed by consumers during sales interactions, which can shed light on whether matching or mismatching facial and gestural cues by a salesperson (e.g., smiling but with arms folded) enhances or diminishes customers' reactions and their inclinations to purchase. In addition, video data analysis can capture other important characteristics in the retail context, for example, based on nonverbal cues (product consideration), including the impact of social forces (group shopping, interactions). The unstructured analytics may also offer insights about the dynamic interplay of multiple facets (e.g., pathway movement of consumers; time of movement in shop), which may inform companies about physical areas of a store in which the traffic slows or accelerates. Finally, a high level of relevance of the UD analytics can be expressed in terms of better brand management, product management, and design. For instance, in the context of product design, UD can help companies evaluate product performance before market entry. However, these analytics can inform firms on how customers extract product information on the grounds of specific aesthetic preferences and evaluations of product attributes, which can suggest the best design strategies of organizations' products. Overall, the UD analytics yield plenty of unique insights into how firms might deliver value to consumers.
Given all above advantages of UD and their analytics, we can now infer that adapting and the proper handling of these data is no longer optional but is a necessary component of a contemporary research background and a competitive landscape for most firms. Firms that are more oriented toward the unstructured analytical methods and look into these data sources, simply win as they can obtain better productivity, FP than their industry peers. 9 Simultaneously, the more firms and their members will be familiar with the specificity of unstructured BD and particular types of analytics, the more confident they will be of their effective communication with consumers. Firms will also design better products and services, as well as be able to concentrate on their best promotional campaigns, adjusted to consumers' expectations and needs. The goal is the acquisition and control of methodological knowledge, as well as maintenance of know-how over the advanced analytical methods associated with unstructured BD. In other words, firms can engage in the UD analytics, provided they possess a sufficient level of know-how and competent human sources,10,48 for example, knowledgeable data scientists and marketing researchers. Given the results of this study, we believe that knowledge of unstructured analytical methods can be still “polished,” for example, by closer cooperation between these groups regarding the implementation of the most desirable analytical methods associated with a respective research project and extraction meaningful insights for organization. Both communities (i.e., the data scientists and marketing researchers, being responsible for a company's informational policy) need constant learning and sharing of their own analytical and research experiences to cooperate effectively for the prosperity of their organizations. They should learn from each other, combine their rare knowledge, skills, and competences. 132 In sum, the unstructured BD and modern analytical methods will have impact the way research and business is conducted in the future in multiple ways, but it also appears that firms will be contingent on the development of human resources, technical skills of the staff, constant learning processes, and mutual works undertaken by respective organizational communities.
Future Research
Future research should concentrate on whether all or just selective types of firms operating in specific industries can afford to pay sufficient attention to the appropriate use of analytical methods and to generate market information from UD, and whether this activity can lead them to the effective transformation of the unstructured contents into a well-organized repository of information and knowledge, given the firms' barriers in information management.80,139 However, in the relevant literature, it is still widely unclear how firms can organize themselves to effectively integrate the works of data scientists and marketing researchers, and how they can apply these multiple analytical approaches in transforming information and data into a competitive advantage. In particular, a promising research avenue would be the broader investigation of how unstructured BD and its analytics affect companies' strategies, business models, and related competitiveness. Creating, delivering, and capturing values will likely be different when more voluminous and complex UD will be available in the future, and thus, it is important to elaborate the implications of these developments more clearly, being adjusted to firms' strategies. Besides, future research might focus on UD in the context of their effective acquisition, storage, visualization, and decision-making processes in firms.46,163
Finally, further research may continue the measurement and comparative analysis within the perception of unstructured BD and related analytics, not only from the perspective of data scientists and marketing researchers but also from the perspective of other communities, associated with either business or science. Finally, it would be interesting to continue the research with regard to usefulness, ease-of-use, and the expected benefits of UD from the perspective of various members of a firm and its departments on different levels of the organizational structure of firms. We believe that these problems deserve elaboration but leave them to other interested scholars to pursue.
Footnotes
Author Disclosure Statement
No competing financial interests exist.
Funding Information
No funding was received.
Abbreviations Used
Appendix A1
General items retained in model, measured on 7-point scale ranging from 1 (strongly disagree) to 7 (strongly agree).
Items FP1 to FP7 measured on 7-point scale ranging from 1 (strongly disagree) to 7 (strongly agree).
Items SBDAM1 to SBDAM7 measured on 7-point scale ranging from 1 (the least) to 7 (the most).