
Abstract
At present time, an effective tool becomes essential to forecast business failure as well as financial crisis on small- to medium-sized enterprises. This article presents a new optimal feature selection (FS)-based classification model for financial crisis prediction (FCP). The proposed FCP method involves data acquisition, preprocessing, FS, and classification. Initially, the financial data of the enterprises are collected by the use of the internet of things devices, such as smartphones and laptops. Then, the pigeon-inspired optimization (PIO)-based FS technique is applied to choose an optimal set of features. Afterward, the extreme gradient boosting (XGB)-based classification optimized by the Jaya optimization (JO) algorithm called JO-XGB is employed to classify the financial data. The application of the JO algorithm helps to tune the parameters of the XGB model. A detailed experimental validation process takes place to ensure the performance of the presented PIO-JO-XGBoost model. The obtained simulation results verified the effectiveness of the presented model over the compared methods.
Introduction
In the past decades, the major requirement for deploying creative devices is highly applicable to small and medium-sized enterprises (SMEs) to predict business loss and economical faults. SMEs need business management to observe the modus operandi as well as to examine whether it is applicable to reach the defined objectives. These models are depicted over a sequence of firm's rules, and certain strategies are named as “controls,” which ensure the architecture of business management of an organization. Finally, the requirement is aroused for occasional audits. Therefore, the estimation and detection of business development is found to be complex task. It is significant to develop which serves as the examination of performance in an atmosphere like the economy.
Detection of the enterprise financial crisis prediction (FCP) is composed of main significance in financial decision-making. A business state of either maximum or minimum organizations is concerned with the local community, organizational candidates, and shareholders; however, it affects the policymakers as well as the financial global economy. Hence, several researchers have focused on the investigation of analyzing the reasons for corporate bankruptcies. Economical centers as well as organizations have showcased higher attention for predicting the economical error of a firm. FCP is one of the significant applications that help in economical firms for making optimal decisions. It is because of the inferior decisions taken from all organizations, which result in economic problems or bankruptcy and influence the shareholders, vendors, clients, and so on. The present development in information technology (IT) activates for accomplishing diverse data based on the risk level of a firm under various scenarios. At the time of estimating higher data, many users relied on analyst decisions. However, the factors affect the performance analysis.
Statistical as well as artificial intelligence (AI) methodologies were applied for finding the required aspects of FCP. Here, AI models are employed in diverse types. 1 It is used for constructing methods for validating the approaches whether the economical centers suffer from various problems or not. The major theme of this model is that economical attributes are extracted from common financial statements such as financial proportions that capture higher data regarding organizational state that is applicable for FCP. 2 It is referred to as a difficult operation, which exploits the interrelated economic data and alternate data from the organization's tactical competencies for processing data for developing the productive model. Additionally, the AI as well as database models, data mining (DM) methods, are used in diverse fields.
In FCP, DM approaches are applied in two ways, namely early detection methods and decision-making. It is applicable to make decisions for preventing the economical faults from an organization. In the case of deep analysis, there is a demand for higher processing time as well as resources. Then, for irregular data, it is highly tedious for computing data extraction. Thus, the task of filtering higher data is significant for identifying economical errors, specifically for FCP. Feature selection (FS) is defined as an important preprocessing phase in DM. It is mainly intended for filtering the irregular as well as repeating features from actual data. Here, it is identified that diverse numerical estimations and models are applied for handling FCP.
Based on the estimation condition, FS models are classified as a wrapper, embedded, and filter-relied. The wrapper model exploits the learning approach in the estimation task to verify the outcomes of the selected feature subset. Despite using the wrapper approaches, it experiences various problems such as maximum processing complexity and learner constraints. Incorporated models are composed of complexity than wrapper models as the selected feature subset depends on the learning model. Due to the existence of limitations, it has been applied with filter models. It is applied for computing the feature subset using permanent values instead of learners and chosen features. The problems of identifying best characteristics from accessible features are named as the non-deterministic polynomial-time-hard problem. 3 Diverse models are used for finding partial solutions within a limited period. Few machine learning models such as Ant Colony Optimization (ACO) and Genetic Algorithm (GA) have been employed for selecting desired features, and it is not suitable for the business sector, especially FCP. 4
Previous works
Green 5 developed a support vector machine (SVM)-relied ensemble method for FCP and compared it with the traditional SVM classification model. The accomplished results have illustrated that the SVM ensemble model surpassed the SVM classification approach. Lin et al. 6 exploited SVM with existing methods and pointed out that ranking a method differs according to the accuracy of Taiwan stock exchange data. The brief analysis of FCP is developed on 107 Chinese firms with the help of DM models. 7 The results show that neural networks is supreme for decision tree (DT) as well as SVM.
Recently, bioinspired models are used for solving classification issues. Uthayakumar et al. 8 employed ant miner to classify the economic data in qualitative as well as quantitative means. An effective improved boosting named FS-Boosting was deployed by Wang et al., 9 under the application of the FS model. The employment of the FS model in boosting results in accomplishing the best accuracy with massive diversity. The creative model of FS is projected in Lin et al., 10 which concatenates professionals' knowledge as well as the wrapper model. Initially, features in economic data are classified as seven sets, and wrapper application is applied for FS. The outcome illustrates that the proposed model is qualified for classical FS models with respect to accuracy. Simultaneously, diverse forms of grey wolf optimization (GWO) models are available in Sánchez et al. and Rodríguez et al.11–13 Although various FCP methods are used, the function of accessible FCP methods is yet to be increased.14,15 Additionally, these studies deal with the constraints of the GWO approach by applying the tumbling effect impact. Although several methods have been available, there is still a need to reduce the computation complexity using FS process and also reach optimal classifier results.
Paper contributions
This article introduces a new FCP for enterprises using an optimal FS-based classification model. The proposed FCP method involves data acquisition, preprocessing, FS, and classification. First, the financial data of the enterprises are gathered utilizing internet of things (IoT) devices, such as smartphones and laptops. Afterward, pigeon-inspired optimization (PIO)-based FS technique is executed for choosing an optimal set of features. Subsequently, the extreme gradient boosting (XGB)-based classification optimized by Jaya optimization (JO) algorithm called JO-XGB is utilized for categorizing the financial data. XGB is used for classification owing to its simplicity and offers high performance and accuracy compared with other algorithms. An extensive set of simulations are carried out to ensure the performance of the presented PIO-JO-XGBoost model, and the results are validated under distinct aspects.
The Proposed PIO-JO-XGBoost Model
Figure 1 shows the working process of the presented PIO-JO-XGBoost model. It comprises several processes such as data acquisition, preprocessing, feature extraction, and classification. The financial data about the enterprises are gathered using IoT devices. Then, the financial data get preprocessed to perform noise removal and class labeling. Followed by, PIO-based FS model is applied to select an optimal set of features. At last, JO-XGB model is applied to categorize the financial data into a set of different class labels.
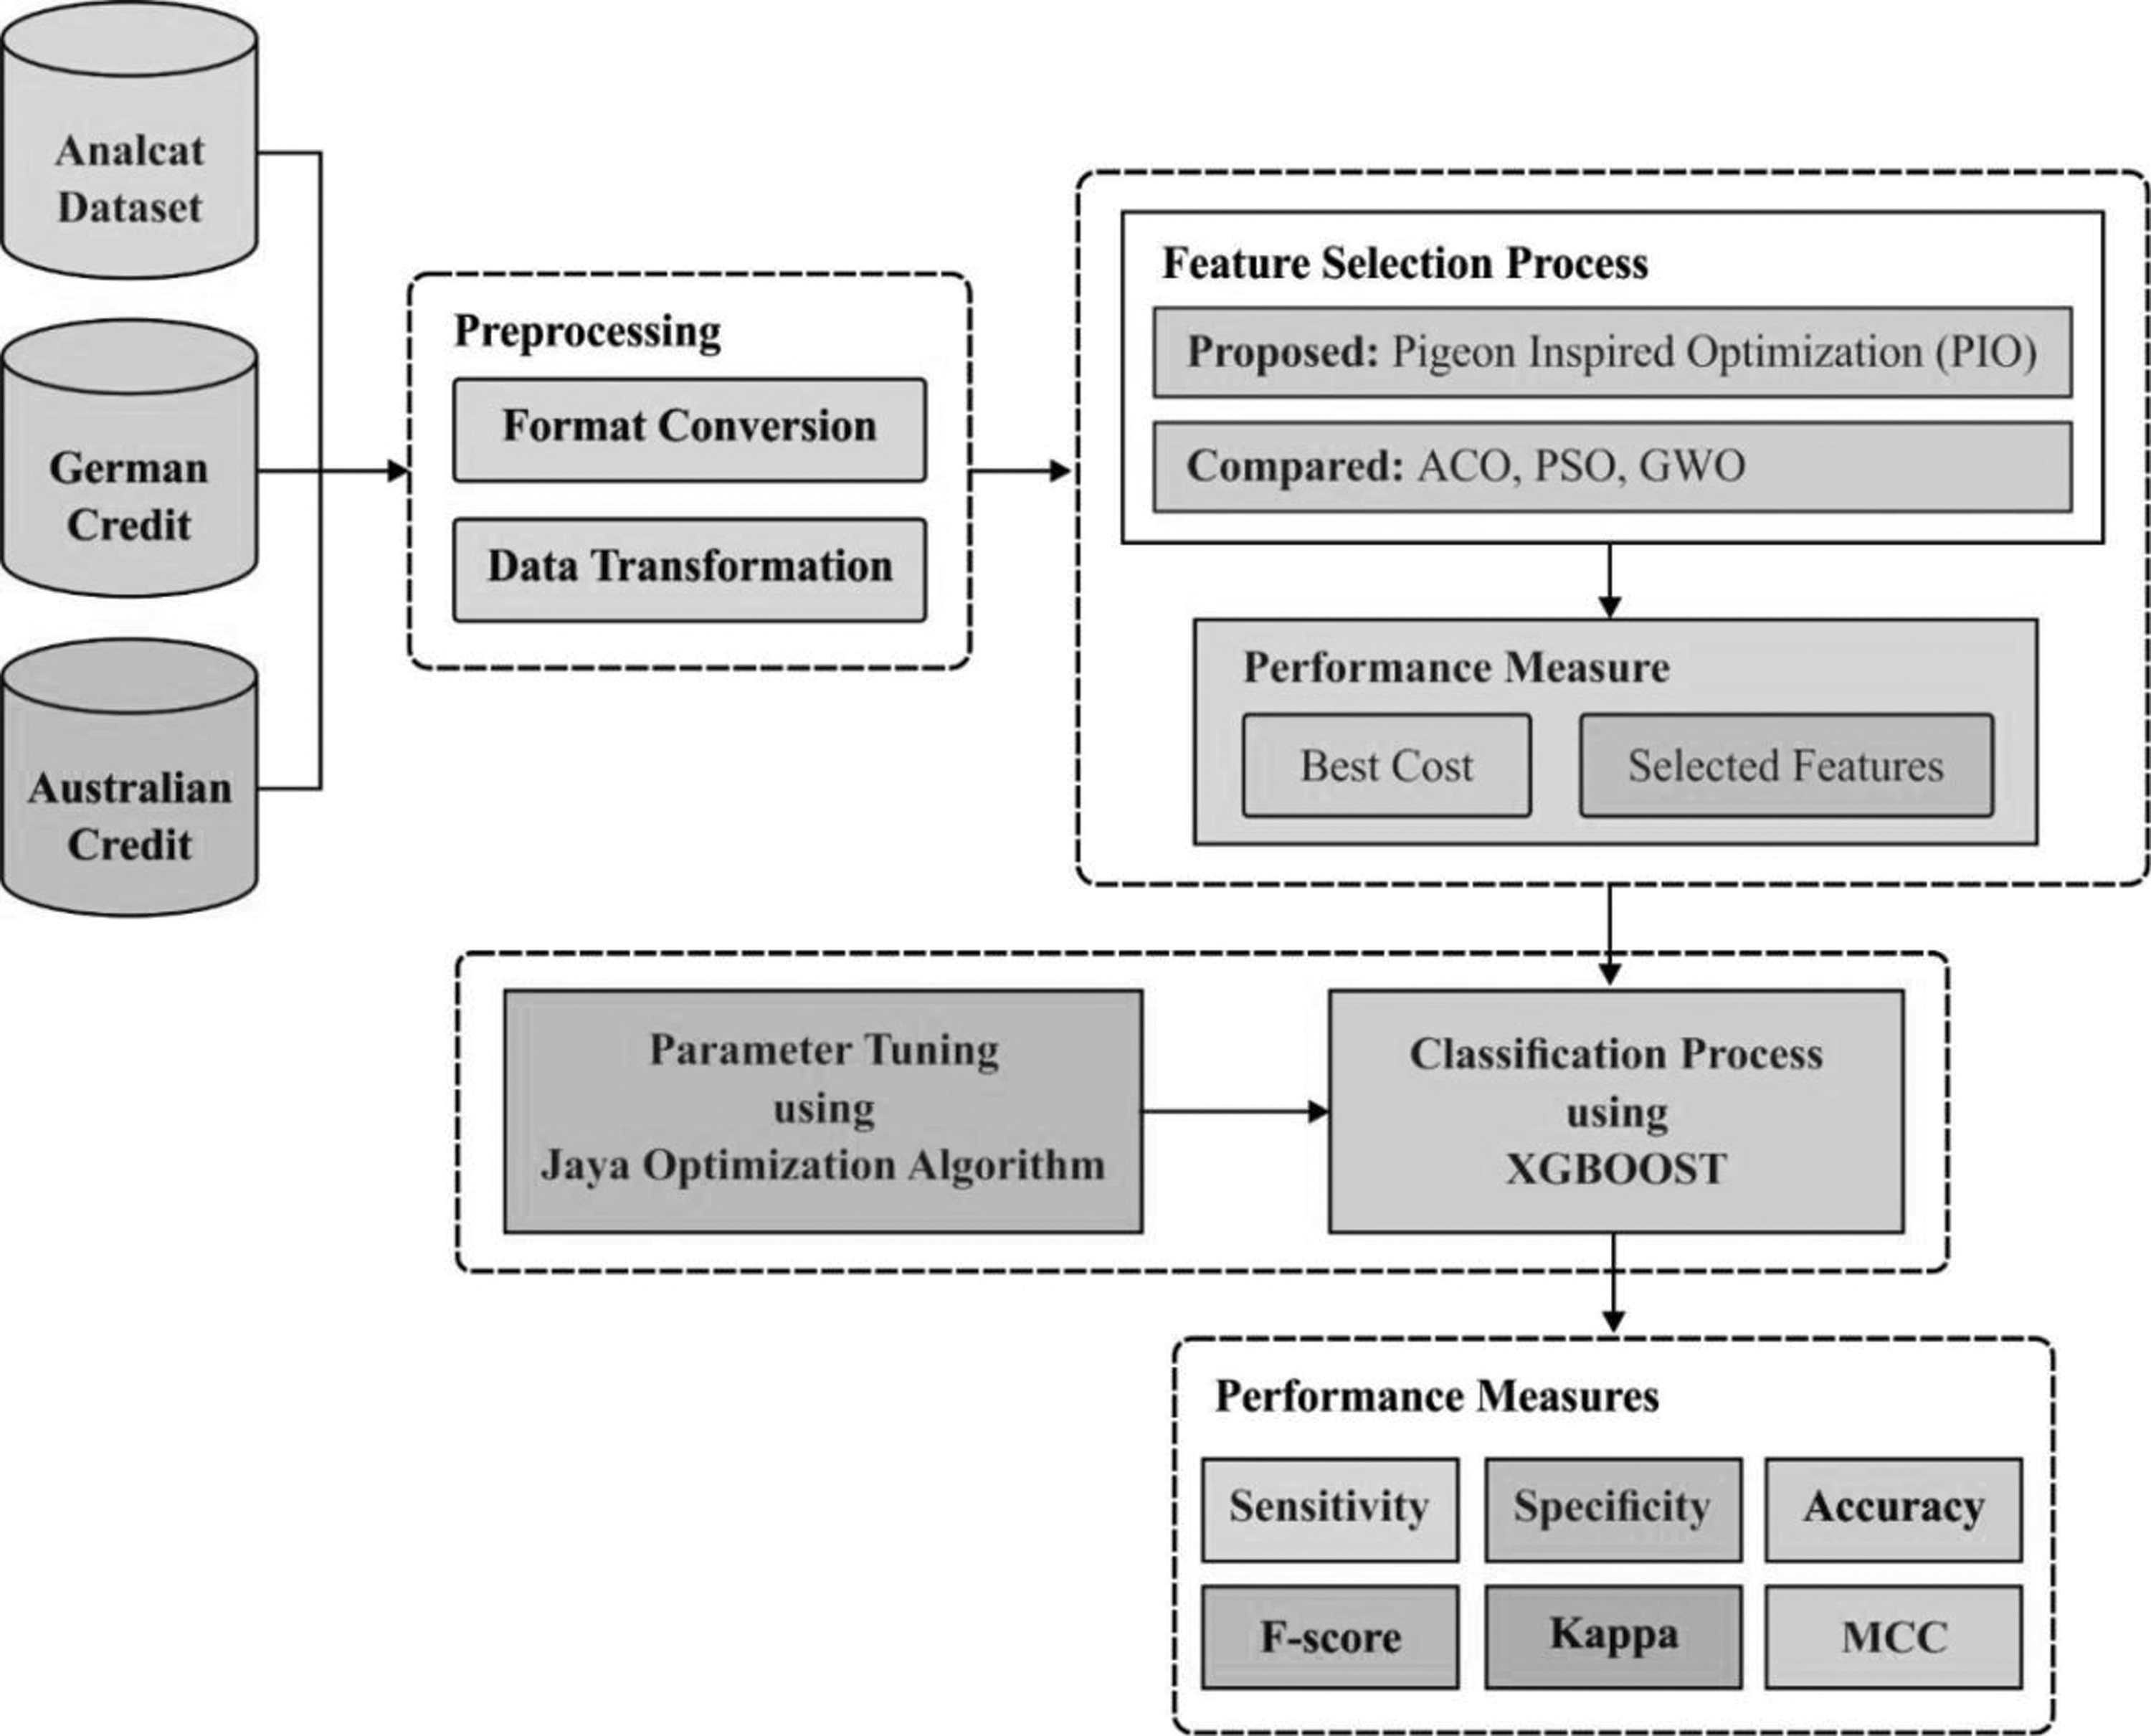
Block diagram of the PIO-JO-XGBoost model. JO, Jaya optimization; PIO, pigeon-inspired optimization; XGB, extreme gradient boosting.
PIO-based FS model
PIO is a recently developed bioinspired algorithm, widely used to solve the optimization problem. It is based on the social organism of the swarm by the use of the base of learning. It tried improvising the solution quality mathematically depending on the natural behavior of the swarm for adapting with the position and velocity of every individual. 16 Pigeons are a familiar type of bird, which has the capability of flying into longer distances for searching food. Besides, the pigeons hold interesting homing natures, which have been commonly employed during the World War for carrying information.
Figure 2 illustrates the flowchart of PIO algorithm. The homing nature of pigeons comes under two major operators, namely map and compass and landmark operators. The pigeon homing skills explained that the pigeon capabilities to direct its homeland come from minute magnetic particles positioned in its peak, which transmit the signals to the brain via the trigeminal nerve. They utilized the magneto reception to sense the magnetic field of the earth; also that pigeons could perceive the sun's altitude as a compass to alter their way. The PIO approach is a type of metaheuristic algorithm based on the pigeon's hierarchy. It needs personal as well as global optimization along with local optimal data particles. PIO is developed using two operators based on pigeon's nature in discovering the target. It comprises map and compass operator and landmark operator, using local and global best position, and it reached optimal performance measures.
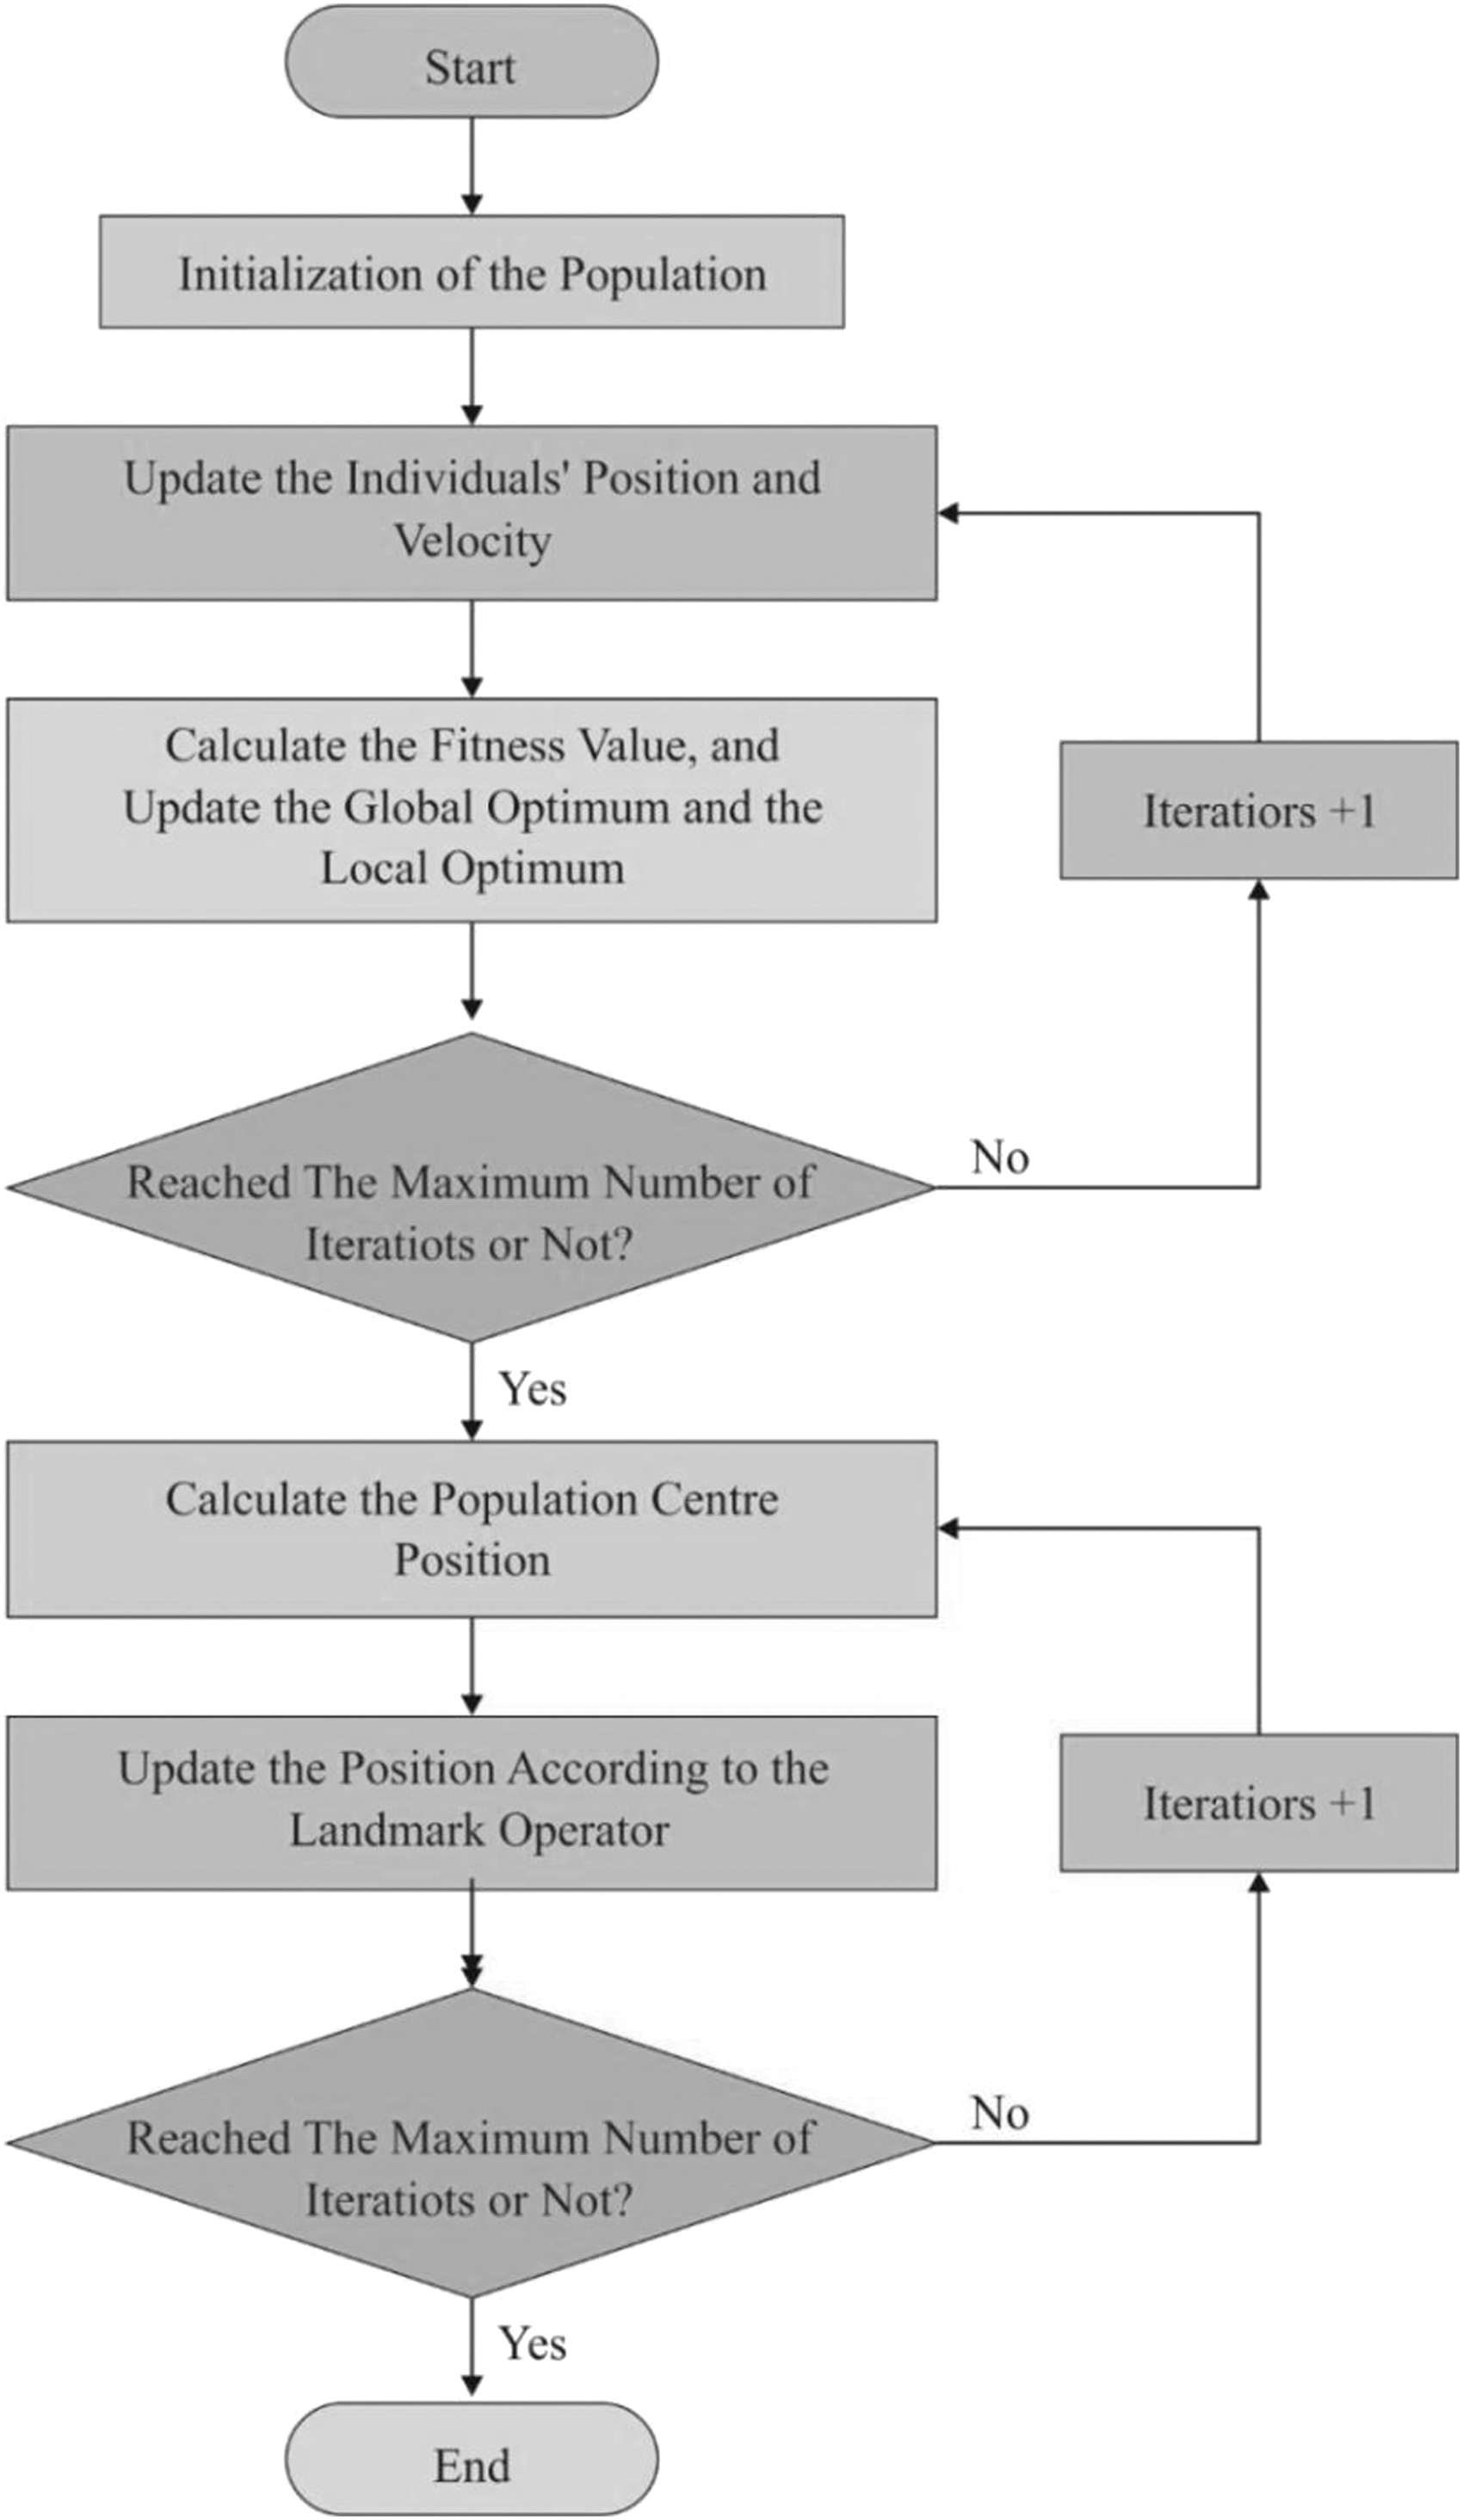
Flowchart of the PIO algorithm.
Map and compass operator
Here, the rules are described with the location Xi as well as velocity Vi of pigeon i, and position and velocity in D-dimension search space were maximized for all iterations. A novel position and velocity of pigeon i at t-th iteration are determined using the given functions:
where R defines the map and compass factor, rand represents an arbitrary value from 0 to 1, and Xg shows the recent global best position, that is attained under the comparison of all locations.
Landmark operator
In this metric, the partial count of pigeons is reduced in all generations. To accomplish the destination immediately, remaining pigeons fly to the target place. Assume the Xc as a middle location of pigeons, a position updating rule of pigeon i at t-th iteration is expressed as:
where Np signifies the count of pigeons, whereas fitness is a cost function of a pigeon. To reduced optimization, the destination function is selected in the minimum rate.
Optimal FS process
The fitness function (FF) objective is a terminology used for estimating the solutions. The FF estimates the solution that is a subset of decided features by means of true positive rate (TPR), false positive rate (FPR), and count of features. The count of features is composed of FF, and there are features available without affecting TPR or FPR. In such cases, it is required to eliminate those features. Equation (6) projects the function applied for estimating fitness of pigeon or solution:
where SF defines the count of chosen features, and NF implies the overall features and
Traditionally, the velocity of a pigeon, followed by sigmoidal function, was employed for transferring velocity as a binary version by using Equation (7) as projected by Alazzam et al.
17
For the purpose of binarized Swarm Intelligent (SI) model, pigeon place would be upgraded based on sigmoid function value and the possibility of arbitrary uniform value from
where
JO-XGB-based classification model
Once the optimal set of features were derived by the PIO-FS algorithm, they are fed as input to the JO-XGB classifier. The JO algorithm helps to tune the parameters of XGBoost proficiently, which has resulted in increased classification performance.
XGBoost model
An XGBoost technique defines the XGB that shows its high-tech benefits in the data classification process. It has the benefits of maximum accuracy of usual boosting techniques; however, it manages sparse data effectively and applies distributed and parallel computation. 18 To obtain the destination variable, the XGBoost technique boosts up a sequence of DTs and allocates all leaf nodes a quantized weight.
Provided a

where Xi is one of the instances
where gi and hi are the first- and second-order gradient statistics on the loss function, and
The split candidates
where
where l signifies the indicator function that is connected with squared-influence, vt is the splitting variable connected by node t, and
where
Overview of the JO algorithm
The word “Jaya” implies achievement and so in context, Jaya Optimization Algorithm (JOA) forever hunts to the success that is for extracting an optimal result from the accessible ones. An important prominent feature of the JOA is that it carries out the revealed optimization process by utilizing general control parameters only and is not dependent on particular parameters. The unique capabilities of JOA make sure diminished calculation time, quicker convergence characteristics, and minimum employment difficulty than other conventional optimization techniques. It can be noticeable, to some offline optimization technique; the quality of the solution is provided primary significance as related to the convergence rate. Figure 3 shows the flowchart of the JO method.

Flowchart of the JO algorithm.
To mathematically illustrate the optimized procedure of the JOA, subsequent notations are utilized. C signifies the decision number, and
In Equation (18),
Parameter optimization of XGBoost using the JO algorithm
In the proposed method, XGBoost is optimized by the JO algorithm to forecast the financial status of the enterprises. An important characteristic of XGBoost technique is that it is needed to optimize the following parameters, such as “max_depth,” “eta,” “min_child_weight,” “subsample,” “alpha,” and “lambda.” A “max_depth” is the max depth of the tree. The “eta” is the rate of learning that is utilized for controlling the weight for improving the robustness of the method.
19
A “min_child_weight” is the amount of minimal instance weights. The “subsample” is the proportion of arbitrary sampling. “alpha” is
Experimental Validation
To validate the experimental results of the PIO-JO-XGBoost model, a series of experiments were taken on Python environment using three benchmark financial data sets, namely Analcatdata, German Credit, and Australian Credit data sets.20–22 The first data set includes a set of 50 samples, 5 features, and 2 class labels. Next, the second data set comprises a total of 1000 samples, 24 features, and 2 class labels. At last, the third data set involves around 690 samples, 14 features, and 2 class labels. For experimentation, 10-fold cross-validation technique is employed.
Analysis of FS results
Table 1 showcases the list of features chosen by the PIO-FS algorithm on the applied three data sets. The PIO-FS algorithm has chosen a set of 3 features of the 5 features from Analcatdata data set, 12 features of the 24 features from German Credit data set, and 9 features from Australian Credit data set.
Selected features of pigeon-inspired optimization feature selection algorithm on applied data set
Figures 4–6 show the best cost analysis of the PIO-FS model with existing FS algorithms on the applied three data sets. The figures portrayed that the particle swarm optimization (PSO)-FS algorithm appeared as an insignificant classifier, which has resulted to a worst best cost compared with other methods. Followed by, the GWO-FS algorithm has depicted slightly better FS results over the PSO algorithm but failed to outperform the ACO-FS and PIO-FS algorithms. At the same time, the ACO-FS technique has tried to show near-optimal FS results. At last, the PIO-FS algorithm has demonstrated superior outcome over the compared methods and resulted to the optimal least best cost under all the applied data sets.
Best cost analysis of the PIO-FS model on Analcatdata data set. FS, feature selection.

Best cost analysis of the PIO-FS model on German Credit data set.
Best cost analysis of the PIO-FS model on Australian Credit data set.
Analysis of the PIO-JO-XGBoost model on Analcatdata data set
An analysis of comparative classifier results of PIO-JO-XGBoost model on the applied Analcatdata data set in terms of sensitivity, specificity, and accuracy is shown in Figure 7. 8 It is noticeable that the existing AdaBoost model appeared as an ineffective FCP model, which has attained a sensitivity of 65%, specificity of 67%, and accuracy of 65.83%. Simultaneously, it is observed that the SVM model has accomplished somewhat optimal predictive results with the sensitivity of 76%, specificity of 79%, and accuracy of 77.43%. On continuing with, the multilayer perceptron (MLP) model has managed to demonstrate moderate results with the sensitivity of 78%, specificity of 80%, and accuracy of 78%. Followed by, the ACO algorithm has showcased somewhat manageable predictive outcome over the earlier techniques with the sensitivity of 88%, specificity of 100%, and accuracy of 94%. Simultaneously, the XGBoost model has achieved superior results to other classifiers except the PIO-JO-XGBoost and JO-XGBoost models with the sensitivity of 89.98%, specificity of 95.78%, and accuracy of 95.21%. Additionally, the JO-XGBoost model has resulted to a competitive classifier outcome with the sensitivity of 90.14%, specificity of 100%, and accuracy of 96.49%. But the proposed PIO-JO-XGBoost model has showcased better predictive outcome with the sensitivity of 93.33%, specificity of 100%, and accuracy of 97.38%.
Comparative analysis of the PIO-FS model on Analcatdata data set-I.
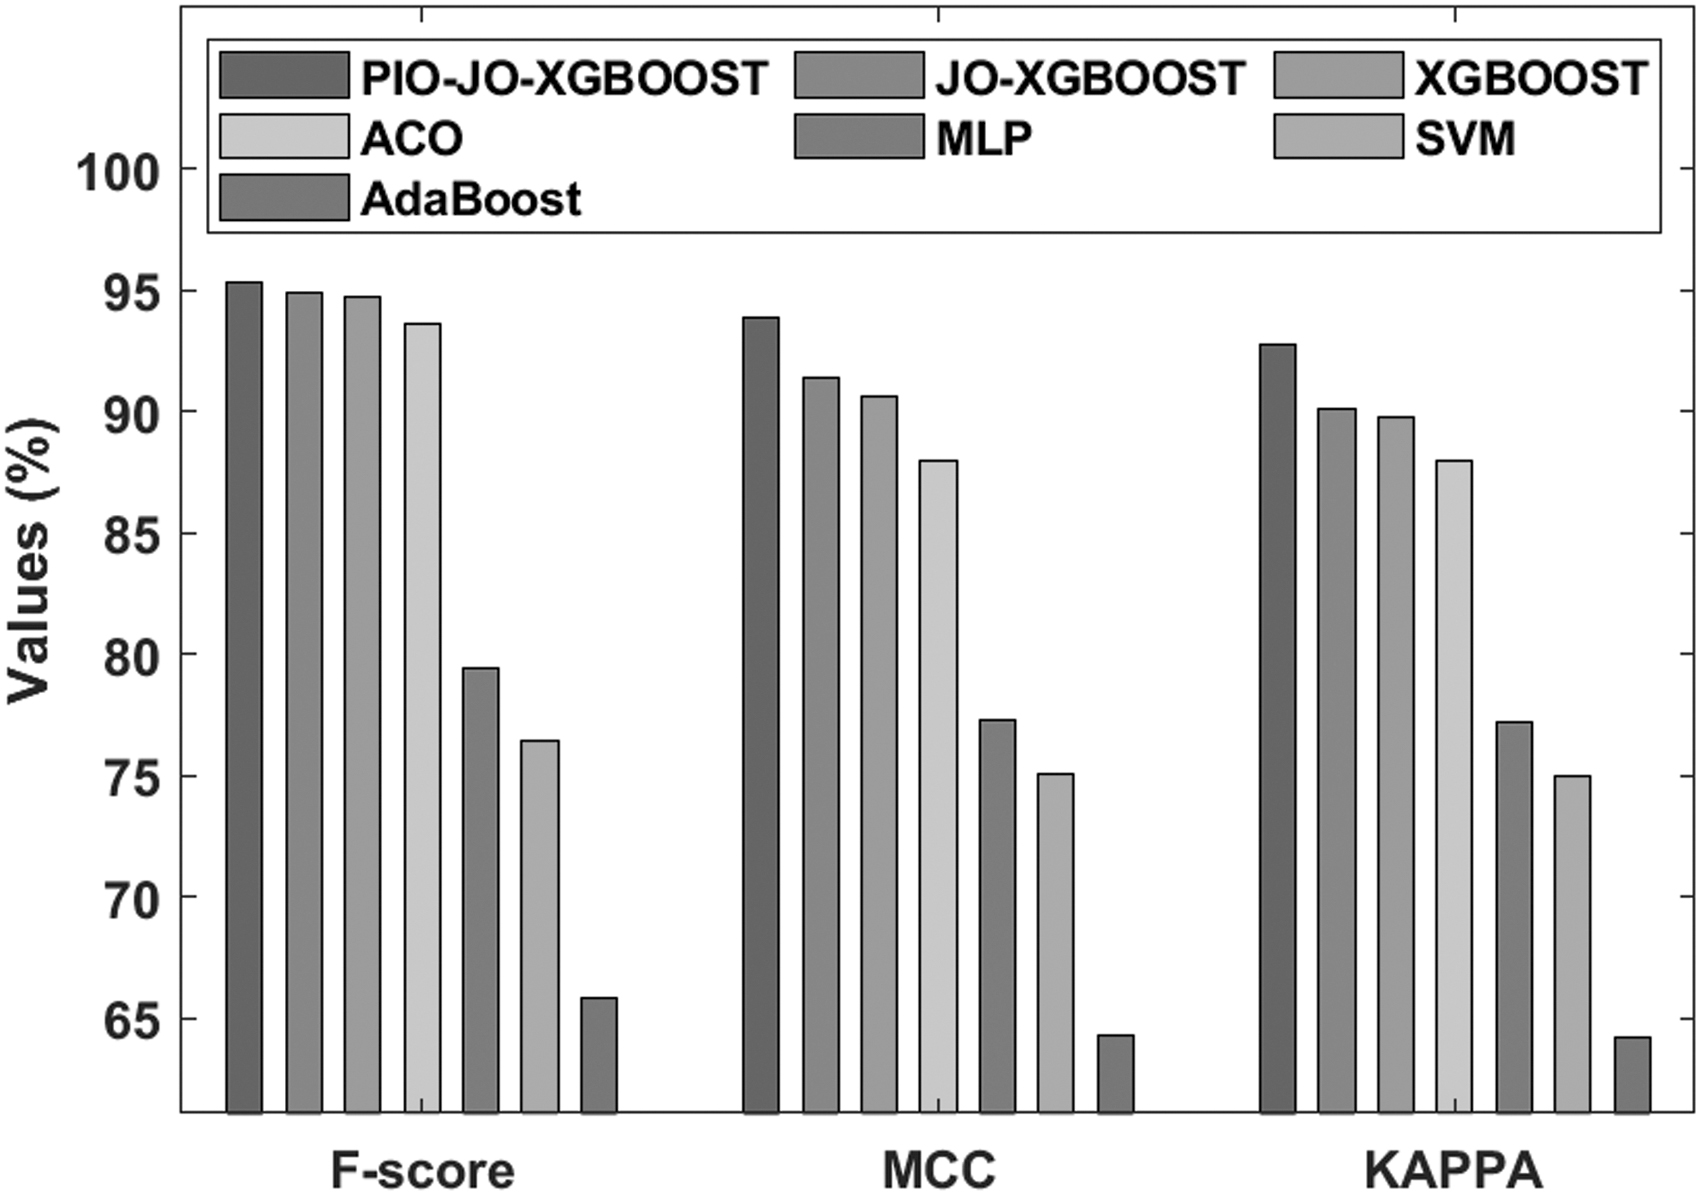
A comparative study of the classification performance of the PIO-JO-XGBoost model on the applied Analcatdata data set with respect to F-score, Mathew correlation coefficient (MCC), and kappa is depicted in Figure 8. It is obvious that the AdaBoost model is seemed to be a worse FCP model, which has reached to an F-score of 65.82%, MCC of 64.31%, and kappa of 64.24%. Concurrently, it is provided that the SVM model has provided slightly improved predictive outcome, with the F-score of 76.41%, MCC of 75.12%, and kappa of 75.02%. Besides, the MLP model has achieved to reveal moderate results, with the F-score of 79.45%, MCC of 77.33%, and kappa of 77.21%. Followed by, the ACO algorithm has reported manageable predictive outcome over the earlier techniques, with the F-score of 93.61%, MCC of 88%, and kappa of 88%. Simultaneously, the XGBoost model has revealed higher results to other classifiers except the PIO-JO-XGBoost and JO-XGBoost models, with the F-score of 94.74%, MCC of 90.65%, and kappa of 89.78%. Furthermore, the JO-XGBoost model has resulted to a competitive classifier outcome, with the F-score of 94.90%, MCC of 91.43%, and kappa of 90.13%. But the proposed PIO-JO-XGBoost model has depicted optimal results, with the F-score of 95.29%, MCC of 93.87%, and kappa of 92.76%.
Comparative analysis of the PIO-FS model on Analcatdata data set-II.
Analysis of the PIO-JO-XGBoost model on German Credit data set
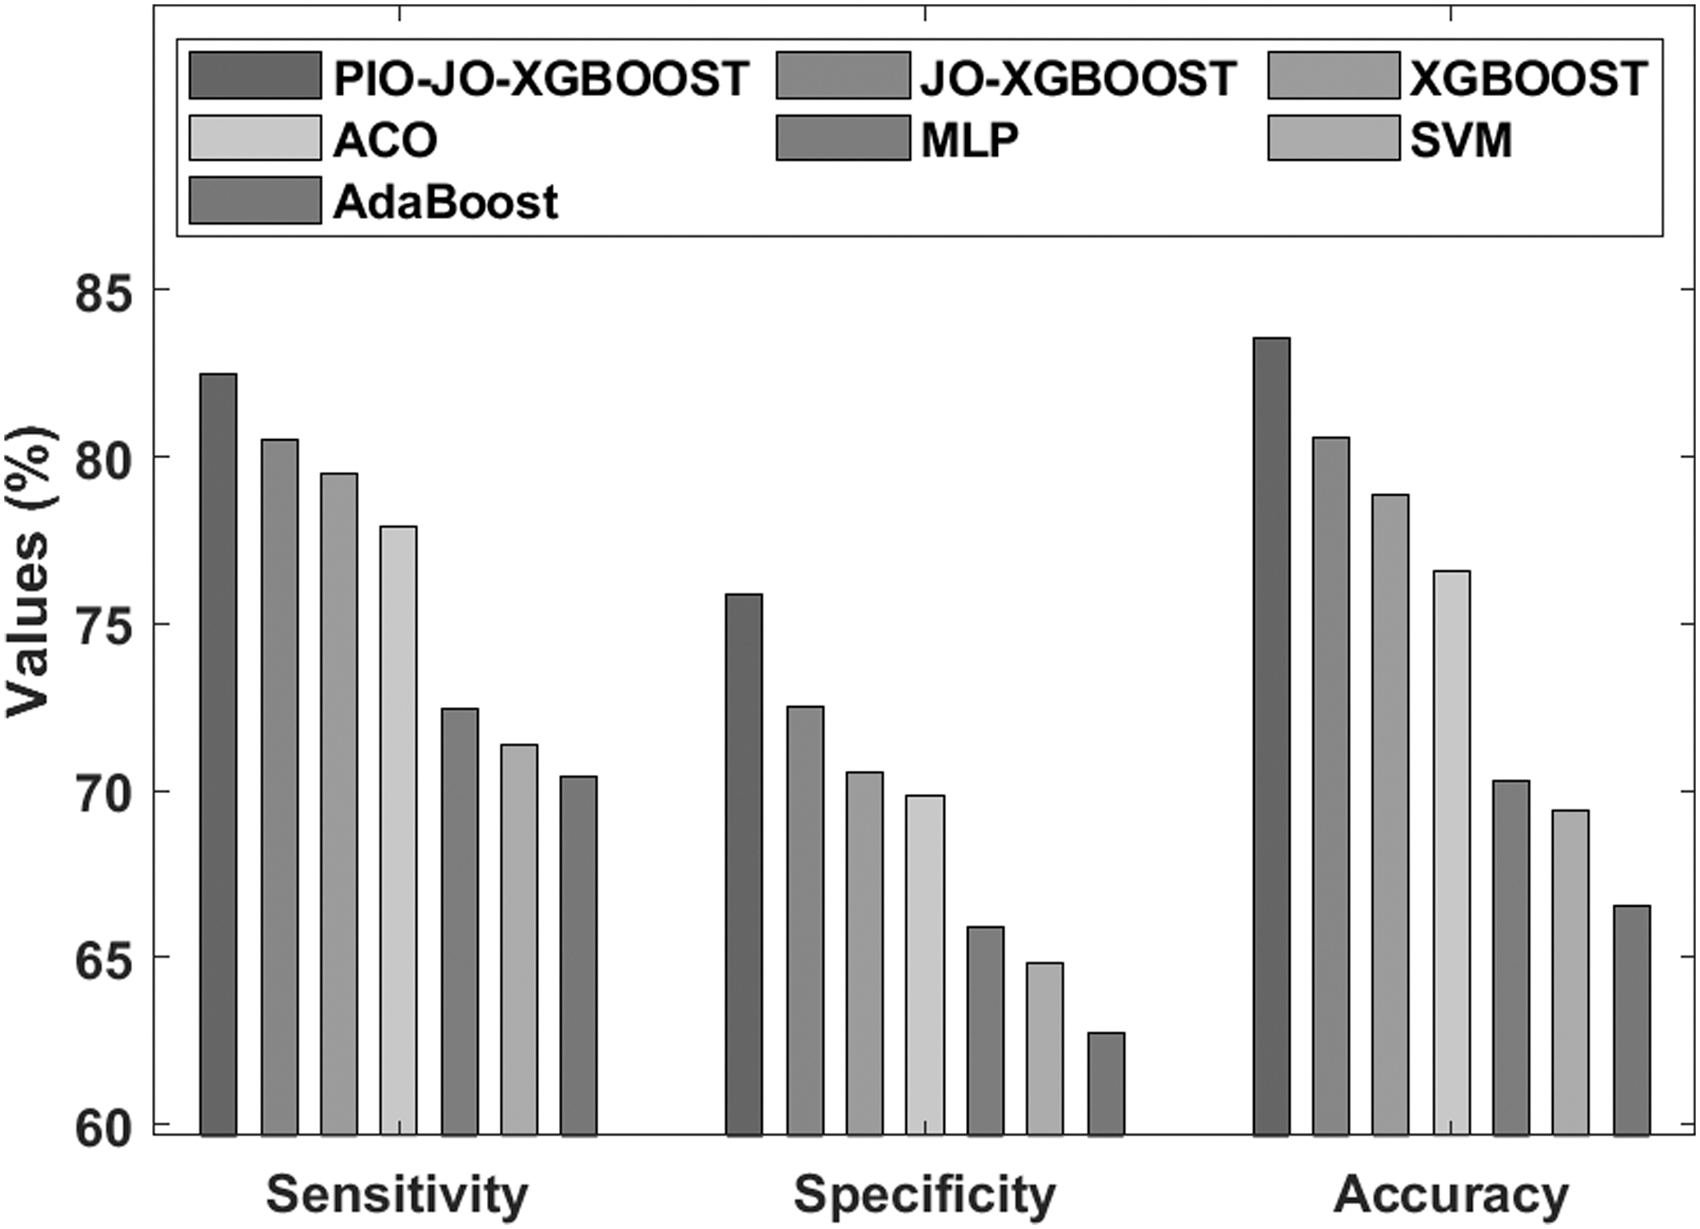
Figure 9 shows the analysis of the results by the PIO-JO-XGBoost model on the applied German Credit data set in terms of sensitivity, specificity, and accuracy. It is clear that the AdaBoost model has offered an unproductive FCP model, which has accomplished a sensitivity of 70.45%, specificity of 62.74%, and accuracy of 66.54%. Instantaneously, it is practical that the SVM model has realized rather improved classification outcome, with the sensitivity of 71.38%, specificity of 64.83%, and accuracy of 69.42%. In line with, the MLP model has succeeded to establish moderate performance, with the sensitivity of 72.44%, specificity of 65.93%, and accuracy of 70.31%. After that, the ACO algorithm has portrayed slightly practicable predictive outcome over the earlier techniques, with the sensitivity of 77.93%, specificity of 69.87%, and accuracy of 76.60%. However, the XGBoost model has led to effective outcome except the PIO-JO-XGBoost and JO-XGBoost models, with the sensitivity of 79.53%, specificity of 70.54%, and accuracy of 78.90%. Likewise, the JO-XGBoost model has taken competitive classifier consequence, with the sensitivity of 80.49%, specificity of 72.49%, and accuracy of 80.56%. But the proposed PIO-JO-XGBoost model has offered outstanding optimal predictive outcome, with the sensitivity of 82.47%, specificity of 75.87%, and accuracy of 83.54%.
Comparative analysis of the PIO-FS model on German Credit data set-I.
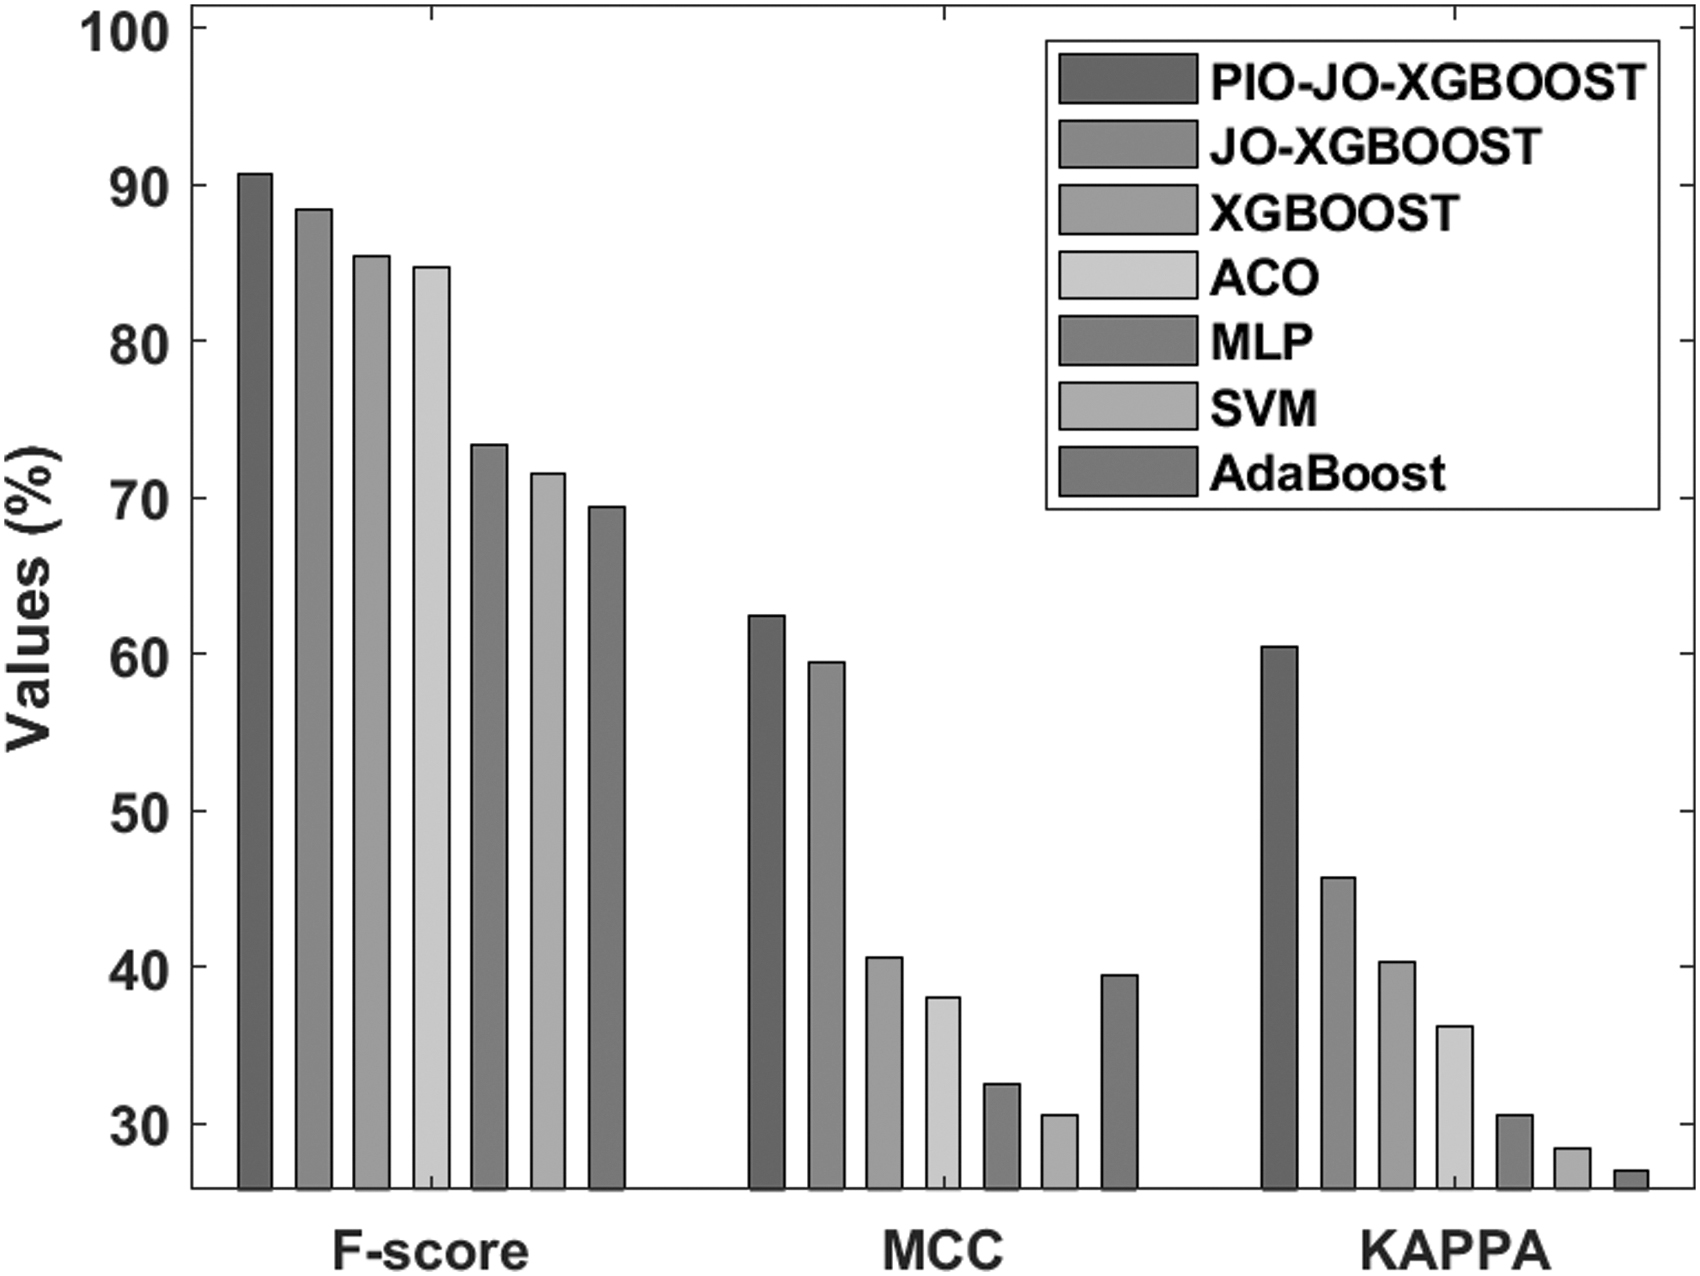
A comparative classifier outcome of the PIO-JO-XGBoost model on the applied German Credit data set in terms of F-score, MCC, and kappa is shown in Figure 10. It is perceptible that the present AdaBoost model appeared as an ineffective FCP model, which has obtained an F-score of 69.42%, MCC of 39.51%, and kappa of 26.98%. Concurrently, it is noted that the SVM model has attained rather better predictive outcomes, with the F-score of 71.46%, MCC of 30.56%, and kappa of 28.40%. Besides, the MLP model has reported moderate outcomes with the F-score of 73.40%, MCC of 32.49%, and kappa of 30.54%. Followed by, the ACO algorithm has revealed controllable predictive outcome over the earlier techniques, with the F-score of 84.74%, MCC of 38%, and kappa of 36.13%. Simultaneously, the XGBoost model has attained acceptable outcome over other classifiers except the PIO-JO-XGBoost and JO-XGBoost models, with the F-score of 85.39%, MCC of 40.57%, and kappa of 40.32%. Moreover, the JO-XGBoost model has resulted to a competitive classifier outcome, with the F-score of 88.40%, MCC of 59.42%, and kappa of 45.67%. However, the proposed PIO-JO-XGBoost model has outperformed the other methods, with the F-score of 90.65%, MCC of 62.45%, and kappa of 60.44%.
Comparative analysis of the PIO-FS model on German Credit data set-II.
Analysis of the PIO-JO-XGBoost model on Australian Credit data set
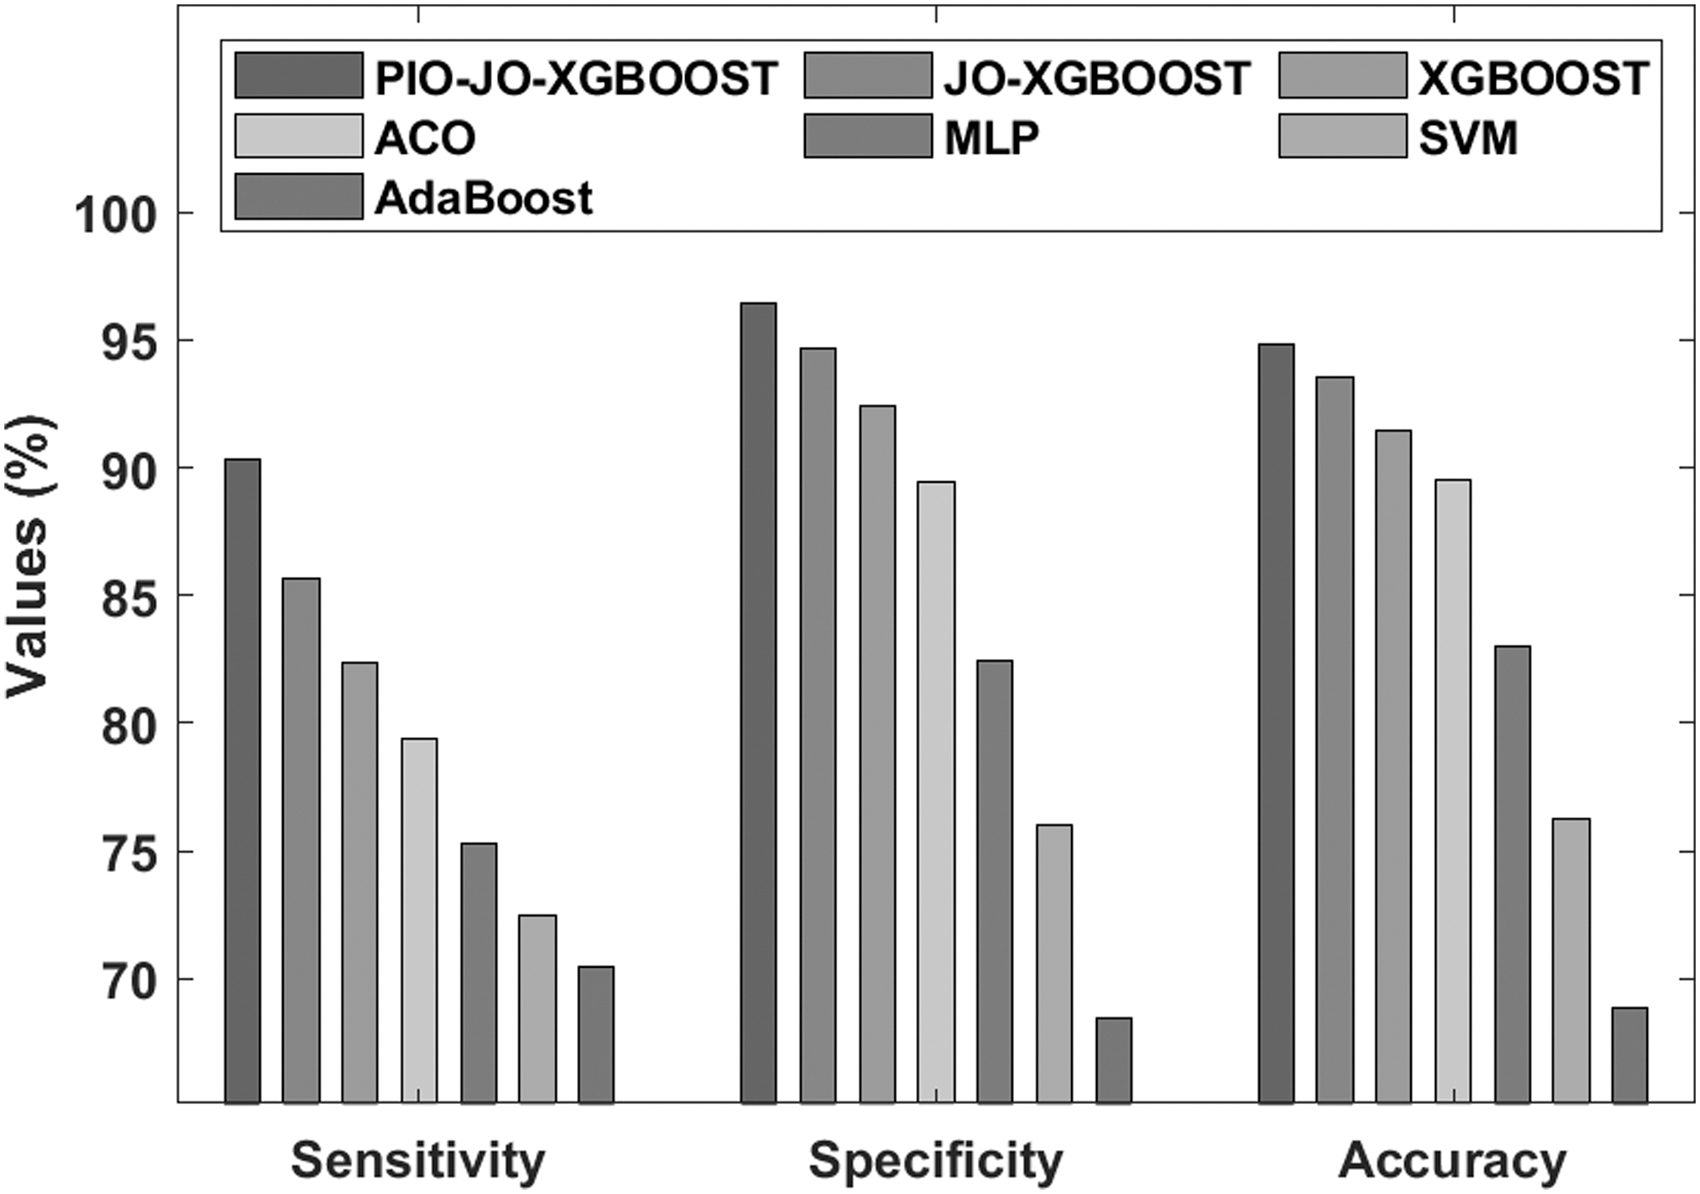
A comparative results analysis of the PIO-JO-XGBoost model on the applied Australian Credit data set in terms of sensitivity, specificity, and accuracy is shown in Figure 11. It is shown that the existing AdaBoost model is a poor FCP model, which has resulted to a lower sensitivity of 70.44%, specificity of 68.47%, and accuracy of 68.90%. At the same time, the SVM model offered slightly higher predictive outcome, with the sensitivity of 72.48%, specificity of 76%, and accuracy of 76.28%. Along with that, the MLP model has managed to demonstrate moderate results, with the sensitivity of 75.33%, specificity of 82.47%, and accuracy of 83.04%. In line with, the ACO algorithm has portrayed fairly controllable predictive outcome over the earlier techniques, with the sensitivity of 79.41%, specificity of 89.42%, and accuracy of 89.49%. In addition, the XGBoost model has achieved superior results to other classifiers except the PIO-JO-XGBoost and JO-XGBoost models, with the sensitivity of 82.33%, specificity of 92.41%, and accuracy of 91.44%. Furthermore, the JO-XGBoost model has resulted to a competitive classifier outcome, with the sensitivity of 85.67%, specificity of 94.65%, and accuracy of 93.56%. However, the proposed PIO-JO-XGBoost model has showcased better predictive outcome, with the sensitivity of 90.31%, specificity of 96.47%, and accuracy of 94.85%.
Comparative analysis of the PIO-FS model on Australian Credit data set-I.
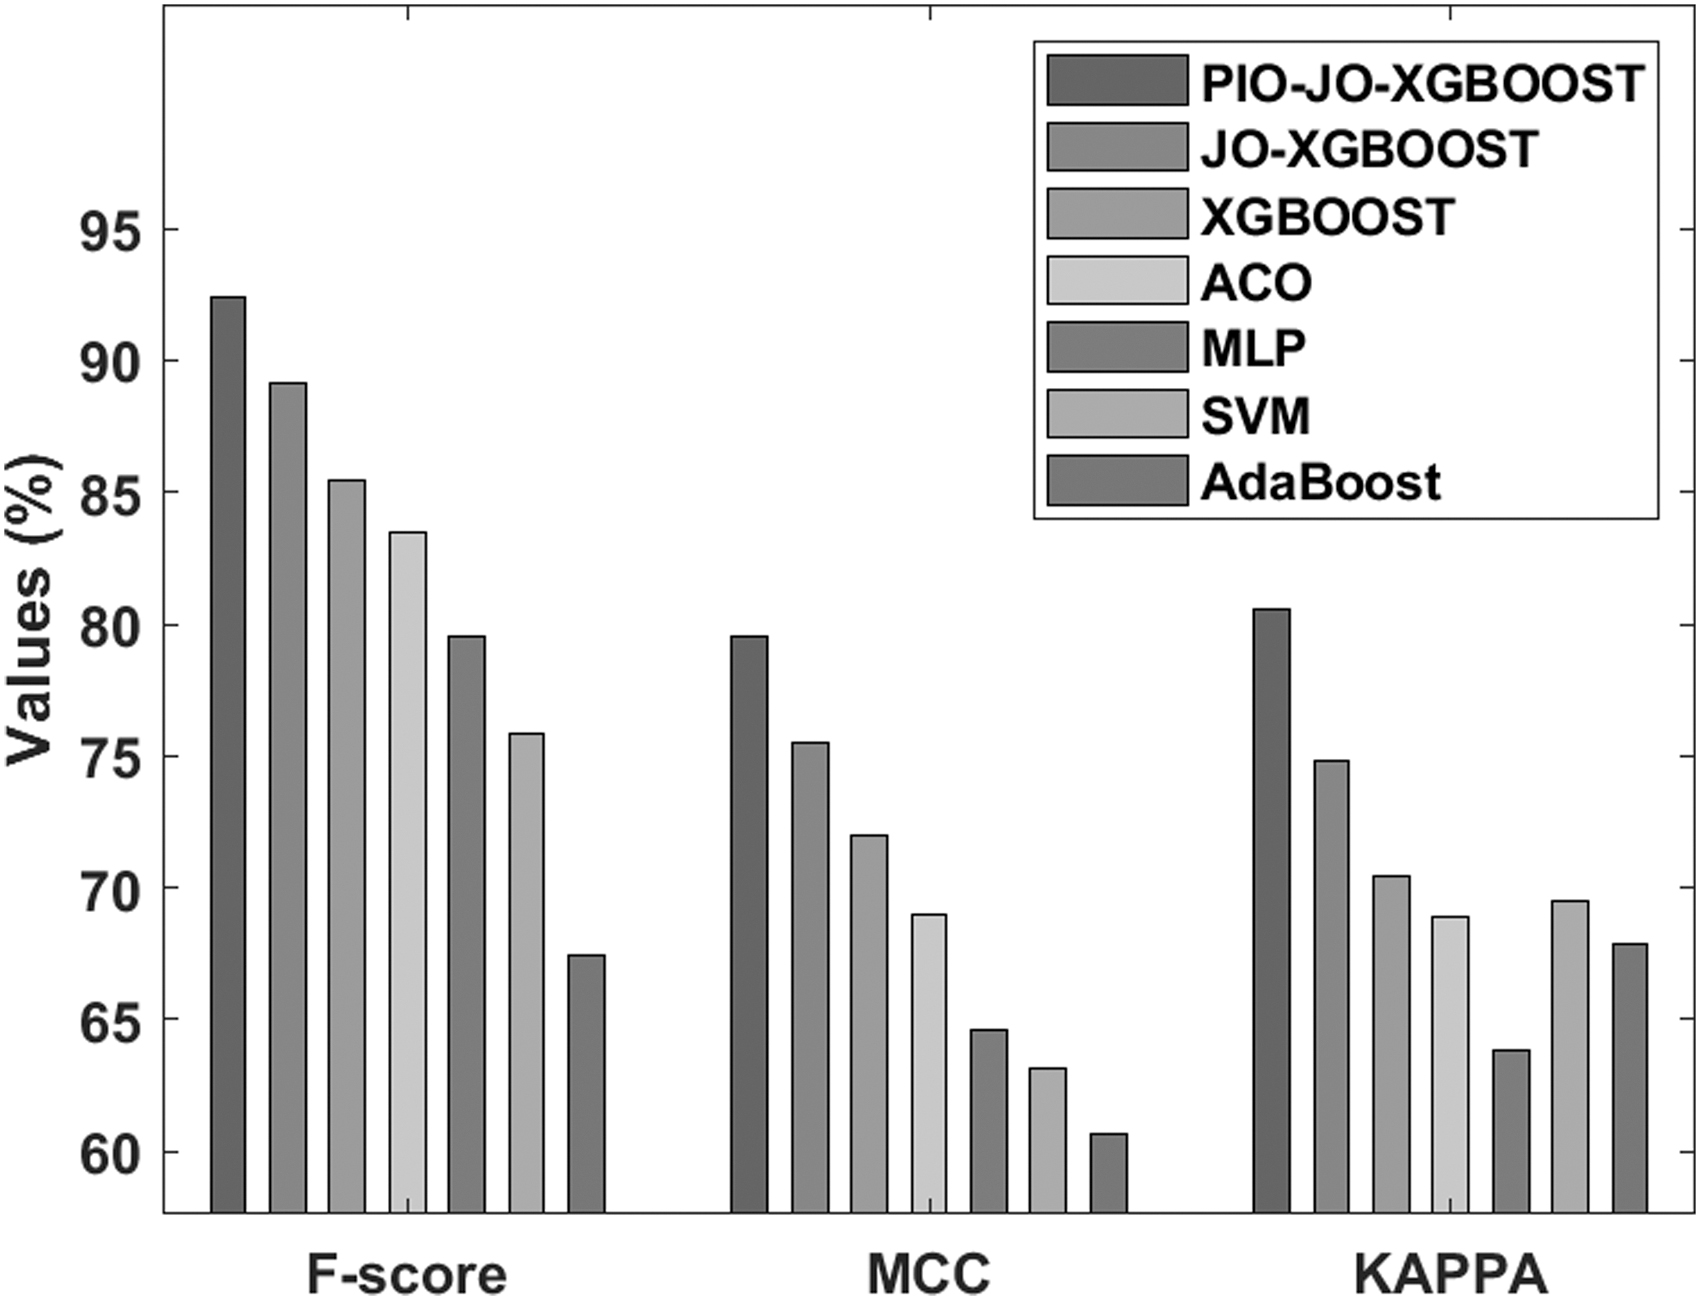
The analysis of the results offered by the PIO-JO-XGBoost model on the applied Australian Credit data set in terms of F-score, MCC, and kappa is illustrated in Figure 12. It is apparent the existing AdaBoost model is a poor FCP model, with the minimum F-score of 67.41%, MCC of 60.66%, and kappa of 67.86%. It is also noted that the SVM model has accomplished somewhat better predictive results, with the F-score of 75.84%, MCC of 63.13%, and kappa of 69.48%. In addition, the MLP model has revealed moderate results, with the F-score of 79.52%, MCC of 64.59%, and kappa of 63.87%. Moreover, the ACO algorithm has reported moderate outcome, with the F-score of 83.46%, MCC of 69%, and kappa of 68.93%. Concurrently, the XGBoost model has realized higher results to other classifiers except the PIO-JO-XGBoost and JO-XGBoost models, with the F-score of 85.46%, MCC of 72%, and kappa of 70.45%. Besides, the JO-XGBoost model leads to a competitive classifier results, with the F-score of 89.09%, MCC of 75.48%, and kappa of 74.80%. However, the proposed PIO-JO-XGBoost model has excelled the other methods, with the F-score of 92.40%, MCC of 79.56%, and kappa of 80.56%.
Comparative analysis of the PIO-FS model on Australian Credit data set-II.
Conclusions
This article has developed a new optimal FS-based classification model for FCP. The financial data about the enterprises are gathered using IoT devices. Then, the financial data get preprocessed to perform noise removal and class labeling. In addition, the PIO-based FS model is applied to select an optimal set of features. Finally, the JO-XGB model is applied to categorize the financial data into a set of different class labels. The utilization of the JO algorithm helps to tune the parameters of the XGB model. A detailed experimental validation process occurs to ensure the performance of the presented PIO-JO-XGBoost model using three benchmark financial data sets, namely Analcatdata, German Credit, and Australian Credit data sets. The obtained classification performance indicated the superior characteristics of the PIO-JO-XGBoost model in FCP of enterprises. In the future, the PIO-JO-XGBoost model can be enhanced by the use of clustering techniques for removing the unwanted data. In addition, advanced deep learning models can also be used in the future.
Authors' Contributions
The article was written through contributions of all authors. All authors have given approval to the final version of the article.
Footnotes
Author Disclosure Statement
The authors declare that they have no conflict of interest.
Funding Information
The authors received no specific funding for this study.